Optical properties of superconducting pressurized LaH10
Abstract
Recently superconductivity has been discovered at around 200 K in a hydrogen sulfide system and around 260 K in a lanthanum hydride system, both under pressures of about 200 GPa. These record-breaking transition temperatures bring within reach the long-term goal of obtaining room temperature superconductivity. We have used first-principle calculations based on density functional theory (DFT) along with Migdal-Eliashberg theory to investigate the electron-phonon mechanism for superconductivity in the phase proposed for the LaH10 superconductor. We show that the very high transition temperature results from a highly optimized electron-phonon interaction that favors coupling to high frequency hydrogen phonons. Various superconducting properties are calculated, such as the energy gap, the isotope effect, the specific heat jump at , the thermodynamic critical field and the temperature-dependent penetration depth. However, our main emphasis is on the finite frequency optical properties, measurement of which may allow for an independent determination of and also a confirmation of the mechanism for superconductivity.
pacs:
61.50.Ks,62.50.+pI Introduction
Neil Ashcroft proposed that hydrogen, upon becoming metallic at sufficiently high density, would transform to a superconductor at a critical transition temperature possibly well above room temperature Ashcroft (1968). This stimulated many scientists to search for superconductivity not only in pure hydrogen but also in hydrogen-rich compounds. The possible formation of metallic hydrogen has been reported at very high pressure by a number of groups Mao and Hemley (1989); Eremets and Troyan (2011); Dias and Silvera (2017); Loubeyre et al. (2020). Moreover, ab-initio crystal structure calculations have predicted high-temperature superconductivity in some hydrogen-rich compounds, some of which have been confirmed experimentally Flores-Livas et al. (2019); Zhang et al. (2017); Oganov et al. (2019); Pickard et al. (2020).
Among a large number of possible hydrogen-rich compounds, several stoichiometries for the H-S system were identified as energetically competitive Li et al. (2016) and experimentalists had been looking for superconductivity by compressing H2S with H2 Strobel et al. (2011). H2S is the only known stable compound in the system at ambient pressure and room temperature and its highest was found to be 80 K at 160 GPa Li et al. (2014). In 2014, Duan et al. Duan et al. (2014) theoretically predicted that H3S was a good candidate for superconductivity in the H-S system, with an expected as high as 191-204 K at 200 GPa. This was followed by a remarkable discovery by Drozdov et al. Drozdov et al. (2015) who observed superconductivity at 203 K in H2S compressed to 155 GPa (now identified as transforming to H3S), which set the record for the highest at the time. This subsequent experimental discovery helped to establish DFT calculations as having predictive power for finding new high temperature superconductors in the pressurized hydrides. Theoretical structure calculations and experimental studies have since adopted several structures for H3S, including the , , and phases Duan et al. (2014, 2015); Errea et al. (2015); Li et al. (2016); Bernstein et al. (2015); Errea et al. (2016); Einaga et al. (2016); Guigue et al. (2017); Goncharov et al. (2016), but the interpretation of X-ray data has favored the phase for the high pressures involved.
The record-breaking discovery of very high in H3S has encouraged further efforts in the search for room temperature superconductivity in pressurized hydride materials. Several superconducting hydride materials have been predicted, including MgH6 with =271 K at 300 GPa Feng et al. (2015), CaH6 with = 235 K at 150 GPa Wang et al. (2012), and YH6 with = 264 K at 120 GPa Li et al. (2015). Interestingly, two independent first-principles structure search studies revealed some stable H-rich clathrate structures to be potential room-temperature superconductors Liu et al. (2017); Peng et al. (2017). In particular, the La-H and Y-H systems were theoretically investigated, and some compounds have been identified as good candidates for room-temperature superconductivity. From, the Y-H system, the structures YH4, YH6, and YH10 were proposed Li et al. (2015); Liu et al. (2017); Peng et al. (2017). While from the La-H system several stable compounds were identified: LaH3, LaH4, LaH5, LaH8, and LaH10. Most notably, YH10 and LaH10 were considered the most likely structures to exhibit possible room-temperature superconductivity, where the 303 K at 400 GPa Peng et al. (2017) for YH10 and 274-286 K at 210 GPa for the phase proposed for the LaH10. As a result, the La-H system became of interest, with studies proposing LaH10 to be thermodynamically stable above 150 GPa. Indeed, the lanthanum compound was synthesized Geballe et al. (2018) and two groups have reported near-to-room-temperature superconductivity with 260 K at 190 GPa Somayazulu et al. (2019) and 250 K at about 170 GPa Drozdov et al. (2019). This is the highest that has been reported to date. Various structures and compositions have been suggested for the superconducting La-H system including for LaH16 Kruglov et al. (2020) and , , for the LaH10 composition. However, recently Errea, et al. Errea et al. (2020) have shown that the Born-Oppenheimer energy surface with classical treatment displays many local minima and by including quantum effects all these phases collapse to a single phase, , which is highly symmetric.
In this work, we report results from first-principles calculations based on DFT and Migdal-Eliashberg theory, to evaluate and other superconducting properties of LaH10. In particular, we focus on studying the most promising candidate structure proposed for LaH10, the phase. We emphasize the finite frequency optical conductivity which is related to reflectance. The latter is a technique accessible to experiment in high pressure cells and has been used with success in H3S Capitani et al. (2017). It can be used to identify important fundamental information about superconductivity such as the binding energy of electrons in the superconducting condensate and the mechanism for binding, which for conventional superconductors is the electron-phonon interaction. Moreover, it has been proposed that it can provide an independent measurement of for the pressurized hydrides Carbotte et al. (2018).
The structure of our paper is as follows. In Sec. II, we begin by calculating the electronic band structure and density of states, illustrating the Fermi surface. This is followed by a calculation of the phonon dispersion curves and the phonon density of states in the harmonic approximation. These are then used further to calculate the electron-phonon interaction shown in Sec. III. Proceeding to the calculation of superconducting properties in Sec. III, we calculate , the functional derivative, the isotope effect, and the important BCS ratios for the energy gap, the specific heat jump at and the thermodynamic critical field. We then proceed to the calculation of the temperature-dependent superfluid density (or inverse square of the penetration depth) followed by the finite frequency optical conductivity and reflectance. To examine the influence of anharmonicity on these properties, we also provide comparison calculations based on an anharmonic spectrum taken from Errea et al. Errea et al. (2020). We provide our final summary in Sec. IV.
II Electronic and Phononic Properties
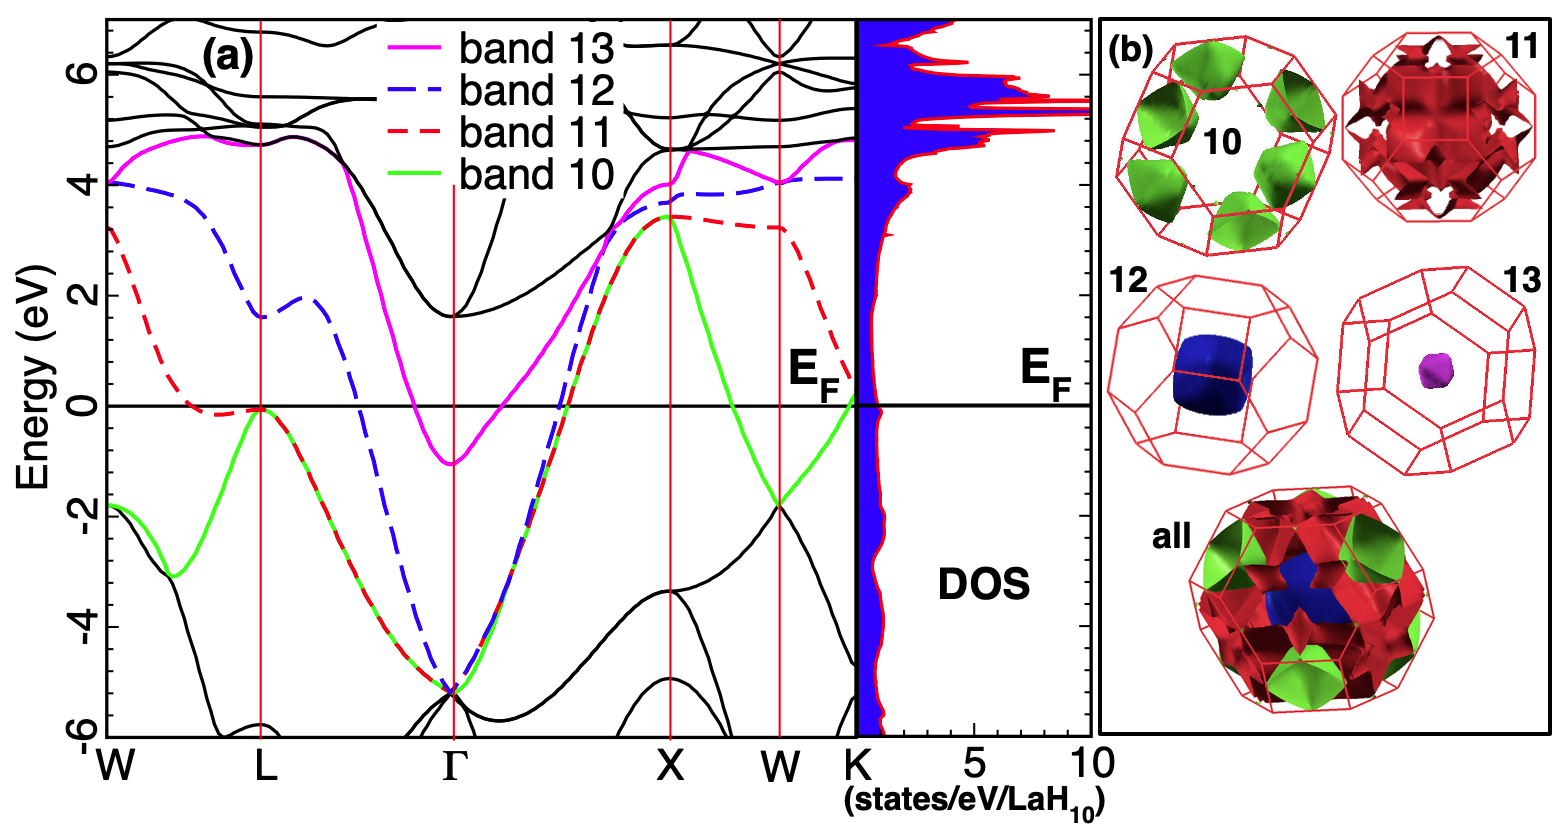
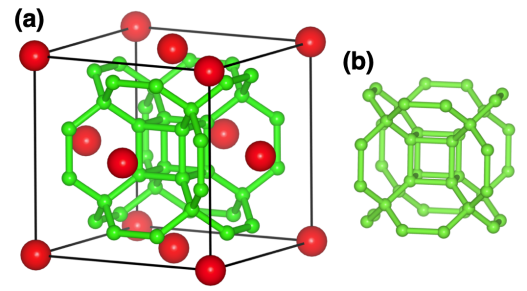
We begin by addressing the electronic and the phononic properties, as well as, the electron-phonon coupling. It has been suggested that the LaH10 phase has a wide pressure range for dynamic stability, down to about 210 GPa for harmonic phonon calculations Liu et al. (2017) and lower for anharmonic quantum calculations Errea et al. (2020), in the range where superconductivity has been observed. Consequently, we have calculated the electronic band structure and density of states for LaH10 at 210 GPa (Fig. 2(a)). Full structural optimization, electronic band structure, density of states, and Fermi surfaces calculations were performed within density-functional theory (DFT) using the ABINIT code Gonze et al. (2009) with 1 and 11-electron Hartwigsen-Goedeker-Hutter pseudopotential Hartwigsen et al. (1998) for H and La, respectively, and the local density approximation (LDA) by Teter Pade parameterization Goedecker et al. (1996). A plane-wave expansion with 50 Ha cut-off and a k-point grid for self-consistent calculations as large . These dense k-point grids are sufficient to ensure convergence for enthalpies to better than 1 meV/atom. The symmetry information of the LaH10 phase and the calculated X-ray diffraction obtained after performing full structural optimization at 210 GPa can be found in Table S1 and Fig. S1 Sup , respectively. The electronic band structure indicates that LaH10 at 210 GPa is a good metal, which is consistent with previous calculations reported at 300 GPa Liu et al. (2017). As was expected, the partial electronic density of states (Fig. S2 Sup ) indicates that the La contribution is greater than H. There are four bands crossing the Fermi level and the Fermi surface is shown in Fig. 2(b) in colors which correspond to each of the four bands. The Fermi surfaces of bands 10, 12, and 13 are quite simple while the Fermi surface of band 11 is quite complicated. Similar pictures are also found in Ref. Wang et al. (2020) which discusses the possibility of multiband superconductivity associated with different Fermi surfaces.
The density of states at the Fermi level, N(), has a large number of states, 11.85 states/Ry, which is larger by factors of 1.18 and 1.58 than fcc LaH10 and H3S reported at 300 GPa Liu et al. (2017) and 200 GPa Bernstein et al. (2015), respectively. This variation with pressure is consistent with the recent finding by Errea et al. Errea et al. (2020) that the density of states at the Fermi level decreases with increasing pressure. A close up view of our calculation of the electronic density of states near the Fermi level (Fig. S3 Sup ) shows a peak in the density of states just below , which likely has its primary origin in the flattening of band 11 near the L point. A large density of states at the Fermi level is favorable for superconductivity.
Now we discuss the phonon characteristics, as they play an important role in electron-phonon mediated superconductivity. We have performed phonon calculations for the phase for LaH10 at 210 GPa, in a pressure region where measurements confirm a very high . The phonon and the electron-phonon coupling (EPC) calculations were performed with density-functional perturbation theory (DFPT) Gonze (1997) and the harmonic approximation as implemented in ABINIT code Gonze et al. (2009) with the same parameters as in the DFT calculations. The dynamical matrices were calculated initially on uniform q-point meshes, from which interatomic force constants are obtained and used to interpolate the phonon dispersions over the entire Brillouin zone. The phonon band structure and density of states for the q-point grid was tested until convergence was achieved. It was found that a grid was required. The EPC implementation in the ABINIT code Gonze et al. (2009) is similar to that implemented by Liu and Quong Liu and Quong (1996) and Savrasov Savrasov and Savrasov (1996).
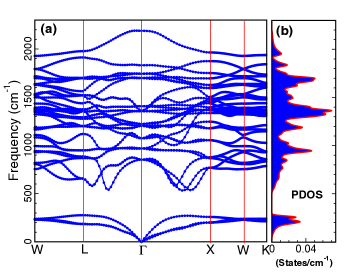
The phonon band structure and density of states for the LaH10- phase is shown in Fig. 3 and they are similar to previous calculations at 300 GPa Liu et al. (2017) where GGA was used. This highlights that both GGA and LDA provide a consistent description of vibrational properties of the LaH10- phase. It is clear from this that the phonon frequencies have a weak dependence on increasing pressure, which indirectly might imply a weak dependence of on pressure Drozdov et al. (2019); Errea et al. (2020). The highest phonon frequency for LaH10 at 210 GPa is at 2190 cm-1 or meV (Fig. S4 Sup ). The very lowest phonon branches result from the heavy mass lanthanum phonon modes and the rest of the dispersion curves at higher frequencies are due to the lighter mass hydrogen. The role of the lanthanum appears to be that of providing conduction electrons and also caging the hydrogen to provide a shorter H bond length than normal. The La-La bond length in the fcc structure underlying LaH10 (Table S1, Figs. S5 and S6 Sup ) is typical of ordinary pure metals at ambient pressure but the shortened distance between the hydrogen is not. Rather, the shortest H-H distance in LaH10 at 210 GPa (Figs. S5 and S7 Sup ) is 1.084 Å, which is more consistent with the prediction of Neil Ashcroft for metallic hydrogen at a pressure near 500 GPa Ashcroft (1968). The shortest La-H distance is 2 Å(Fig. S8 Sup ). As a result, the La cage might be viewed as assisting in shortening the H-H distance so that the 500 GPa needed for pure metallic hydrogen is now only of order 200 GPa for metallic behavior.
Finally, we note that our calculation of the harmonic phonon dispersion curves at 210 GPa does not show any unstable modes. Interestingly, Errea et al. Errea et al. (2020) have reported that unstable modes appear in the harmonic approximation at pressures below 230 GPa and that including anharmonicity is required to stabilize this structure below 230 GPa. We have investigated this matter further. The pressure where the harmonic approximation breaks down may be varied depending on the choice of some DFT parameters, including the type of exchange-correlation and pseudopotential Bianco et al. (2018). We have produced a result with unstable modes when we used harmonic calculation parameters similar to Ref. Errea et al. (2020). To examine the quality of the harmonic electron-phonon spectral function used in this work and the influence of anharmonicity, we have included comparison calculations, where an anharmonic electron-phonon spectrum from Errea et al. Errea et al. (2020) is used as input.
III Superconducting Properties
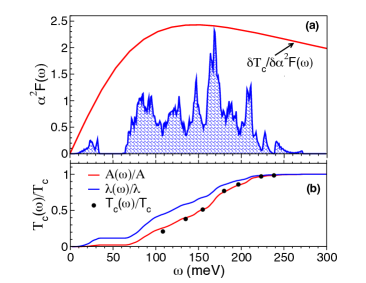
We now continue on to the electron-phonon coupling and emphasize its contribution to superconducting properties. We have used our calculation of the electronic structure and phonon dispersion curves to calculate the electron-phonon spectral function which enters the Migdal-Eliashberg theory of superconductivity and is the pairing “glue” for Cooper pairs in conventional superconductors Carbotte (1990). The is shown in Fig. 4(a) where we see that it looks much like the phonon density of states from Fig. 3(b) but with modified strength as a function of energy due the variation of the electron-phonon coupling vertex.
In the following, this was used in our calculations of superconducting properties which are based on numerical iteration of the nonlinear coupled Migdal-Eliashberg equations for the real-frequency complex gap function and complex renormalization function . Carbotte (1990); Marsiglio and Carbotte (2008); Carbotte et al. (2019) The linearized imaginary-frequency axis equations based on Matsubara frequencies were used to calculate . Then the coupled nonlinear imaginary-axis equations were used to calculate thermodynamic properties for temperatures below Carbotte (1990); Marsiglio and Carbotte (2008). An analytic continuation procedure was then used to evaluate the real frequency gap and renormalization functions from the imaginary axis solutions Marsiglio et al. (1988). The real frequency axis quantities then allowed for the energy gap and other transport properties to be obtained. The finite frequency conductivity was evaluated based on formulas in Ref. Akis et al. (1991); Marsiglio and Carbotte (2008) and the reflectance was calculated following the prescription given in Ref. Capitani et al. (2017). The formalism is lengthy to write down and has been presented in the literature numerous times, consequently, for formulas and further descriptions see Refs. Carbotte (1990); Marsiglio and Carbotte (2008); Carbotte et al. (2019). We will emphasize results and discussion here.
III.1 The critical temperature
We begin by discussing the characteristics of this spectral function and the features which have an impact on increasing the . Using the spectrum in the linearized form of the Migdal-Eliashberg equations on the imaginary frequency axis Carbotte (1990); Carbotte et al. (2019) and iterating these equations, we may obtain for a particular choice of Coulomb pseudopotential parameter or, alternatively, we can fix the value of and iterate for Carbotte (1990). Historically, it has been typical to chose the to give the experimental . Once is fixed, then all other superconducting properties follow with no free parameters. For a typical value of , we match the K that is found for an anharmonic calculation of including quantum corrections at a similar pressure Errea et al. (2020) [designated as the Errea spectrum]. This is also close to the experimental for this pressure. This allows us to make comparison with an alternative calculation of as we calculate the superconducting properties of LaH10. Indeed, in Table 1, we list the comparison of results from our spectrum with those that we have calculated from the Errea spectrum.
| Errea spectrum | Our spectrum | |
| (anharmonic) | (harmonic) | |
| (214 GPa) | (210 GPa) | |
| 0.15 | 0.13 | |
| 2.02 | 2.16 | |
| (meV) | 133 | 130 |
| (meV) | 113 | 102 |
| 0.155 | 0.157 | |
| 0.18 | 0.20 | |
| Isotope coeff. | 0.484 | 0.489 |
| (meV) | 49 | 51 |
| 4.78 | 4.93 | |
| 2.97 | 2.91 | |
| 0.131 | 0.130 |
In Fig. 4(a), we show the functional derivative of with respect to , this quantity indicates which frequencies in the spectrum are more important for increasing . While the curve is entirely positive, indicating that adding more weight in the spectrum at any frequency will increase , it is clear that the broad maximum in this spectrum favors the region where we find the hydrogen phonons and that the low frequency La phonons have very little effect on the , indeed our calculations show that they only contribute a few degrees to . Consequently, the large is due to the electrons coupling to hydrogen phonons, as expected from simple arguments that should scale with phonon frequency. Similar results have been recently analyzed by others, for example Refs. Quan et al. (2019); Papaconstantopoulos et al. (2020).
Isotopic substitution is a classic experiment to confirm the electron-phonon interaction as the underlying mechanism for superconductivity. The isotope experiment, where the hydrogen is replaced with deuterium, was done and the was found to be reduced Drozdov et al. (2019). This can be viewed as a measurement of the total isotope effect, to good approximation, given that the La phonons play little role in . If the La had been important, then the deuterium substitution could only be viewed as giving a partial isotope effect Carbotte (1990). Simple Bardeen-Cooper-Schrieffer (BCS) theory predicts , where is the ion mass for a monatomic crystal and the isotope effect coefficient . However, in Migdal-Eliashberg theory, which is the extension of BCS theory to include the details of the electron-phonon interaction, the isotope coefficient is more complex. It can be reduced significantly from 0.5 with finite and even be negative in value, as has been seen in experiments on conventional superconductors. For , regardless the . Here, we have calculated the the total isotope effect coefficient to be 0.489 in Eliashberg theory using the functional derivative method of Rainer and Culetto Rainer and Culetto (1979). Our value is in reasonable agreement with experiment, which finds 0.46 at 150 GPa Drozdov et al. (2019), and with other theoretical calculations showing the pressure dependence of the coefficient Durajski et al. (2019). Our calculation includes the low frequency La-based phonons but even when we remove those phonons to do the partial isotope effect due to hydrogen only, the coefficient barely changes, as expected from the functional derivative.
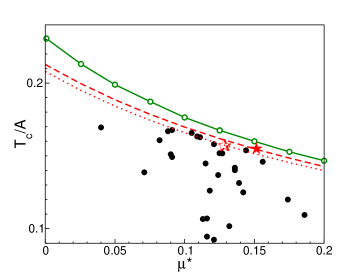
In Fig. 4(b), we also show the curve commonly exhibited with spectra in the literature. is the electron-phonon mass renormalization parameter and is calculated using . This parameter, which is 2.16 for our spectrum, is very important in the theory and is often taken as a measure of the electron-phonon interaction, appearing in simplified equations, such as the McMillan equation McMillan (1968) or the Allen-Dynes equation Allen and Dynes (1975). A more significant parameter for is the area under the , . Shown here is the partial integration of as a function of energy , i.e., , normalized to . In comparison, we show the integrated area of the and the values calculated using just the lower part of the spectrum up to that energy. One sees that the tracks the area under more closely than the . Indeed, it has been discussed in the past that there is an important relationship between the area and with an upper bound on provided by general Eliashberg theory Leavens (1975); Leavens and Carbotte (1974). This is shown in Fig. 5 where the upper bound of is plotted as a function of as the green curve with open circles Leavens (1975). Shown are black points from the spectra and data of many conventional superconductors Carbotte (1990). These points always fall below the upper bound. The open and filled red stars are for our harmonic spectrum and the anharmonic Errea spectrum, respectively. The red curves are for the fixed spectrum, where we vary and therefore the (dashed and dotted curves for anharmonic and harmonic curves, respectively). It is clear that both spectra for LaH10 are near the upper limit and this means that they are highly optimized in their electron-phonon interaction for the highest possible given the repulsive Coulomb potential parameter . Similar results were found for pressurized H3S Nicol and Carbotte (2015). Recently, Quan et al. Quan et al. (2019) have also analyzed results for various hydrides and find good agreement with the area correlating with .
III.2 BCS ratios
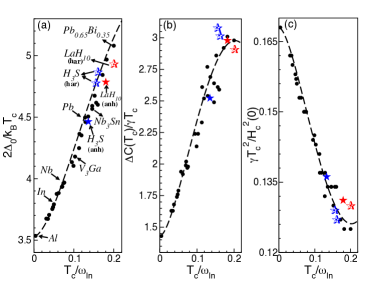
Another important parameter defining the spectrum is a particular moment of the spectrum called Allen and Dynes (1975). This is treated as a typical average phonon frequency, replacing the Debye frequency. Over a number of years of intense study of the Eliashberg equations with both numerical and experimental data, the ratio has been identified as one of the best measures of strong electron-phonon coupling in conventional superconductors and simple formulas have been developed using this parameter Mitrovic et al. (1984); Marsiglio and Carbotte (1986); Carbotte (1990). Here, we find which is much stronger coupling than the famous ”bad actors” Pb and Hg, and is more typical of Pb-Bi alloys. The Errea spectrum gives a similar value of . The simple formulas for the famous BCS ratios which are based on this parameter begin to break down by this value. Indeed, another recent calculation Kruglov et al. (2020) found a spectrum with a value of 0.3. This is quite extreme for conventional superconductors and only amorphous Bi is listed as having this value. These authors used the simple formulas for calculating the ratios but in this regime the full numerical theory can give quite significant deviations Carbotte (1990). We have calculated the three classic BCS ratios for the energy gap , the specific heat jump at the phase transition with , the Sommerfeld constant, and the thermodynamic critical field at zero temperature , using the full Eliashberg equations which includes numerical analytic continuation from the imaginary axis equation results to the real axis in order to determine the energy gap . These ratios are listed in Table 1 and we also provide the classic plots of these ratios versus , which are shown in Fig. 6. The dashed curves are the simple analytic formulas which were derived as a functional form from Eliashberg theory and then had the coefficients fitted to the numerical and the experimental data in existence at the time. The fits are best at low . We have also included data from many conventional superconductors taken from Ref. Carbotte (1990), some of which are labeled. In the limit of , the BCS values are recovered. Aluminum is a classic weak coupling BCS superconductor and Pb is a well-studied example of a strong coupling superconductor. The blue stars are from a prior calculation by one of us Nicol and Carbotte (2015) for H3S, where both harmonic Errea et al. (2015); Flores-Livas et al. (2016) and anharmonic Errea et al. (2015) phonon spectra were used. The red stars are for our spectrum and the Errea spectrum for LaH10. One sees that even at this value of there are deviations from the approximate formula, but nonetheless, LaH10 is still within the realm of conventional s-wave, electron-phonon-mediated superconductivity. The deviations between the harmonic versus the anharmonic spectrum reflect that the anharmonic one has the hydrogen phonons pushed to slightly higher which increases .
III.3 Optical Properties
We now turn to a discussion of optical properties. The reason for focusing on this quantity is twofold. Firstly, the hydrides are in diamond anvil cells under high pressure and this limits the type of experiments which can be performed on these new materials in order to verify theories about them. It has already been shown that optical experiments can be successfully performed on these materials as was done for H3S Capitani et al. (2017). Secondly, the optical response is a spectroscopy and this can provide essential information about the superconducting state. Indeed at low photon energy, one can measure the energy gap and, at higher photon energy, one can derive information on the electron-phonon interaction and confirm coupling to high energy bosons. Moreover, a recent proposal Carbotte et al. (2018) demonstrates a method to provide an independent measure of at high photon energy.
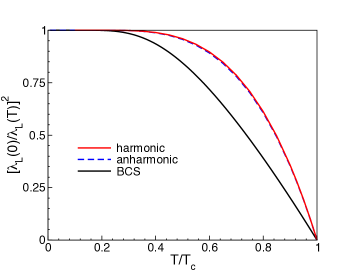
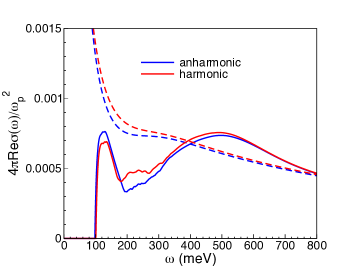
In Fig. 7, we show the absorptive part of the conductivity as a function of photon energy . Here, is the plasma frequency. Curves are shown for the low temperature (solid curves) and the normal state at (dashed curves). A comparison has been made between the harmonic and anharmonic spectra, red and blue curves, respectively, and there is very little difference. We have assumed an elastic impurity scattering rate of 100 meV. The opening of an energy gap in the superconducting state manifests itself as zero absorption up until meV at which point the conductivity rises sharply due to impurity scattering in the system. This region of zero absorption can be used to measure the energy gap Mori et al. (2008). The dip in the absorption reflects structure which can be traced back to energy dependence of the spectrum shifted by . Such structure can be used to extract the Farnworth and Timusk (1976). The fact that the main difference between the harmonic and anharmonic spectra occurs in this region illustrates this point as this is the only place where the slightly different energy dependence of the two spectra would manifest. The inelastic scattering due to the electron-phonon interaction gives rise to a large bump in the conductivity which overshoots the normal state, primarily reflecting a shift in such structure with the opening an energy gap upon going from the normal to the superconducting state Allen (1971); Carbotte et al. (2018). The stronger variations in the superconducting state over the normal state is a reflection of the square root singularity in the superconducting quasiparticle density of states which enters the evaluation of the conductivity Carbotte et al. (2019); Akis et al. (1991); Marsiglio and Carbotte (2008). The loss in spectral weight at low energy is found in the superconducting condensate and is represented by the superfluid density shown in Fig. 7 (related to the inverse square of the penetration depth ). Here we find that the superfluid density shows the classic temperature dependence of a strong-coupling superconductor where the curve is higher than the BCS one. Both anharmonic and harmonic spectra give essentially the same result here. The penetration depth can be measured from the optical response via the imaginary part of the conductivity for . Note that the imaginary part of is related to the real part via Kramers-Kronig relations. Finally, returning to the real part of the conductivity in Fig. 7, the bump up at high energy here is quite large and its temperature dependence can be used to measure the because the bump will reduce and shift to lower as the energy gap closes with increasing , while the normal state conductivity will increase in width with temperature.
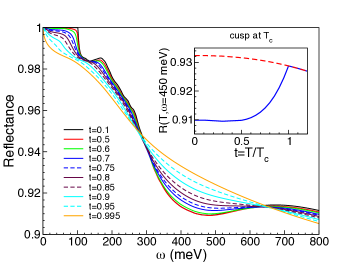
To best understand this last point, we move to the reflectance. While both the complex conductivity and the related complex reflectance can be calculated theoretically and measured via experiment, it is the reflectance that is the directly measured quantity. The phase of the reflectance must be obtained through Kramers-Kronig but once this is known, there are simple formulas that provide the connection to the real and imaginary parts of through the complex dielectric function. In Fig. 9, we show the reflectance that we have calculated for our spectrum at a large number of temperatures from close to , using eV and correcting for the diamond refractive index. The perfect reflection at low temperature and frequencies up to 100 meV identifies the energy gap . The strong variation in the region of 300-600 meV is where the temperature dependence is moving upwards whereas in the normal state it would move downwards. If we fix at a particular photon energy (in this case 450 meV) and plot the reflectance as a function of temperature, we have the blue curve shown in the inset, which shows a cusp at as the temperature dependence changes behavior from the superconducting state to the normal state. The red dashed curve is that for the normal state shown down to zero temperature, if superconductivity is suppressed. This cusp feature in the reflectance at fixed can be used as an additional noncontact method to determine Carbotte et al. (2018). Moreover, as these materials are in a diamond anvil cell in order to be at high pressure, optical measurements are one of the few probes available under these conditions and this range of photon energy is above that where there would be a strong obscuring response due to the diamond in the pressure cell. This has yet to be tested but successful optical measurements in this energy range were performed on pressurized H3S to confirm coupling to a high energy boson for superconductivity Capitani et al. (2017) and so we are confident that this experiment is possible and estimates indicate that it should be.
IV Conclusions
In summary, we have used a combination of first-principle DFT calculations and Migdal-Eliashberg theory to study the mechanism of superconductivity in LaH10, which has the highest known . We have demonstrated that the large is driven by the coupling of the electrons to hydrogen phonons and that the La contribution to is small. We have provided a thorough discussion of the nature of , resulting from a mechanism which is highly optimized in this material, and have shown where LaH10 sits in relation to conventional electron-phonon superconductors in terms of strong coupling parameters and the classic BCS ratios. Finally, we have highlighted the optical properties, in particular, as a means to determine the energy gap, the superconducting mechanism, and independently confirm . Measurement of optical properties on pressurized H3S has demonstrated the potential for success of this technique and its ability to confirm our predictions.
Acknowledgments
S.F.E thanks Ion Errea, Roald Hoffmann, and Stanimir Bonev for useful discussions. E.J.N. and T.T. acknowledge the late J.P. Carbotte for important discussions and contributions on this topic. In addition, we also thank M.I. Eremets for ongoing collaborations and discussions related to LaH10. We also thank H. Liu and R.J. Hemley for providing their from Ref. 25, although it has not been used here. This work was funded by Natural Sciences and Engineering Research Council of Canada (NSERC) (EJN,TT). This research was enabled in part by support provided by
Graham & Cedar and Compute Canada (www.computecanada.ca).
References
- Ashcroft (1968) N. W. Ashcroft, Phys. Rev. Lett. 21, 1748 (1968), URL https://link.aps.org/doi/10.1103/PhysRevLett.21.1748.
- Mao and Hemley (1989) H. K. Mao and R. J. Hemley, Science 244, 1462 (1989).
- Eremets and Troyan (2011) M. I. Eremets and I. A. Troyan, Nat. Mater. 10, 927 (2011).
- Dias and Silvera (2017) R. P. Dias and I. F. Silvera, Science 355, 715 (2017), ISSN 0036-8075, URL https://science.sciencemag.org/content/355/6326/715.
- Loubeyre et al. (2020) P. Loubeyre, F. Occelli, and P. Dumas, Nature 577, 631 (2020).
- Flores-Livas et al. (2019) J. A. Flores-Livas, L. Boeri, A. Sanna, G. Profeta, R. Arita, and M. Eremets, A perspective on conventional high-temperature superconductors at high pressure: Methods and materials (2019), eprint 1905.06693.
- Zhang et al. (2017) L. Zhang, Y. Wang, J. Lv, and Y. Ma, Nature Reviews Materials 2, 17005 (2017), ISSN 2058-8437, URL https://doi.org/10.1038/natrevmats.2017.5.
- Oganov et al. (2019) A. R. Oganov, C. J. Pickard, Q. Zhu, and R. J. Needs, Nature Reviews Materials 4, 331 (2019), ISSN 2058-8437, URL https://doi.org/10.1038/s41578-019-0101-8.
- Pickard et al. (2020) C. J. Pickard, I. Errea, and M. I. Eremets, Annu. Rev. Condens. Matter Phys. 11, 57 (2020).
- Li et al. (2016) Y. Li, L. Wang, H. Liu, Y. Zhang, J. Hao, C. J. Pickard, J. R. Nelson, R. J. Needs, W. Li, Y. Huang, et al., Phys. Rev. B 93, 020103 (2016), URL http://link.aps.org/doi/10.1103/PhysRevB.93.020103.
- Strobel et al. (2011) T. A. Strobel, P. Ganesh, M. Somayazulu, P. R. C. Kent, and R. J. Hemley, Phys. Rev. Lett. 107, 255503 (2011), URL http://link.aps.org/doi/10.1103/PhysRevLett.107.255503.
- Li et al. (2014) Y. Li, J. Hao, H. Liu, Y. Li, and Y. Ma, The Journal of Chemical Physics 140, 174712 (2014), eprint http://dx.doi.org/10.1063/1.4874158, URL http://dx.doi.org/10.1063/1.4874158.
- Duan et al. (2014) D. Duan, Y. Liu, F. Tian, D. Li, X. Huang, Z. Zhao, H. Yu, B. Liu, W. Tian, and T. Cui, Scientific Reports 4, 6968 (2014), ISSN 2045-2322, URL https://doi.org/10.1038/srep06968.
- Drozdov et al. (2015) A. P. Drozdov, M. I. Eremets, I. A. Troyan, V. Ksenofontov, and S. I. Shylin, Nature 525, 73 (2015), ISSN 0028-0836, letter, URL http://dx.doi.org/10.1038/nature14964.
- Duan et al. (2015) D. Duan, X. Huang, F. Tian, D. Li, H. Yu, Y. Liu, Y. Ma, B. Liu, and T. Cui, Phys. Rev. B 91, 180502 (2015), URL http://link.aps.org/doi/10.1103/PhysRevB.91.180502.
- Errea et al. (2015) I. Errea, M. Calandra, C. J. Pickard, J. Nelson, R. J. Needs, Y. Li, H. Liu, Y. Zhang, Y. Ma, and F. Mauri, Phys. Rev. Lett. 114, 157004 (2015), URL http://link.aps.org/doi/10.1103/PhysRevLett.114.157004.
- Bernstein et al. (2015) N. Bernstein, C. S. Hellberg, M. D. Johannes, I. I. Mazin, and M. J. Mehl, Phys. Rev. B 91, 060511 (2015), URL http://link.aps.org/doi/10.1103/PhysRevB.91.060511.
- Errea et al. (2016) I. Errea, M. Calandra, C. J. Pickard, J. R. Nelson, R. J. Needs, Y. Li, H. Liu, Y. Zhang, Y. Ma, and F. Mauri, Nature 532, 81 (2016), ISSN 0028-0836, letter, URL http://dx.doi.org/10.1038/nature17175.
- Einaga et al. (2016) M. Einaga, M. Sakata, T. Ishikawa, K. Shimizu, M. I. Eremets, A. P. Drozdov, I. A. Troyan, N. Hirao, and Y. Ohishi, Nat Phys 12, 835 (2016), ISSN 1745-2473, letter, URL http://dx.doi.org/10.1038/nphys3760.
- Guigue et al. (2017) B. Guigue, A. Marizy, and P. Loubeyre, Phys. Rev. B 95, 020104 (2017), URL http://link.aps.org/doi/10.1103/PhysRevB.95.020104.
- Goncharov et al. (2016) A. F. Goncharov, S. S. Lobanov, I. Kruglov, X.-M. Zhao, X.-J. Chen, A. R. Oganov, Z. Konôpková, and V. B. Prakapenka, Phys. Rev. B 93, 174105 (2016), URL http://link.aps.org/doi/10.1103/PhysRevB.93.174105.
- Feng et al. (2015) X. Feng, J. Zhang, G. Gao, H. Liu, and H. Wang, RSC Adv. 5, 59292 (2015), URL http://dx.doi.org/10.1039/C5RA11459D.
- Wang et al. (2012) H. Wang, J. S. Tse, K. Tanaka, T. Iitaka, and Y. Ma, Proceedings of the National Academy of Sciences 109, 6463 (2012), ISSN 0027-8424, eprint https://www.pnas.org/content/109/17/6463.full.pdf, URL https://www.pnas.org/content/109/17/6463.
- Li et al. (2015) Y. Li, J. Hao, H. Liu, J. S. Tse, Y. Wang, and Y. Ma, Scientific Reports 5, 9948 (2015), ISSN 2045-2322, URL https://doi.org/10.1038/srep09948.
- Liu et al. (2017) H. Liu, I. I. Naumov, R. Hoffmann, N. W. Ashcroft, and R. J. Hemley, Proceedings of the National Academy of Sciences 114, 6990 (2017), ISSN 0027-8424, eprint https://www.pnas.org/content/114/27/6990.full.pdf, URL https://www.pnas.org/content/114/27/6990.
- Peng et al. (2017) F. Peng, Y. Sun, C. J. Pickard, R. J. Needs, Q. Wu, and Y. Ma, Phys. Rev. Lett. 119, 107001 (2017), URL https://link.aps.org/doi/10.1103/PhysRevLett.119.107001.
- Geballe et al. (2018) Z. M. Geballe, H. Liu, A. K. Mishra, M. Ahart, M. Somayazulu, Y. Meng, M. Baldini, and R. J. Hemley, Angewandte Chemie International Edition 57, 688 (2018), URL https://onlinelibrary.wiley.com/doi/abs/10.1002/anie.201709970.
- Somayazulu et al. (2019) M. Somayazulu, M. Ahart, A. K. Mishra, Z. M. Geballe, M. Baldini, Y. Meng, V. V. Struzhkin, and R. J. Hemley, Phys. Rev. Lett. 122, 027001 (2019), URL https://link.aps.org/doi/10.1103/PhysRevLett.122.027001.
- Drozdov et al. (2019) A. P. Drozdov, P. P. Kong, V. S. Minkov, S. P. Besedin, M. A. Kuzovnikov, S. Mozaffari, L. Balicas, F. F. Balakirev, D. E. Graf, V. B. Prakapenka, et al., Nature 569, 528 (2019), ISSN 1476-4687, URL https://doi.org/10.1038/s41586-019-1201-8.
- Kruglov et al. (2020) I. A. Kruglov, D. V. Semenok, H. Song, R. Szczesniak, I. A. Wrona, R. Akashi, M. M. Davari Esfahani, D. Duan, T. Cui, A. G. Kvashnin, et al., Phys. Rev. B 101, 024508 (2020), URL https://link.aps.org/doi/10.1103/PhysRevB.101.024508.
- Errea et al. (2020) I. Errea, F. Belli, L. Monacelli, A. Sanna, T. Koretsune, T. Tadano, R. Bianco, M. Calandra, R. Arita, F. Mauri, et al., Nature 578, 66 (2020), ISSN 1476-4687, URL https://doi.org/10.1038/s41586-020-1955-z.
- Capitani et al. (2017) F. Capitani, B. Langerome, J.-B. Brubach, P. Roy, A. Drozdov, M. I. Eremets, E. J. Nicol, J. P. Carbotte, and T. Timusk, Nature Physics 13, 859 (2017), ISSN 1745-2481, URL https://doi.org/10.1038/nphys4156.
- Carbotte et al. (2018) J. P. Carbotte, E. J. Nicol, and T. Timusk, Phys. Rev. Lett. 121, 047002 (2018), URL https://link.aps.org/doi/10.1103/PhysRevLett.121.047002.
- Gonze et al. (2009) X. Gonze, B. Amadon, P.-M. Anglade, J.-M. Beuken, F. Bottin, P. Boulanger, F. Bruneval, D. Caliste, R. Caracas, et al., Computer Physics Communications 180, 2582 (2009), ISSN 0010-4655, URL http://www.sciencedirect.com/science/article/pii/S0010465509002276.
- Hartwigsen et al. (1998) C. Hartwigsen, S. Goedecker, and J. Hutter, Phys. Rev. B 58, 3641 (1998), URL https://link.aps.org/doi/10.1103/PhysRevB.58.3641.
- Goedecker et al. (1996) S. Goedecker, M. Teter, and J. Hutter, Phys. Rev. B 54, 1703 (1996), URL https://link.aps.org/doi/10.1103/PhysRevB.54.1703.
- (37) See Supplemental Material at http://link.aps.org/supplemental/xxx/PhysRevB.xx.xxxx, for structural information, DOS, phonon density, and distances analysis.
- Wang et al. (2020) C. Wang, S. Yi, and J.-H. Cho, Phys. Rev. B 101, 104506 (2020), URL https://link.aps.org/doi/10.1103/PhysRevB.101.104506.
- Gonze (1997) X. Gonze, Phys. Rev. B 55, 10337 (1997), URL https://link.aps.org/doi/10.1103/PhysRevB.55.10337.
- Liu and Quong (1996) A. Y. Liu and A. A. Quong, Phys. Rev. B 53, R7575 (1996), URL https://link.aps.org/doi/10.1103/PhysRevB.53.R7575.
- Savrasov and Savrasov (1996) S. Y. Savrasov and D. Y. Savrasov, Phys. Rev. B 54, 16487 (1996), URL https://link.aps.org/doi/10.1103/PhysRevB.54.16487.
- Bianco et al. (2018) R. Bianco, I. Errea, M. Calandra, and F. Mauri, Phys. Rev. B 97, 214101 (2018), URL https://link.aps.org/doi/10.1103/PhysRevB.97.214101.
- Carbotte (1990) J. P. Carbotte, Rev. Mod. Phys. 62, 1027 (1990), URL https://link.aps.org/doi/10.1103/RevModPhys.
- Marsiglio and Carbotte (2008) F. Marsiglio and J. P. Carbotte, in Superconductivity in Conventional and Unconventional Superconduct ors, edited by K. Bennemann and J. Ketterson (Springer, Berlin, 2008), pp. 73–162.
- Carbotte et al. (2019) J. P. Carbotte, E. J. Nicol, and T. Timusk, Phys. Rev. B 100, 094505 (2019), URL https://link.aps.org/doi/10.1103/PhysRevB.100.094505.
- Marsiglio et al. (1988) F. Marsiglio, M. Schossmann, and J. P. Carbotte, Phys. Rev. B 37, 4965 (1988), URL https://link.aps.org/doi/10.1103/PhysRevB.37.4965.
- Akis et al. (1991) R. Akis, J. P. Carbotte, and T. Timusk, Phys. Rev. B 43, 12804 (1991), URL https://link.aps.org/doi/10.1103/PhysRevB.43.12804.
- Quan et al. (2019) Y. Quan, S. S. Ghosh, and W. E. Pickett, Phys. Rev. B 100, 184505 (2019), URL https://link.aps.org/doi/10.1103/PhysRevB.100.184505.
- Papaconstantopoulos et al. (2020) D. A. Papaconstantopoulos, M. J. Mehl, and P.-H. Chang, Phys. Rev. B 101, 060506 (2020), URL https://link.aps.org/doi/10.1103/PhysRevB.101.060506.
- Rainer and Culetto (1979) D. Rainer and F. J. Culetto, Phys. Rev. B 19, 2540 (1979), URL https://link.aps.org/doi/10.1103/PhysRevB.19.2540.
- Durajski et al. (2019) A. P. Durajski, R. Szczesniak, Y. Li, C. Wang, and J.-H. Cho, Isotope effect in superconducting lanthanum hydride under high compression (2019), eprint arXiv:1912.09663.
- McMillan (1968) W. L. McMillan, Phys. Rev. 167, 331 (1968), URL http://link.aps.org/doi/10.1103/PhysRev.167.331.
- Allen and Dynes (1975) P. B. Allen and R. C. Dynes, Phys. Rev. B 12, 905 (1975), URL http://link.aps.org/doi/10.1103/PhysRevB.12.905.
- Leavens (1975) C. R. Leavens, Solid State Commun. 17, 1499 (1975).
- Leavens and Carbotte (1974) C. R. Leavens and J. P. Carbotte, J. Low Temp. Phys. 14, 195 (1974).
- Nicol and Carbotte (2015) E. J. Nicol and J. P. Carbotte, Phys. Rev. B 91, 220507 (2015), URL https://link.aps.org/doi/10.1103/PhysRevB.91.220507.
- Mitrovic et al. (1984) B. Mitrovic, H. G. Zarate, and J. P. Carbotte, Phys. Rev. B 29, 184 (1984), URL http://link.aps.org/doi/10.1103/PhysRevB.29.184.
- Marsiglio and Carbotte (1986) F. Marsiglio and J. P. Carbotte, Phys. Rev. B 33, 6141 (1986), URL http://link.aps.org/doi/10.1103/PhysRevB.33.6141.
- Flores-Livas et al. (2016) J. A. Flores-Livas, A. Sanna, and E. K. U. Gross, Euro. Phys. J. B 89, 63 (2016).
- Mori et al. (2008) T. Mori, E. J. Nicol, S. Shiizuka, K. Kuniyasu, T. Noji ma, N. Toyota, and J. P. Carbotte, Phys. Rev. B 77, 174515 (2008), URL http://link.aps.org/doi/10.1103/PhysRevB.77.174515.
- Farnworth and Timusk (1976) B. Farnworth and T. Timusk, Phys. Rev. B 14, 5119 (1976), URL https://link.aps.org/doi/10.1103/PhysRevB.14.5119.
- Allen (1971) P. B. Allen, Phys. Rev. B 3, 305 (1971).