The origin of low-surface-brightness galaxies in the dwarf regime
Abstract
Low-surface-brightness galaxies (LSBGs) – defined as systems that are fainter than the surface-brightness limits of past wide-area surveys – form the overwhelming majority of galaxies in the dwarf regime (M⋆ 109 M⊙). Using NewHorizon, a high-resolution cosmological simulation, we study the origin of LSBGs and explain why LSBGs at similar stellar mass show the large observed spread in surface brightness. NewHorizon galaxies populate a well-defined locus in the surface brightness – stellar mass plane, with a spread of 3 mag arcsec-2, in agreement with deep SDSS Stripe data. Galaxies with fainter surface brightnesses today are born in regions of higher dark-matter density. This results in faster gas accretion and more intense star formation at early epochs. The stronger resultant supernova feedback flattens gas profiles at a faster rate which, in turn, creates shallower stellar profiles (i.e. more diffuse systems) more rapidly. As star formation declines towards late epochs (), the larger tidal perturbations and ram pressure experienced by these systems (due to their denser local environments) accelerate the divergence in surface brightness, by increasing their effective radii and reducing star formation respectively. A small minority of dwarfs depart from the main locus towards high surface brightnesses, making them detectable in past wide surveys (e.g. standard-depth SDSS images). These systems have anomalously high star-formation rates, triggered by recent, fly-by or merger-driven starbursts. We note that objects considered extreme/anomalous at the depth of current datasets, e.g. ‘ultra-diffuse galaxies’, actually dominate the predicted dwarf population and will be routinely visible in future surveys like LSST.
keywords:
galaxies: evolution – galaxies: formation – galaxies: interactions – methods: numerical1 Introduction
Our statistical understanding of galaxy evolution is fundamentally driven by objects that are brighter than the surface brightness limits of wide-area surveys. Rapid progress has been made over the last few decades in advancing our comprehension of how galaxies form and evolve over time. The observed multi-wavelength properties of galaxies have been mapped in detail, via large surveys from both ground and space-based instruments (e.g. Beckwith et al., 2006; Bianchi et al., 2017; Blanton et al., 2017; Nayyeri et al., 2017; Aihara et al., 2019). Confrontation of these surveys with simulations in cosmological volumes (e.g. Dubois et al., 2014b; Vogelsberger et al., 2014b; Schaye et al., 2015; Kaviraj et al., 2017) has enabled us to interpret this data and understand the physics of galaxy evolution.
The current consensus from the recent literature is that galaxies form hierarchically, within a CDM framework (e.g. Cole et al., 2000; Bullock et al., 2001; Hatton et al., 2003; Bower et al., 2006; Pipino et al., 2009), with models based on this paradigm broadly reproducing the observed statistical properties of galaxies in contemporary surveys (e.g. Blanton et al., 2017; Aihara et al., 2019). However, notwithstanding the successes of this standard model, our comprehension of galaxy evolution is largely restricted to relatively bright galaxies, that have effective surface brightnesses111The effective surface brightness is defined here as the mean surface brightness within the effective radius. greater than the surface brightness limits of past wide surveys. For example, in surveys like the SDSS (Abazajian et al., 2009), which has provided much of the discovery space in the nearby Universe, galaxy completeness decreases rapidly at > 23 mag arcsec-2 (e.g. Cross & Driver, 2002; Blanton et al., 2005; Driver et al., 2005), where is the effective surface brightness in the -band, dropping to 10 per cent for 24 mag arcsec-2 (e.g Kniazev et al., 2004).
Thus, while our understanding of the evolution of bright galaxies has progressed significantly, it is worth considering the significance of ‘low-surface brightness’ galaxies (LSBGs), defined here as those that fall below the nominal surface brightness limits of past wide-area surveys and which are, therefore, undetectable in these datasets. Both theory (Martin et al., 2019; Kulier et al., 2019) and observational work using small, deep surveys (e.g. McGaugh et al., 1995; Bothun et al., 1997; Dalcanton et al., 1997) indicate that most galaxies are, in fact, fainter than the surface brightness limits of past wide-area surveys. These LSBGs are a heterogeneous population, ranging from massive, diffuse disks to all dwarf galaxies at cosmological distances. Current cosmological simulations indicate that these LSBGs dominate the galaxy number density, comprising more than 85 per cent of objects down to M⋆ 107 M⊙ (Martin et al., 2019) and form a large, natural, empirically-unexplored extension of the population of bright galaxies on which our understanding of galaxy evolution is currently predicated.
The absence of these objects from past datasets has two important consequences. First, our empirical picture of galaxy formation is heavily biased. Second, since our models are statistically calibrated only to the subset of bright galaxies, our understanding of the physics of galaxy evolution remains potentially highly incomplete. It is, therefore, not surprising that many well-known tensions between theory and observation are in the low-surface brightness regime, e.g. the apparent excess of dwarfs in simulations i.e. the substructure problem (Moore et al., 1999; Bullock & Boylan-Kolchin, 2017), the core-cusp problem (de Blok, 2010) and the ‘too-big-to-fail’ problem (Boylan-Kolchin et al., 2011). A complete understanding of galaxy evolution therefore demands a detailed comprehension of how LSBGs evolve over cosmic time.
LSBGs have seen an explosion of interest in the recent observational literature, driven by individual or small deep pointings (e.g. Kaviraj, 2014a, b; Mihos et al., 2015; Martínez-Delgado et al., 2016b; Merritt et al., 2016; Román & Trujillo, 2017b; Leisman et al., 2017; Greco et al., 2018; Kaviraj et al., 2019; Martin et al., 2020) and/or careful reprocessing of relatively shallow surveys to push fainter than their nominal detection limits (e.g. Trujillo et al., 2017; Sedgwick et al., 2019b). While these efforts have started to give us a glimpse of the LSBG regime, the galaxy samples that underpin these studies are not representative of the general population of LSBGs. In particular, the statistical properties of LSBGs in groups (e.g Smith Castelli et al., 2016; Merritt et al., 2016; Román & Trujillo, 2017a, b; Jiang et al., 2019) and the field (e.g Martínez-Delgado et al., 2016a; Papastergis et al., 2017; Leisman et al., 2017) remain particularly poorly understood, largely due to the lack of surveys that are both deep and wide. However, the successful detection of LSBGs in sparser environments indicates that they are not a cluster phenomenon and are, in fact, a ubiquitous population that inhabits all regions of the observable Universe.
A burgeoning theoretical literature has explored the mechanisms that form LSBGs. For example, high halo spin (e.g. Amorisco & Loeb, 2016), bursty supernova feedback, which leads to the formation of cored dark matter haloes (e.g. Di Cintio et al., 2017; Chan et al., 2018; Martin et al., 2019), mergers (Wright et al., 2020) or formation from high angular momentum gas (Liao et al., 2019; Tremmel et al., 2019; Di Cintio et al., 2019) have all been suggested as channels for creating LSBGs and ‘ultra-diffuse galaxies’ (UDGs), which represent the extreme end of the LSBG population at the depth of current datasets. However, it has also been shown that environmental processes like tidal perturbations, the alignment of infalling baryons at early times and galaxy collisions are likely required to fully reproduce the variety and demographics of the LSBG/UDG populations seen in the observations (e.g. Baushev, 2018; Martin et al., 2019; Liao et al., 2019; Carleton et al., 2019; Tremmel et al., 2019; Cardona-Barrero et al., 2020; Jackson et al., 2020). It is worth noting that LSBGs (including the more extreme UDG population) are predicted to form in all environments including the field (e.g. Di Cintio et al., 2017; Chan et al., 2018; Jiang et al., 2019; Liao et al., 2019; Wright et al., 2020), consistent with the findings of recent observational work.
A statistical comparison between observation and theory in the LSBG regime requires a hydrodynamical simulation in a cosmological volume. The hydrodynamics are essential for 2D predictions for baryons (which determines the surface brightness of the mock galaxies), while a cosmological volume is required for making statistical predictions for the properties of the LSBGs as a whole, across the full spectrum of cosmological environments (field, groups etc). In recent work, Martin et al. (2019) have performed a comprehensive study of the formation of relatively massive LSBGs, using the Horizon-AGN cosmological simulation (Kaviraj et al., 2017). They showed that, in the stellar mass range M⋆ 109 M⊙, the formation of LSBGs and their eventual divergence from their high surface brightness counterparts, is triggered by a period of more intense star formation activity in the early () Universe. This leads to more intense supernova feedback, which moves gas from the central regions towards the outskirts, flattening their gas profiles, but typically does not remove gas completely from the system. These shallower gas profiles then lead to shallower stellar profiles which are more susceptible to tidal processes and ram pressure stripping. Over time, these processes ‘heat’ the stellar and gas content of the LSBGs, increasing their effective radii further, and quench the galaxies, both of which lead to their low surface brightnesses at the present day.
While Martin et al. (2019) has offered key insights into the formation of relatively massive LSBGs, the range of stellar masses that can be probed by Horizon-AGN (and other simulations with similar box sizes such as EAGLE (Schaye et al., 2015) and Illustris (Vogelsberger et al., 2014a)) is limited by both its stellar mass resolution (M⋆ 108.5 M⊙) and spatial resolution (1 kpc). The formation of lower-mass i.e. dwarf LSBGs, which is the regime in which most observational LSBG studies are focused, requires a cosmological simulation with much better mass and spatial resolution ideally in the tens of parsecs. Recall that the scale height of the Milky Way is 300 pc (e.g. Kent et al., 1991; López-Corredoira et al., 2002; McMillan, 2011), so much higher spatial resolution is needed to properly resolve dwarfs.
In this study, we use the NewHorizon cosmological hydro-dynamical simulation, which has stellar mass and maximum spatial resolutions of 104 M⊙ and 40 pc respectively, to study the origin of low-mass LSBGs, drilling down deep into the dwarf regime. NewHorizon offers better mass and spatial resolution than any other simulation with a comparable volume, making it ideally suited for this exercise. Our aims are two fold. First, we study the surface brightness vs. stellar mass plane, for galaxies down to stellar masses of M⋆ 106.5 M⊙, and compare the position of the main locus of galaxies to existing observational data. Second, we study how different processes (e.g. feedback from supernovae and active galactic nuclei (AGN), ram pressure, tidal perturbations and galaxy mergers) drive the origin of dwarf LSBGs and produce the large observed spread in galaxy surface brightness at fixed stellar mass.
This paper is structured as follows. In Section 2, we briefly describe the NewHorizon simulation. In Section 3, we study the properties of galaxies in the surface brightness vs. stellar mass plane in the nearby Universe. In Section 4, we study how different processes contribute to the position of galaxies in the surface brightness vs. stellar mass plane at low redshift. In Section 5, we explore why a minority of galaxies depart strongly from the main locus of objects that hosts the majority of galaxies in this plane. We summarise our findings in Section 6.
2 Simulation
We use the NewHorizon cosmological, hydro-dynamical simulation (Dubois et al., 2020) 222new.horizon-simulation.org, which is a high-resolution zoom of a region within the Horizon-AGN simulation (Dubois et al., 2014b; Kaviraj et al., 2017, H-AGN hereafter). The simulation has been run down to . NewHorizon employs the adaptive mesh refinement code RAMSES (Teyssier, 2002). Initial conditions are taken from H-AGN, which utilises a grid that spans a 142 comoving Mpc volume, using 10243 uniformly-distributed cubic cells with a constant mass resolution, using MPGrafic. For NewHorizon, this grid is resampled at higher resolution (using 40963 uniformly-distributed cubic cells), with the same cosmology (=0.272, =0.0455, =0.728, H0=70.4 km s-1 Mpc-1 and =0.967 (Komatsu et al., 2011)).
The high-resolution zoom has a volume of (16 Mpc)3, taken from an average density region of H-AGN. It has a dark-matter (DM) resolution of 106 M⊙ (compared to 8107 M⊙ for H-AGN), stellar mass resolution of 104 M⊙ (compared to 2106 M⊙ in H-AGN) and a maximum spatial resolution of 34 pc (compared to 1 kpc in H-AGN). This makes NewHorizon the simulation with the highest spatial and stellar mass resolution in a cosmological volume and an ideal tool with which to study the dwarf galaxy population. Note that, given that the zoom region used to create NewHorizon has an average density, this simulation does not contain high-density environments like clusters.
2.1 Star formation and stellar feedback
Gas cools via the initial mixture of Hydrogen and Helium, which is progressively enriched by metals produced by stellar evolution (Sutherland & Dopita, 1993; Rosen & Bregman, 1995). We assume photoionized equilibrium, with an ambient UV background after the Universe is re-ionized at (Haardt & Madau, 1996). Star formation occurs in gas with a hydrogen number density greater than 10 H cm-3 and a temperature lower than 2104 K, following a Schmidt-Kennicutt relation (Schmidt, 1959; Kennicutt, 1998). The efficiency depends on the local turbulent Mach number and virial parameter =2Ek/||, where Ek is the turbulent energy of the gas and Eg is the gas gravitational binding energy (Kimm et al., 2017). A probability of forming a star particle of mass M⋆,res=104 M⊙ is drawn at each time step according to the Schmidt-Kennicutt law.
Each star particle represents a coeval collection of stars with different masses. 31 percent of the stellar mass of this star particle (corresponding to stars more massive than 6 M⊙) is assumed to explode as Type II supernovae, 5 Myr after its birth. The fraction is calculated using a Chabrier initial mass function, with upper and lower mass limits of 150 M⊙ and 0.1 M⊙ (Chabrier, 2005).
Supernova (SN) feedback is modelled in the form of both energy and momentum, ensuring that the final radial momentum is accurately captured during the snowplough phase of the expansion (Kimm & Cen, 2014). Each supernova has an initial energy of 1051 erg and a progenitor mass of 10 M⊙. In addition, pre-heating of the ambient gas by ultraviolet radiation from young OB stars is taken into account, by augmenting the final radial momentum from supernovae following Geen et al. (2015).
2.2 Supermassive black holes and black-hole feedback
Supermassive black holes (SMBHs) are considered to be sink particles, which accrete gas and impart feedback to their local surroundings, according to some fraction of the rest-mass energy of the accreted material. SMBHs form in regions with gas density larger than the threshold of star formation, with a seed mass of 104 M⊙. New SMBHs are not allowed to form at a distance less than 50 kpc from other existing black holes. A dynamical gas drag force is applied to the SMBHs (Ostriker, 1999) and two SMBHs are allowed to merge if the distance between them is smaller than 4 times the cell size, and if the kinetic energy of the binary is less than its binding energy.
Black holes (BHs) accrete at the Bondi-Hoyle-Lyttleton accretion rate, with its value capped at Eddington (Hoyle & Lyttleton, 1939; Bondi & Hoyle, 1944). They release energy back into the gas, both via a jet ‘radio’ mode and a thermal quasar mode, for accretion rates below and above 1 percent of the Eddington rate respectively (Dubois et al., 2012). SMBH spins are evolved self-consistently through gas accretion in the quasar mode and coalescence of black hole binaries (Dubois et al., 2014a). This modifies the radiative efficiencies of the accretion flow, following the models of thin Shakura & Sunyaev accretion discs, and the corresponding Eddington accretion rate, mass-energy conversion, and bolometric luminosity of the quasar mode (Shakura & Sunyaev, 1973). The quasar mode imparts a constant 15 percent of the bolometric luminosity as thermal energy back into the surrounding gas, while the radio mode has a spin-dependent variable efficiency and a spin up/down rate that follows results from simulations of magnetically choked accretion discs (McKinney et al., 2012).
2.3 Selection of galaxies and construction of merger trees
DM halos are identified using the AdaptaHOP algorithm (Aubert et al., 2004; Tweed et al., 2009), which efficiently removes subhalos from main structures and counts the fractional number of low-resolution DM particles within the DM virial radius. Galaxies are identified in a similar fashion using the HOP structure finder applied directly on star particles (Eisenstein & Hut, 1998). The difference with AdaptaHOP lies in the fact that HOP does not remove substructures from the main structure, since this would result in star-forming clumps being removed from galaxies. We produce merger trees for each galaxy in the final snapshot (), with an average timestep of 15 Myr, which allows us to track the main branch progenitors of each galaxy with high temporal resolution.
Given that NewHorizon is a high resolution zoom of H-AGN, we also need to consider the DM purity of galaxies. It is possible for higher mass DM particles to enter the high resolution region of NewHorizon from the surrounding lower-resolution regions and, given the large mass difference, interact in unusual ways with the galaxies that they encounter. The vast majority of galaxies affected by low DM purity exist at the outer edge of the NewHorizon sphere. In the analysis that follows, we only consider galaxies with DM halos that are more than 99 per cent pure. We note that our results remain unchanged if we use the sample that is 100 per cent pure. We proceed with the 99 per cent pure sample because it puts our analysis on a firmer statistical footing.
2.4 Local environment
In some of our analysis below we explore details of the environment of galaxies in the cosmic web (e.g. their distances to nodes and filaments), using the persistence-based filament tracing algorithm DisPerSE (Sousbie, 2011), which uses the density field computed via a delaunay tessellation (Schaap & van de Weygaert, 2000) of the DM halo distribution. We choose a persistence of 4 sigma. DisPerSE identifies ridges in the density field as special lines that connect topologically robust pairs of nodes. These ridges compose the filament network of the cosmic web, and the set of all segments defining these ridges are referred to as the ‘skeleton’ (Pogosyan et al., 2009). The distance to the nearest filament and node is computed for each DM halo to form a filament catalog. We refer readers to Sousbie (2011) and Sousbie et al. (2011) for more details of the DisPerSE algorithm and to Dubois et al. (2014b) and Laigle et al. (2018) for an implementation of this algorithm on H-AGN.
2.5 Calculation of surface brightness
We obtain the intrinsic (i.e. unattenuated) surface brightness for each galaxy using the intensity-weighted central second-moment of the stellar particle distribution (e.g. Bernstein & Jarvis, 2002). We calculate the surface brightness in multiple orientations (, and ) and use the mean value in our study. The procedure for calculating the surface brightness of individual galaxies is as follows.
We first obtain the intrinsic -band magnitudes for each star particle that makes up the galaxy. To do this we obtain the full spectral energy distribution (SED) from a grid of Bruzual & Charlot (2003, BC03 hereafter) simple stellar population (SSP) models corresponding to the closest age and metallicity of each star particle. We redshift each BC03 template to the redshift of the galaxy and convolve the redshifted BC03 templates with the response curve for the SDSS -band filter. We then weight by the particle mass to obtain the luminosity contribution of each star particle, and obtain the apparent -band magnitude by converting the flux to a magnitude and adding the distance modulus and zero point.
We then obtain the second moment ellipse as follows. We first construct the covariance matrix of the intensity-weighted central second-moment for the star particles,
| (1) |
where is the flux of each star particle and and are the projected positions from the barycentre in arc seconds. We obtain major () and major () axes of the ellipse from the covariance matrix, where and are its eigenvalues and is the total flux, and find the scaling factor, , which scales the ellipse so that it contains half the total flux of the object. Finally, we calculate the mean surface brightness within the effective radius, , where and is the -band apparent magnitude of the object.
3 The surface brightness vs. stellar mass plane in the nearby Universe
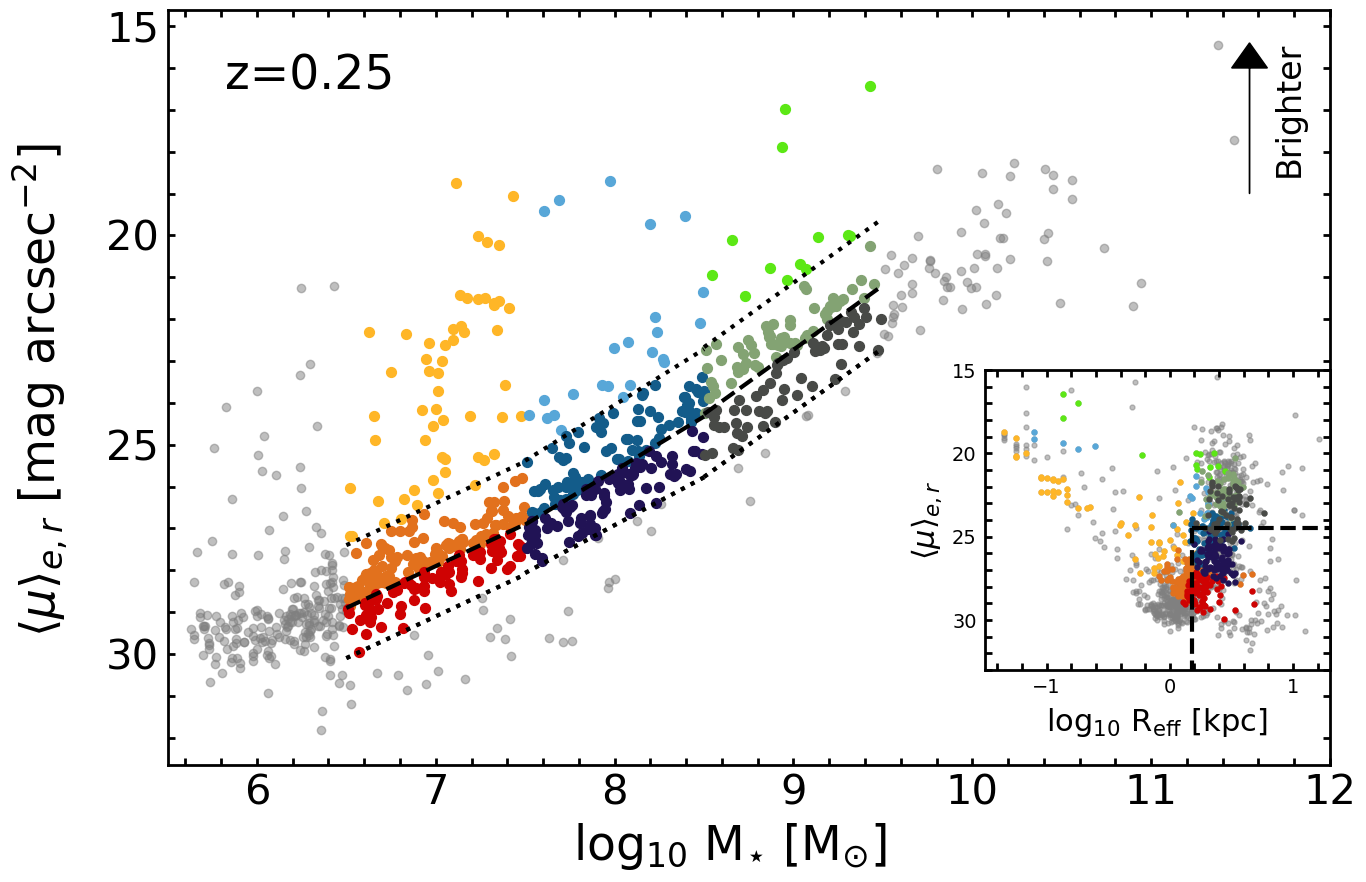
Figure 1 shows the intrinsic surface brightness vs. stellar mass plane for galaxies in NewHorizon at . The majority of galaxies populate a locus in this plane, with a large spread of mag arcsec-2. A small minority of galaxies scatter off this locus towards high surface brightnesses. In order to understand the origin of galaxies that reside in different parts of the surface brightness vs. stellar mass plane at , we split our galaxies into three mass bins. The ‘low’, ‘intermediate’ and ‘high’ mass bins cover the mass ranges 106.5 M⊙ M⋆ 107.5 M⊙, 107.5 M⊙ M⋆ 108.5 M⊙ and 108.5 M⊙ M⋆ 109.5 M⊙ respectively.
We define the limits of the main locus of objects by eye as the area where galaxies are closely clustered together. This is indicated by the dotted lines in Figure 1. Within each mass bin, we then split the galaxy population into three zones. We use a straight line that bisects the region between the two dotted lines in each mass bin to define the ‘lower’ and ‘upper’ zones, with galaxies brighter than the upper dotted line classified as ‘off-locus’. Note that surface brightness increases towards the upper end of Figure 1. Thus, the upper locus galaxies represent the population that is brighter in surface brightness at , while the lower locus galaxies represent their fainter counterparts. These zones and mass bins are indicated using the different colours in Figure 1, where colour designates the mass bin and the shade represents the position of the galaxy (lower, upper or off) on the locus. Due to the small number of galaxies, and since this regime was comprehensively explored in Martin et al. (2019), we do not study objects at the highest stellar masses (M⋆ 109.5 M⊙). We also do not study galaxies which have M⋆ 106.5 M⊙ because their progenitors are not massive enough to be well-resolved at early epochs.
The inset in Figure 1 shows the intrinsic surface brightness vs. effective radius for the NewHorizon galaxy population. The dashed lines indicate the typical values that are used to identify ‘ultra-diffuse galaxies’ (UDGs; e.g. Koda et al., 2015; van Dokkum et al., 2015b; Conselice, 2018; Laporte et al., 2019), which form the faint end of the LSBG population that is detectable at the surface brightness limits of past/current datasets. These systems are sometimes considered to be potentially extreme or anomalous, due to their low surface brightnesses and extended nature. A variety of formation mechanisms have been proposed for their formation, such as the puffing up of ‘normal’ dwarfs due to internal feedback processes (e.g. Amorisco & Loeb, 2016; Di Cintio et al., 2017) and the possibility that UDGs (particularly those in clusters) may be ‘failed’ galaxies with anomalously low star formation efficiencies (e.g. van Dokkum et al., 2015a; van Dokkum et al., 2015c; Koda et al., 2015).
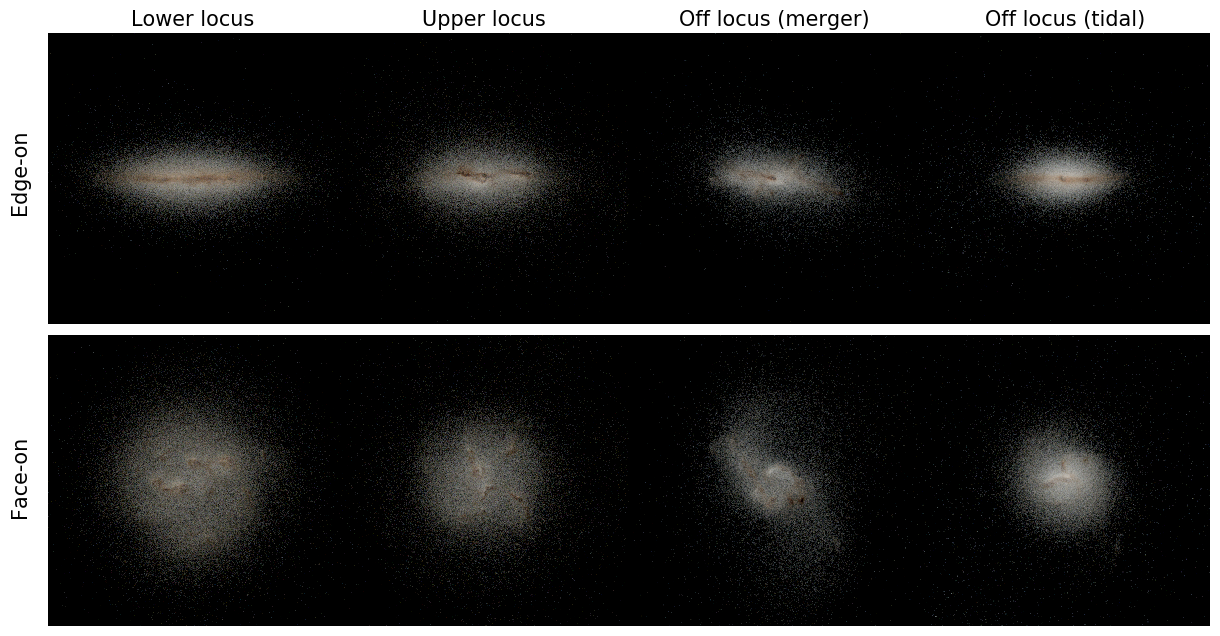
However, the inset in Figure 1 indicates that a large number of dwarf galaxies in NewHorizon, particularly in the low and intermediate mass bins, have surface brightnesses and effective radii that make them consistent with the definition of UDGs in the observational literature. UDGs are, therefore, a normal component of the dwarf galaxy population at low surface brightnesses. Note that since NewHorizon does not contain any clusters, a clear prediction is that UDGs should exist in large numbers in groups and the field and should be routinely detectable in new and future deep surveys such as the Hyper Suprime-Cam Subaru Strategic Program (HSC-SSP Aihara et al., 2019) and the Legacy Survey of Space and time (LSST) on the Vera C. Rubin Observatory (Robertson et al., 2019). In Figure 2 we present mock images of typical galaxies that occupy different regions of the locus, created using the SKIRT9 code (Baes & Camps, 2015), which employs full radiative transfer based on the stars and gas within a galaxy.
While we study the galaxy population in terms of intrinsic surface brightness for our analysis in Sections 4 and 5, we use the attenuated surface brightness for our comparison to observations below. In Figure 3 we compare the predicted surface brightness vs. stellar mass plane in NewHorizon to that from recent work that uses the SDSS Stripe 82, which is 2 mags deeper than standard-depth SDSS imaging (Sedgwick et al., 2019a; Sedgwick et al., 2019b). Sedgwick et al. use a novel technique that allows them to identify LSBGs that do not appear in the pipeline-constructed galaxy catalogue in the IAC Stripe 82 Legacy Project (Fliri & Trujillo, 2016) because they are too faint. They achieve this by identifying a sample of galaxies using core-collapse supernovae (CCSNe). Using custom settings in SExtractor (Bertin & Arnouts, 1996) they then extract the host galaxies of these CCSNe, many of which are not detected by the original SDSS Stripe 82 pipeline or by the IAC Stripe 82 legacy survey. The resultant sample is free of incompleteness in surface brightness in the stellar mass range M⋆ > 108 M⊙, with a host being identified for all 707 CCSNe candidates at . Of this sub-sample, 251 are spectroscopically confirmed CCSNe, with the remainder classified from the shape of their light-curves (see Sako et al., 2018). This sample is well-suited to a comparison with NewHorizon, both due to its high completeness at low surface brightness and also because we can relatively easily model the selection function and apply it to our simulated dataset.
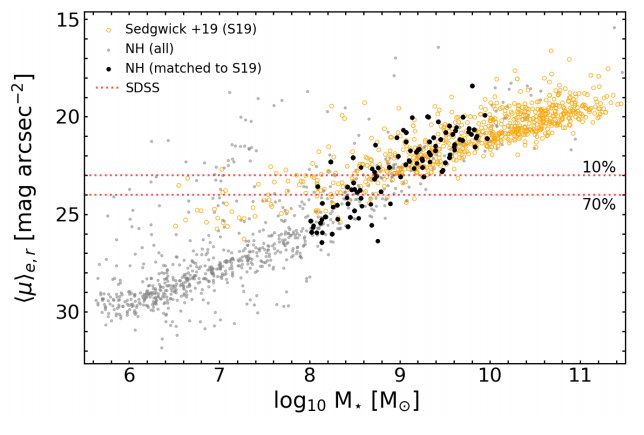
Since the detectability of the Sedgwick et al. (2019b) galaxies depends on them hosting CCSNe, and therefore hosting star formation activity, we restrict our comparison to a subset of star-forming NewHorizon galaxies. The associated selection probability is correlated with the star formation rate (SFR), because the SFR determines the rate of CCSNe. We create a matching sample to the one from Sedgwick et al. (2019b) by drawing galaxies with a weight proportional to the normalised probability distribution in SFR. For the comparison in the plane, we calculate the surface brightness of each NewHorizon galaxy as described in Section 2.5. We additionally implement dust attenuation via a screen model using the SUNSET code (see Kaviraj et al., 2017). Figure 3 shows that the predicted surface brightness vs. stellar mass plane in NewHorizon corresponds well to that in the observations in the stellar mass range where the Sedgwick et al. galaxies are complete (recall that the simulation is not calibrated to produce galaxy surface brightnesses). The flattening seen in the observations is due to high levels of incompleteness at M⋆ < 108. The good overlap between the NewHorizon galaxies and the Sedgwick et al. data suggests that, while the prescriptions used to describe baryonic processes in NewHorizon (e.g. SN feedback) are largely tuned to higher mass galaxies, they offer a reasonable representation of these processes also in the low-mass regime.
Finally, it is worth noting that the surface-brightness limits of many past benchmark wide-area surveys lead to high levels of incompleteness in the low-mass regime. The dotted lines in Figure 3 indicate the galaxy completeness limits for standard-depth SDSS imaging in the local Universe (Blanton et al., 2005). Note that no evolution correction is applied to modify these completeness limits for (the redshift of the NewHorizon galaxies). At an effective surface brightness of 24 mag arcsec-2 the galaxy completeness in SDSS is only 10 per cent. Indeed, the NewHorizon locus indicates that at M⋆ < 108 M⊙, the overwhelming majority of galaxies in the nearby Universe are undetectable in surveys like the standard-depth SDSS, with only those objects that depart strongly from the locus towards very high surface brightnesses likely to be present in such datasets at all. As we show in Section 5, these off-locus systems host anomalous levels of star formation triggered by a recent interaction, making them highly unrepresentative of the general galaxy population in these mass regimes. Therefore, caution needs to be exercised about drawing conclusions about galaxy evolution in general using low-mass galaxies that are detected in shallow, wide-area surveys on which our understanding of the extra-galactic Universe is currently predicated. It is worth noting that future deep-wide surveys like the HSC-SSP and LSST (which have limiting surface brightnesses of 31.5 mag arcsec-2 in their deepest layers), should offer 100 per cent completeness for galaxies at least down to M⋆ 107 M⊙ in the nearby Universe, providing a revolutionary increase in discovery space over past wide surveys like the SDSS.
4 Galaxy evolution as a function of surface brightness: the impact of different processes
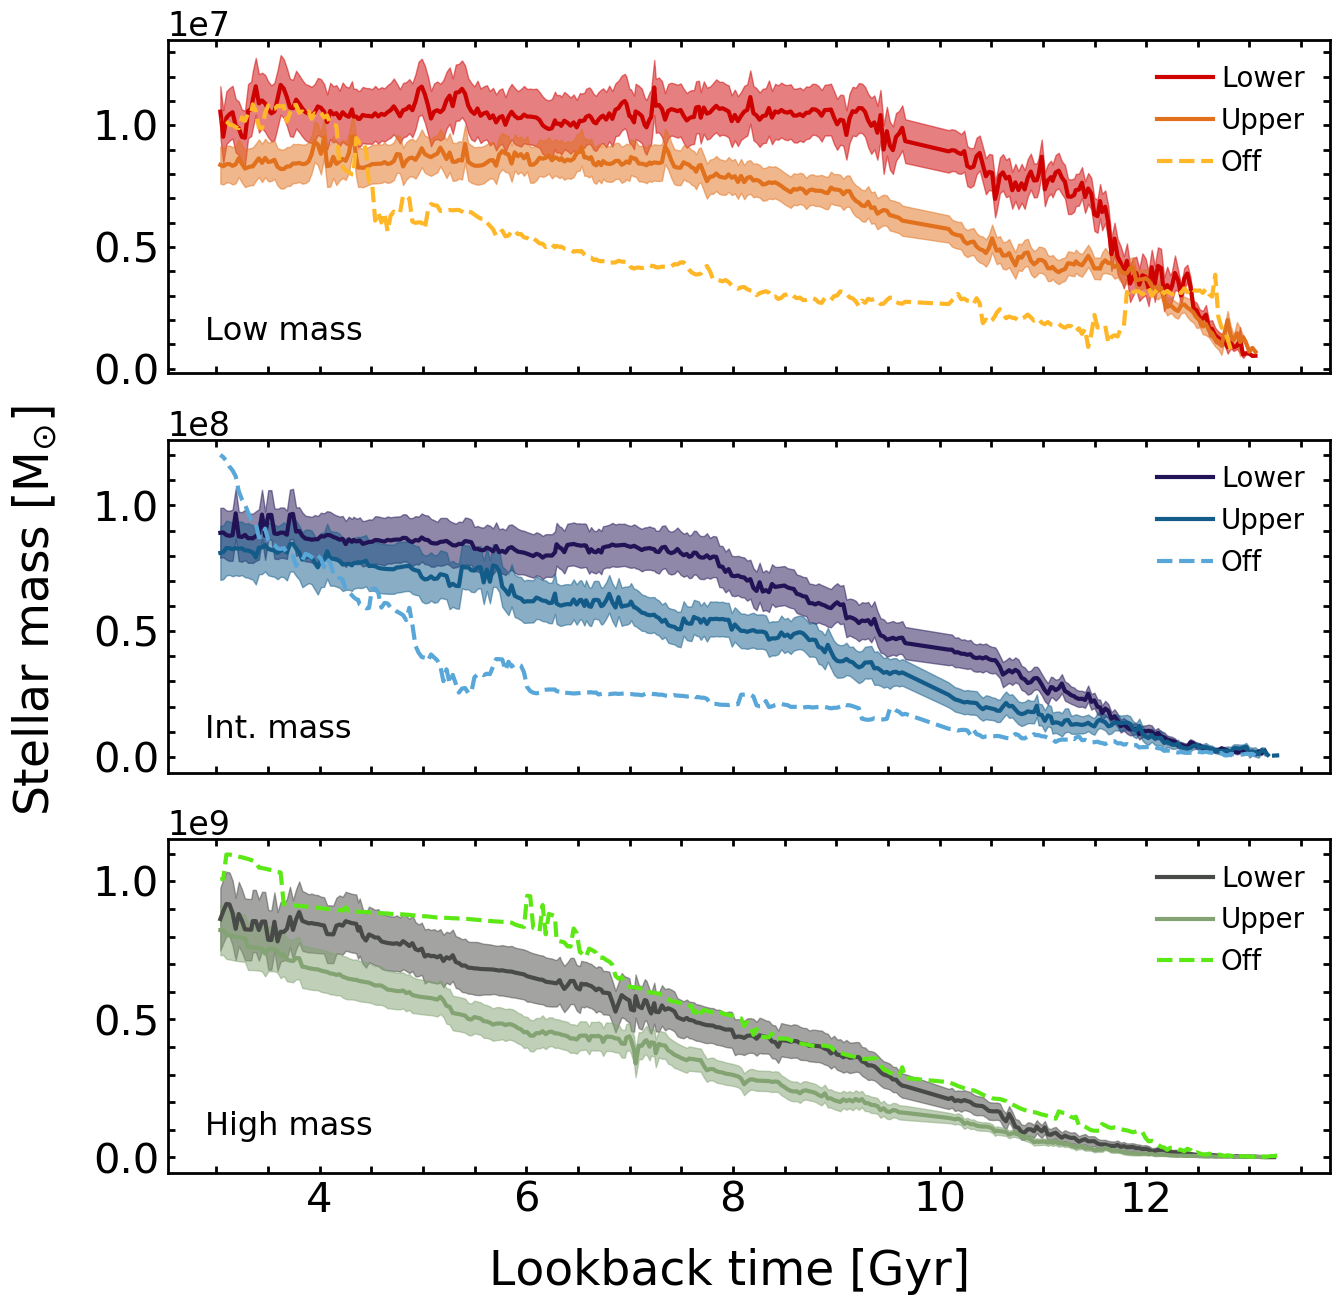
The analysis that follows studies the impact of different processes on the progenitors of galaxies in the different zones described in Figure 1, in order to explore how this main locus of objects forms over cosmic time. Recall that we split the locus into ‘low’, ‘intermediate’ and ‘high’ mass bins that cover the mass ranges 106.5 M⊙ M⋆ 107.5 M⊙, 107.5 M⊙ M⋆ 108.5 M⊙ and 108.5 M⊙ M⋆ 109.5 M⊙ respectively. Each mass bin then split into upper, lower and off-locus zones. The upper and lower zones are defined by the brighter and fainter halves of the locus respectively and off-locus objects are those that scatter to higher surface brightnesses beyond the upper locus. In all the plots that follow, the colour coding of the median lines and error regions corresponds to the colours of the zones in Figure 1. Given the small number of off-locus galaxies in any mass bin we do not show error regions for this population for clarity. In this section, we focus on galaxies that reside on the main locus. We study the formation of off-locus galaxies in Section 5.
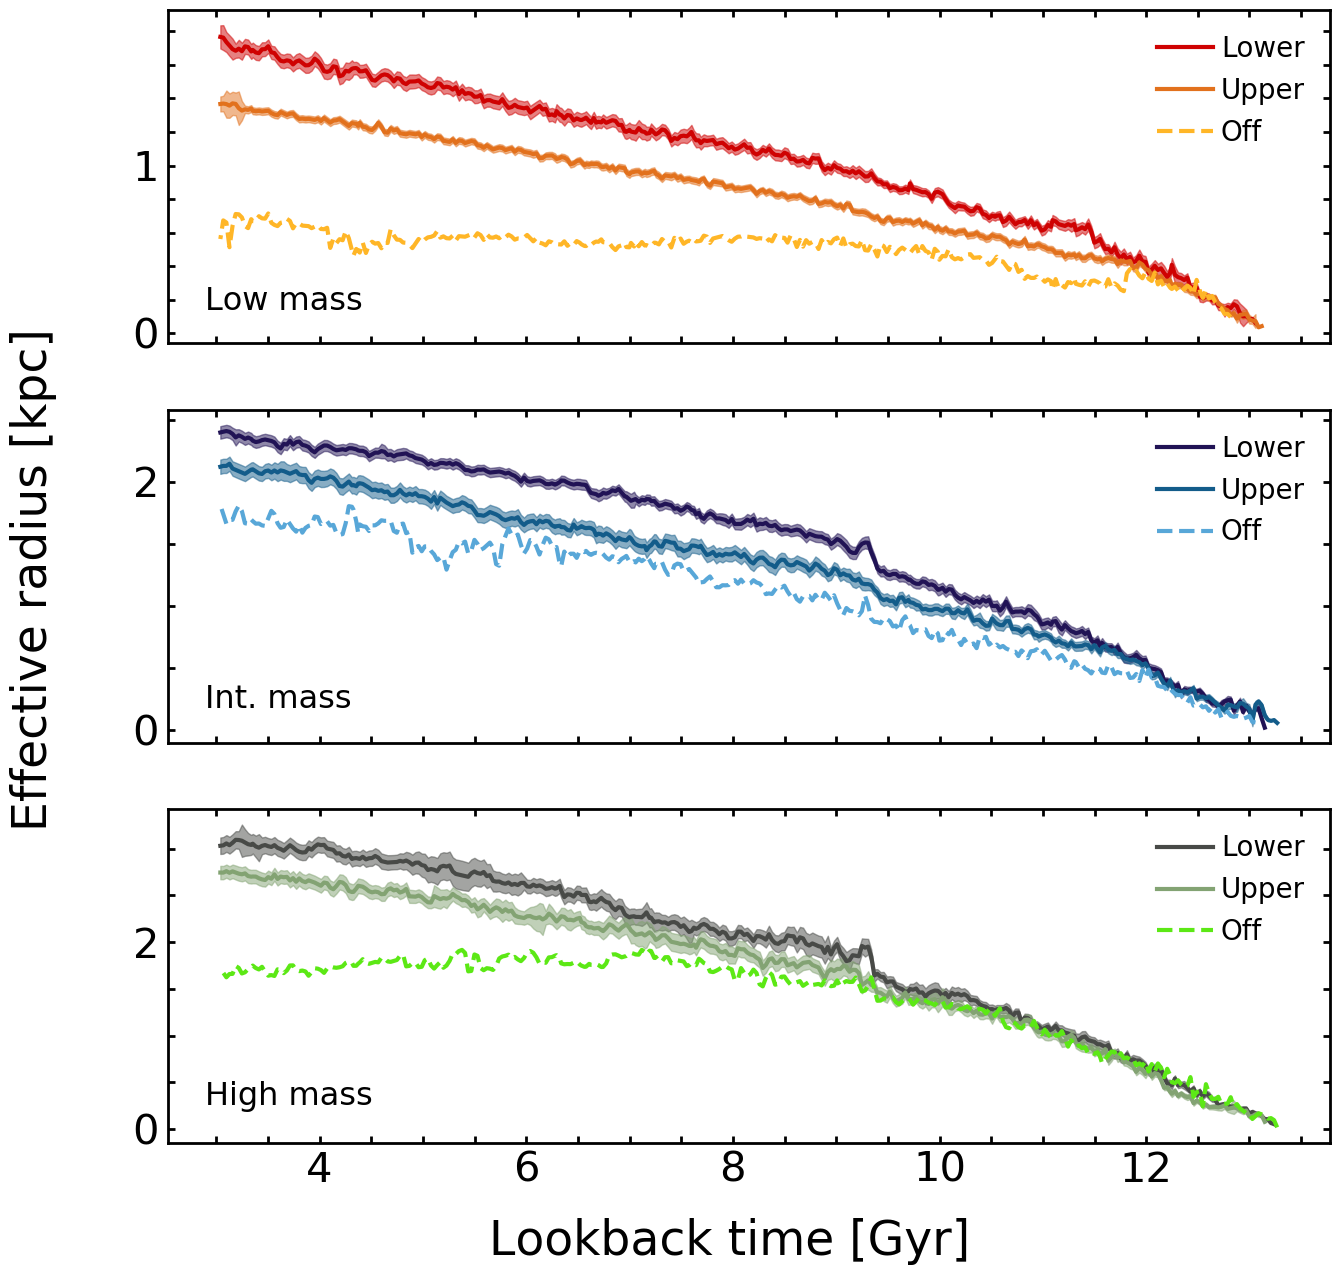
We begin by exploring, in Figures 4, 5 and 6, the evolution of the median stellar mass, effective radius and surface brightness of galaxies in different zones within the locus across cosmic time. At a given stellar mass, galaxies in the lower locus show a stellar assembly bias relative to those in the upper locus, in the sense that their stellar mass assembly takes place at earlier epochs, as shown in Figure 4. The median effective radius of galaxies (Figure 5) in the lower locus increases faster than their upper locus counterparts at all epochs, including the epoch where the stellar assembly bias is most pronounced. It is worth noting that starbursts typically add new stars to the central regions of galaxies and thus act to reduce the effective radius, opposite to the trend seen in Figure 5. This suggests that, in the early Universe, the processes that drive the stellar assembly bias are also responsible for the differential evolution in median effective radius between the upper and lower locus galaxies.
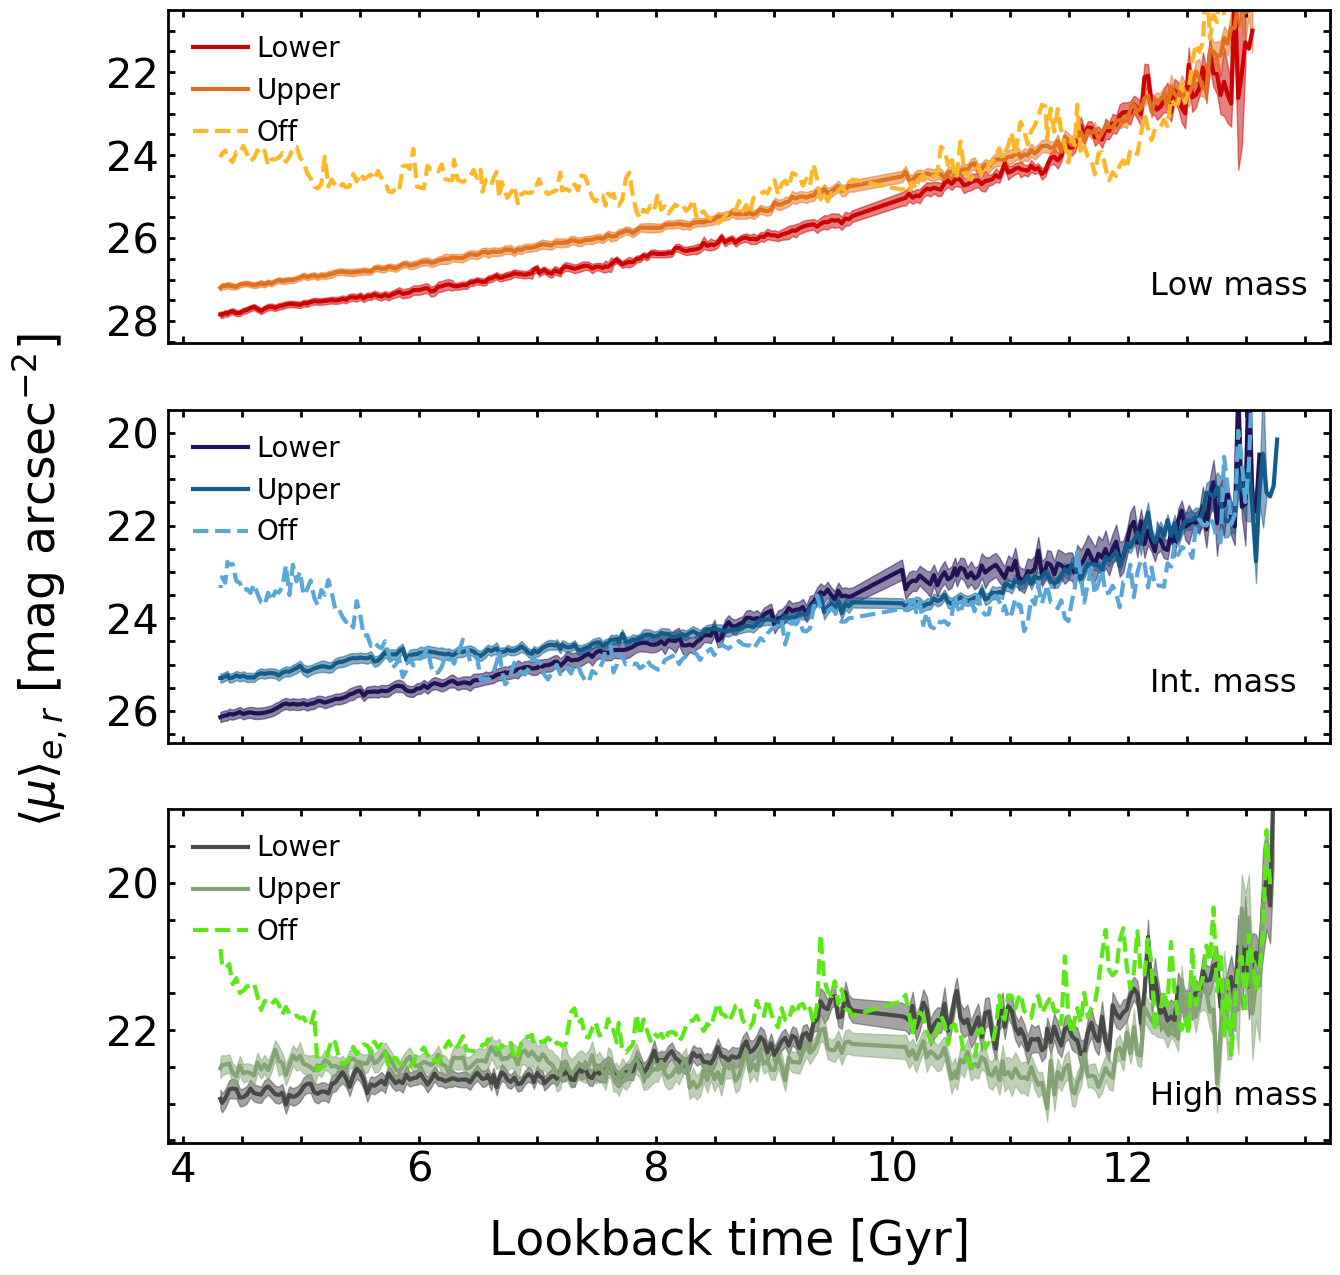
Figure 6 shows the evolution of surface brightness for galaxies in different zones of the locus. The eventual divergence in surface brightness between the upper and lower locus populations (in all mass bins) is delayed compared to that in the stellar mass and effective radius, because the increase in radius is initially compensated for by the more rapid buildup of stellar mass. It is worth noting that the point at which the divergence in surface brightness takes place shows a dependence on stellar mass, with the divergence taking place later at higher stellar masses. This suggests that the depth of the potential well provides a stabilising influence against the processes that drive the surface brightness divergence between upper and lower locus galaxies.
Both these points imply that the width of the locus i.e the surface brightness separation between the upper and lower locus galaxies is likely to be driven by the assembly history of galaxies, with those forming their stellar mass earlier residing at fainter surface brightnesses at the present epoch. Therefore, in order to explain the position of galaxies in the locus, we need to understand the processes responsible for the divergence in stellar mass and effective radius of the upper and lower locus populations. These processes can be either internal or external. Internal mechanisms include feedback from either SN or AGN (or both). External processes include tidal perturbations (including mergers) and ram pressure. In the sections below, we consider how each of these processes affect galaxies, in order to identify the principal processes that determine the position of galaxies in the locus at .
4.1 Differential supernova feedback at early epochs - initiating the divergence in surface brightness
Given the coincidence of stellar assembly bias and the differential increase in the median effective radius of the upper and lower locus populations, we begin by considering the role of SN feedback in the surface brightness evolution of galaxies. Previous theoretical work has shown that, particularly at low stellar masses, where gravitational potential wells are shallow, SN feedback is capable of driving gas outflows (e.g. Dubois & Teyssier, 2008; Di Cintio et al., 2017; Chan et al., 2018) which make the density profiles of the gas, and the stars that form from it, shallower (e.g. Martin et al., 2019). The shallower stellar profiles naturally lead to more diffuse systems which have lower surface brightness.
In order to calculate SN feedback we define the total mechanical and thermal energy released by stellar processes between two timesteps, and , by summing the energy released by each star particle in a galaxy within this interval:
| (2) |
where is the mass of an individual star particle and is the cumulative mechanical and thermal energy released by that star particle, as a result of Type II SN, between the time of its formation and a redshift .
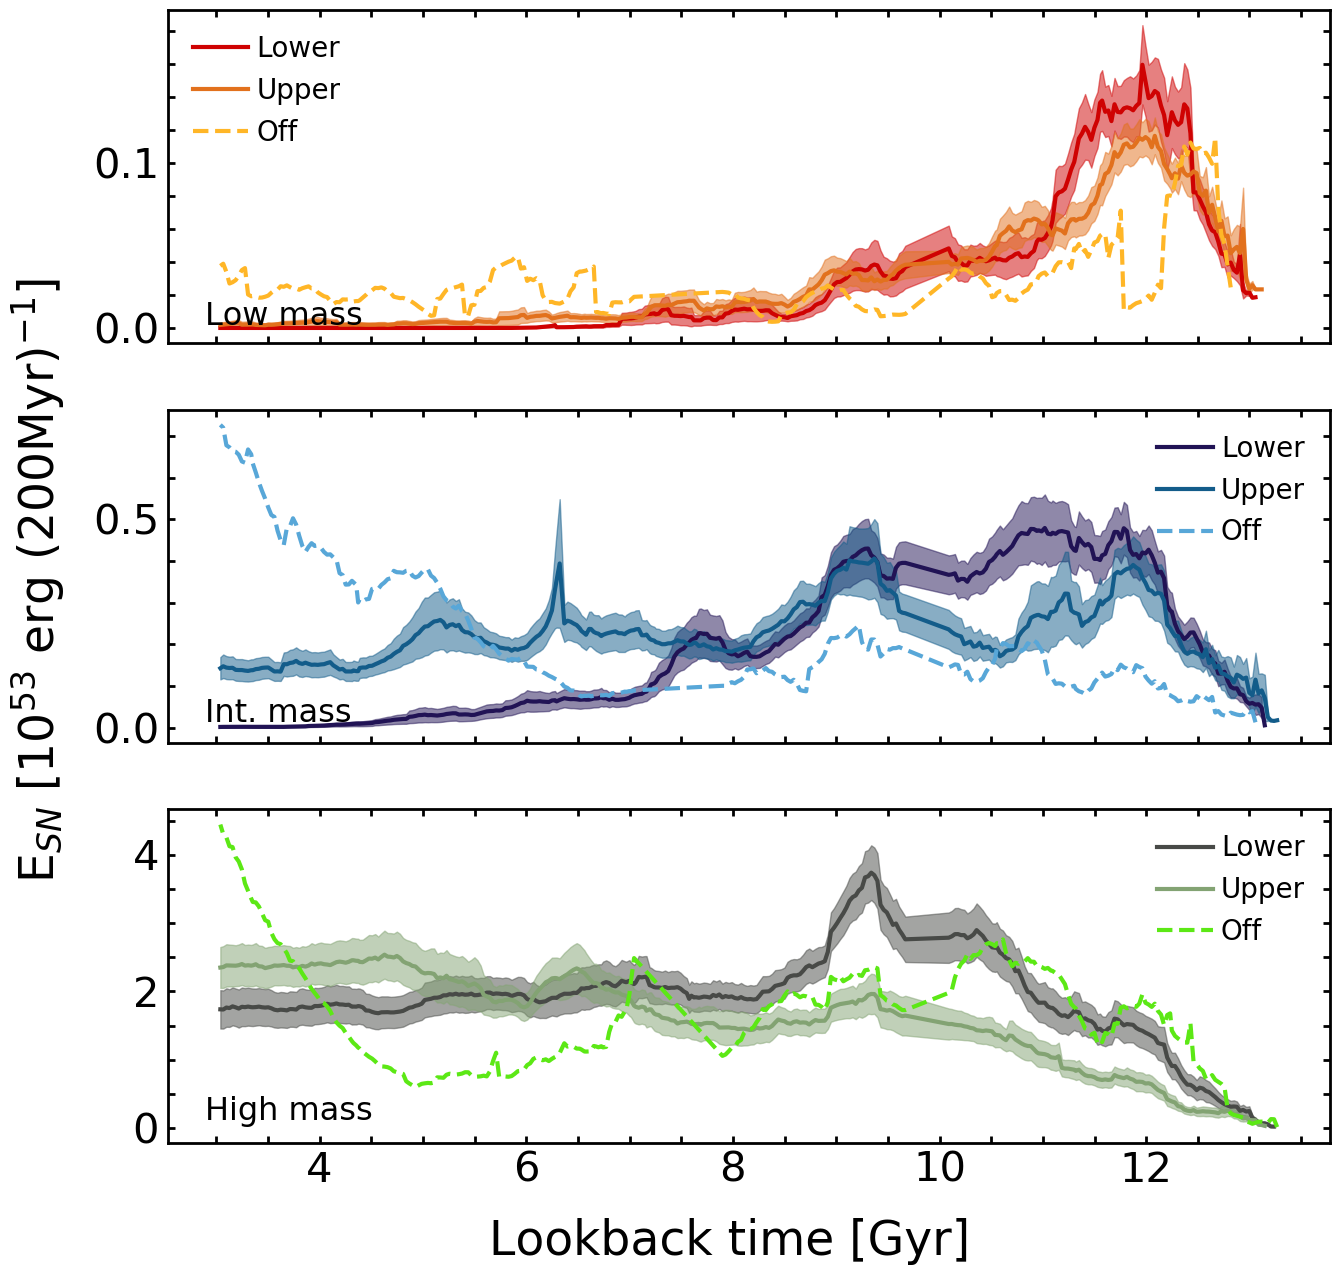
In Figure 7, we show the evolution of the SN feedback energy for galaxies in different zones of the locus. We find that galaxies which end up with fainter surface brightnesses (i.e. those in the lower locus) show higher levels of SN feedback at earlier times, regardless of the mass bin being considered. This correlates with the stellar assembly bias seen in Figure 4. Note also that the stellar assembly bias occurs earlier at lower stellar masses, which is mirrored in the SN feedback being more pronounced at earlier epochs in lower mass bins.
We proceed by exploring how this difference in SN feedback drives the evolution in the stellar mass, effective radius and surface brightness of galaxies shown in Figures 4, 5 and 6. Recall that the stellar effective radii of upper and lower locus galaxies begin diverging in the early Universe (Figure 5), around the epochs when there is a divergence in the SN feedback energy. This suggests that the SN feedback is likely to be impacting the gas reservoir in such a way as to drive the increase in the median effective radius.
For example, Martin et al. (2019) have shown that in the massive (M⋆ 109 M⊙) galaxy regime, SN feedback acts to rapidly make the gas distribution shallower, by moving material from the central regions of the galaxy towards the outskirts (see also Governato et al., 2007). If the gas is not completely removed, new stars forming from this gas make the stellar distribution progressively shallower over time. In this mass regime at least, earlier SN feedback is central to the formation of galaxies which exhibit lower surface brightnesses at the present day.
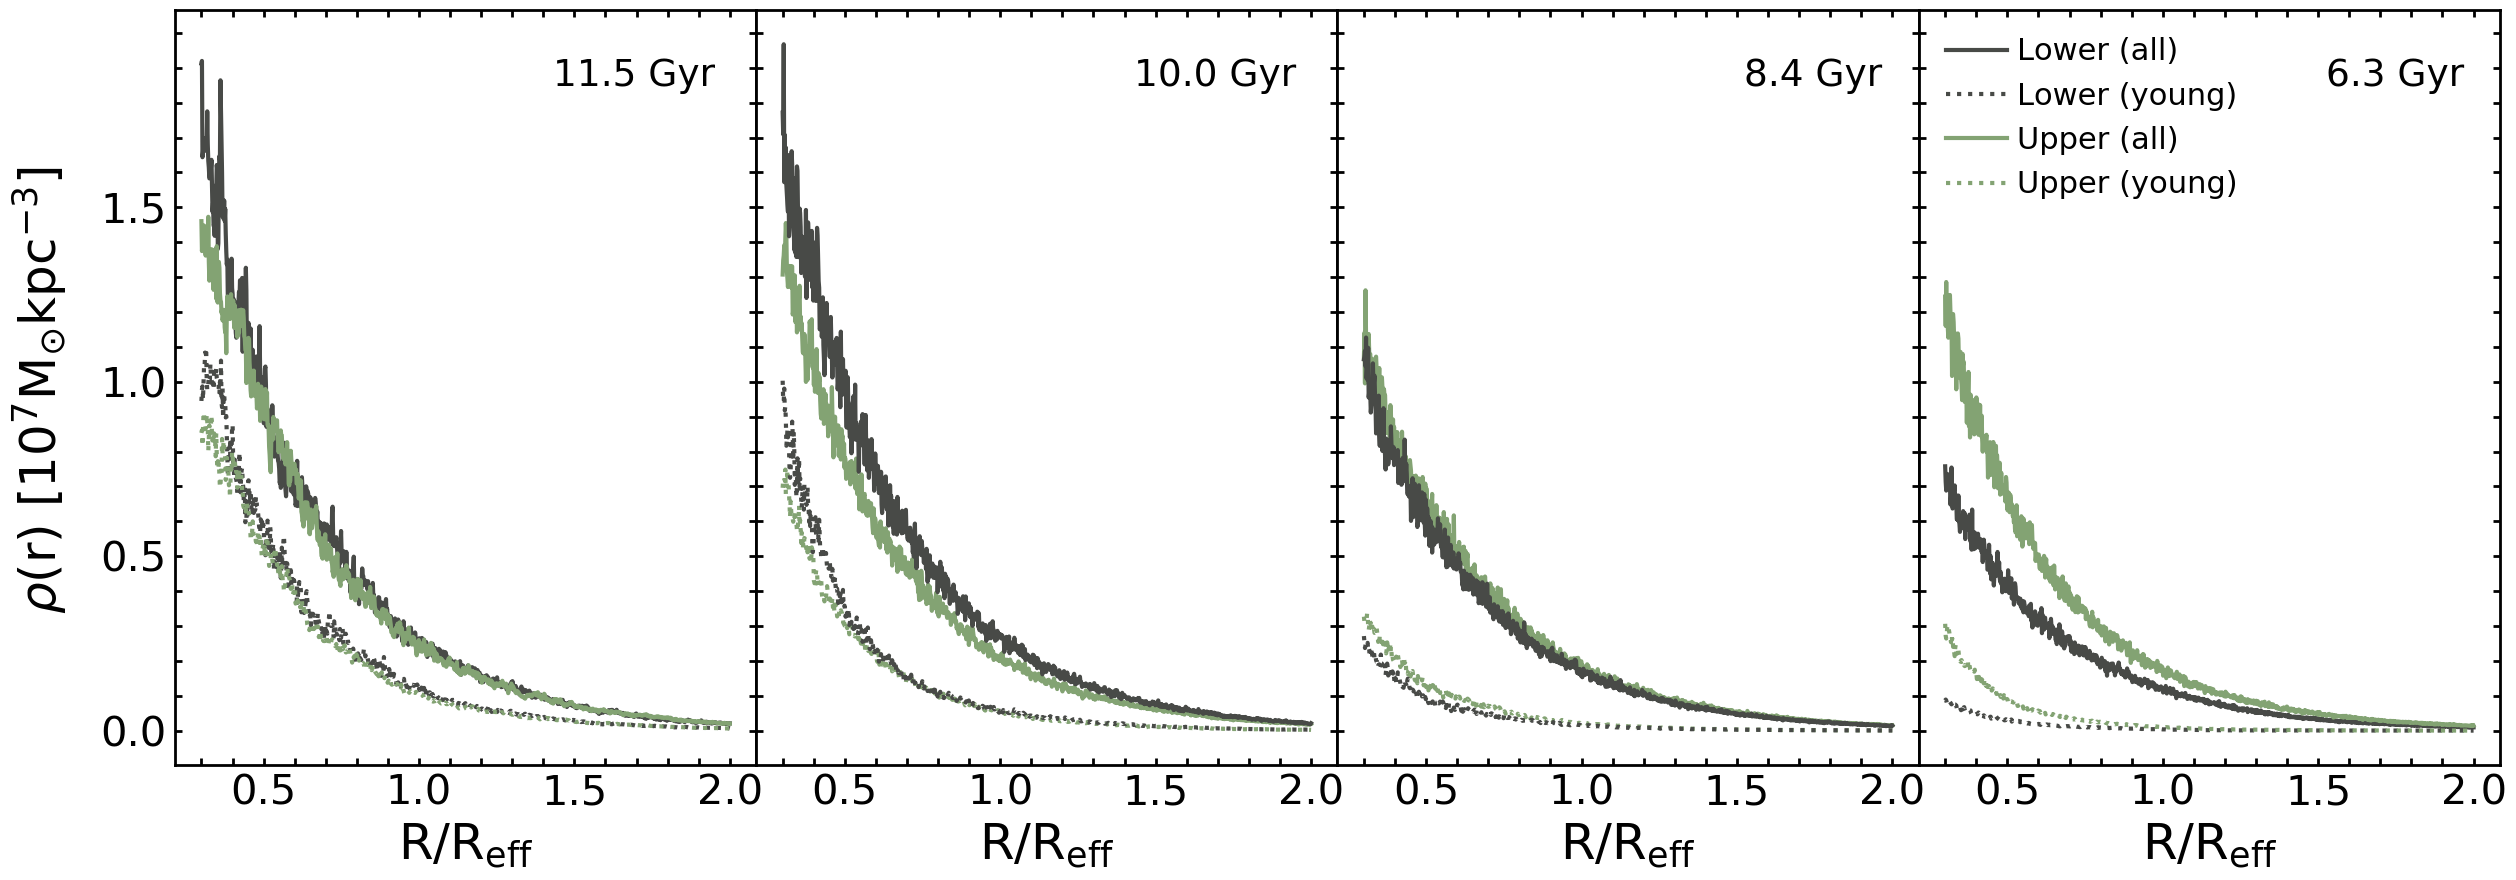
We now consider whether a similar process operates in the dwarf galaxy regime. While galaxies in all mass bins show similar behaviour, we first demonstrate the impact of SN feedback graphically, by showing the evolution of the stacked stellar density profiles in the high mass bin. Figure 8 shows how the stacked stellar density profiles of all stars and that of young stars (ages < 100 Myr), which trace the star-forming gas, evolve across the epoch of divergence in SN feedback energy.
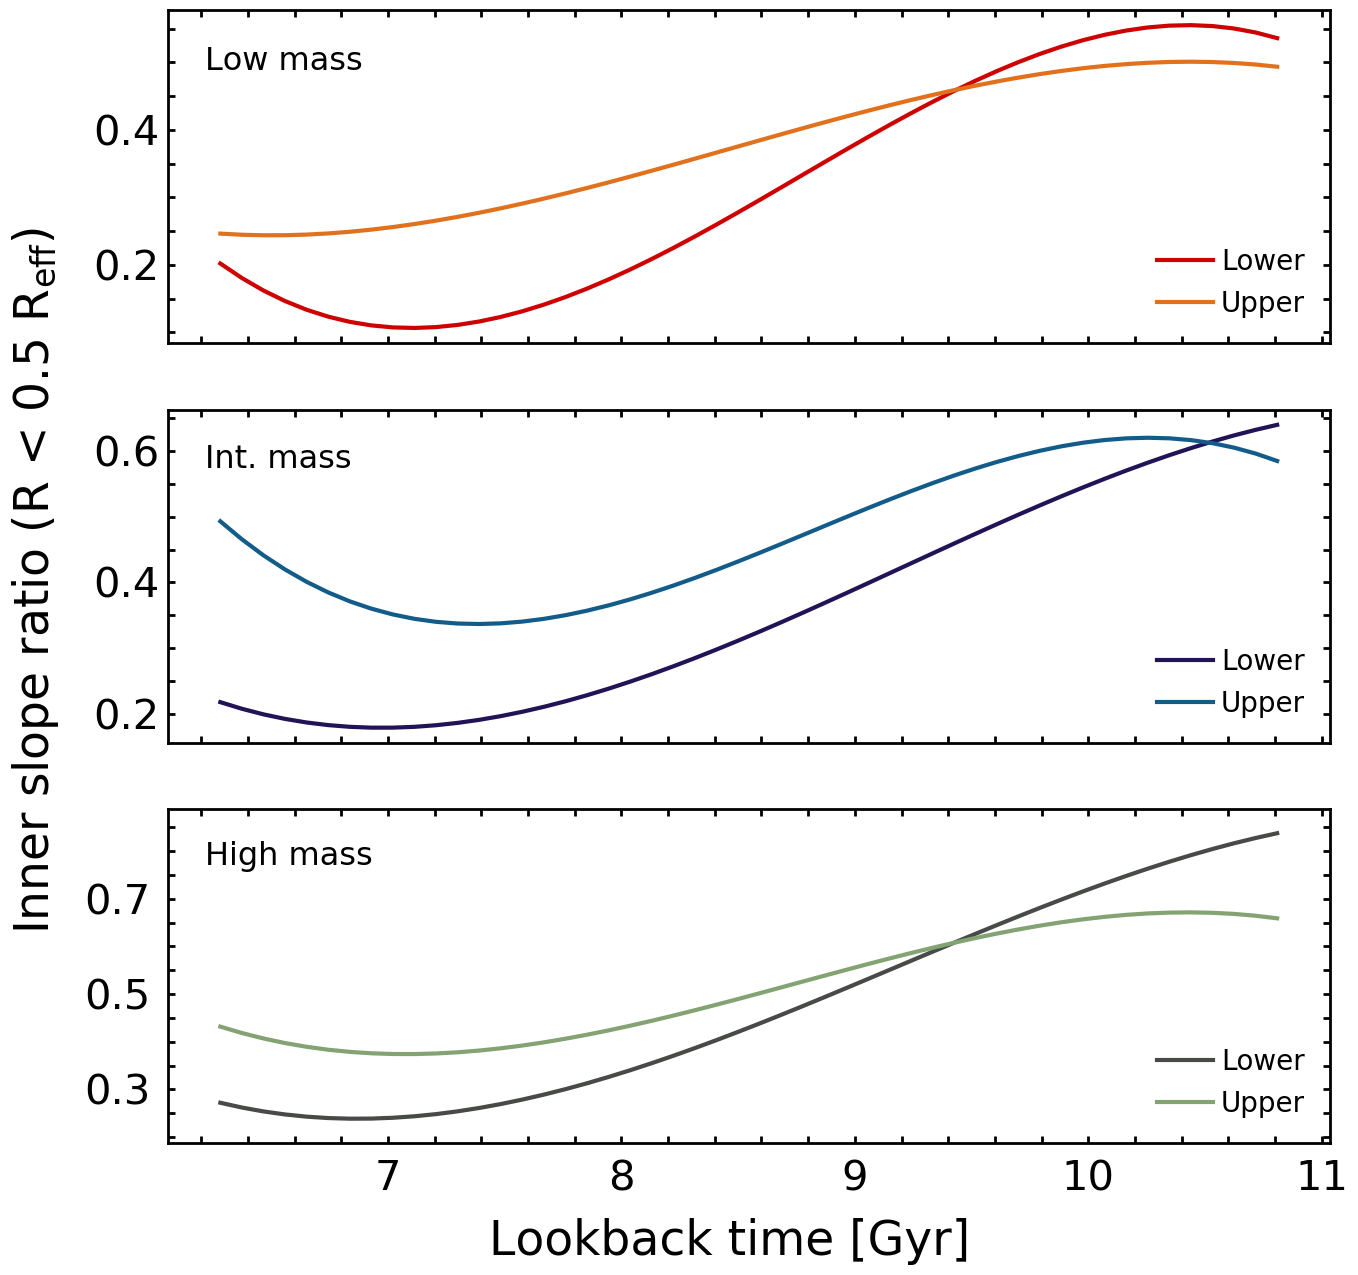
The more rapid star formation in lower locus galaxies at early epochs causes both the normalisation and the slope of the stacked young-star density profiles to decrease faster than in their upper locus counterparts, as star-forming gas is displaced from the centre towards the outskirts at a faster rate. As the systems evolve, progressive generations of young stars with flatter profiles will then drive a flattening of the overall stellar profiles. To quantify this, we fit a straight line to the inner 0.5 Reff of each density profile (where the profile is roughly linear) and calculate the ratio in the slopes of the density profiles between the young stars and the total stellar population. As shown in Figure 9, the ratio of the slopes between young and all stars is smaller in lower locus galaxies for most of cosmic time (regardless of the mass bin being considered). This indicates that the density profiles of the young stars flatten faster in lower locus galaxies than in their upper locus counterparts. This, in turn, flattens their total stellar profiles faster, which is reflected in lower locus galaxies growing their effective radii more rapidly than their upper locus counterparts (Figure 5).
While initially the enhanced star formation in lower locus galaxies counteracts their larger effective radii and keeps their surface brightnesses similar to their upper locus counterparts, as star formation activity decreases in the lower locus (Figure 7), the two populations diverge rapidly in surface brightness (Figure 6). While this trend is the same in all mass bins, the divergence in the level of star formation occurs later at higher masses (Figure 7), and so the divergence in surface brightness also takes place at later epochs. Lower locus galaxies can be thought of as somewhat rarer events (in the peak background split sense, e.g. Schmidt et al., 2013) that start to form stars ‘too early’ for the depth of their potential wells to counteract the energy release of the first round of supernovae in these galaxies.
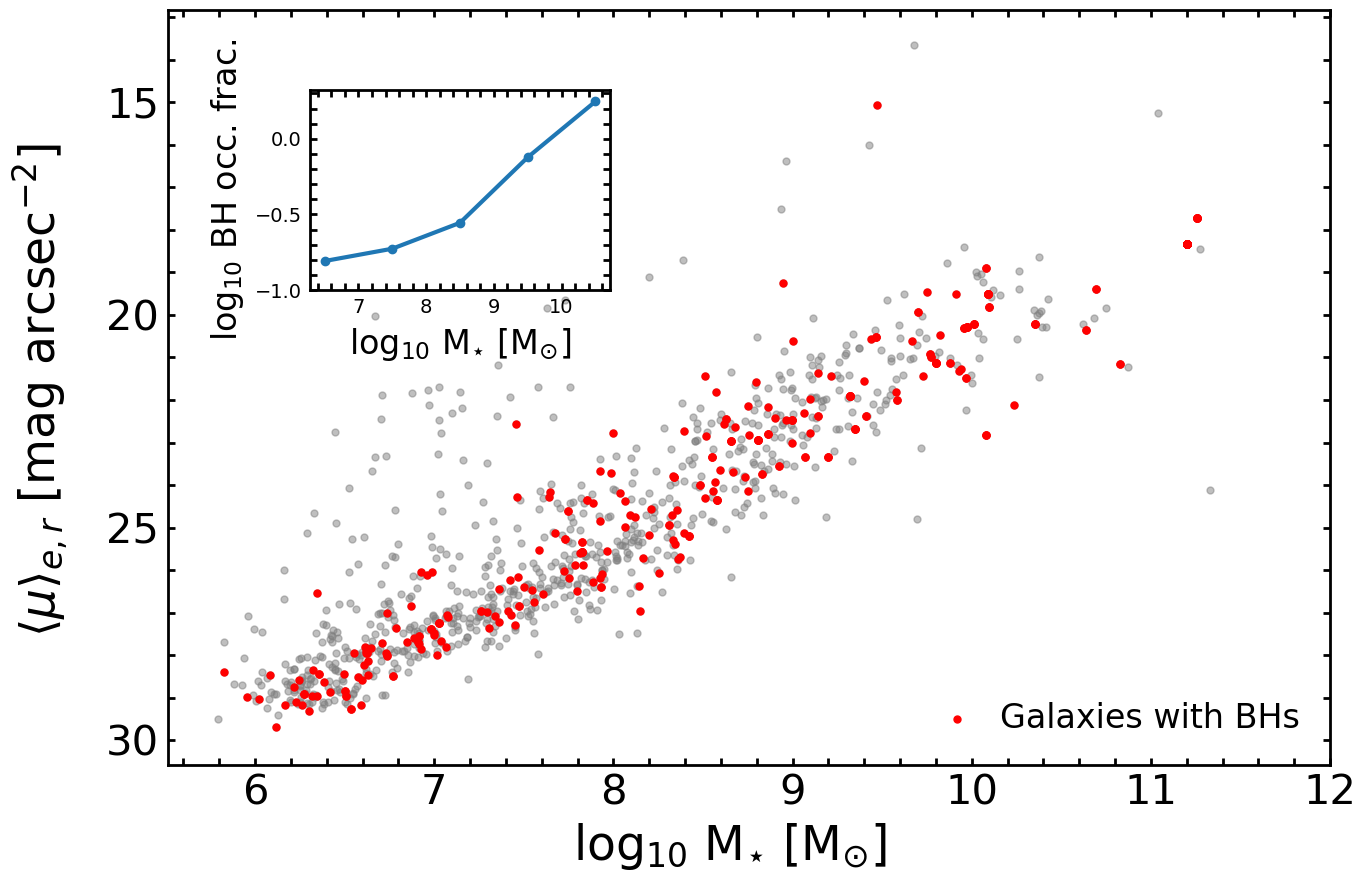
While the role of SN feedback in initiating the surface brightness divergence is clear, we conclude this section by considering whether another internal process, AGN feedback, may contribute to this process. In Figure 10 (main panel) we show the location of galaxies that have central super-massive BHs (red points), compared to galaxies that do not (grey points). In the inset, we show the occupation fraction of central BHs in galaxies (defined as a galaxy having at least one BH within 1 Reff) as a function of stellar mass. In the low-mass regime, which is our mass range of interest, only a small fraction of galaxies actually host BHs (the BH occupation fractions are around 10 per cent for M⋆ 108 M⊙). It is worth noting that BHs that do exist in dwarf galaxies exhibit very little growth (e.g. Volonteri et al., 2020; Dubois et al., 2020). Finally, galaxies with BHs do not occupy a preferential position in the locus. Taken together, this indicates that only a small minority of dwarf galaxies in NewHorizon have central BHs, and that those that do, do not occupy a preferential location in the locus and show very little growth (and therefore little potential for AGN feedback). Thus AGN feedback does not play a role in determining the position of galaxies in the locus.
4.1.1 A cosmological trigger for the stellar assembly bias: higher local dark matter density driving higher gas accretion rates
In the previous section, we showed that galaxies that lower locus galaxies (i.e. those that end up with lower surface brightnesses at late epochs) are those that experience an earlier phase of more intense star formation. While this earlier stellar assembly is ultimately responsible for driving the initial divergence in surface brightness, we now explore the factors that are responsible for causing this bias in the first place. A faster stellar assembly implies a greater availability of gas. Thus, we explore the local environmental densities around lower and upper locus galaxies, at the epochs where the SN feedback energy diverges, since denser local environments will likely induce larger inflows of gas which can trigger stronger star formation.
In Table 1, we show the local DM density, on scales of 15 Rvir around each galaxy’s halo, just before the epoch at which the SN feedback divergence takes places (lookback times of 11.9 Gyrs, 11.5 Gyrs and 11 Gyrs for the low, intermediate and high mass bins respectively). In all mass bins, lower locus galaxies reside in regions of higher average dark-matter density. The local DM densities in the lower locus galaxies are elevated by 22, 58 and 57 per cent in the low, intermediate and high mass bins respectively. The gas inflow rates into this 15 Rvir region are, in turn, elevated by 55, 48 and 63 per cent respectively. Note that these trends remain unchanged if we calculate local DM density on different spatial scales around the galaxies (e.g. 10 Rvir, 20 Rvir etc.).
Lower locus galaxies are, therefore, born in regions of higher DM density, which enables them to access gas at a faster rate at earlier epochs. This faster gas accretion rate then drives the faster stellar assembly in the lower locus systems, leading to increased SN feedback and a faster increase in their effective radii. It is worth noting that, the idea that the density of the local environment in which dwarf galaxies form may imprint itself on their star formation histories, has been previously postulated for galaxies in the local group (e.g. Gallart et al., 2015). Our work shows that this is a general property of dwarf galaxies and not a specific feature of dwarfs in the local group.
| Lower:upper locus ratio | Low mass | Int. mass | High mass |
|---|---|---|---|
| DM density | 1.220.16 | 1.580.22 | 1.570.28 |
| Gas inflow rate | 1.550.05 | 1.480.06 | 1.630.08 |
Finally, it is worth exploring whether the higher DM densities experienced by lower locus galaxies are due to them residing in special locations in the cosmic web, or whether lower locus galaxies are simply sampling higher values of the local dark matter density distribution. We use the skeleton, described in Section 2.4, to check whether the locations of lower locus galaxies vary systematically from their upper locus counterparts. However, we find that both populations show similar distances to both the nearest nodes and filaments, indicating that, on average, the positions of upper and lower locus galaxies in the cosmic web are very similar. Note that, since our sample only includes galaxies that survived accretion on to more massive galaxies down to , it may be potentially biased towards objects that are born relatively further from the densest regions of the skeleton, since such systems will have a lower probability of merging with a larger galaxy (e.g. Borzyszkowski et al., 2017; Musso et al., 2018).
Our analysis has shown that the differences between the upper and locus galaxies are driven by the fact that their progenitors sample different parts of the local dark matter density distribution in the Universe at early epochs. The stellar assembly bias which drives the divergence in galaxy surface brightness at fixed stellar mass, and therefore the width of the main locus at (Figure 1), essentially has a purely cosmological trigger.
4.2 Tidal perturbations and ram pressure: external processes that influence dwarf galaxy evolution at late epochs
At late epochs, the level of star formation in lower locus galaxies subsides and SN feedback activity in these systems falls below the levels seen in their upper locus counterparts (Figure 7). Nevertheless, the effective radii of lower locus systems keeps growing faster than in their upper locus counterparts (Figure 5). The continued divergence in surface brightness between the two populations at late epochs (Figure 6) is thus driven both by lower locus galaxies forming stars at a slower rate and growing their effective radii more rapidly than their upper locus counterparts. Most importantly, since the star formation activity in the lower locus galaxies is now less intense, the evolution in their radii must be driven by external processes and not by internal mechanisms like SN feedback.
The two key external processes that can influence galaxy evolution are tidal perturbations (including mergers) and ram pressure. Strong tidal perturbations from events like close fly-bys and mergers can trigger star formation. Sustained tidal perturbations over a long period of time can heat stars and gas, puffing up galaxies and reducing their star formation rate (Martin et al., 2019). Sustained ram pressure typically acts to strip the internal gas reservoir of the galaxy as it transits through a dense medium, reducing its star formation rate (e.g. Hester, 2006).
Following Choi et al. (2018) and Martin et al. (2019) we define a dimensionless ‘perturbation index’ (PI) that quantifies the cumulative, ambient tidal field around a galaxy:
| (3) |
where is the stellar mass of the galaxy in question and is its effective radius, is the stellar mass of the th perturbing galaxy and is the distance from the th perturbing galaxy. We consider all perturbing galaxies within 3 Mpc of the object in question.
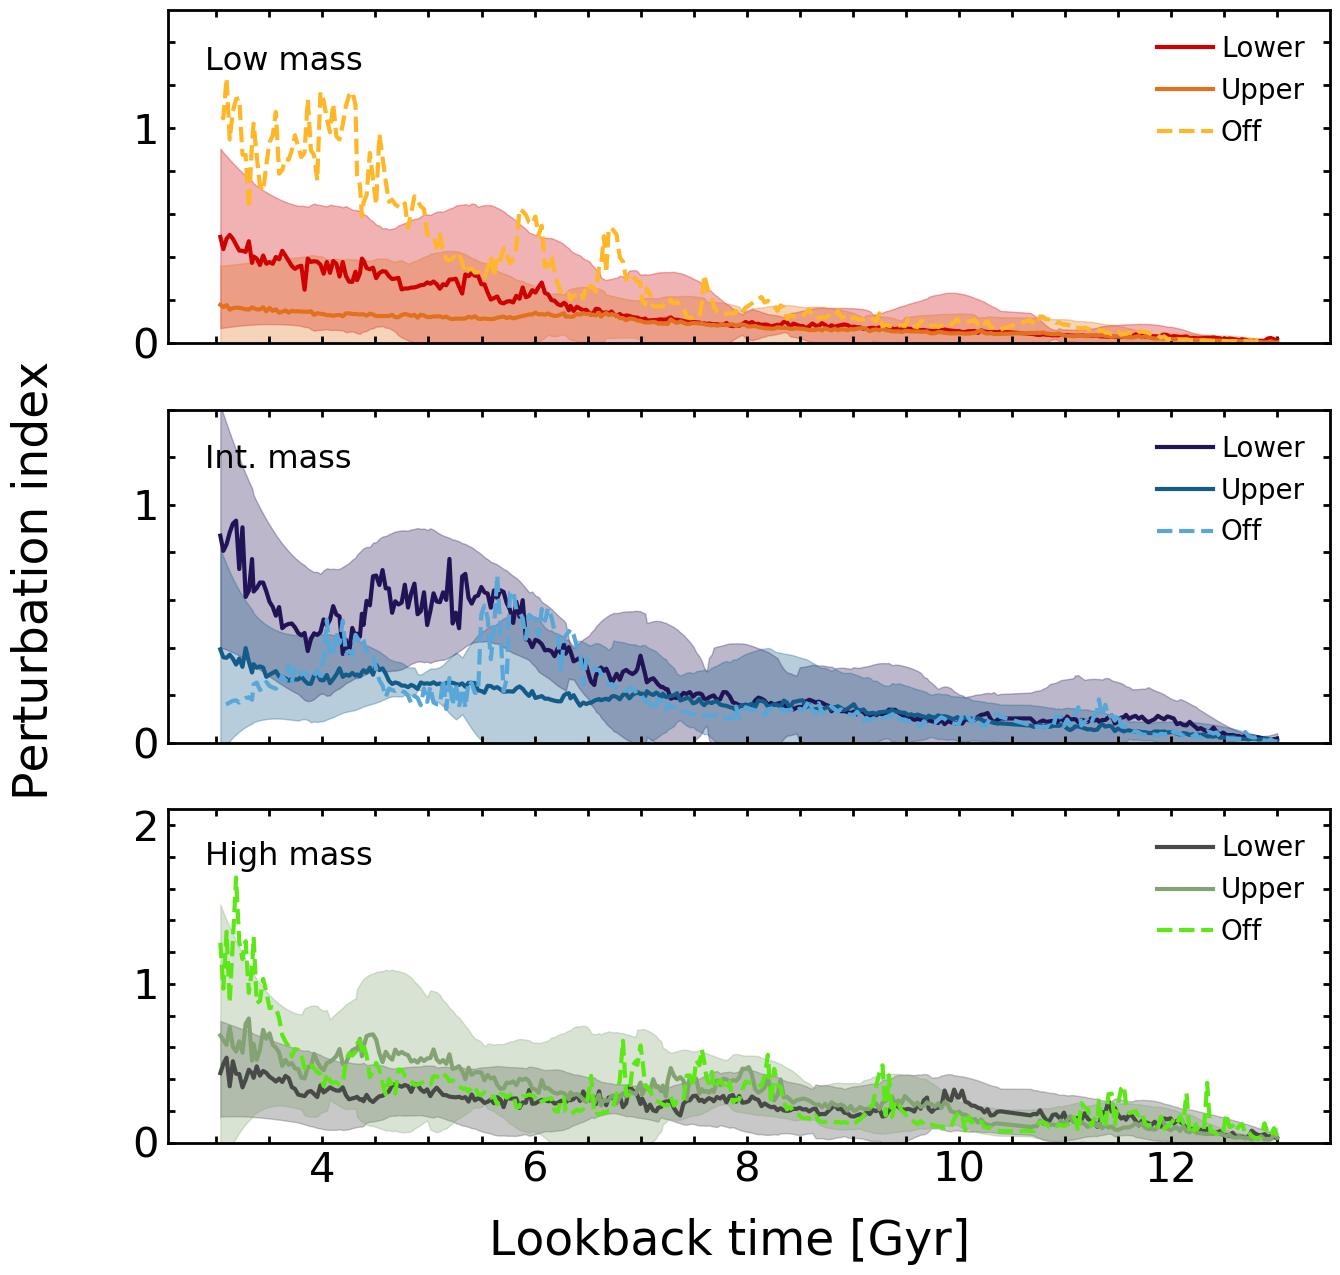
Figure 11 shows the evolution of the median PI with look-back time. We find that in all mass bins, galaxies that reside in different zones of the locus experience very similar tidal perturbations at high redshift. Therefore, perturbations caused by the ambient tidal field do not contribute to the early divergence in surface brightness. However, in the low and intermediate mass bins, lower locus galaxies show higher values of PI at late epochs (likely driven by the fact that these galaxies are born, and remain in, regions of higher density) which contribute to the divergence in their effective radii and surface brightnesses at late epochs. Interestingly, the trend is reversed in the high mass bin, indicating that the surface brightness divergence in this regime is driven primarily by the higher levels of star formation in the upper locus population.
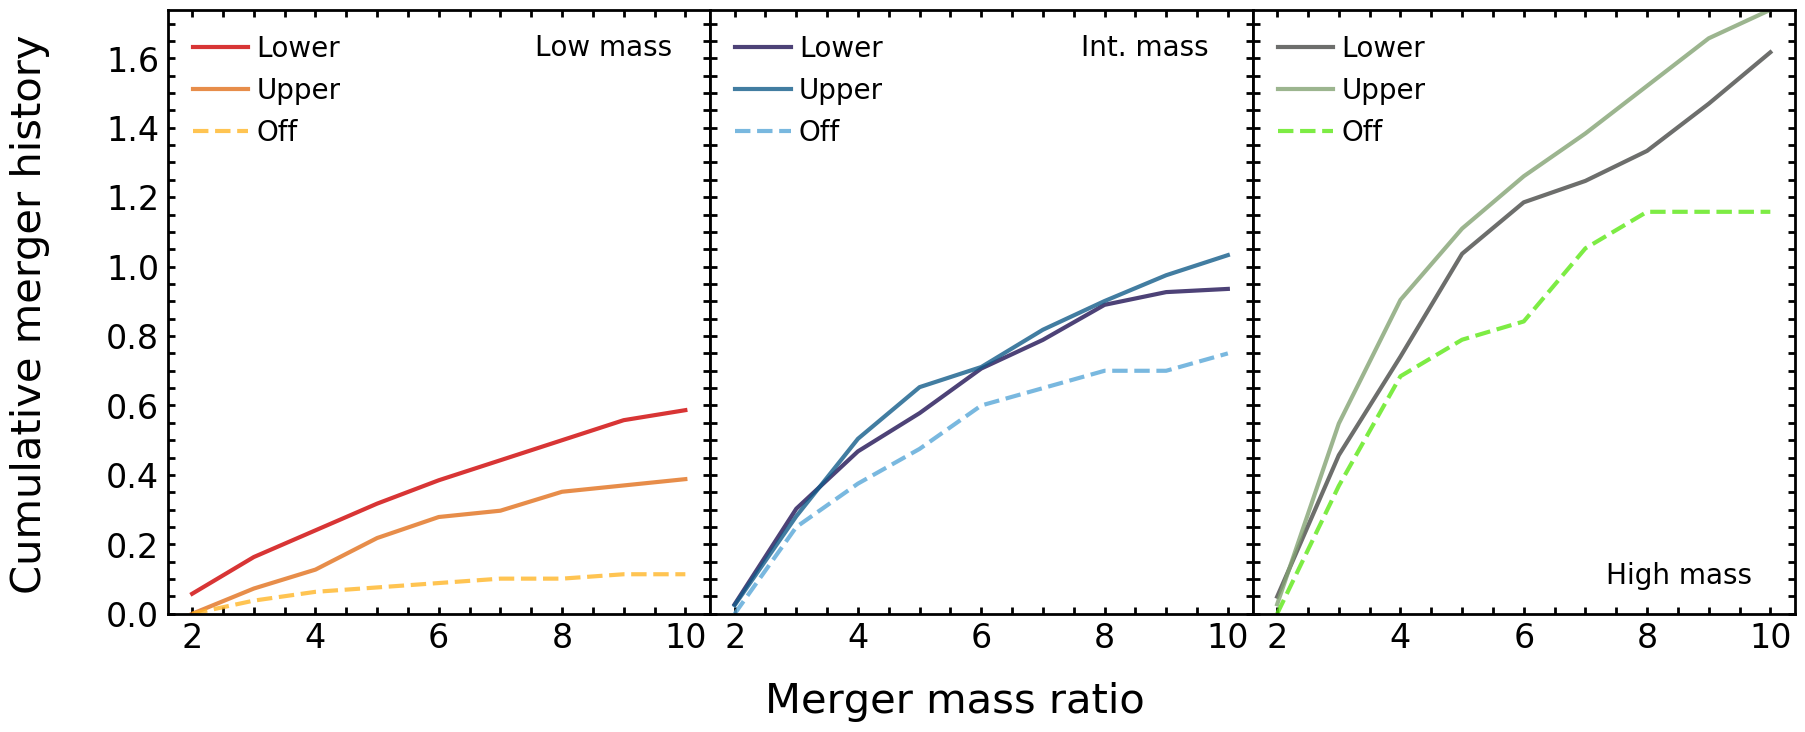
Note that, while the PI includes mergers (i.e. events where the two galaxies eventually coalesce), it is worth looking separately at the merger history of galaxies, since plotting the median PI will dampen the effect of individual events, like mergers, which could cause a strong, transient change in this parameter. While mergers will increase the stellar mass of the system and can drive an increase in its radius, the smooth change in both stellar mass (Figure 4) and effective radius (Figure 5) suggests that mergers, which are stochastic and rare events (e.g. Darg et al., 2010; Uzeirbegovic et al., 2020), are unlikely to be driving this evolution. We confirm this in Figure 12 by exploring the cumulative merger histories of galaxies, for significant merging events which have mass ratios less than 10:1 (which is the mass ratio range where mergers typically produce measurable size and morphological change, e.g. Martin et al. (2018)). This figure shows the average number of mergers experienced by a galaxy since the beginning of the simulation, with mass ratios less than or equal to the value shown on the x-axis. For example, a lower locus galaxy in the low mass bin (left panel) undergoes, on average, 0.6 mergers with mass ratios greater than 1:10 at , while a lower locus galaxy in the intermediate mass bin undergoes, on average, 0.95 mergers in the same time period.
We find that the cumulative merger histories of galaxies in the lower locus do not show a strong preference towards higher merger fractions over cosmic time in any mass bin. In addition, the number of mergers experienced by galaxies (in all zones of the locus) are indeed too small to explain the smooth change observed in stellar mass and effective radius. This indicates that individual mergers do not influence the eventual position of a galaxy on the locus.
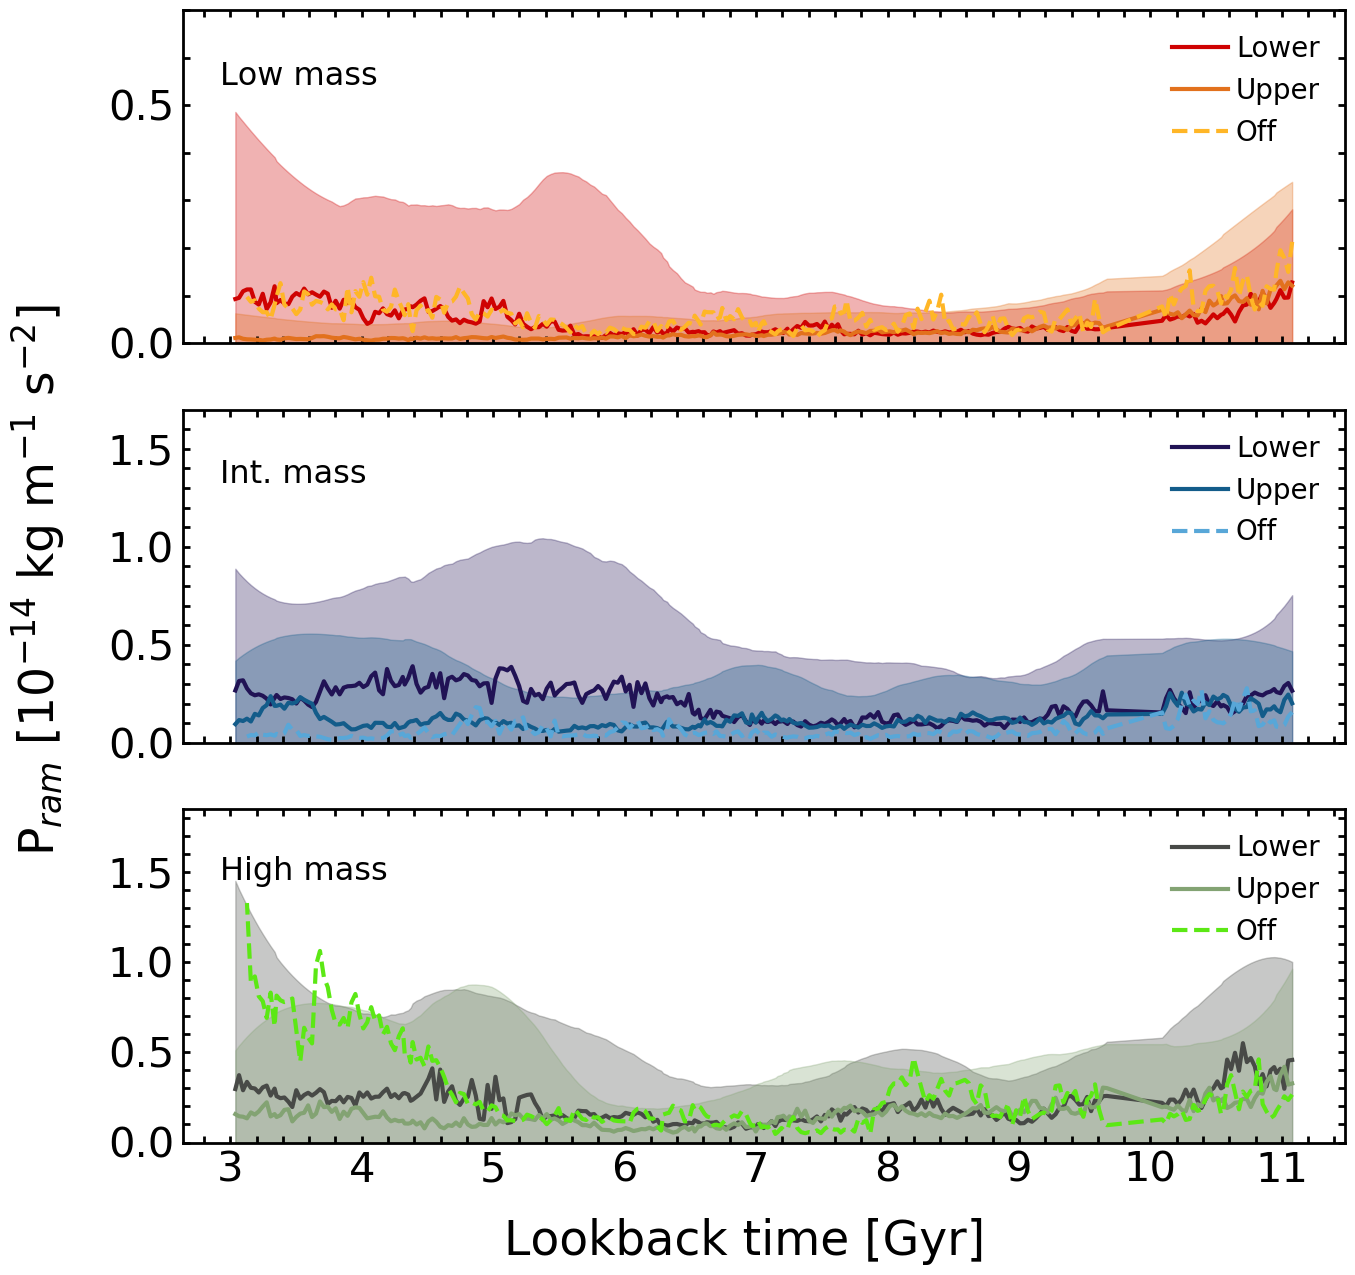
Next, we consider ram pressure, which is capable of removing gas from galaxies and reducing their star formation rates, particularly in high-density environments (e.g. Gunn & Gott, 1972). While NewHorizon does not include the richest environments like galaxy clusters, ram pressure can still play a significant role in the evolution of low-mass galaxies, which are typically much more susceptible to gas stripping due to their shallow gravitational potential wells (e.g. Vollmer et al., 2001; Martin et al., 2019). We measure the ram pressure exerted on a galaxy by the local medium as follows:
| (4) |
where is the velocity of the galaxy relative to the bulk velocity of the surrounding medium and is the mean gas density of the surrounding medium within 10 times the maximum extent of the stellar distribution of the galaxy.
Figure 13 shows the evolution of the median ram pressure with look-back time. In a similar vein to the PI, the ram pressure experienced by upper and lower locus galaxies is similar at large look-back times and therefore does not contribute to the surface brightness divergence at early epochs. However, the median ram pressure experienced by lower locus galaxies at late epochs is elevated compared to that in their upper-locus counterparts (although the difference is less pronounced than what is found for the PI). This is again likely to be driven by the fact that lower-locus galaxies are born, and remain in, regions of higher density. The higher ram pressure at late epochs likely assists in the faster depletion of gas in lower locus galaxies, reducing their star formation activity (which is reflected in the decrease in the SN feedback energy seen in Figure 7). This, in turn, helps drive the divergence in surface brightness between the two populations at late epochs.
5 Off-locus galaxies: transient, tidally-induced starbursts
We complete our study by exploring the formation mechanisms of galaxies that depart strongly from the locus towards higher surface brightnesses. As shown in Figure 1, a minority of galaxies reside ‘off-locus’, with the fraction of off-locus objects being 22, 12 and 10 per cent in the low, intermediate and high mass bins respectively (see Table 2). In particular, as noted in Section 3, galaxies that scatter off the main locus make up the majority of low-mass galaxies that are visible in past wide-area surveys like the SDSS. It is, therefore, important to understand how these systems form and their connection to the majority of the galaxy population which resides on the locus itself.
Figure 6 suggests that the off-locus population diverges in surface brightness at late look-back times, with the divergence being most pronounced in the low-mass population. The epoch of divergence coincides with an increase in both the PI (Figure 11) and the SN feedback energy i.e. a starburst (Figure 7). We first check whether the gas inflow rates in the off-locus galaxies show an increase around the time they begin to diverge from the population that resides in the locus, possibly due to abruptly entering a high-density environment. However, we find that the average gas inflow rates prior to the starburst are not anomalous and an analysis of the skeleton indicates that the off-locus galaxies do not abruptly enter high-density regions of the cosmic web.
This indicates that the off-locus galaxies depart from the main locus due to recent, tidally-induced starbursts which are essentially stochastic in nature. The epoch at which the population diverges in surface brightness (see Figure 6) indicates that the star formation episodes in these systems are around 1-4 Gyrs old (dependent on the mass bin). Note that this recent starburst episode is not special. While galaxies are likely to have had multiple starburst episodes in their lifetimes, the new stars produced in those episodes have since aged and faded away. The off-locus population is essentially tracing the most recent starburst episode whose signature remains visible in the -band filter.
| Low mass | Int. mass | High mass | |
|---|---|---|---|
| Off-locus fraction | 22 | 12 | 10 |
| Fly-by induced | 92 | 48 | 38 |
| Major-merger induced | 4 | 26 | 12 |
| Minor-merger induced | 4 | 26 | 50 |
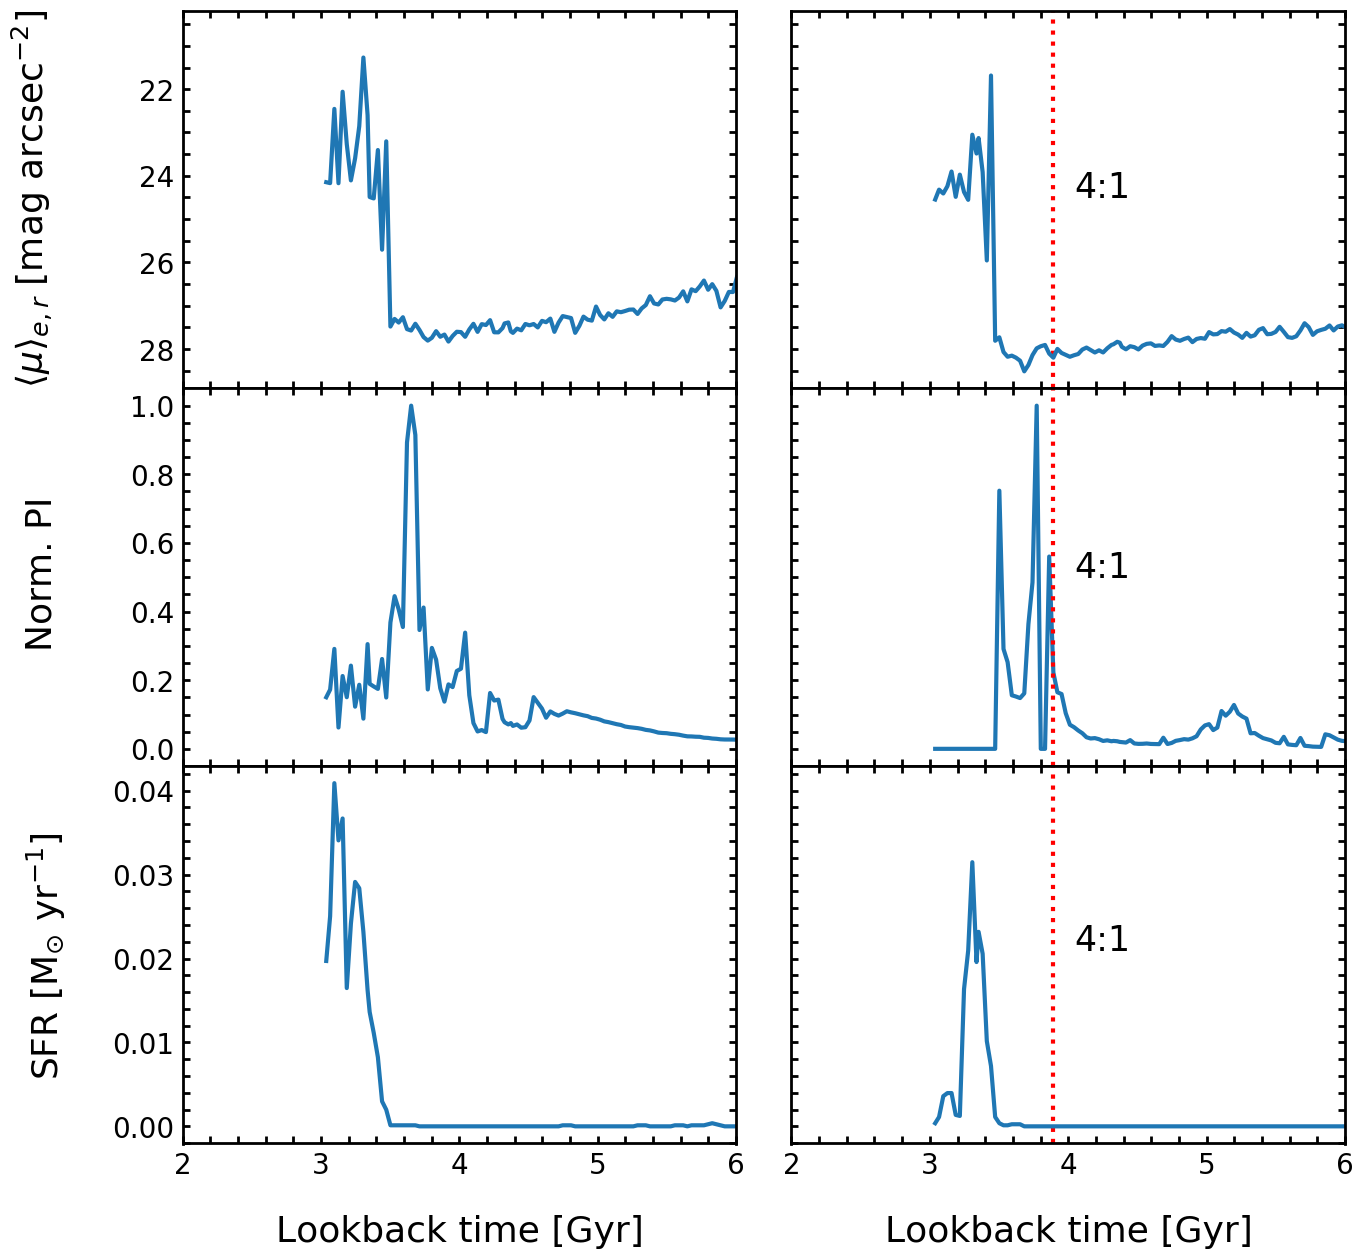
Since the increase in PI could either be driven by fly-bys i.e. purely tidal events where there is a rapid change in PI without a merger or by major (mass ratios 4:1) or minor (mass ratios 4:1) mergers, it is instructive to consider which mechanism triggers the starburst that produces off-locus galaxies in different zones of the locus. For each off-locus galaxy, we consider their merger histories in conjunction with the evolution of their PI values and compare this to their surface brightness evolution. Figure 14 shows examples of two cases. The right-hand column shows a system that is driven off-locus (due to the rapid brightening of the surface brightness, see top panel) by an increase in PI that coincides with a recent merger with a mass ratio of 4:1. The look-back time of the merger is indicated by the red dotted line. The left-hand column shows a case where the surface brightness is driven by a fly-by because the change in the perturbation index does not correspond with a recent merger.
We visually inspect these plots for every off-locus galaxy, in order to ascertain the principal driver of the starburst that moves them off the locus. Table 2 summarises the drivers of the starbursts in the off-locus objects. The impact of fly-bys is greatest in the low-mass regime, where 92 per cent of the off-locus systems are fly-by induced. Fly-bys remain important in all mass regimes, producing 48 and 38 per cent of off-locus systems in the intermediate and high mass bins respectively. However, mergers become more important at higher stellar masses, accounting for 62 per cent of off-locus objects in the high mass bin. The progressively higher minor-merger-induced off-locus fraction at higher stellar masses is due to the shape of the galaxy mass function. Since there are fewer galaxies at high stellar masses (e.g. Bell et al., 2003), equal mass mergers between massive galaxies become rarer in this mass regime.
Our analysis indicates that the recent starbursts that produce off-locus systems are largely induced by tidal perturbations that trigger the existing gas reservoirs in these galaxies, rather than being due to enhanced gas accretion from the cosmic web. As galaxies increase in stellar mass and their gravitational potential wells become deeper, a larger perturbation, via a merger rather than simply a fly-by, is required to trigger this starburst.
It is important to note that off-locus galaxies are clearly atypical of the general galaxy population because they have anomalously high levels of star formation. As has been noted before in Section 3, in the M⋆ 109 M⊙ regime, off-locus galaxies overwhelmingly dominate the observed galaxy population in past wide-area surveys like the (standard-depth) SDSS (see dotted red lines in Figure 3). Therefore, conclusions about the general galaxy population cannot be drawn using the subset of off-locus objects because they are likely to be highly unrepresentative of the overall galaxy populations in these mass regimes.
6 Summary
Our statistical comprehension of galaxy evolution is driven by objects that are brighter than the surface brightness limits of wide-area surveys. Given the depth of past wide surveys, our understanding of how the observable Universe evolves has been predicated largely on bright galaxies. For example, while past benchmark surveys like the SDSS become highly incomplete at effective surface brightnesses of around 24 mag arcsec-2, low-surface brightness galaxies (LSBGs) that are fainter than these thresholds overwhelmingly dominate the galaxy number density (e.g. Martin et al., 2019). Understanding the evolution of the LSBG population is therefore key to a complete comprehension of galaxy evolution. Here, we have used the high resolution NewHorizon cosmological simulation to probe the origin and evolution of the LSBG population in the low-mass regime, where most recent observational studies are focussed. In particular, we have explored why, at a given stellar mass, LSBGs span the large observed range in surface brightness.
The NewHorizon galaxy population occupies a well-defined locus in the surface brightness vs. stellar mass plane, with a large spread of mag arcsec-2. A minority of galaxies depart strongly from this locus towards higher surface brightnesses. The fraction of these off-locus systems is 20 per cent in the low mass bin (106.5 M⊙ M⋆ 107.5 M⊙) and drops to 10 per cent at higher stellar masses (108.5 M⊙ M⋆ 109.5 M⊙). The predicted position of NewHorizon galaxies in the surface brightness vs. stellar mass plane is in good agreement with observations from the relatively deep SDSS Stripe 82 survey. This agreement suggests that, while prescriptions used in NewHorizon to describe baryonic physics (e.g. SN feedback) are largely tuned to higher mass galaxies, they also offer a good representation of these processes in the low-mass regime.
A large number of LSBGs in NewHorizon, particularly galaxies that exist in the upper locus in the low and intermediate mass bins, have surface brightnesses and effective radii that make them consistent with the definition of ‘ultra-diffuse galaxies’ (UDGs) in the current observational literature. These dwarfs form naturally in the standard model, through a combination of SN feedback, tidal perturbations and ram pressure as described in Section 4 and are, therefore, a normal component of the dwarf galaxy population (albeit one that is not readily detectable using past and current datasets). Since NewHorizon does not contain very high-density environments (i.e. clusters), a clear prdiction is that UDGs form ubiquitously in low-density environments like groups and the field and will be routinely visible in new and future deep-wide surveys like the HSC-SSP and LSST.
To understand the processes that determine the eventual surface brightness of dwarf galaxies at late epochs, we have split the locus into three zones - the lower (fainter) and upper (brighter) halves and the population of off-locus galaxies that scatter towards very high surface brightnesses beyond the upper locus. We have then studied, in detail, the formation histories of galaxies in these different zones, in order to identify the processes that create the large observed spread in surface brightnesses in the dwarf galaxy population.
Regardless of the mass regime being considered, galaxies in the lower locus, i.e. those that end up with fainter surface brightnesses at late epochs, are born in denser regions of the Universe, which results in faster gas accretion and more intense star formation at high redshift. The more intense star formation in these systems leads to stronger supernova feedback. This flattens gas profiles at a faster rate which, in turn, creates shallower stellar profiles more rapidly. As star formation subsides in the lower locus, their late epoch evolution is dominated by external processes like tidal perturbations and ram pressure. Since lower locus galaxies are born in higher density environments, they remain in relatively denser environments over their lifetimes. The higher tidal perturbations they experience as a result continue to increase their effective radii at a faster rate than their upper locus counterparts. In a similar vein, the higher ram pressure they experience acts to accelerate gas depletion and reduce their star formation rates more quickly than on the upper locus. The lower locus systems thus diverge strongly from their upper locus counterparts at late epochs, both due to the fact that they are now more diffuse and because they have less star formation.
Finally, we have studied the processes that drive the formation of off-locus galaxies that deviate strongly from the main locus as they experience a recent, rapid increase in surface brightness. This increase is not driven by an uptick in the gas inflow rate but coincides with an increase in the perturbation index and a coincident rise in the star formation activity. This indicates that an interaction triggers a starburst which moves the galaxy away from the main locus. In low-mass systems (M⋆ 107.5 M⊙) this starburst is triggered primarily by purely tidal events (i.e. fly-bys), while at high stellar masses (M⋆ 108.5 M⊙) it is primarily induced by mergers. It is worth noting that this off-locus population makes up the bulk of the observable low-mass systems (M⋆ 108.5 M⊙) in past benchmark wide-area surveys like the SDSS. However, since these systems are clearly anomalous in terms of their star formation activity, conclusions about the general galaxy population cannot be drawn using these galaxies.
Together with the study presented in Martin et al. (2019), the analysis in this paper offers a theoretical counterpart to new and future deep-wide surveys like the HSC-SSP and LSST. As noted earlier, these surveys will offer galaxy completeness down to at least M⋆ 107 M⋆ in the nearby Universe, providing a revolutionary increase in discovery space. In future papers, we will compare our theoretical studies to data from such surveys to explore LSBG formation and constrain the physics of galaxy evolution, in detail, in the low-surface-brightness regime.
Acknowledgements
We are grateful to the anonymous referee for many constructive comments that improved the quality of the original manuscript. We warmly thank Rob Crain and Johan Knapen for many interesting discussions. RAJ, GM and SK acknowledge support from the STFC [ST/R504786/1, ST/N504105/1, ST/S00615X/1]. SK acknowledges a Senior Research Fellowship from Worcester College Oxford. The research of AS and JD is supported by the Beecroft Trust and STFC. Some of the numerical work made use of the DiRAC Data Intensive service at Leicester, operated by the University of Leicester IT Services, which forms part of the STFC DiRAC HPC Facility (www.dirac.ac.uk). The equipment was funded by BEIS capital funding via STFC capital grants ST/K000373/1 and ST/R002363/1 and STFC DiRAC Operations grant ST/R001014/1. DiRAC is part of the National e-Infrastructure. TK was supported in part by the National Research Foundation of Korea (NRF-2017R1A5A1070354 and NRF-2020R1C1C100707911) and in part by the Yonsei University Future-leading Research Initiative (RMS2-2019-22-0216). This research has used the DiRAC facility, jointly funded by the STFC and the Large Facilities Capital Fund of BIS, and has been partially supported by grant Segal ANR- 19-CE31-0017 of the French ANR. This work was granted access to the HPC resources of CINES under the allocations 2013047012, 2014047012 and 2015047012 made by GENCI. This work was granted access to the high-performance computing resources of CINES under the allocations c2016047637 and A0020407637 from GENCI, and KISTI (KSC-2017-G2-0003). Large data transfer was supported by KREONET, which is managed and operated by KISTI. This work has made use of the Horizon cluster on which the simulation was post-processed, hosted by the Institut d’Astrophysique de Paris. We thank Stephane Rouberol for running it smoothly for us. S.K.Y. acknowledges support from the Korean National Research Foundation (NRF-2020R1A2C3003769). This work is part of the Horizon-UK project.
Data Availabilty
The data that underpins the analysis in this paper were provided by the Horizon-AGN and NewHorizon collaborations. The data will be shared on request to the corresponding author, with the permission of the Horizon-AGN and NewHorizon collaborations.
References
- Abazajian et al. (2009) Abazajian K. N., et al., 2009, ApJS, 182, 543
- Aihara et al. (2019) Aihara H., et al., 2019, PASJ, p. 106
- Amorisco & Loeb (2016) Amorisco N. C., Loeb A., 2016, MNRAS, 459, L51
- Aubert et al. (2004) Aubert D., Pichon C., Colombi S., 2004, MNRAS, 352, 376
- Baes & Camps (2015) Baes M., Camps P., 2015, Astronomy and Computing, 12, 33
- Baushev (2018) Baushev A. N., 2018, New Astron., 60, 69
- Beckwith et al. (2006) Beckwith S. V. W., et al., 2006, The Astronomical Journal, 132, 1729–1755
- Bell et al. (2003) Bell E. F., McIntosh D. H., Katz N., Weinberg M. D., 2003, ApJS, 149, 289
- Bernstein & Jarvis (2002) Bernstein G. M., Jarvis M., 2002, AJ, 123, 583
- Bertin & Arnouts (1996) Bertin E., Arnouts S., 1996, Astronomy and Astrophysics Supplement Series, 117, 393
- Bianchi et al. (2017) Bianchi L., Shiao B., Thilker D., 2017, ApJS, 230, 24
- Blanton et al. (2005) Blanton M. R., Lupton R. H., Schlegel D. J., Strauss M. A., Brinkmann J., Fukugita M., Loveday J., 2005, ApJ, 631, 208
- Blanton et al. (2017) Blanton M. R., et al., 2017, AJ, 154, 28
- Bondi & Hoyle (1944) Bondi H., Hoyle F., 1944, MNRAS, 104, 273
- Borzyszkowski et al. (2017) Borzyszkowski M., Porciani C., Romano-Díaz E., Garaldi E., 2017, MNRAS, 469, 594
- Bothun et al. (1997) Bothun G., Impey C., McGaugh S., 1997, PASP, 109, 745
- Bower et al. (2006) Bower R. G., Benson A. J., Malbon R., Helly J. C., Frenk C. S., Baugh C. M., Cole S., Lacey C. G., 2006, MNRAS, 370, 645
- Boylan-Kolchin et al. (2011) Boylan-Kolchin M., Bullock J. S., Kaplinghat M., 2011, MNRAS, 415, L40
- Bruzual & Charlot (2003) Bruzual G., Charlot S., 2003, MNRAS, 344, 1000
- Bullock & Boylan-Kolchin (2017) Bullock J. S., Boylan-Kolchin M., 2017, ARA&A, 55, 343
- Bullock et al. (2001) Bullock J. S., Kravtsov A. V., Weinberg D. H., 2001, ApJ, 548, 33
- Cardona-Barrero et al. (2020) Cardona-Barrero S., Di Cintio A., Brook C. B. A., Ruiz-Lara T., Beasley M. A., Falcón-Barroso J., Macciò A. V., 2020, MNRAS, 497, 4282
- Carleton et al. (2019) Carleton T., Errani R., Cooper M., Kaplinghat M., Peñarrubia J., Guo Y., 2019, MNRAS, 485, 382
- Chabrier (2005) Chabrier G., 2005, The Initial Mass Function: From Salpeter 1955 to 2005. p. 41, doi:10.1007/978-1-4020-3407-7_5
- Chan et al. (2018) Chan T. K., Kereš D., Wetzel A., Hopkins P. F., Faucher-Giguère C. A., El-Badry K., Garrison-Kimmel S., Boylan-Kolchin M., 2018, MNRAS, p. 1094
- Choi et al. (2018) Choi H., Yi S. K., Dubois Y., Kimm T., Devriendt J. E. G., Pichon C., 2018, ApJ, 856
- Cole et al. (2000) Cole S., Lacey C. G., Baugh C. M., Frenk C. S., 2000, MNRAS, 319, 168
- Conselice (2018) Conselice C. J., 2018, Research Notes of the American Astronomical Society, 2, 43
- Cross & Driver (2002) Cross N., Driver S. P., 2002, MNRAS, 329, 579
- Dalcanton et al. (1997) Dalcanton J. J., Spergel D. N., Gunn J. E., Schmidt M., Schneider D. P., 1997, AJ, 114, 635
- Darg et al. (2010) Darg D. W., et al., 2010, MNRAS, 401, 1043
- Di Cintio et al. (2017) Di Cintio A., Brook C. B., Dutton A. A., Macciò A. V., Obreja A., Dekel A., 2017, MNRAS, 466, L1
- Di Cintio et al. (2019) Di Cintio A., Brook C. B., Macciò A. V., Dutton A. A., Cardona-Barrero S., 2019, MNRAS, 486, 2535
- Driver et al. (2005) Driver S. P., Liske J., Cross N. J. G., De Propris R., Allen P. D., 2005, MNRAS, 360, 81
- Dubois & Teyssier (2008) Dubois Y., Teyssier R., 2008, A&A, 482, L13
- Dubois et al. (2012) Dubois Y., Devriendt J., Slyz A., Teyssier R., 2012, MNRAS, 420, 2662
- Dubois et al. (2014a) Dubois Y., Volonteri M., Silk J., 2014a, MNRAS, 440, 1590
- Dubois et al. (2014b) Dubois Y., et al., 2014b, MNRAS, 444, 1453
- Dubois et al. (2020) Dubois Y., et al., 2020, arXiv e-prints, p. arXiv:2009.10578
- Eisenstein & Hut (1998) Eisenstein D. J., Hut P., 1998, ApJ, 498, 137
- Fliri & Trujillo (2016) Fliri J., Trujillo I., 2016, Monthly Notices of the Royal Astronomical Society, 456, 1359
- Gallart et al. (2015) Gallart C., et al., 2015, ApJ, 811, L18
- Geen et al. (2015) Geen S., Rosdahl J., Blaizot J., Devriendt J., Slyz A., 2015, MNRAS, 448, 3248
- Governato et al. (2007) Governato F., Willman B., Mayer L., Brooks A., Stinson G., Valenzuela O., Wadsley J., Quinn T., 2007, MNRAS, 374, 1479
- Greco et al. (2018) Greco J. P., et al., 2018, ApJ, 857, 104
- Gunn & Gott (1972) Gunn J. E., Gott J. Richard I., 1972, ApJ, 176, 1
- Haardt & Madau (1996) Haardt F., Madau P., 1996, ApJ, 461, 20
- Hatton et al. (2003) Hatton S., Devriendt J. E. G., Ninin S., Bouchet F. R., Guiderdoni B., Vibert D., 2003, MNRAS, 343, 75
- Hester (2006) Hester J. A., 2006, ApJ, 647, 910
- Hoyle & Lyttleton (1939) Hoyle F., Lyttleton R. A., 1939, Mathematical Proceedings of the Cambridge Philosophical Society, 35, 592–609
- Jackson et al. (2020) Jackson R. A., et al., 2020, arXiv e-prints, p. arXiv:2010.02219
- Jiang et al. (2019) Jiang F., Dekel A., Freundlich J., Romanowsky A. J., Dutton A. A., Macciò A. V., Di Cintio A., 2019, MNRAS, 487, 5272
- Kaviraj (2014a) Kaviraj S., 2014a, MNRAS, 437, L41
- Kaviraj (2014b) Kaviraj S., 2014b, MNRAS, 440, 2944
- Kaviraj et al. (2017) Kaviraj S., et al., 2017, MNRAS, 467, 4739
- Kaviraj et al. (2019) Kaviraj S., Martin G., Silk J., 2019, MNRAS, 489, L12
- Kennicutt (1998) Kennicutt Jr. R. C., 1998, ApJ, 498, 541
- Kent et al. (1991) Kent S. M., Dame T. M., Fazio G., 1991, ApJ, 378, 131
- Kimm & Cen (2014) Kimm T., Cen R., 2014, ApJ, 788, 121
- Kimm et al. (2017) Kimm T., Katz H., Haehnelt M., Rosdahl J., Devriendt J., Slyz A., 2017, MNRAS, 466, 4826
- Kniazev et al. (2004) Kniazev A. Y., Grebel E. K., Pustilnik S. A., Pramskij A. G., Kniazeva T. F., Prada F., Harbeck D., 2004, AJ, 127, 704
- Koda et al. (2015) Koda J., Yagi M., Yamanoi H., Komiyama Y., 2015, ApJ, 807, L2
- Komatsu et al. (2011) Komatsu E., et al., 2011, ApJS, 192, 18
- Kulier et al. (2019) Kulier A., Galaz G., Padilla N. D., Trayford J. W., 2019, arXiv e-prints, p. arXiv:1910.05345
- Laigle et al. (2018) Laigle C., et al., 2018, MNRAS, 474, 5437
- Laporte et al. (2019) Laporte C. F. P., Agnello A., Navarro J. F., 2019, MNRAS, 484, 245
- Leisman et al. (2017) Leisman L., et al., 2017, ApJ, 842, 133
- Liao et al. (2019) Liao S., et al., 2019, MNRAS, 490, 5182
- López-Corredoira et al. (2002) López-Corredoira M., Cabrera-Lavers A., Garzón F., Hammersley P. L., 2002, A&A, 394, 883
- Martin et al. (2018) Martin G., Kaviraj S., Devriendt J. E. G., Dubois Y., Pichon C., 2018, MNRAS, 480, 2266
- Martin et al. (2019) Martin G., et al., 2019, MNRAS, 485, 796
- Martin et al. (2020) Martin G., Kaviraj S., Hocking A., Read S. C., Geach J. E., 2020, MNRAS, 491, 1408
- Martínez-Delgado et al. (2016a) Martínez-Delgado D., et al., 2016a, AJ, 151, 96
- Martínez-Delgado et al. (2016b) Martínez-Delgado D., et al., 2016b, AJ, 151, 96
- McGaugh et al. (1995) McGaugh S. S., Schombert J. M., Bothun G. D., 1995, AJ, 109, 2019
- McKinney et al. (2012) McKinney J. C., Tchekhovskoy A., Blandford R. D., 2012, Monthly Notices of the Royal Astronomical Society, 423, 3083
- McMillan (2011) McMillan P. J., 2011, MNRAS, 414, 2446
- Merritt et al. (2016) Merritt A., van Dokkum P., Danieli S., Abraham R., Zhang J., Karachentsev I. D., Makarova L. N., 2016, ApJ, 833, 168
- Mihos et al. (2015) Mihos J. C., et al., 2015, ApJ, 809, L21
- Moore et al. (1999) Moore B., Ghigna S., Governato F., Lake G., Quinn T., Stadel J., Tozzi P., 1999, ApJ, 524, L19
- Musso et al. (2018) Musso M., Cadiou C., Pichon C., Codis S., Kraljic K., Dubois Y., 2018, MNRAS, 476, 4877
- Nayyeri et al. (2017) Nayyeri H., et al., 2017, ApJS, 228, 7
- Ostriker (1999) Ostriker E. C., 1999, ApJ, 513, 252
- Papastergis et al. (2017) Papastergis E., Adams E. A. K., Romanowsky A. J., 2017, A&A, 601, L10
- Pipino et al. (2009) Pipino A., Kaviraj S., Bildfell C., Babul A., Hoekstra H., Silk J., 2009, MNRAS, 395, 462
- Pogosyan et al. (2009) Pogosyan D., Pichon C., Gay C., Prunet S., Cardoso J. F., Sousbie T., Colombi S., 2009, MNRAS, 396, 635
- Robertson et al. (2019) Robertson B. E., et al., 2019, Nature Reviews Physics, 1, 450
- Román & Trujillo (2017a) Román J., Trujillo I., 2017a, MNRAS, 468, 703
- Román & Trujillo (2017b) Román J., Trujillo I., 2017b, MNRAS, 468, 4039
- Rosen & Bregman (1995) Rosen A., Bregman J. N., 1995, ApJ, 440, 634
- Sako et al. (2018) Sako M., et al., 2018, PASP, 130, 064002
- Schaap & van de Weygaert (2000) Schaap W. E., van de Weygaert R., 2000, A&A, 363, L29
- Schaye et al. (2015) Schaye J., et al., 2015, MNRAS, 446, 521
- Schmidt (1959) Schmidt M., 1959, The Astrophysical Journal, 129, 243
- Schmidt et al. (2013) Schmidt F., Jeong D., Desjacques V., 2013, Phys. Rev. D, 88, 023515
- Sedgwick et al. (2019a) Sedgwick T. M., Baldry I. K., James P. A., Kelvin L. S., 2019a, in IAU Symposium 355: The Realm of the Low Surface Brightness Universe. (arXiv:1909.04535)
- Sedgwick et al. (2019b) Sedgwick T. M., Baldry I. K., James P. A., Kelvin L. S., 2019b, MNRAS, 484, 5278
- Shakura & Sunyaev (1973) Shakura N. I., Sunyaev R. A., 1973, A&A, 500, 33
- Smith Castelli et al. (2016) Smith Castelli A. V., Faifer F. R., Escudero C. G., 2016, A&A, 596, A23
- Sousbie (2011) Sousbie T., 2011, Monthly Notices of the Royal Astronomical Society, 414, 350
- Sousbie et al. (2011) Sousbie T., Pichon C., Kawahara H., 2011, Monthly Notices of the Royal Astronomical Society, 414, 384
- Sutherland & Dopita (1993) Sutherland R. S., Dopita M. A., 1993, ApJS, 88, 253
- Teyssier (2002) Teyssier R., 2002, A&A, 385, 337
- Tremmel et al. (2019) Tremmel M., Wright A. C., Brooks A. M., Munshi F., Nagai D., Quinn T. R., 2019, arXiv e-prints, p. arXiv:1908.05684
- Trujillo et al. (2017) Trujillo I., Roman J., Filho M., Sánchez Almeida J., 2017, ApJ, 836, 191
- Tweed et al. (2009) Tweed D., Devriendt J., Blaizot J., Colombi S., Slyz A., 2009, A&A, 506, 647
- Uzeirbegovic et al. (2020) Uzeirbegovic E., Geach J. E., Kaviraj S., 2020, arXiv e-prints, p. arXiv:2004.06734
- Vogelsberger et al. (2014a) Vogelsberger M., et al., 2014a, MNRAS, 444, 1518
- Vogelsberger et al. (2014b) Vogelsberger M., et al., 2014b, Nature, 509, 177
- Vollmer et al. (2001) Vollmer B., Cayatte V., Balkowski C., Duschl W. J., 2001, ApJ, 561, 708
- Volonteri et al. (2020) Volonteri M., et al., 2020, MNRAS, 498, 2219
- Wright et al. (2020) Wright A. C., Tremmel M., Brooks A. M., Munshi F., Nagai D., Sharma R. S., Quinn T. R., 2020, arXiv e-prints, p. arXiv:2005.07634
- de Blok (2010) de Blok W. J. G., 2010, Advances in Astronomy, 2010, 789293
- van Dokkum et al. (2015a) van Dokkum P. G., Abraham R., Merritt A., Zhang J., Geha M., Conroy C., 2015a, ApJ, 798, L45
- van Dokkum et al. (2015b) van Dokkum P. G., et al., 2015b, ApJ, 804, L26
- van Dokkum et al. (2015c) van Dokkum P. G., et al., 2015c, ApJ, 804, L26