The first broadband X-ray view of the narrow line Seyfert 1 Ton S180
Abstract
We present joint XMM-Newton and NuSTAR observations of the ‘bare’ narrow line Seyfert 1 Ton S180 (), carried out in 2016 and providing the first hard X-ray view of this luminous galaxy. We find that the 0.4–30 keV band cannot be self-consistently reproduced by relativistic reflection models, which fail to account simultaneously for the soft and hard X-ray emission. The smooth soft excess prefers extreme blurring parameters, confirmed by the nearly featureless nature of the RGS spectrum, while the moderately broad Fe K line and the modest hard excess above 10 keV appear to arise in a milder gravity regime. By allowing a different origin of the soft excess, the broadband X-ray spectrum and overall spectral energy distribution (SED) are well explained by a combination of: (a) direct thermal emission from the accretion disc, dominating from the optical to the far/extreme UV; (b) Comptonization of seed disc photons by a warm ( keV) and optically thick () corona, mostly contributing to the soft X-rays; (c) Comptonization by a standard hot ( keV) and optically thin () corona, responsible for the primary X-ray continuum; and (d) reflection from the mid/outer part of the disc. The two coronae are suggested to be rather compact, with . Our SED analysis implies that Ton S180 accretes at super-Eddington rates. This is a key condition for the launch of a wind, marginal (i.e., 3.1 significance) evidence of which is indeed found in the RGS spectrum.
keywords:
black hole physics – galaxies: active – galaxies: nuclei – galaxies: individual (Ton S180) – X-rays: galaxies1 introduction
It is now common knowledge that in most Seyfert AGN, the primary UV to X-ray emission can be attributed to complex interactions between the accretion disc and a corona of relativistic electrons. In the standard picture the ‘seed’ optical/UV disc photons that are Compton up-scattered in the hot corona (Haardt & Maraschi, 1991, 1993) can be observed as a hard X-ray tail, which is usually described phenomenologically by a simple power law up to 10 keV. However, more complex emission features are also imprinted on the X-ray spectra of AGN, namely the soft excess below 1–2 keV, a Fe K line complex around 6.4 keV and a Compton ‘hump’ peaking at 20 keV.
The soft excess is a smooth (i.e., featureless) emission component that is commonly observed in unabsorbed AGN, where the power law fails to account for this extra emission. Studies conducted by Gierliński & Done (2004), Porquet et al. (2004), Piconcelli et al. (2005) and Miniutti et al. (2009) have shown that the soft excess cannot be directly associated to the Wien tail of the the blackbody-like emission from accretion disc observed in the UV, as previously thought (e.g., Singh, Garmire & Nousek, 1985; Pounds et al., 1986; Walter & Fink, 1993), since the thermal continuum requires temperatures far higher than expected.
Done et al. (2012) suggested that an increase of the disc effective temperature, caused by Comptonization of the ‘seed’ photons in a cold ( keV) and optically thick plasma , may be the reason for the observed excess. Petrucci et al. (2013) carried out a detailed analysis on the data obtained from a large multiwavelength XMM-Newton and INTEGRAL campaign on the bright Seyfert 1 AGN Mrk 509 (Kaastra et al., 2011b). The broadband (i.e., optical/UV to hard X-rays) spectrum of Mrk 509 was well described with the contribution from: (i) a hot ( keV) and optically thin () corona responsible for the primary continuum and (ii) a warm ( keV) and optically thick (–) plasma for the soft X-ray component (i.e., the soft excess). The differences between Done et al. (2012) and Petrucci et al. (2013) are both geometrical and physical. Both scenarios require a warm corona with comparable optical depth and temperature but located in different places with respect to the hot corona, respectively within or beyond a given characteristic radius. Moreover, in the latter case, the disc is entirely ‘passive’, since all the accretion power is released in the warm corona making the disc intrinsic emission negligible.111In this framework, the accretion power is not dissipated within the disc giving rise to the typical accretion disc spectrum (e.g., Shakura & Sunyaev, 1973), but exclusively in the warm corona. A visual illustration of the implications in terms of the emitted UV spectrum is later shown in Fig. 11.
This physical interpretation is referred to as the two-corona model, and it has been successfully tested on several local Seyfert galaxies, among which Mrk 509 (Petrucci et al., 2013), RX J0439.6–5311 (Jin, Done & Ward, 2017), Ark 120 (Porquet et al., 2018), NGC 7469 (Middei et al., 2018), NGC 4593 (Middei et al., 2019), and HE 1143–1810 (Ursini et al., 2019). In addition, Matzeu et al. (2017) suggested that the interplay between a dual (warm and hot) coronal region could be the cause of the intrinsic short-term spectral variability in the quasar PDS 456, caught in a high-flux and unabsorbed state by Suzaku in 2007.
Another viable explanation is that the soft X-ray excess is due to reflection from the photoionized surface layers in the inner region (near the supermassive black hole) of the accretion disc. In this strong-gravity regime the extreme relativistic blurring reduces the (narrow) fluorescence soft X-ray emission lines into a featureless continuum (Fabian et al., 2002; Ross & Fabian, 2005; Crummy et al., 2006; García & Kallman, 2010; Nardini et al., 2011; Lohfink et al., 2012; Walton et al., 2013; Wilkins & Gallo, 2015a; Jiang et al., 2019). High ionization also contributes to lessening the prominence of the reflection features against the direct continuum. Sometimes this scenario requires extreme solutions, such as very high values of black hole spin parameter222The spin parameter is defined as , where and are the black hole’s angular momentum and mass, respectively. For maximal spin, , the innermost stable circular orbit (ISCO) reduces to gravitational radii (), as opposed to for a non-spinning Schwarzschild black hole, with (Thorne, 1974)., i.e. (see Reynolds, 2014), and of the disc emissivity index333The disc emissivity is typically assumed to follow a power-law dependence on radius, . For a point source in a flat Euclidean space, it is at large distance., . However, a variety of reflection models have been adopted to successfully account for the soft X-ray excess; in particular, a considerable improvement was obtained by implementing a high-density accretion disc, up to (García et al., 2016). Regardless of the validity of all the above interpretations, the physical origin of the soft X-ray excess component is still an open issue after many years of AGN research.
Tonantzintla (Ton) S180 is a local (; Wisotzki et al., 1995), luminous (; Turner et al., 2002) narrow line Seyfert 1 (NLSy1), which is considered one of the prototypical ‘bare’ AGN with no trace of absorption and a featureless and prominent soft excess (Turner et al., 2001b; Vaughan et al., 2002). The 2007 Suzaku observation (102 ks) suggested also an intriguing hard excess in the HXD/PIN energy range (– keV; Takahashi, Hayashida & Anabuki, 2010). However, since the HXD was a non-focusing detector (Takahashi et al., 2007), proper background subtraction is very critical especially for faint sources at as Ton S180. Nardini, Fabian & Walton (2012) presented a spectral analysis of the Suzaku and XMM-Newton observations of Ton S180. It was found that a self-consistent dual-reflector geometry reproduced effectively the main X-ray spectral properties, namely the soft excess, the broad Fe K emission feature and the hard X-ray emission (tentatively up to 30 keV). Ton S180 was targeted three times by XMM-Newton in 2000, 2002 and 2015. For the latter observation, Parker, Miller & Fabian (2018) found that the XMM-Newton spectrum favoured two Comptonization components plus reflection from a disc around a black hole of low spin (with maximal spin ruled out at the confidence level).
In this work we present a detailed analysis of the 2016 joint XMM-Newton and NuSTAR observation (with durations of 30 and 270 ks, respectively) of Ton S180 (PI: G.A. Matzeu). Here, for the first time, the hard X-ray spectrum of Ton S180 above from a direct-imaging hard X-ray telescope is revealed. The main goal of this paper is to test whether the soft excess and the broadband XMM-Newton and NuSTAR 2016 spectra can be explained with either relativistic reflection or a warm corona scenario. Both interpretations have been proposed in the past but the lack of high-quality data above 10 keV prevented any conclusive resolution.
This paper is organized as follows: in Section 2 we summarize the data reduction process for each of the XMM-Newton and NuSTAR detectors, whereas in Section 3 we present the Reflection Grating Spectrometer (RGS), X-ray broadband and optical to X-ray spectral energy distribution (SED) analysis, where we test relativistic reflection models as well as two-corona/multi-temperature Comptonized accretion disc models. In Section 4, the physical implications from the above analysis are discussed in detail.
In this paper the values of km s-1 Mpc-1, and are assumed throughout, and errors are quoted at the 90 per cent confidence level () for one parameter of interest, unless otherwise stated.
| Observation | |||||
|---|---|---|---|---|---|
| Telescope | XMM-Newton | NuSTAR | |||
| Obs. ID | |||||
| Instrument | EPIC-pn | EPIC-MOS 12 | RGS 12 | FPMA | FPMB |
| Start Date | 2016–06–13 | 2016–06–13 | 2016–06–13 | 2016–06–10 | 2016–06–10 |
| Time (UT) | 05:42:30 | 05:36:42 | 05:36:33 | 12:31:08 | 12:31:08 |
| End Date | 2016–06–13 | 2016–06–13 | 2016–06–13 | 2016–06–13 | 2016–06–13 |
| Time (UT) | 14:10:27 | 14:07:43 | 14:11:45 | 15:16:08 | 15:16:08 |
| Duration (ks) | 30.5 | 61.3 | 30.9 | 268.6 | 268.6 |
| Exposure (ks)a | 18.8 | 56.9 | 61.6 | 121.0 | 117.7 |
| Net Rate (s-1)b | |||||
-
a
Net exposure time, after background screening and dead-time correction. Note that the RGS and MOS exposures are for both detectors combined.
-
b
Net count rate between 0.4–10 keV for EPIC-pn, 0.4–2 keV for RGS in XMM-Newton and 3–30 keV for FPMA and FPMB in NuSTAR.
| Observation | ||||||
|---|---|---|---|---|---|---|
| Telescope | XMM-Newton | |||||
| Obs. ID | ||||||
| Instrument | EPIC-pn | RGS 12 | EPIC-pn | RGS 12 | EPIC-pn | RGS 12 |
| Start Date | 2000–12–14 | 2000–12–14 | 2002–06–30 | 2002–06–30 | 2015–07–03 | 2015–07–03 |
| Time (UT) | 11:35:23 | 11:13:06 | 03:06:41 | 03:00:57 | 22:32:33 | 22:26:35 |
| End Date | 2000–12–14 | 2000–12–14 | 2002–12–14 | 2002–12–14 | 2015–07–05 | 2015–07–05 |
| Time (UT) | 19:45:22 | 19:46:29 | 08:06:40 | 08:07:58 | 12:08:29 | 12:05:20 |
| Duration (ks) | 29.4 | 30.8 | 18.0 | 18.4 | 135.5 | 135.5 |
| Exposure (ks)a | 18.9 | 59.5 | 11.9 | 35.5 | 84.0 | 270.5 |
| Net Rate (s-1)b | ||||||
-
a
Net exposure time, after background screening and dead-time correction.
-
b
Net count rate between 0.4–10 keV for EPIC-pn and 0.4–2 keV for RGS.
2 Observations and Data Reduction
Ton S180 was observed between 10–13 June 2016 for a duration of with NuSTAR, and then simultaneously with XMM-Newton for in the last part of the observation. For comparison, we also reduced the archival XMM-Newton data of Ton S180 from the observations carried out on 2000–12–14, 2002–06–30 and 2015–07–03, with durations of 32, 18 and 141 ks, respectively.
2.1 XMM-Newton
2.1.1 EPIC
The XMM-Newton EPIC instruments were operated in small window mode with the medium filter applied. The XMM-Newton (Jansen et al., 2001) data were processed and cleaned by using the latest version of the Science Analysis System (sas v17.0.0; Gabriel et al., 2004) and the most recent set of calibration files. As a standard procedure we filtered the EPIC data for background flares and the net exposure times are listed in Tables 1 and 2. The EPIC pn (Strüder et al., 2001) and MOS (Turner et al., 2001a) source and background spectra were extracted from circular regions with radii of 40 and two of 25, respectively. The response matrices and ancillary files were generated with the sas tasks rmfgen and arfgen.
The source spectra were binned not to oversample the EPIC spectral resolution by a factor larger than 3, further imposing a minimum S/N of 5 per each energy bin.
2.1.2 Reflection Gratings Spectrometer
The XMM-Newton Reflection Gratings Spectrometer data (RGS hereafter; den Herder et al., 2001) were reduced using the standard sas task rgsproc. The high-background intervals were filtered by applying a threshold of on the background event files. We checked in each epoch that the RGS 1 and RGS 2 spectra were in agreement within the 3 per cent level. We then combined them by using the sas task rgscombine to a single RGS 12 spectrum in each epoch (see Table 2 for details).
Inspecting the EPIC and RGS spectra corresponding to the four epochs, there is no substantial change in the overall spectral shape but only a change in flux by a factor of 2.5 (see Section 3). We then stacked all the four RGS 12 spectra together into a single spectrum with net counts. The stacked spectra were initially coarsely binned to a resolution of per spectral bin. Such a binning is undersampling the RGS spectral resolution (i.e., – full width at half maximum) over the – bandpass, however it can be useful to initially identify the presence of strong emission lines in the spectrum. Due to the high S/N ratio, we also binned the RGS spectra to for a more detailed analysis.
2.1.3 Optical Monitor
In this work, we adopted the XMM-Newton Optical Monitor telescope (OM hereafter; Mason et al., 2001) in order to obtain the target’s photometric points listed below. In the 2016 observation we obtained five 1 ks, 1.3 ks and 2.6 ks exposures, in imaging mode, through the V (effective wavelength ), U () and UVM2 () filters, respectively. The data were processed by using the sas omichain pipeline, which takes into account the all the necessary calibration processes such as flat-fielding. We also ran a source detection algorithm before performing aperture photometry on each detected source. The count rates were averaged over the different exposures and the up-to-date calibration uncertainties of the conversion factor between count rate and flux were added quadratically to the statistical error.
Ideally, one should subtract the contribution of the host galaxy from the overall count rate. Ton S180 largely resembles a point source where the AGN dominates over the galaxy emission. However, we do not have enough information on the host galaxy to exclude a non-negligible host contamination to the V band (see e.g., Porquet et al. 2019). Only the U and UVM2 photometric points will be therefore used in this analysis. Systematic errors of 1.4 and 1.5 per cent were respectively added to the U and UVM2 fluxes in quadrature444https://xmmweb.esac.esa.int/docs/documents/CAL-SRN-0346-1-0.pdf. For each point we also applied an absorption correction due to the Galactic interstellar medium, based on the Cardelli, Clayton & Mathis (1989) extinction law. By using the standard value of and setting from the Galactic extinction maps by Schlafly & Finkbeiner (2011), we obtain , which translates into a count rate correction of and for the U and UVM2 filters, respectively. We used the OM canned response files555ftp://xmm.esac.esa.int/pub/ccf/constituents/extras/responses/OM in order to analyse the OM photometry in xspec.
2.2 NuSTAR
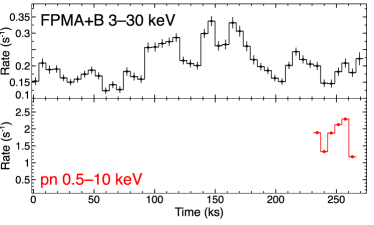
Ton S180 was observed with NuSTAR (Harrison et al., 2013) between 10–13 June 2016 for a total duration of , corresponding to a net exposure of about 120 ks for both FPMA and FPMB detectors. Towards the end of the observation Ton S180 was simultaneously targeted with XMM-Newton, as shown in the respective light-curves plotted in Fig. 1.
The NuSTAR data were reduced according to the standard procedure by using the HEAsoft task nupipeline v0.4.6 of the NuSTAR Data Analysis Software package (nustardas v1.8.0). We used the most recent calibration files caldb v20180419 and then applied the standard screening criteria, such as the filtering for the South Atlantic Anomaly (SAA) by setting the mode optimized in nucalcsaa v0.1.7. The spectra were extracted in each module from circular regions with radii of and for the source and background, respectively. For the spectral analysis in this paper, the resulting FMPA and FMPB spectra were rebinned so to oversample the intrinsic energy resolution (i.e., 400 eV over the range of interest) by a factor of 2.5, and further grouped to ensure a S/N of 5 per spectral channel. The light curves in the – energy band were extracted from the same regions using the nuproducts task. The background subtracted light curves from FPMA and FPMB were then combined into a single one.
3 Spectral analysis
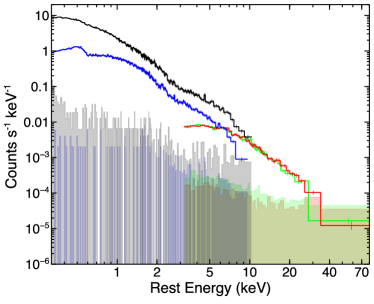
In Fig. 2 we show the background subtracted EPIC pn, MOS 12 and FPMA/B spectra between –, plotted with the corresponding X-ray background. The spectra have been corrected for the effective area of each detector. As Ton S180 is characterized by a soft continuum, the hard band is background dominated at energies keV. Regarding the soft X-ray band, the pn and MOS spectra diverge below 0.4 keV. In this work, we will then focus on the 0.4–30 keV range for the spectral analysis. In all fitting procedures, we include the contribution of a Galactic absorption column of , modelled with Tbabs (Wilms, Allen & McCray, 2000) and obtained from the recent H i measurements (HI4PI Collaboration et al., 2016). We also assume solar abundance of the main elements throughout the analysis unless stated otherwise.
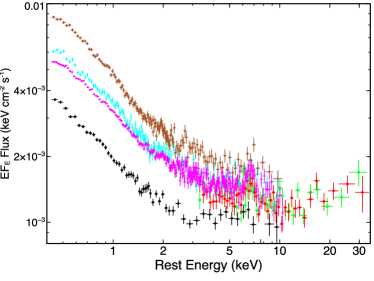
All the reduced spectra were analysed using the software packages ftools v6.25 and xspec v12.10.1b (Arnaud, 1996). The spectra produced from all the detectors are either binned to a minimum significance of 5 (EPIC, FPMA/B) or characterized by 25 counts per channel (RGS), hence we adopted the minimization technique for the EPIC-pn, RGS and FPMA/B spectral analysis throughout this paper. While here we mostly focus on the 2016 XMM-Newton and NuSTAR spectra, for comparison purposes in Fig. 3 also the XMM-Newton (EPIC-pn) spectra of 2000, 2002 and 2015 are shown. It is evident that the 2016 XMM-Newton and NuSTAR observation (EPIC-pn and FPMA/B) was in the lowest flux state, but the observed variability is mostly driven by intensity changes, while the spectral shape below 10 keV is rather similar to previous epochs.
3.1 RGS analysis
Previous analyses of Ton S180 revealed that the soft X-ray excess below 2 keV is very steep and virtually featureless (e.g., Turner et al., 2001b; Vaughan et al., 2002; Nardini, Fabian & Walton, 2012; Parker, Miller & Fabian, 2018). When we inspected the 2016 RGS spectrum, which was caught in a low flux state, we did not detect any significant emission or absorption features. However, as illustrated in Fig. 3, the spectral shape of the soft excess in Ton S180 hardly changes between the four XMM-Newton observations in the sixteen years period. After a careful check of the individual RGS spectra, in order to increase the S/N, we combined them with rgscombine into a single spectrum, which overall provides net counts. This operation, in general, is not trivial (see, e.g., Kaastra et al. 2011a). However, by simultaneously fitting the four individual spectra, we obtain qualitatively similar results.
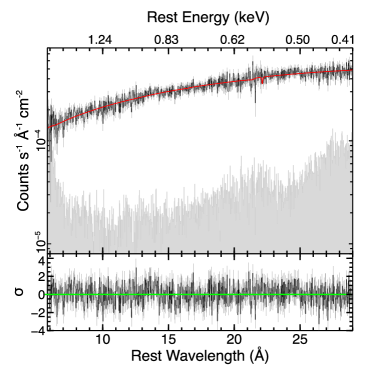
At this stage we can therefore adopt a spectral binning of , which fully samples the spectral resolution of the detector, and safely use the statistics. We find that modelling the spectrum with a simple power law and Galactic absorption produces an excellent fit, with . In Fig. 4 we show the stacked RGS 12 spectrum with the power-law model overlaid in red. In the lower panel, the corresponding residuals in units are shown. This result strongly suggests that the soft X-ray spectrum in Ton S180 is largely consistent with a simple power-law with a steep photon index of . Yet, given the data quality, we subsequently performed a blind emission and absorption line search by scanning the 6–31 band in steps of 0.03 for narrow Gaussian profiles. We included a line to the power-law continuum plus Galactic absorption model, allowing for both positive and negative normalizations and free (but limited by the resolution of the RGS spectrum) width.
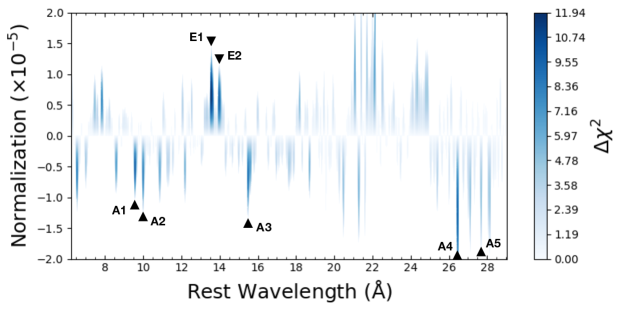
In Fig. 5 we show the results of our blind search, which confirms that the spectrum is largely featureless. The largest significance (/) is found at (marked as E1 in Fig. 5), which is formally the wavelength of the intercombination transition of the Ne ix triplet. Also the adjacent bins provide a significant improvement. Since we cannot distinguish the individual components of the triplet from the scan, we initially included in the baseline model a single Gaussian profile with free width. The fit improves by / down to for (consistent with the Ne ix intercombination component). Note that in this Section uncertainties are given at the 68 per cent () confidence level. The best line width and equivalent width are and m. We also tried to resolve the triplet by including three Gaussians with fixed eV at the expected lab wavelengths of the resonant (r), intercombination (i), and forbidden (f) components. The statistical improvement in this case is slightly lower, /, for m, m, and m. The only other barely significant emission feature in the line scan falls just shortwards of 14 (labelled as E2). If real, this could be due to a blend of Fe-L transition, mostly from Fe xxi. The Ne ix detection supports the notion that even in (apparently) ‘bare’ AGN, some gas with modest covering factor exists outside the line of sight (see also Reeves et al., 2016).
Some caution is required in interpreting the possible absorption features in the stacked spectrum, which could be found at unsual energies if associated with outflowing material. We first repeated the line scans on the single epochs, verifying that the 2015 observation dominates the statistics. Three lines in the stack are significant at more than the 99 per cent level (/) according to the blind scan, at (A1), (A3), and (A4). None of these correspond to strong transitions in either the rest frame of Ton S180 or the lab frame. When the number of resolution elements is taken into account (a spurious improvement can appear in any bin), no safe detection is confirmed. Indeed, Parker, Miller & Fabian (2018) did not find any significant features in the 2015 RGS spectrum. However, in order to constrain the properties of any possible ionized absorber along the line of sight, we adopted the xstar photoionization code (Bautista & Kallman, 2001; Kallman et al., 2004) to generate an absorption table with a realistic ionizing SED (see Section 3.5) as input spectrum, gas density of cm-3 (from the intensity ratio between forbidden and intercombination lines in the Ne ix triplet, after Porquet & Dubau 2000)666This estimate should be taken with caution, since the constraints on the Ne ix components are rather poor, and the assumption that emission and absorption arise from the same gas is not necessarily true. The results, however, are only mildly sensitive to the choice of the gas density., and turbulent broadening of 300 (based on the resolution of the RGS spectrum). The xstar code computes the radiative transfer through a spherically symmetric shell of ionized gas. Through the generated absorption grid we can measure three physical parameters of the gas: the column density , the ionization parameter777This is defined as (Tarter, Tucker & Salpeter, 1969), where is the ionizing luminosity, is the gas number density and is the radial distance from the ionizing source., and the outflow velocity (via the redshift parameter).
The inclusion of the xstar grid improves the fit by /, equivalent to a 3.1 confidence. The column density is largely unconstrained between 19.7–22.0, while and . Assuming that the absorber is instead local to our Galaxy or to the AGN frame gives a worse fit by and 15, respectively.
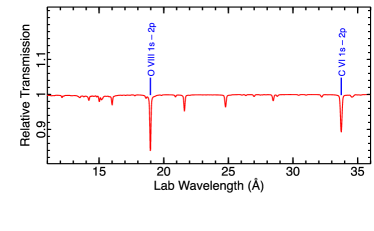
In Fig. 6 we show the transmission curve of the putative absorber shifted to the lab frame. Interestingly, the two main lines from O viii (1s2p, ) and C vi (1s2p, ) correspond to major features in the line scan at and (A5). At this outflow velocity, also the , (A2) and residuals can be associated with resonant transitions, from Fe xxii (2p3d, , Fe xxi (2p3d, ) and Li-like S xiv (2p3d, , but these cannot be reproduced by the same absorption grid as they require different ionization (that is, higher in the case of the Fe-L complex).
The presence of a fast accretion disc wind in Ton S180, although intriguing, remains tentative (see also Section 4.3). In any case, we can consider the soft X-ray spectrum as effectively featureless in the following analysis of CCD-resolution spectra.
| Component | Parameter | – | – | Description (units) |
|---|---|---|---|---|
| Tbabs | Galactic column (cm-2) | |||
| relxill | Inner emissivity index | |||
| Outer emissivity index | ||||
| Break radius () | ||||
| Black hole spin | ||||
| Inclination (degrees) | ||||
| Photon index | ||||
| High energy cut-off (keV) | ||||
| Ionization (erg cm s-1) | ||||
| Iron abundance (solar) | ||||
| Reflection fraction | ||||
| norm | Normalization (arbitrary) | |||
| MOS | Cross-normalization | |||
| FPMA | ||||
| FPMB | ||||
| Fit statistic | ||||
| Component | Parameter | –Cp | –lpion | –D | –D () | Description (units) |
|---|---|---|---|---|---|---|
| Tbabs | Galactic column (cm-2) | |||||
| relxill– | – | Inner emissivity index | ||||
| – | Outer emissivity index | |||||
| – | Break radius () | |||||
| – | – | – | Source height () | |||
| Black hole spin | ||||||
| Inclination (degrees) | ||||||
| Photon index | ||||||
| High energy cut-off (keV) | ||||||
| – | – | – | Coronal temperature (keV) | |||
| Ionization (erg cm s-1) | ||||||
| Ionization gradient index | ||||||
| Iron abundance (solar) | ||||||
| (Inner) disc density (cm-3) | ||||||
| – | – | – | Outer disc density (cm-3) | |||
| Reflection fraction | ||||||
| norm1 | Normalization (arbitrary) | |||||
| norm2 | – | – | – | Normalization (arbitrary) | ||
| xillver | norm | Normalization (arbitrary) | ||||
| MOS | Cross-normalization | |||||
| FPMA | ||||||
| FPMB | ||||||
| Fit statistic | ||||||
3.2 Broadband modelling with relativistic reflection
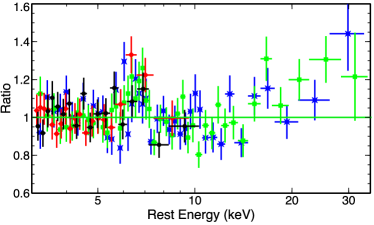
Given the lack of strong emission (or absorption) features in the RGS spectrum, we now investigate whether X-ray reflection or Comptonization models can account for the broadband spectrum of Ton S180. Reflection models have been successful in reproducing self-consistently the prominent features imprinted on the X-ray spectrum of AGN and X-ray binaries. These include the soft and hard X-ray excesses as well as broad Fe K emission profiles (e.g., Fabian et al., 2004; Fabian & Ross, 2010; Walton et al., 2013; Jiang et al., 2019). In Fig. 7 we show the 2016 spectra in the – rest-energy band, fitted with a simple power law with photon index . A broad () and symmetric Fe K emission component (with centroid energy at keV) is evident, as well as some hard excess above . As a first step, we aim to test whether these features can be reproduced with a relativistic reflection model alone.
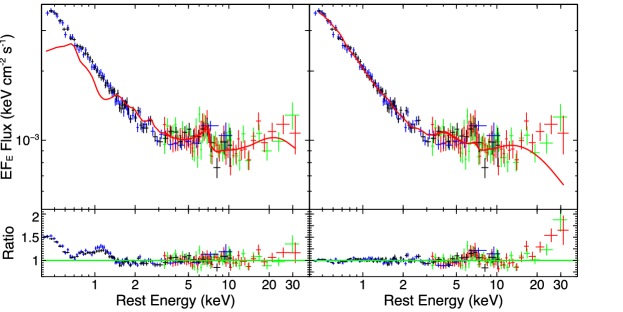
We start by fitting the – band, where a cross-normalization between the EPIC and FPMA/B spectra is included to account also for the slightly different average flux. We adopted the state-of-the-art reflection model relxill v1.2.0 (García et al., 2014; Dauser et al., 2014), with Fe abundance fixed to solar and emissivity index , while spin, disc inclination, ionization parameter and reflection fraction were allowed to vary. The disc inner radius is set by the spin parameter, i.e., .888Later in this work, we will distinguish between the ‘physical’ disc inner radius and a ‘reflection inner radius’, . The two quantities are coincident in pure reflection models. We find that the model reproduces very well the – spectra with . The best-fit parameters are listed in Table 3. However, by extrapolating the XMM-Newton spectra down to 0.4 keV the basic relxill model is not able to account for the soft X-ray excess, as shown in Fig. 8 (left). Given that the NuSTAR spectrum is truncated at 30 keV due to the high background, we cannot constrain the cut-off energy of the primary continuum (hence the hot-corona temperature), which was subsequently fixed to 300 keV for the remainder of the paper.
The broadband (– keV) spectrum was then refitted allowing for a broken power-law emissivity function with break radius and for free Fe abundance. In the fitting procedure, we fixed the outer emissivity index to the classical (non relativistic) limit of , and keep this assumption for the rest of the reflection analysis, unless stated otherwise. This broken power-law configuration resulted in a break radius of , which could be considered as a stringent lower limit for the size of the corona, considering a reasonable extension of 10 (e.g., Wilkins & Fabian, 2012; Kammoun et al., 2019, see also Section 3.4). Statistically, the new model returned a fairly decent fit, . However, whilst fitting well the soft excess, this model is incapable of accounting for the Fe K emission profile and the hard X-rays above 10 keV. This is because, after the inclusion of the soft band, more extreme parameters (e.g., , ; Table 3) are needed to reproduce the smoothness (see Section 3.1) and steepness of the soft X-ray spectrum. Indeed, also the slope of the primary continuum slightly increases, so that significant residuals are present over the – keV band (where now ), as illustrated in Fig. 8 (right).
To determine whether reflection can explain the 2016 XMM-Newton and NuSTAR data, we must therefore allow for more complex models, involving the different physical and geometrical configurations of the disc/corona available within the relxill package. Firstly, we attempt to improve the above fit by including the additional contribution of a neutral, unblurred reflector, modelled with xillver (García et al., 2013). Previous works established that evidence of a distant reflection component (i.e., from the torus) in Ton S180 is at most marginal (e.g., Takahashi, Hayashida & Anabuki, 2010; Nardini, Fabian & Walton, 2012; Parker, Miller & Fabian, 2018), as a narrow Fe K core is virtually undetected. Nonetheless, the high S/N data provided by the NuSTAR coverage allows us to better investigate the true level of the continuum above 10 keV. Secondly, for the disc/corona component we switch to the relxillCp version, in which the reflection spectrum is calculated by using a more physical primary continuum, implemented with the nthcomp Comptonization model (Zdziarski, Johnson & Magdziarz, 1996; Życki, Done & Smith, 1999) instead of a simple cut-off power law. The ‘seed’ photon temperature is fixed at 50 eV. The model has virtually the same parameters as relxill, with the only difference that in the former the high energy cut-off is replaced by the coronal electron temperature, . An approximated relationship between these two quantities is (Petrucci et al., 2001). Accordingly, we can directly associate the cut-off energy to the electron temperature.
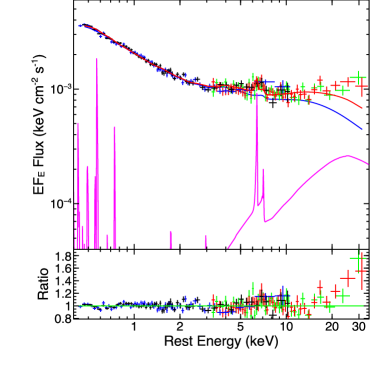
The overall relativistic plus distant reflection model can be described as Tbabs*(relxillCp xillver).999The disc inclinations and the photon indices are tied together between the ‘unblurred’ and ‘blurred’ reflector components. Solar iron abundance and are assumed for the former component. The addition of the unblurred component provided a considerable improvement to the fit, by / (i.e., 5), leading to . Despite such improvement, it appears that the model still struggles to properly account for both the Fe K region (between 6–8 keV) and the hard X-rays above 10 keV, as shown in Fig. 9. The relxillCp xillver model yielded a reflection fraction of , a disc inclination of , and a disc ionization of , which are all broadly consistent with what Parker, Miller & Fabian (2018) found for the 2015 XMM-Newton observation. Iron abundance is consistent with the solar value, . In terms of the primary continuum parameters, this model returned a steep photon index of , which is consistent with what was measured in previous observations of Ton S180 (e.g., Comastri et al., 1998; Turner, George & Nandra, 1998; Nardini, Fabian & Walton, 2012; Parker, Miller & Fabian, 2018). Note that this value is steeper by than what is derived from the – band. This confirms that the soft excess has a major impact on the broadband model, and does argue in favour of a more complex continuum.
As a further test, we investigate whether a lamp-post coronal geometry can equally or better reproduce the 2016 spectra. We thus replaced the relxillCp model with relxilllpion, a version where the primary X-ray source is assumed to be a point source located along the rotational axis of the black hole. This model is physically and geometrically self-consistent in terms of reflection strength and disc emissivity profile, as can be calculated directly from the source height in the lamp-post configuration through the parameter FixReflFrac (fixed to 1). Moreover, a radial ionization gradient is allowed for in the disc. We adopt an empirical power-law gradient, with evaluated at and declining as , where we imposed . We find that the X-ray source height is very low, constrained within , implying that the X-ray illumination of the disc is centrally concentrated due to severe light bending (in agreement with the steep emissivity index within in relxillCp). This model prefers a maximally spinning black hole () and a smaller disc inclination (), while iron abundance is moderately super-solar at .
Interestingly, the fit converges to a flat ionization profile, with hence constant . All the other parameters remain stable. Overall, this model returned a worse fit (/) compared to the relxillCp case, with . By relaxing the condition on the index , the best-fit value would become , implying that the ionization of the disc moderately increases with radius. Although the fit improves by for the same degrees of freedom we find this solution unlikely (see also Fig. 2 in Kammoun et al. 2019), as it suggests (in first approximation) that the density of the disc drops faster than , which is incompatible with a standard disc. In fact, if we adopt instead in relxilllpion the ionization profile based on the density of an -accretion disc (Shakura & Sunyaev, 1973), the fit statistics further deteriorates down to .
We then replaced relxilllpion with relxillD, where the (constant) accretion disc density is a free parameter. The reflected spectra are computed allowing for a disc density ranging from the standard case of up to (García et al., 2016). In a higher density regime, the thermal emission at soft X-ray energies would increase and so raise the continuum flux at , allowing the fit of a stronger soft X-ray excess. This model is therefore particularly relevant to the case of Ton S180. By letting the disc density vary, however, the best-fit value remains pegged at the lower limit. We constrain , which is consistent with the previous measurement by Jiang et al. (2019), i.e., cm-3. The overall statistics of , however, are slightly improved over the relxillCp model, implying that a simple cut-off power-law shape is marginally preferred for the primary continuum.
Given that the soft ( keV) and hard ( keV) bands of Ton S180 apparently require distinct reflection parameters (Table 3), as a final test we built a model with two relxillD components. Specifically, we created a model where the innermost regions of the disc are allowed to have different density, emissivity index and ionisation parameter compared to the outer regions. We use the parameter to set the boundary between the inner and the outer disc. Iron abundance and reflection strength are tied between the two components, as well as the geometrical parameters (spin, inclination). In this configuration, the inner component, subject to stronger blurring effects and possibly denser, could account for the soft excess, while the hard reflection features could arise at larger distance. At this stage, the xillver distant reflector is discarded. This dual relxillD model turns out to be statistically similar to the relxillCp xillver and relxillD xillver models, with . The inner region is suggested to be very compact, confined within the central 5 (although with loose constraints, possibly due to some degeneracy between the two components), and it is characterized by nearly maximal spin, steep emissivity, and high ionization. Contrary to the expectations, however, its density remains low, . The density is instead larger farther out, where , causing a drop of the ionization to . If anything, this result supports the presence of a reflection component that does not arise from an extreme gravity regime, which, given the shape of the Fe K complex, seems more likely associated with the outer disc rather than with a pc-scale reprocessor.
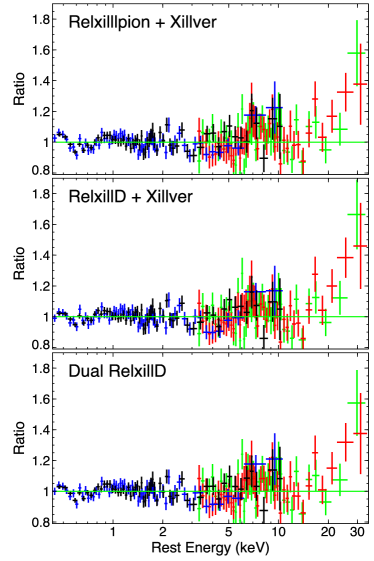
The best-fit parameters for all the reflection models are reported in Table 4. The corresponding data/model ratios of the relxilllpion (top panel), relxillD (middle) and dual relxillD (bottom) fits are shown in Fig. 10, where significant residuals are still present. It is clear that none of these versions are able to reproduce the whole 0.4–30 keV XMM-Newton and NuSTAR spectrum. In fact, we find that the lamp-post scenario, which is the most rigid due to the enforced self-consistency in terms of disc emissivity, reflection strength and possibly also ionization profile (in the -disc variant), provides the worse fit to the data compared to the other reflection models.
| Component | Parameter | Best-fit value | Description (units) |
|---|---|---|---|
| Tbabs | Galactic column (cm-2) | ||
| nthComp | Seed photon temperature (eV) | ||
| Photon index, warm corona | |||
| Temperature, warm corona (keV) | |||
| norm | Normalization (arbitrary) | ||
| relxillCp | Emissivity index () | ||
| Black hole spin | |||
| Inclination (degrees) | |||
| Photon index, hot corona | |||
| Ionization (erg cm s-1) | |||
| Temperature, hot corona (keV) | |||
| Iron abundance (solar) | |||
| Reflection fraction | |||
| norm | Normalization (arbitrary) | ||
| smallBB | norm | Normalization () | |
| MOS | Cross-normalization | ||
| FPMA | |||
| FPMB | |||
| Fit statistic |
3.3 Phenomenological warm corona: nthComp
Having established that relativistic reflection alone cannot self-consistently describe the 2016 XMM-Newton and NuSTAR spectra of Ton S180, we subsequently included the contribution of warm Comptonization. In order to model each of the Comptonized coronal emissions (warm and hot) we adopted nthComp. There are three main parameters that can be obtained in nthComp: the electron temperature of the plasma , the seed disc-photon temperature and the asymptotic power-law photon index of the Comptonized spectrum . On this basis, we fitted the 2016 broadband XMM-Newton and NuSTAR spectra with a phenomenological warm corona model constructed as follows: Tbabs*(smallBB + nthCompwarm+ relxillCp). The hot corona parameters are already hardwired in relxillCp, where the incident spectrum is obtained with nthComp as well (García et al., 2014; Dauser et al., 2014, see also Section 3.2).
For this test, we also take advantage of the U and UVM2 photometric points provided by the OM, in order to extend the analysis to the optical/UV band. By doing so, decide to leave the temperature of the ‘seed’ photons free in this fitting procedure.101010We note that this choice introduces a small internal inconsistency, as in the in relxillCp component is hardwired to 50 eV. However, the X-ray spectral shape is fully insensitive to exact value of , provided that it is well outside the fitted bandpass. Moreover, we also consider the contribution from the broad line region (BLR), which is responsible for the small blue bump emission at 3000 (Grandi, 1982). We modelled this component with an additive table (smallBB), where the normalization is the only free parameter in units of . The physical assumption was presented in detail by Mehdipour et al. (2015) for NGC 5548. Its inclusion improved the fit by /, corresponding to a 5 confidence level.
The warm corona component is found to have an electron temperature of eV with a photon index of . From these values and following the method described in Beloborodov (1999)111111The optical depth is estimated from the following equation: , where is the Compton parameter and ., we estimate the corresponding optical depth to be . This can be identified with the extended and optically thick plasma that covers a large fraction of a ‘passive’ accretion disc in the models of Różańska et al. (2015) and Petrucci et al. (2018). Indeed, no direct disc emission is required. With this respect, it is worth noting that eV, which is significantly lower than predicted for a standard disc and a black hole with mass accreting at the Eddington limit in Ton S180 (e.g., Turner et al., 2002). Values of of a few eV, irrespective of , are systematically found in the ‘passive disc’ scenario (e.g., Petrucci et al., 2018), and seem to be required to fit the OM data. We stress, however, that all the other model parameters, which are entirely driven by the X-ray spectra, are not affected by .
Here, we chose relxillCp to model simultaneously the hot corona responsible for the primary continuum and the reflection features as the broad ( eV) iron K emission line at keV and the X-ray emission above 10 keV. For the hot corona, we find a lower limit on the electron temperature of keV, which was then fixed to 100 keV. With , this corresponds to . These values are consistent with the standard optically thin and hot plasma that shapes the primary X-ray continuum in AGN (e.g., Fabian et al., 2015). During the fitting procedure the disc emissivity is assumed to be at its default classical solution, i.e., . The reflection fraction is rather low, measured at , and an upper limit on the spin value of is preferred in the fit, where a maximal spin is ruled out at the confidence level. The inclination is about . Interestingly, these results are nearly identical to the findings of the relxill fit over the 3–30 keV range, and are also consistent with the 2015 XMM-Newton sequence reported in Parker, Miller & Fabian (2018).
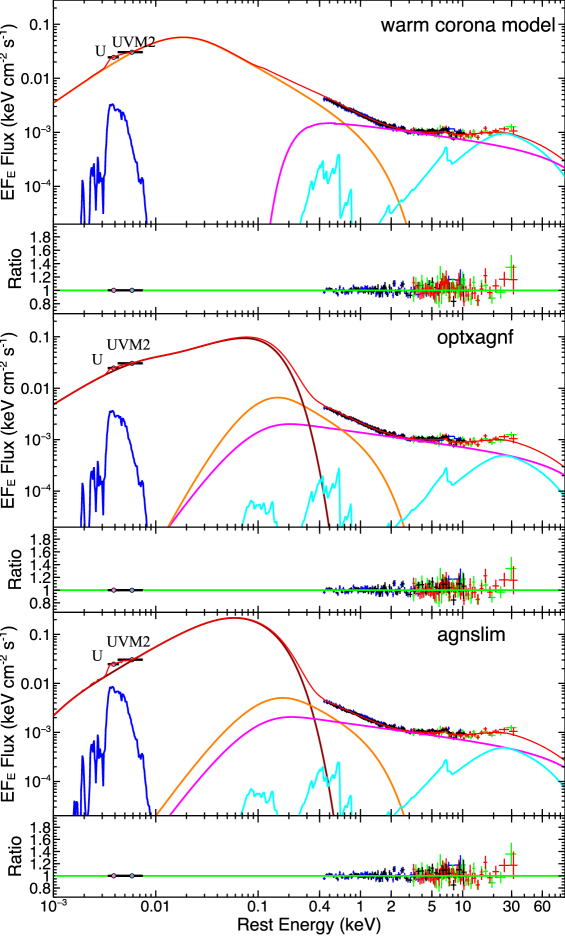
Fig. 11 (top) shows the best fitting warm-corona model (red) for the 2016 XMM-Newton and NuSTAR observation, where the individual contributions of the warm corona (orange), hot corona (magenta) and mild relativistic reflector (cyan) are also displayed. The warm corona scenario explains very well the XMM-Newton and NuSTAR spectra, and it statistically yields a very good fit with , which is a considerable improvement over any of the above relativistic reflection models. The best-fit values are reported in Table 5. It should be kept in mind, however, that this model is purely phenomenological, and that its construction does not ensure a physical self-consistency.
3.4 Self-consistent warm corona: optxagnf
| Component | Parameter | Best-fit value | Description (units) |
|---|---|---|---|
| Tbabs | Galactic column (cm-2) | ||
| optxagnf | Black hole mass () | ||
| Co-moving proper distance (Mpc) | |||
| Black hole spin | |||
| Photon index, hot corona | |||
| Temperature, hot corona (keV) | |||
| Temperature, warm corona (keV) | |||
| Optical depth, warm corona | |||
| log | Eddington ratio | ||
| Coronal radius () | |||
| Energy dissipated in the hot corona (%) | |||
| relxillCp | Emissivity index () | ||
| Inclination (degrees) | |||
| Reflection inner radius () – tied to | |||
| Photon index – tied to | |||
| Ionization (erg cm s-1) | |||
| Iron abundance (solar) | |||
| norm | Normalization (arbitrary) | ||
| smallBB | norm | Normalization () | |
| MOS | Cross-normalization | ||
| FPMA | |||
| FPMB | |||
| Fit statistic |
Moving forward with the UV/X-ray SED fitting procedure, we replaced the phenomenological warm corona model (i.e., nthComp) with the physically motivated optxagnf (Done et al., 2012). This assumes a similar physical scenario but with the warm corona embedded in the disc and energetically self-consistent. The overall model is constructed as follows: Tbabs*(smallBB+optxagnf +relxillCp). The optxagnf model consists of three main spectral components which are powered by dissipation in the accretion flow. The first contribution is from the thermal optical/UV emission arising from the outer regions of the accretion disc; the second component is produced via Compton up-scattering of ‘seed’ UV photons into soft X-ray photons in a warm corona; the third component is the primary X-ray power-law emission from Comptonization in the hot corona. Compared to the previous model, in optxagnf it is possible to measure the coronal size (), defined as a transitional radius from the outer disc to the inner Comptonizing region. The parameter is the fraction of the total energy dissipated in the hot corona and emerging as the hard power-law component, while the remaining fraction is dissipated in the warm corona as the soft excess. The parameter is the Eddington ratio. The parameters and are the electron temperature and optical depth of the warm corona, respectively. The calculation of the optxagnf model assumes a disc inclination angle of , when the normalization is fixed to unity. In order to take into account the inclination effects on the optxagnf emission, we tied the normalization to the inclination angle of relxillCp using the relation .
We find that the temperature and optical depth of the warm corona component are broadly consistent with the phenomenological model at eV and . The fraction of energy released in the hot corona is per cent. The coronal size is reasonably compact at , which would explain also the presence of a moderately broad iron K component. In fact, we have assumed here that disc reflection arises at distances larger than , by tying . Note that the physical inner radius of the disc () cannot be assessed through reflection in this configuration, hence we fixed the spin to . Interestingly, the Eddington ratio is measured at , which implies that Ton S180 radiates at a considerable fraction (at least per cent) of its Eddington luminosity.
In Ton S180, the black hole mass is still rather uncertain. From the optical spectrum obtained at the ESO 1.52-m telescope (La Silla) in 1996 October, presented in Comastri et al. (1998), we obtain a single-epoch virial using the Bentz et al. (2013) relation with virial factor . When fixing in optxagnf to the face-value of , the model either struggles to account for the UV to soft X-ray band or returns values of of several hundreds of , which are unphysically large under the assumption that the disc is not completely passive (see Section 3.3). We therefore allowed to vary and then froze it to the preferred value of . The Eddington ratio inferred above should therefore be considered as a conservative lower limit. In all the SED fits presented from here on, we still included the contribution of the small blue bump from the BLR and the usual reflection component, as shown in Fig. 11 (middle panel). This physically motivated warm corona scenario returned an excellent fit to the data, i.e., . The best-fit values are tabulated in Table 6.
| Component | Parameter | Best-fit value | Description (units) |
|---|---|---|---|
| Tbabs | Galactic column (cm-2) | ||
| agnslim | Black hole mass () | ||
| Co-moving proper distance (Mpc) | |||
| Black hole spin | |||
| Temperature, hot corona (keV) | |||
| Photon index, hot corona | |||
| Outer radius, hot corona () | |||
| Temperature, warm corona (keV) | |||
| Photon index, warm corona | |||
| Outer radius, warm corona () | |||
| Eddington ratio | |||
| relxillCp | Emissivity index () | ||
| Inclination (degrees) | |||
| Reflection inner radius () – tied to | |||
| Photon index – tied to | |||
| Ionization (erg cm s-1) | |||
| Iron abundance (solar) | |||
| norm | Normalization (arbitrary) | ||
| smallBB | norm | Normalization () | |
| MOS | Cross-normalization | ||
| FPMA | |||
| FPMB | |||
| 0.5–2 keV | |||
| Flux | 2–10 keV | Observed fluxes (erg cm-2 s-1) | |
| 10–30 keV | |||
| Fit statistic |
3.5 Warm Comptonization at high accretion rates: agnslim
As Ton S180 is accreting close to its Eddington rate, we also model the 2016 UV/X-ray SED with agnslim. This spectral library was developed by Kubota & Done (2018, 2019) for super-Eddington black hole accretion, based on the emissivity model from a radially stratified disc (Abramowicz et al., 1988). The radial advection keeps locally the surface luminosity at the Eddington limit, resulting in a radial emissivity profile throughout the disc, where is the surface luminosity as a function of radius. As in optxagnf, there are three distinct emitting regions: the outer disc from to ; a warm Comptonizing region, between and , producing the soft X-ray excess; an inner hot Comptonizing region from extending, untruncated, down to the inner radius of the flow.
The model is constructed by simply replacing optxagnf with agnslim model, thus obtaining: Tbabs*(smallBB + agnslim + relxillCp). The inclination angle of the disc is variable through the parameter , as opposed to the fixed value of 60∘ in optxagnf. In the fitting procedure we tied it to the inclination parameter of relxillCp, for a viewing angle of deg.
The agnslim parameters measured for the warm Comptonizing component are largely consistent with the previous results: the electron temperature is eV, while is fully consistent with the RGS spectral slope. Differently from the previous model, we allowed the black hole spin to vary as the exact position of the ISCO is important in agnslim. The best-fit value is now , but this is again consistent with zero at the 90 per cent confidence level ().
The outer radii of the hot and warm emitting regions are estimated to be and (but always larger than , see below), respectively. These measurements confirm that the warm plus hot Comptonizing regions are rather compact. This is largely consistent with optxagnf, despite the different geometry and inferred BH mass (see Section 4.2.2). For the hot Comptonizing region, the electron temperature is (then again fixed to 100 keV), whereas the photon index is . This continuum slope is also assumed for the reflection component, as leaving free gives a consistent value for a marginal statistical improvement (). Here the Eddington ratio is constrained to lie in the super-Eddington regime, . Overall, the agnslim model provided an excellent fit to the 2016 data, with (see Table 7). The best-fit agnslim model, with the corresponding residuals, is shown in the bottom panel of Fig. 11.
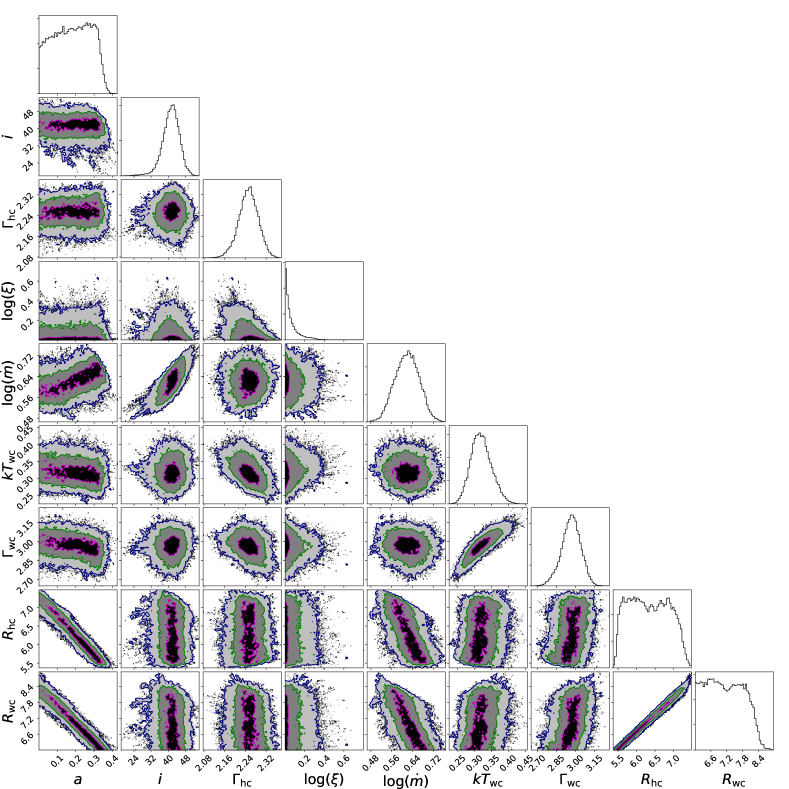
As a final test, given the model complexity, we searched for possible degeneracies by adopting the xspecemcee 121212https://github.com/jeremysanders/xspec_emcee,131313https://github.com/zoghbi-a/xspec_emcee implementation of the emcee code (Foreman-Mackey et al., 2013). The MCMC contours for the best-fit agnslim model (Fig. 12) are calculated from 500,000 points, using 100 walkers and burning the first 100,000 steps. Fig. 12 shows some mild degeneracies between the key coronal parameters. For instance, and are strongly correlated with each other, which ensures that , while both are unsurprisingly anti-correlated with the spin (the higher the spin, the smaller ). Also the inclination and the accretion rate are naturally linked to each other: the disc is inherently an anisotropic emitter of optical/UV radiation, hence for a given observed luminosity the higher the inclination, the higher the accretion rate (e.g., Davis & Laor, 2011). As mentioned, the temperature of the hot corona () is poorly constrained, as is iron abundance (which was eventually frozen to solar). A stringent upper limit is measured for the ionization parameter of the disc, , suggesting that the reflection component arises at rather large distance. Such a case was also found by Porquet et al. (2018, 2019) whilst fitting the broadband spectra of Ark 120 with a warm/hot-coronal model.
This notwithstanding, we caution against taking such a low ionization at face value. Indeed, all the other reflection properties are consistent with those obtained over the 3–30 keV band with a plain relxill model (Table 3). Since the observed prominence of a feature like the Fe K depends on the ionization, the value apparently compensates for the fact that the primary continuum in this model is described by a different component (i.e., agnslim). This is therefore a possible shortcoming associated with the imperfect self-consistency of ‘hybrid’ reflection plus warm Comptonization models.
4 Discussion
We presented a detailed broadband spectral analysis of the 0.4–30 keV X-ray emission of the NLSy 1 galaxy Ton S180, simultaneously observed by XMM-Newton and NuSTAR for the first time. The source was caught in a low flux state compared to the three previous XMM-Newton observations. However, as the joint coverage is only carried out towards the end of the observation, the average NuSTAR flux level is about per cent higher than for XMM-Newton. Thanks to the simultaneous broadband coverage, we aim to test whether the soft excess in Ton S180 can be explained with either (i) relativistic reflection, or (ii) a warm corona scenario. To solve the problem of the soft excess, in fact, it is fundamental to have spectral coverage also above (e.g., Boissay, Ricci & Paltani, 2016).
4.1 The role of relativistic reflection
Regarding case (i), we adopt four different flavours of the relxill package to test different coronal geometries, accretion disc densities or shape of the primary spectrum (see Section 3.2). We find that each of these relativistic reflection models cannot self-consistently reproduce simultaneously the soft X-ray excess, the mildly relativistic Fe K emission line, and the hard X-ray spectrum above 10 keV in Ton S180. A comprehensive spectral analysis using relxillD, to allow for reflection from high-density discs, was carried out by Jiang et al. (2019) on 17 Seyfert 1 galaxies from the XMM-Newton archive. Ton S180 was also included in their sample and the best-fitting model favoured a disc density of , successfully accounting for both the steep soft excess and the broad Fe K emission line in the (stacked 2000–2016) EPIC-pn spectrum of Ton S180 (see their Fig. 6). Interestingly, the required enhancement in the disc density is only moderate, about times larger than in the standard reflection codes (where the disc density is fixed), which had already been shown to work relatively well for Ton S180 below 10 keV (Nardini, Fabian & Walton, 2012; Walton et al., 2013).
The difference between Jiang et al. (2019) and our results can be clearly attributed to the inclusion of the NuSTAR data (see Fig. 8, right). The major problem in fitting the broadband X-ray emission, between 0.4–30 keV, arises in the attempt for the pure reflection models to fit such a steep and smooth soft excess. In fact, in all the permutations that we have tested in this paper, the key reflection parameters are somewhat fine-tuned to ensure extreme ‘blurring’, combining a maximally rotating black hole (), a very steep disc emissivity profile (), and/or a low source height (), whilst largely missing the hard X-ray band. Indeed, when fitting the 3–30 keV XMM-Newton and NuSTAR spectra the reflection model accounted very well for both the hard X-rays and the broad Fe K emission. The above issue arises as soon as we include the data below 3 keV. Notably, the key reflection parameters inferred from the 3–30 keV spectra remain remarkably stable when the soft band is reproduced through a different (i.e., Comptonized) component, which clearly supports the presumption of an alternative explanation for the soft X-ray excess.
Similar shortcomings were also encountered in a recent work focusing on another prototypical ‘bare’ AGN, Ark 120, based on a large simultaneous XMM-Newton and NuSTAR campaign carried out in 2014 (Porquet et al., 2018, 2019). It was found that in order to reproduce the soft excess, the reflection scenario required an high degree of blurring, a maximally rotating black hole and high reflection fraction when fitting the whole 0.3–79 keV spectrum. As per Ton S180, the relativistic reflection models failed to account for both the soft and hard X-ray bands simultaneously in Ark 120 (Porquet et al., 2018, see their Fig. 8). Another evidence that relativistic reflection cannot easily explain the soft X-ray excess in Ton S180 is provided by the high S/N stacked RGS spectrum. We find that the soft X-ray spectrum only shows marginal signatures of emission lines. In fact, the RGS spectrum of Ton S180 is largely consistent with a simple power law (see Fig. 4). Given its nearly featureless nature, it is difficult to reconcile the RGS with a blurred reflection model, as in the latter case some relativistically broadened emission, such as from Fe L, could still be present in the spectrum (e.g., Fabian et al., 2009).
For completeness, we also fitted the 2016 XMM-Newton and NuSTAR spectra with alternative relativistic reflection models from the reflkerr141414https://users.camk.edu.pl/mitsza/reflkerr/ package (Niedźwiecki, Szanecki & Zdziarski, 2019). A detailed comparison between relxill and reflkerr is beyond the scope of this work. Here we only compare the lamp-post and the high-density models, i.e., reflkerrExp_lp and reflkerrExpD, respectively (the suffix Exp indicates that in both models the primary continuum takes the shape of a power law with exponential cutoff). We find that the results returned from the above reflection models are largely consistent, in terms of the reduced , with relxilllpion and relxillD. These again require extreme blurring values, moderate accretion disc density and low disc inclination, but leave significant residuals in the Fe K and hard X-ray bands.
4.2 The warm corona scenario
In contrast, in case (ii), we find that the 0.4–30 keV band (and consistently down to the available optical/UV photometric points) can be explained by a combination of: (a) direct thermal emission from the accretion disc and/or (b) optical/UV seed disc-photons that are Compton up-scattered by a warm ( keV) and optically thick () plasma, dominating below ; (c) a hot ( keV) and optically thin () Comptonizing corona responsible for the primary X-ray emission above 2 keV; and (d) a mildly relativistic reflection component responsible for the Fe K feature at 6.6 keV and the hard X-ray emission.
This ‘hybrid’ warm corona plus reflection model can simultaneously account for the soft and hard X-ray spectrum of Ton S180. In this scenario, hard X-ray photons are produced in the hot coronal region, where a fraction are directly observed as the power-law continuum and some would heat the upper layers of the accretion disc creating an optically thick warm coronal region. Subsequently, the UV disc photons are Comptonized into the observed soft X-ray photons.
4.2.1 Are optically thick/warm coronae physically plausible?
Some of the physical properties of the accretion disc/coronal systems, i.e., their exact geometry and relative location, are still largely unknown. In particular, the plausibility of a warm corona is still the subject of open debate. Recently, in a detailed analysis performed on the bright Seyfert 1 galaxy Mrk 509, García et al. (2019) found that the soft excess could be well explained with either a warm corona component or a relativistically blurred, high-density reflection model (i.e., relxillD with cm-3). Since on statistical ground neither of these scenarios prevailed, García et al. (2019) discussed the physical implications of the two models. It was argued that a low-temperature warm corona (– keV) with large optical depth (–) is somewhat conflicting with the standard view of a corona where electron scattering is the main cause of opacity. In their simulations, the authors found that in such a low-temperature/optically-thick regime, atomic opacity dominates over Thomson opacity. This scenario would lead to the inevitable presence of a wealth of absorption features imprinted in the soft X-ray spectrum (see their Figs. 5 and 6), in disagreement with the smooth, featureless soft excess frequently observed in AGN (like in Ton S180).
On the other hand, Petrucci et al. (2020) performed new simulations in order to investigate the physical and radiative properties of optically thick warm coronae. The novel ingredient in these simulations was to include the contribution of internal heating power for different sets of and . Although the exact physical mechanisms responsible for such internal heating are unknown (but the same holds for the hot corona; e.g., Lusso & Risaliti 2017, and references therein), by assuming an intrinsic heating mechanism then Comptonization is recovered as the dominant cooling process in a large part of the parameter space, where the spectral properties of the warm corona, such as and , are reconciled with those observed for the soft X-ray excess. In this regime, the presence of a featureless soft excess, like in Ton S180, can be expected from reprocessing in a warm corona.
By comparing the simulations by Petrucci et al. (2020, see their Figs. 2 and 3) with the measured values from our warm-corona models for temperature, optical depth and spectral shape (see Tables 5, 6 and 7), our results are compatible with an accretion disc which is either weakly dissipative and partially blanketed by warm plasma (Petrucci et al. 2013, see their Fig. 10) or vertically/radially stratified with distinct Comptonizing regions (Done et al. 2012, see their Fig. 5; Kubota & Done 2019, see their Fig. 7). At this stage the exact geometry is basically unknown, since the subtle differences between the various models (e.g., optxagnf versus agnslim) are hardly distinguishable in the spectral analysis. A completely passive disc seems unlikely, as this scenario involves an apparent fine-tuning of the ‘seed’ photon temperature (see Table C.1 of Petrucci et al. 2018), possibly driven by the specific SED coverage provided by the XMM-Newton/OM filters. Moreover, the lack of a big blue bump would imply a much smaller AGN bolometric luminosity (Fig. 11). Hence, any configuration must allow part of the disc emission to escape without crossing the warm corona, as suggested by the presence of reflected emission features (such as the broad Fe K line). These might arise from the ‘uncovered’ mid/outer regions rather than from the innermost disc, as discussed in the next Section.
Remarkably, the reflection component in the agnslim model suggests that the disc is irradiated by the same power-law continuum as the one arising from the hot corona. The relative photon indices, when both are allowed to vary, are and . This is in agreement with the generally accepted idea of a hot corona located above the disc, although in agnslim only the radial extent of this component can be formally controlled, but not its height.
4.2.2 The radial extent of the warm corona
As mentioned in Section 3.3, even in the warm-corona models a reflection component is always required to fit the broad Fe K emission feature and the mild hard X-ray excess. The presence of such features suggests that any optically thick corona must have a low covering factor, so that some reflection from the accretion disc can be directly exposed to our line of sight. Following the parallel with the 2014 XMM-Newton and NuSTAR campaign on Ark 120, it seems plausible that the warm corona is radially confined and/or patchy. In Ark 120, the detected Fe K emission line complex and the broadband reflection component (Nardini et al., 2016; Porquet et al., 2018) apparently arise from a few tens of gravitational radii from the central black hole, i.e. outside the extent of the putative warm corona. By contrast, Matt et al. (2014) detected neither a broad Fe K profile nor a reflected continuum component in the 2013 XMM-Newton and NuSTAR spectra, which could be explained by a more extended corona covering the surface of the accretion disc out to a larger radius. Indeed, a possible change in coronal size was suggested by (Porquet et al., 2019), where both the 2013 and 2014 broadband XMM-Newton (OM and pn) and NuSTAR spectra were successfully fitted with the optxconv model (Done et al., 2013).151515 This model is constructed by convolving optxagnf with the relativistic blurring calculated by the relconv model (Dauser et al., 2010). It was found at the 5.5 confidence level that the size of the warm and hot corona (which are radially co-spatial in optxagnf) decreased between the 2013 and 2014 observations, from to .
A similar analysis in Ton S180 is precluded by the different quality (due to different duration and/or flux state) of the four XMM-Newton observations, and by the availablity of a single-epoch NuSTAR spectrum. However, we performed a further test by allowing the reflection inner radius () in relxillCp to vary in both the phenomenological warm corona and optxagnf models. Having fixed to the coronal radius ( or ) throughout the analysis, we have in practice assumed a disc/corona geometry where the optically thick plasma is blanketing the accretion disc, and no reflection component is observed from within . Now we try to separately determine the region in the disc where the observed Fe K line is emitted and the radial size of the warm corona itself. Even when is free to vary, although poorly constrained, its value remains much larger than both (irrespective of the black hole spin) and that of the warm/hot corona: (phenomenological model), (optxagnf), and (agnslim). This confirms that the observed reflection component does not originate from the very inner parts of the disc, which is not surprising given the relatively narrow width ( eV) and symmetric profile of the Fe K line.
The possibility that some reflection comes from the inner disc cannot be completely excluded, since the corona will not actually block it. However, Comptonization will add to the stronger relativistic blurring (e.g., Wilkins & Gallo, 2015b), likely making any reflection feature hard to disentangle from the the primary continuum. Probing this effect goes beyond the scope of the present work, but this would provide further insights into the properties of the warm/hot corona.
4.3 Is there a disc wind in Ton S180?
The likely super-Eddington accretion rate of Ton S180 could be in itself a sufficient ingredient for the launch of an X-ray disc wind (e.g., Nardini, Lusso & Bisogni, 2019), although the viewing angle is also important (Giustini & Proga, 2019). The NLSy 1 nature of Ton S180 is challenging for the detection of such a wind, though. In fact, the well-known steepness of the X-ray spectra of NLSy 1’s usually implies an insufficient S/N in the 6.7–10 keV band to discover any blueshifted Fe K absorption features. However, these appear to be present when very deep exposures are available (e.g., Parker et al., 2017b). Alternatively, ultra-fast winds have been detected in NLSy 1’s through the high-resolution grating spectra at soft X-ray energies (e.g., Longinotti et al., 2015; Parker et al., 2017b; Kosec et al., 2018).
Unfortunately, during the longest (2015) XMM-Newton observation of Ton S180, the source was about two times fainter in the soft X-rays than in the (2000) highest state, which was only covered by a short exposure similar to our 2016 observation (when the source was at its lowest). We therefore had to use the stacked spectrum to search for any faint and/or narrow absorption (and emission) features. Only a handful of possible absorption lines were identified through a blind scan, none of which are statistically significant on their own. However, when two of the strongest ones are combined, these are compatible with the main transitions (from O viii and C vi Ly) in a gas with moderate column density of cm-2, relatively high ionization of , and outflowing at . After accounting for an absorber with these properties, the fit of the RGS spectrum marginally improves at the 3.1 confidence level.
No Fe K absorption feature has been detected so far in Ton S180 through a standard spectral analysis. Recently, Igo et al. (2020) developed a new model-independent method for revealing ultra-fast X-ray outflows in nearby AGN, based on the analysis of the fractional excess variance spectra (e.g., Parker et al., 2017a, 2018, 2020). In that study, they suggested that Ton S180 hosts an ultra-fast wind with outflow velocity of , the most extreme in a sample of 58 bright AGN from the XMM-Newton Science Archive. This result requires substantial caution. The degree of blueshift places the absorption feature at keV, close to the high-energy limit of the XMM-Newton EPIC-pn bandpass. Indeed, the relatively low S/N at these energies makes it very difficult to locate any reliable absorption feature in the spectrum.
While individually not compelling, these indications of X-ray absorption from ionized outflowing gas in Ton S180 certainly deserve further investigation. Future high-quality observations are needed to conclusively establish the presence of signatures from a fast wind in either the soft X-ray or Fe K band. Although some key properties of the putative wind, like ionization and, most importantly, column density, are not well constrained at this stage, a solid detection of both the soft X-ray and Fe K phases is expected to be easily within reach of a large effective area and high energy resolution mission like Athena (Barret et al., 2018), and possibly also of the forthcoming XRISM (Tashiro et al., 2018). The optimal characterization of the soft component would likely require an Arcus-like grating specrometre (Smith et al., 2019) instead.
5 conclusions
In this paper we have presented a detailed analysis of the 2016 XMM-Newton and NuSTAR observation of the NLSy 1 Ton S180 by fitting the EPIC, RGS, OM and FPMA/B spectra. Based on our results, we draw the following conclusions.
-
•
We have fitted the X-ray emission in the 0.4–30 keV band with different models of the relxill family, and we have found that none of the relativistic reflection models alone could self-consistently reproduce the broadband spectrum of Ton S180. Each of the employed models did provide decent fits on statistical grounds, yet significant residuals in the Fe K and hard X-ray bands (especially above ) were systematically present. In fact, in attempting to account for the steep and smooth soft excess, parameters such as black hole spin, inner-disc emissivity index and/or source height were forced to extreme values, which, instead, are not required, nor compatible, with the shape and strength of the Fe K feature and Compton hump. The reflection fits improved after adding a contribution from a distant neutral reflector (xillver), despite the lack of a clear narrow Fe K core in the spectra. The above residuals, however, were still significant. We also find similar shortcomings with alternative relativistic reflection models from the reflkerr package.
-
•
We have analysed in detail the RGS spectrum (stacked over the four 2000–2016 XMM-Newton observations, variable in flux but not in shape) and we find that it is almost completely featureless, consistent with a simple power law of . This result provided extra support towards the evidence of a soft excess caused by Comptonization rather than blurred reflection as some relativistically broadened emission lines would be still present. None the less, the detection of faint emission from the Ne ix triplet suggests that X-ray ‘bare’ AGN have ionized gas outside the line of sight. Tentative evidence is also found for absorption from an accretion disc wind with , although the statistical significance is limited (3.1).
-
•
We have then fitted the 2016 optical/UV to hard X-ray SED of Ton S180 with a composite reflection plus phenomenological warm-Comptonization model. In this scenario, the overall 0.4–30 kev emission could be well explained and extrapolated down to a few eV through the contribution of: (i) thermal emission from the outer accretion disc; (ii) Componization of optical/UV ‘seed’ disc-photons from a warm ( eV) and optically thick () plasma, which is supposed to blanket the upper layers of the inner accretion disc; (iii) primary emission dominating above 1 keV, produced via Compton up-scattering in a standard optically thin () and hot ( keV) corona; (iv) disc reflection responsible for the broad Fe K emission at keV and the mild hard X-ray excess, apparently arising at some distance from the ISCO, where the warm/hot coronae are unlikely to fully cover the accretion disc surface.
-
•
We have fitted the 2016 SED of Ton S180 with the physically motivated disc Comptonization model optxagnf. The physical properties of the warm corona are broadly consistent with the phenomenological model and the size of the hot corona was found to be of the order of 10 . Despite the uncertainty on the black hole mass in Ton S180, we can conservatively constrain the accretion rate to be at least 50 per cent of Eddington. Considering the high Eddington ratio, for which the assumptions of a standard thin disc might be inadequate, we have also fitted the 2016 SED with the agnslim model, based on slim disc emissivity developed for super-Eddington accreting sources. The geometrical configuration of agnslim allows for a radial separation of the hot and warm coronal regions, both of which are confirmed to be rather compact: . Not surprisingly, this model returned a higher Eddington ratio (4–5) for the most likely black hole mass, of the order of , and a bolometric luminosity, computed between 1 eV and 100 keV, of –. This condition is highly favourable to the effective presence of a disc wind.
In a future work, we will investigate whether the broadband spectral/flux changes over the epochs of the four XMM-Newton observations can be ascribed to a change in the physical and geometrical properties of the corona, and we will explore if and how these affect the appearance of the reflection component.
6 acknowledgements
We thank the referee for their careful reading and many useful suggestions that helped us improve the clarity of the paper. This work is based on observations obtained with XMM-Newton, an ESA science mission with instruments and contributions directly funded by ESA Member States and NASA, and with the NuSTAR mission, a project led by the California Institute of Technology, managed by the Jet Propulsion Laboratory, and funded by NASA. This research has made use of the NuSTAR Data Analysis Software (nustardas jointly developed by the ASI Science Data Center and the California Institute of Technology.
GAM, MLP and APL are supported by ESA research fellowships. GAM thank P. O. Petrucci and M. T. Costa for the useful discussion. EN acknowledges financial contribution from the agreement ASI-INAF n.2017-14-H.0 and partial support from the EU Horizon 2020 Marie Skłodowska-Curie grant agreement no. 664931. JR acknowledges financial support through NASA grant 80NSSC18K1603. VB acknowledges financial support through NASA grant 80NSSC20K0793. RM acknowledges the financial support of INAF (Istituto Nazionale di Astrofisica), Osservatorio Astronomico di Roma, ASI (Agenzia Spaziale Italiana) under contract to INAF: ASI 2014-049-R.0 dedicated to SSDC. WNA acknowledges support from the European Research Council through Advanced Grant 340442, on Feedback. MG is supported by the “Programa de Atracción de Talento” of the Comunidad de Madrid, grant number 2018-T1/TIC-11733. AMJ acknowledge the National Trainee program and the Irish Research Council.
We acknowledge support from the Faculty of the European Space Astronomy Centre (ESAC) - Funding reference 493. Part of this work was supported by CNES. This research has made use of computing facilities operated by CeSAM data centre at LAM, Marseille, France.
Data availability
References
- Abramowicz et al. (1988) Abramowicz M. A., Czerny B., Lasota J. P., Szuszkiewicz E., 1988, ApJ, 332, 646
- Arnaud (1996) Arnaud K. A., 1996, in Astronomical Society of the Pacific Conference Series, Vol. 101, Astronomical Data Analysis Software and Systems V, Jacoby G. H., Barnes J., eds., p. 17
- Barret et al. (2018) Barret D. et al., 2018, in Society of Photo-Optical Instrumentation Engineers (SPIE) Conference Series, Vol. 10699, Proc. SPIE, p. 106991G
- Bautista & Kallman (2001) Bautista M. A., Kallman T. R., 2001, ApJS, 134, 139
- Beloborodov (1999) Beloborodov A. M., 1999, in Astronomical Society of the Pacific Conference Series, Vol. 161, High Energy Processes in Accreting Black Holes, Poutanen J., Svensson R., eds., p. 295
- Bentz et al. (2013) Bentz M. C. et al., 2013, ApJ, 767, 149
- Boissay, Ricci & Paltani (2016) Boissay R., Ricci C., Paltani S., 2016, A&A, 588, A70
- Cardelli, Clayton & Mathis (1989) Cardelli J. A., Clayton G. C., Mathis J. S., 1989, ApJ, 345, 245
- Comastri et al. (1998) Comastri A. et al., 1998, A&A, 333, 31
- Crummy et al. (2006) Crummy J., Fabian A. C., Gallo L., Ross R. R., 2006, MNRAS, 365, 1067
- Dauser et al. (2014) Dauser T., García J., Parker M. L., Fabian A. C., Wilms J., 2014, MNRAS, 444, L100
- Dauser et al. (2010) Dauser T., Wilms J., Reynolds C. S., Brenneman L. W., 2010, MNRAS, 409, 1534
- Davis & Laor (2011) Davis S. W., Laor A., 2011, ApJ, 728, 98
- den Herder et al. (2001) den Herder J. W. et al., 2001, A&A, 365, L7
- Done et al. (2012) Done C., Davis S. W., Jin C., Blaes O., Ward M., 2012, MNRAS, 420, 1848
- Done et al. (2013) Done C., Jin C., Middleton M., Ward M., 2013, MNRAS, 434, 1955
- Fabian et al. (2015) Fabian A. C., Lohfink A., Kara E., Parker M. L., Vasudevan R., Reynolds C. S., 2015, MNRAS, 451, 4375
- Fabian et al. (2004) Fabian A. C., Miniutti G., Gallo L., Boller T., Tanaka Y., Vaughan S., Ross R. R., 2004, MNRAS, 353, 1071
- Fabian & Ross (2010) Fabian A. C., Ross R. R., 2010, Space Sci. Rev., 157, 167
- Fabian et al. (2002) Fabian A. C. et al., 2002, MNRAS, 335, L1
- Fabian et al. (2009) Fabian A. C. et al., 2009, Nature, 459, 540
- Foreman-Mackey et al. (2013) Foreman-Mackey D., Hogg D. W., Lang D., Goodman J., 2013, PASP, 125, 306
- Gabriel et al. (2004) Gabriel C. et al., 2004, Astronomical Society of the Pacific Conference Series, Vol. 314, The XMM-Newton SAS - Distributed Development and Maintenance of a Large Science Analysis System: A Critical Analysis, Ochsenbein F., Allen M. G., Egret D., eds., p. 759
- García et al. (2014) García J. et al., 2014, ApJ, 782, 76
- García et al. (2013) García J., Dauser T., Reynolds C. S., Kallman T. R., McClintock J. E., Wilms J., Eikmann W., 2013, ApJ, 768, 146
- García & Kallman (2010) García J., Kallman T. R., 2010, ApJ, 718, 695
- García et al. (2016) García J. A., Fabian A. C., Kallman T. R., Dauser T., Parker M. L., McClintock J. E., Steiner J. F., Wilms J., 2016, MNRAS, 462, 751
- García et al. (2019) García J. A. et al., 2019, ApJ, 871, 88
- Gierliński & Done (2004) Gierliński M., Done C., 2004, MNRAS, 349, L7
- Giustini & Proga (2019) Giustini M., Proga D., 2019, arXiv e-prints
- Grandi (1982) Grandi S. A., 1982, ApJ, 255, 25
- Haardt & Maraschi (1991) Haardt F., Maraschi L., 1991, ApJ, 380, L51
- Haardt & Maraschi (1993) Haardt F., Maraschi L., 1993, Astrophysical Journal, 413, 507
- Harrison et al. (2013) Harrison F. A. et al., 2013, ApJ, 770, 103
- HI4PI Collaboration et al. (2016) HI4PI Collaboration et al., 2016, A&A, 594, A116
- Igo et al. (2020) Igo Z. et al., 2020, MNRAS, 493, 1088
- Jansen et al. (2001) Jansen F. et al., 2001, A&A, 365, L1
- Jiang et al. (2019) Jiang J. et al., 2019, MNRAS, 489, 3436
- Jin, Done & Ward (2017) Jin C., Done C., Ward M., 2017, MNRAS, 468, 3663
- Kaastra et al. (2011a) Kaastra J. S. et al., 2011a, A&A, 534, A37
- Kaastra et al. (2011b) Kaastra J. S. et al., 2011b, A&A, 534, A36
- Kallman et al. (2004) Kallman T. R., Palmeri P., Bautista M. A., Mendoza C., Krolik J. H., 2004, ApJS, 155, 675
- Kammoun et al. (2019) Kammoun E. S., Domček V., Svoboda J., Dovčiak M., Matt G., 2019, MNRAS, 485, 239
- Kosec et al. (2018) Kosec P., Buisson D. J. K., Parker M. L., Pinto C., Fabian A. C., Walton D. J., 2018, MNRAS, 481, 947
- Kubota & Done (2018) Kubota A., Done C., 2018, MNRAS, 480, 1247
- Kubota & Done (2019) Kubota A., Done C., 2019, MNRAS, 489, 524
- Lohfink et al. (2012) Lohfink A. M., Reynolds C. S., Miller J. M., Brenneman L. W., Mushotzky R. F., Nowak M. A., Fabian A. C., 2012, ApJ, 758, 67
- Longinotti et al. (2015) Longinotti A. L., Krongold Y., Guainazzi M., Giroletti M., Panessa F., Costantini E., Santos-Lleo M., Rodriguez-Pascual P., 2015, ApJ, 813, L39
- Lusso & Risaliti (2017) Lusso E., Risaliti G., 2017, A&A, 602, A79
- Mason et al. (2001) Mason K. O. et al., 2001, A&A, 365, L36
- Matt et al. (2014) Matt G. et al., 2014, MNRAS, 439, 3016
- Matzeu et al. (2017) Matzeu G. A., Reeves J. N., Nardini E., Braito V., Turner T. J., Costa M. T., 2017, MNRAS, 465, 2804
- Mehdipour et al. (2015) Mehdipour M. et al., 2015, A&A, 575, A22
- Middei et al. (2018) Middei R. et al., 2018, A&A, 615, A163
- Middei et al. (2019) Middei R. et al., 2019, MNRAS, 483, 4695
- Miniutti et al. (2009) Miniutti G., Ponti G., Greene J. E., Ho L. C., Fabian A. C., Iwasawa K., 2009, MNRAS, 394, 443
- Nardini et al. (2011) Nardini E., Fabian A. C., Reis R. C., Walton D. J., 2011, MNRAS, 410, 1251
- Nardini, Fabian & Walton (2012) Nardini E., Fabian A. C., Walton D. J., 2012, MNRAS, 423, 3299
- Nardini, Lusso & Bisogni (2019) Nardini E., Lusso E., Bisogni S., 2019, MNRAS, 482, L134
- Nardini et al. (2016) Nardini E., Porquet D., Reeves J. N., Braito V., Lobban A., Matt G., 2016, ApJ, 832, 45
- Niedźwiecki, Szanecki & Zdziarski (2019) Niedźwiecki A., Szanecki M., Zdziarski A. A., 2019, MNRAS, 485, 2942
- Parker et al. (2017a) Parker M. L. et al., 2017a, MNRAS, 469, 1553
- Parker et al. (2020) Parker M. L., Alston W. N., Igo Z., Fabian A. C., 2020, MNRAS, 492, 1363
- Parker, Miller & Fabian (2018) Parker M. L., Miller J. M., Fabian A. C., 2018, MNRAS, 474, 1538
- Parker et al. (2017b) Parker M. L. et al., 2017b, Nature, 543, 83
- Parker et al. (2018) Parker M. L., Reeves J. N., Matzeu G. A., Buisson D. J. K., Fabian A. C., 2018, MNRAS, 474, 108
- Petrucci et al. (2020) Petrucci P. O. et al., 2020, arXiv e-prints, arXiv:2001.02026
- Petrucci et al. (2001) Petrucci P. O., Merloni A., Fabian A., Haardt F., Gallo E., 2001, MNRAS, 328, 501
- Petrucci et al. (2013) Petrucci P. O. et al., 2013, A&A, 549, A73
- Petrucci et al. (2018) Petrucci P.-O., Ursini F., De Rosa A., Bianchi S., Cappi M., Matt G., Dadina M., Malzac J., 2018, A&A, 611, A59
- Piconcelli et al. (2005) Piconcelli E., Jimenez-Bailón E., Guainazzi M., Schartel N., Rodríguez-Pascual P. M., Santos-Lleó M., 2005, A&A, 432, 15
- Porquet et al. (2019) Porquet D. et al., 2019, A&A, 623, A11
- Porquet & Dubau (2000) Porquet D., Dubau J., 2000, A&AS, 143, 495
- Porquet et al. (2004) Porquet D., Kaastra J. S., Page K. L., O’Brien P. T., Ward M. J., Dubau J., 2004, A&A, 413, 913
- Porquet et al. (2018) Porquet D. et al., 2018, A&A, 609, A42
- Pounds et al. (1986) Pounds K. A., Warwick R. S., Culhane J. L., de Korte P. A. J., 1986, MNRAS, 218, 685
- Reeves et al. (2016) Reeves J. N., Porquet D., Braito V., Nardini E., Lobban A., Turner T. J., 2016, ApJ, 828, 98
- Reynolds (2014) Reynolds C. S., 2014, Space Sci. Rev., 183, 277
- Ross & Fabian (2005) Ross R. R., Fabian A. C., 2005, MNRAS, 358, 211
- Różańska et al. (2015) Różańska A., Malzac J., Belmont R., Czerny B., Petrucci P. O., 2015, A&A, 580, A77
- Schlafly & Finkbeiner (2011) Schlafly E. F., Finkbeiner D. P., 2011, ApJ, 737, 103
- Shakura & Sunyaev (1973) Shakura N. I., Sunyaev R. A., 1973, A&A, 24, 337
- Singh, Garmire & Nousek (1985) Singh K. P., Garmire G. P., Nousek J., 1985, ApJ, 297, 633
- Smith et al. (2019) Smith R. K. et al., 2019, in Society of Photo-Optical Instrumentation Engineers (SPIE) Conference Series, Vol. 11118, Proc. SPIE, p. 111180W
- Strüder et al. (2001) Strüder L. et al., 2001, A&A, 365, L18
- Takahashi, Hayashida & Anabuki (2010) Takahashi H., Hayashida K., Anabuki N., 2010, PASJ, 62, 1483
- Takahashi et al. (2007) Takahashi T. et al., 2007, PASJ, 59, 35
- Tarter, Tucker & Salpeter (1969) Tarter C. B., Tucker W. H., Salpeter E. E., 1969, ApJ, 156, 943
- Tashiro et al. (2018) Tashiro M. et al., 2018, in Society of Photo-Optical Instrumentation Engineers (SPIE) Conference Series, Vol. 10699, Proc. SPIE, p. 1069922
- Thorne (1974) Thorne K. S., 1974, ApJ, 191, 507
- Turner et al. (2001a) Turner M. J. L. et al., 2001a, A&A, 365, L27
- Turner, George & Nandra (1998) Turner T. J., George I. M., Nandra K., 1998, ApJ, 508, 648
- Turner et al. (2001b) Turner T. J. et al., 2001b, ApJ, 548, L13
- Turner et al. (2002) Turner T. J. et al., 2002, ApJ, 568, 120
- Ursini et al. (2019) Ursini F. et al., 2019, arXiv e-prints, arXiv:1912.08720
- Vaughan et al. (2002) Vaughan S., Boller T., Fabian A. C., Ballantyne D. R., Brandt W. N., Trümper J., 2002, MNRAS, 337, 247
- Walter & Fink (1993) Walter R., Fink H. H., 1993, A&A, 274, 105
- Walton et al. (2013) Walton D. J., Nardini E., Fabian A. C., Gallo L. C., Reis R. C., 2013, MNRAS, 428, 2901
- Wilkins & Fabian (2012) Wilkins D. R., Fabian A. C., 2012, MNRAS, 424, 1284
- Wilkins & Gallo (2015a) Wilkins D. R., Gallo L. C., 2015a, MNRAS, 449, 129
- Wilkins & Gallo (2015b) Wilkins D. R., Gallo L. C., 2015b, MNRAS, 448, 703
- Wilms, Allen & McCray (2000) Wilms J., Allen A., McCray R., 2000, ApJ, 542, 914
- Wisotzki et al. (1995) Wisotzki L., Dreizler S., Engels D., Fink H.-H., Heber U., 1995, A&A, 297, L55
- Zdziarski, Johnson & Magdziarz (1996) Zdziarski A. A., Johnson W. N., Magdziarz P., 1996, MNRAS, 283, 193
- Życki, Done & Smith (1999) Życki P. T., Done C., Smith D. A., 1999, MNRAS, 309, 561