Terahertz spectroscopy evidence of possible 40 K superconductivity in rhenium-doped strontium ruthenates
Abstract
Strontium ruthenates have many similarities with copper oxide superconductors and are of particular interest for the investigation of the mechanisms and conditions which lead to high-temperature superconductivity. We report here on multiple experimental indications of superconductivity with onset at 40 K in strontium ruthenate doped by rhenium and selenium with chlorine used as the flux. The main experimental evidence arises from terahertz spectroscopy of this material followed by AC and DC magnetization, as well as measurements of its heat capacity and magnetoresistance. Structural and morphological studies revealed the heterophase nature of this polycrystalline material as well as the changes of lattice parameters relative to the original phases. Experimental data show a higher critical temperature on the surface compared to that of the bulk of the sample.
I Introduction
The fascinating properties of strontium ruthenates have garnered enormous attention [1] since the discovery of high-temperature superconductivity in cuprates. Superconductivity in ruthenates was found only for case [2] with as high as [3]. Other representatives of this Ruddlesden-Popper family possess peculiar magnetic properties. The most pronounced magnetic order takes place at : is a ferromagnet with Curie temperature K; at , is an anomalous paramagnet; at , is a metamagnet [3]. The Cooper pairing in was well known as a textbook example of the spin-triplet state (odd parity , see reviews [3, 4, 5, 6] and references therein). Recently, spectroscopy reinvestigation [7] has given compelling evidence that the superconductivity in is likely to be even parity, which unequivocally demonstrates that research on the physical properties of ruthenates is far from being complete.
Another confirmation of this statement comes from the recent fascinating discovery of high-temperature superconductivity in calcium ruthenate, [8]. The stoichiometric composition of this material in a single-crystalline form is a Mott insulator, while single crystals with excess oxygen are metallic above [9]. The excess amount of oxygen results in important crystallographic change: the lattice symmetry changes from Pbca to with axis extension from Å to Å. Interestingly, electrically induced insulator-metal transition have been detected via infrared nano-imaging and optical-microscopy measurements on bulk single crystal [10]. Much more drastic changes occur when the thickness of crystal is reduced to the nanometer range: novel quantum states including high-temperature superconductivity via resistive and magnetic measurements at have been observed [8]. This remarkable finding in micronanocrystals demonstrated how rich the superconducting phenomena in ruthenates can be. It also invigorates the value of polycrystalline materials (ceramics), in which the samples in [8] were originally prepared before subsequent sonification to obtain nanomicrocrystals.
In this rapid communication, we present spectroscopic data in the range obtained for polycrystalline samples of initial stoichiometric composition of Sey. The choice of this composition was made in result of series of experiments in which the oxygen was partially replaced by or in presence of as a flux at the synthesis of and subsequent cationic substitutions for (Fig. 1).
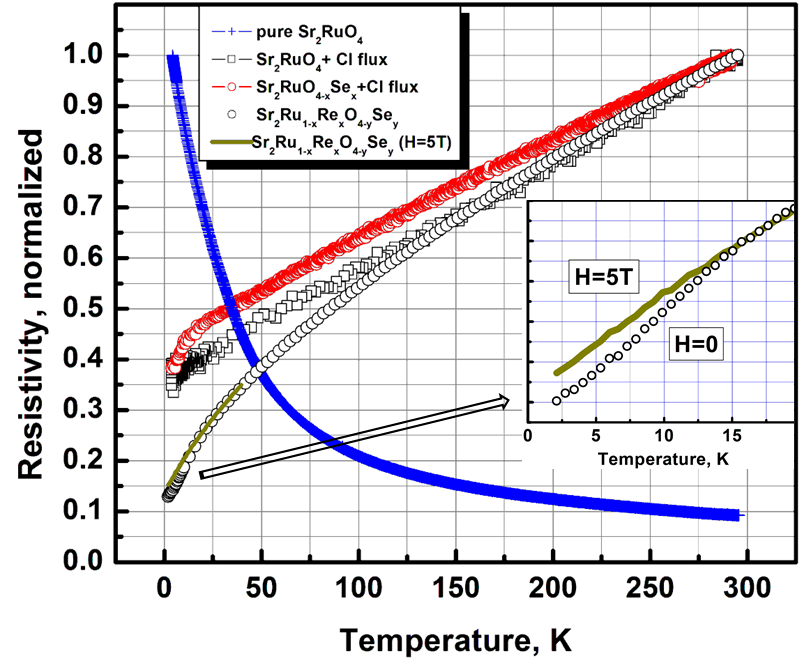
As follows from Fig. 1, typical dependence of drastically changes into typical strange metal behavior [11] at application of flux and vacuum during synthesis (details can be found in [12]). Moreover, inclination towards zero resistivity at K appears at further substitution of chalcogens for oxygen. Since this inclination might have been related with a superconducting phase, we focused our efforts on deepening it using, in particular, cationic substitutions for . The best results were observed with ions [12]. At the time of publication [12], the critical temperatures in the range of appeared very unusual for ruthenates; however they were later supported by the findings of Ref. [8]. Our current spectroscopic data is in support of superconducting phase in polycrystalline Sey.
II Experimental details
Details on the preparation of Sey samples can be found in [12]. Here, we will briefly summarize them. The precursors, , , , , and · were powdered and mixed in stoichiometric proportions. A combination of hand and mechanical grinding and mixing was applied. The powder was calcinated at for hours which incurred of weight loss. The calcinated powder was again powderized and heat treated in air, linearly increasing temperature up to and down during hours with of weight loss. This powder was pelletized and heat treated again at in air for hours with linear temperature increase and decrease at a similar rate ( hours each, with a weight loss ). For optimizing heat treatment temperatures, powder thermogravimetry was used. Next, heat treatment of the pellet was performed in high vacuum (, , ). The weight of the pellet did not change noticeably, but the resistivity became smaller. No changes in the sample’s characteristics were obtained at further vacuum heat treatments.
The crystalline structure of the sample is shown in Fig. 2.
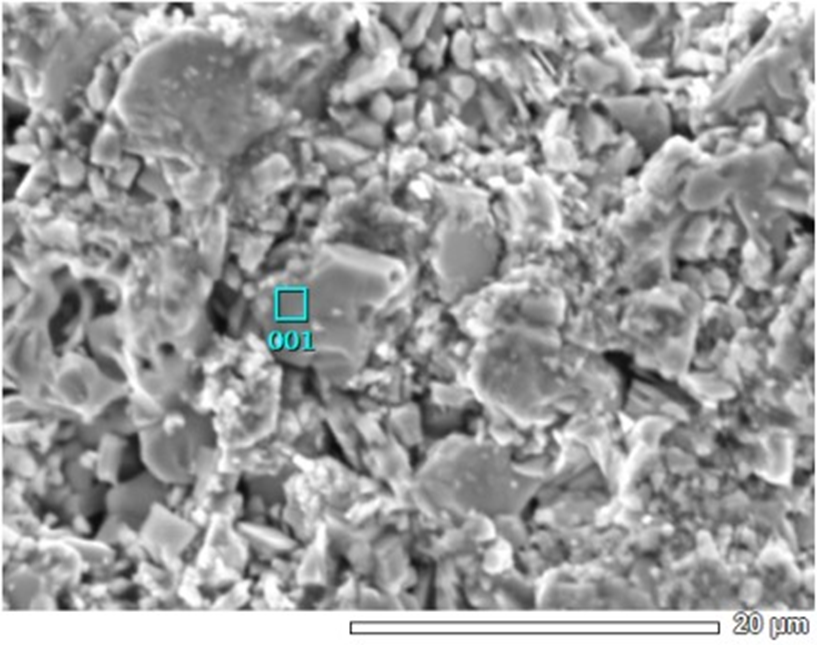
Using EDX well-matching data taken by multiple analysis of various crystalline areas of this sample, the composition of the sample was determined as . In view of of weight loss at the thermal treatment quoted above, the change of the initial stoicheometry is not surprising (for the convenience, we will keep calling our sample Sey). For Se content, EDX microanalysis is not sufficiently sensitive. WDX analysis revelas of the amount less than .
For XRD structural studies (Rigaku Miniflex 600; measurement using Cu-Kα line in the angle interval with the step and scanning rate /s; phase content and refinement of atomic structural models by the Panalytical HighScore Plus 3.0e software), of sample was ground in agath mortar. Analysis revealed the presence of three phases: , , and . The lattice parameters for the phase are: Å, Å, space group . For comparison, the pure phase has parameters Å, Å with the same space group [13]. This means that the lattice parameters of this cell are squeezed by along the axis, and extended by within the plane. This can be associated with an influence of the uniaxial pressure which significantly affects the of [14]. The lattice parameters for the phase are: Å, Å, space group . Reference data for [15] are: Å, Å. In this case, all the lattice parameters are squeezed ( for , for ).
Physical characterization of properties of this sample’s magnetoresistance, heat capacity, DC and AC magnetic susceptibility were reported in [12] (sample #643), and we will use them later when discussing the major topic of this communication.
For far-infrared () measurements, a thin (about µm) disk-type slice was dry cut from cylindrical sample #643 (diameter of 4 mm) using Princeton Scientific WS25 High Precision diamond-impregnated wire saw. One face of this polycrystalline slice was carefully polished with the Precision polishing system Allied MultiPrep using diamond disc with 1 µm grade to obtain a shiny, highly planar (within accuracy) surface. The infrared reflectivity spectra were measured near normal incidence () in the spectral range of () at various temperatures between and using a conventional Fourier transform spectrometer ( , Bruker) equipped with a liquid cooled bolometer and a multi-layer mylar beam splitter. For measurements, the polished slice was mounted with the STYCAST 2850ft epoxy glue to the tip of the cone to avoid parasitic back-reflection. A similar cone supports the gold reference mirror. Both cones were attached to the two-position sample holder on the cold finger of the vertical Konti Spectro A continuous-flow cryostat with TPX windows. The design of the cryostat provides a sliding heat exchanger with the precision positioning system controlled by stepping motors. The possible uncertainties related to misalignments during the taking of reference measurements, especially at low frequencies, can be greatly reduced in relative measurements by cycling the temperature without moving the sample [16]. The advantage of this technique is that all temperature-driven distortions of the optical set-up are already frozen around , thus making it unnecessary to take a reference measurement at every temperature in the range 5-45 K. At energies below the small size of the sample, combined with strong oscillations that stem from standing waves between the optical elements of the spectrometer and cryostat windows, prevent accurate measurements and set a lower limit in our experiment.
III Results
Final outcome of our spectroscopic study is shown in Fig. 3 (top panel).
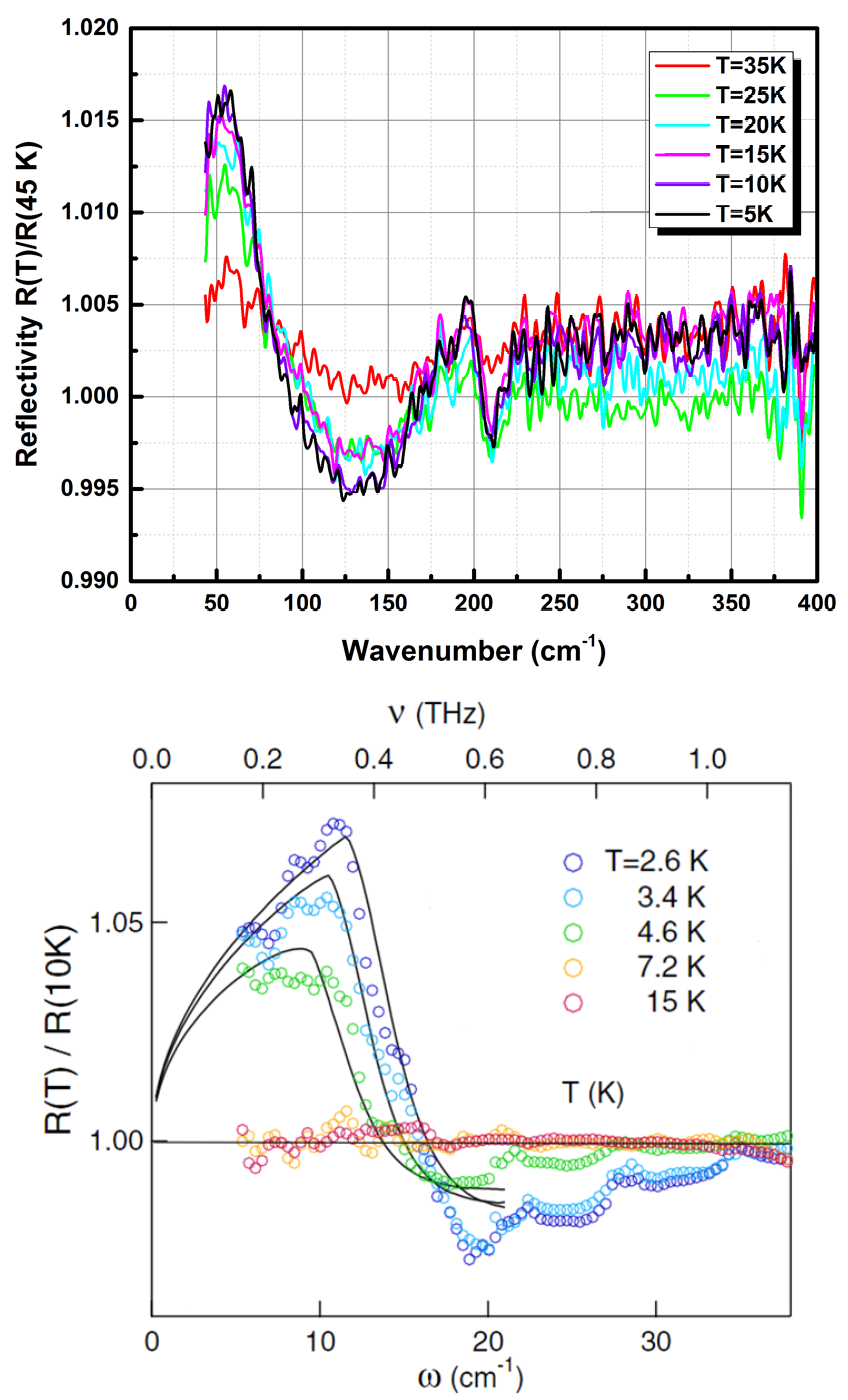
The spectral curves for Sey were taken at , , , , , and temperatures, then normalized by the curve. For wavenumbers above the set of curves for different temperatures becomes horizontal up to small vertical translations due to noise. At the lower range of wave numbers (), one can observe a more complex structure. The most noticeable is the first dip which occurs within the range and after the peak at . The curve corresponding to K has the lowest deviation (i.e., it does not have as deep of a dip compared to other curves). The other curves are more packed together and reach roughly the same peak elevation for the range . Moreover, one can notice that the lower the temperature, the higher the peak. This behavior closely resembles that of a typical superconductor (e.g. boron-doped diamond [17, 18]) as shown in the bottom panel of Fig 3. It is important to note that for the graph in the bottom panel the curves correspond to temperatures both above and below the critical temperature ( K). In our case, was not known; however, one can suggest, based on the relative flatness of the K curve, that should be slightly below 45 K.
A second dip, though less strong in amplitude, occurs within the range . This dip is not accompanied by as high of a peak as the one that was discussed above. One can theorize that this is due to another, larger gap that occurred within the range . Based on the fact that the opening of a superconducting gap below results in the behavior shown in the bottom panel, one can suggest that in the top panel at K, two gaps of different magnitude opened up.
The dip in the case of the boron-doped diamond is located at . The major dip in the case of Sey corresponds to , i.e., the gap is by a factor of seven larger than that of the doped diamond. This means that should be about by a factor of seven higher as well: K. Physically, the dip in reflectance corresponds to the maximum of absorption, which takes place at the photon energy in the “dirty” limit. Let us estimate the gap value from our data. The wave number corresponds to photon energies . If K, i.e., about , then , which is not far from the BCS value ; typically, higher materials have ratio higher than .
The second gap mentioned above may correspond to another phase or even have a non-superconducting origin. Because of fluctuations, its functional form is not defined as well as that of the larger dip. Thus, it is hard to definitively deduce the critical temperature, as well as other relevant parameters, corresponding to this gap. We will postpone quantitative analysis of this gap until further exploration.
IV Discussion
Let us consider how this spectroscopic result relates with other facts reported previously on possible superconductivity in this material [12]. We will first compare it with the heat capacity measurement which we will replot in a more elucidating way (Fig. 4).
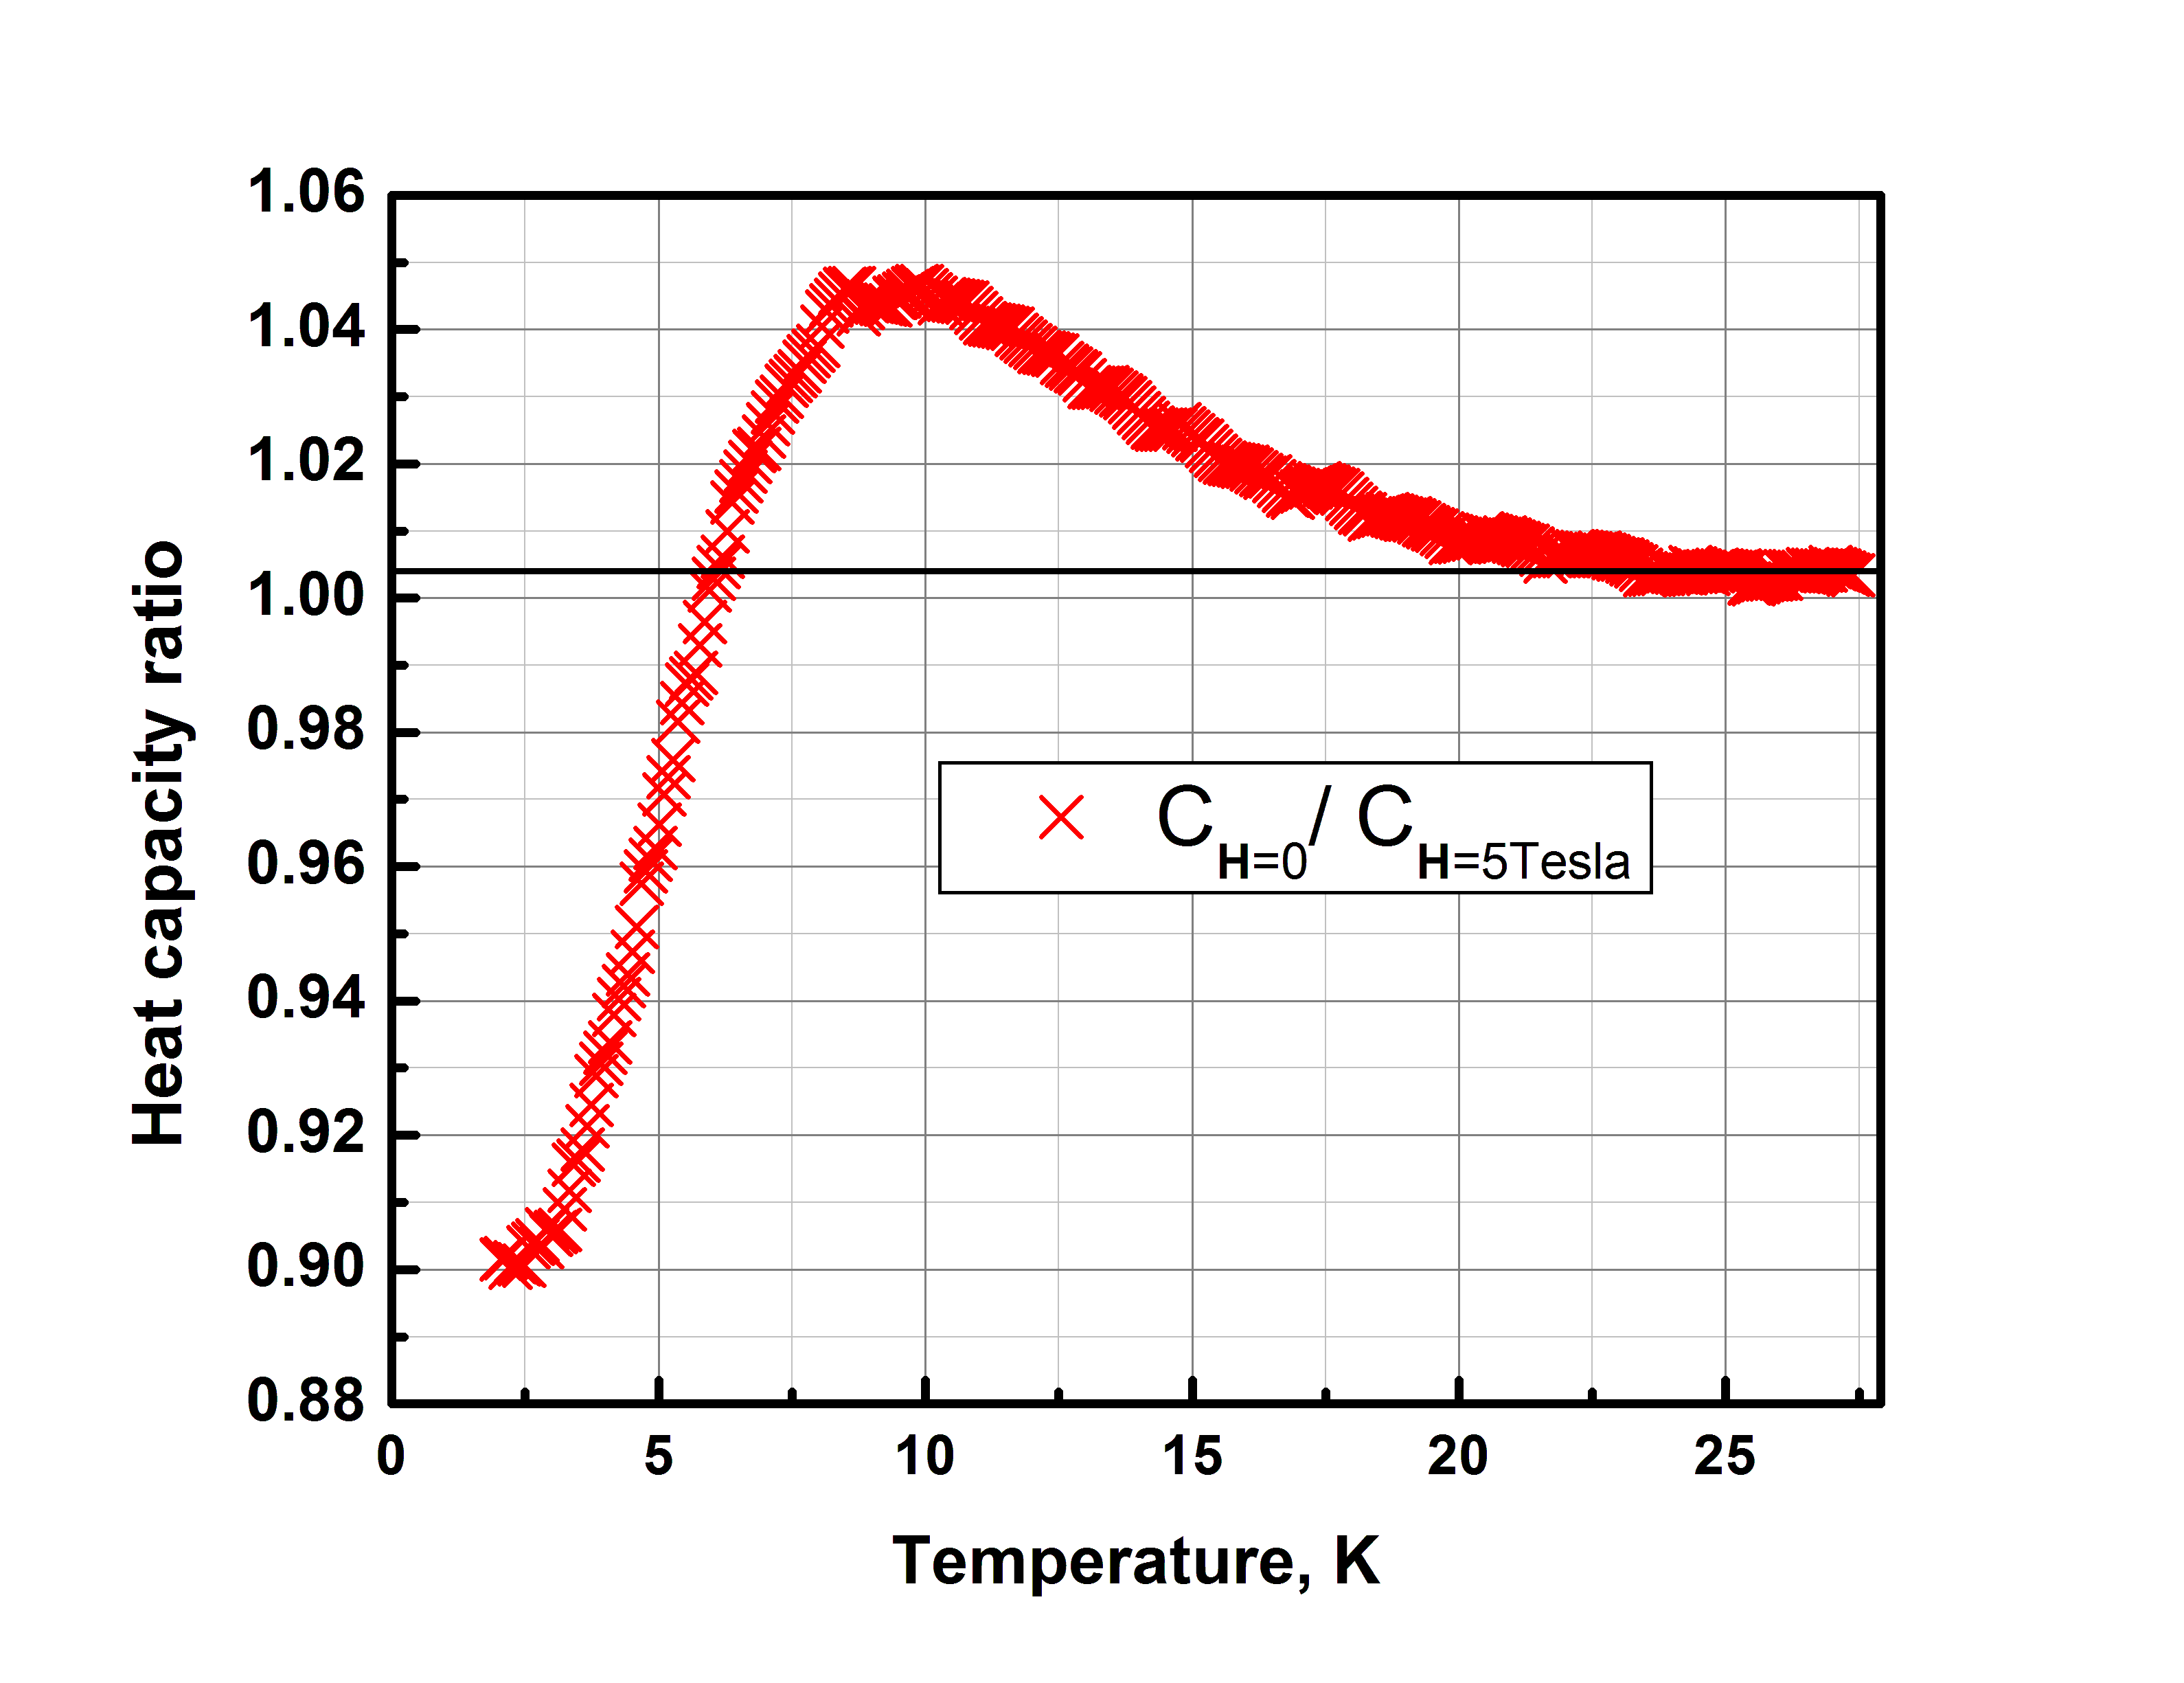
The curve in this figure is compatible with the BCS behavior of the heat capacity of a superconductor with a broad transition, which most likely characterizes superconductivity in the heterophase Sey. To characterize its behavior, as shown in Fig. 4, we applied a 5 T magnetic field to the sample, which reduced the superconducting phase volume mimicking its normal state value for the heat capacity. One can conclude that at about the heat capacity has an upturn compared to its normal value, and far below transition, it has values lower than in its normal state (as should be expected from the qualitative BCS pattern of superconductivity). An important question here is why the critical temperature at this measurement is smaller by a factor of two than in the spectroscopic case. A possible answer can be found in the recent results on superconductivity in calcium ruthenates [8]. Unlike superconductivity in microcrystals, superconductivity in bulk polycrystalline (as well as in macroscopically large crystalline samples) is fully absent [9]. If the mechanism of superconductivity in Sey is similar to that of (it is hard to expect that the mechanisms are much different!) then in the bulk of Sey pellet may easily be lower than at the surface layer, even by a factor greater than : the heat capacity reflects the bulk property while the reflectance is related with the surface layer. The micro-crystallites in the surface layer should be relatively free from the effects of the surrounding material.
The magnetization measurements support this conclusion, Fig. 5.
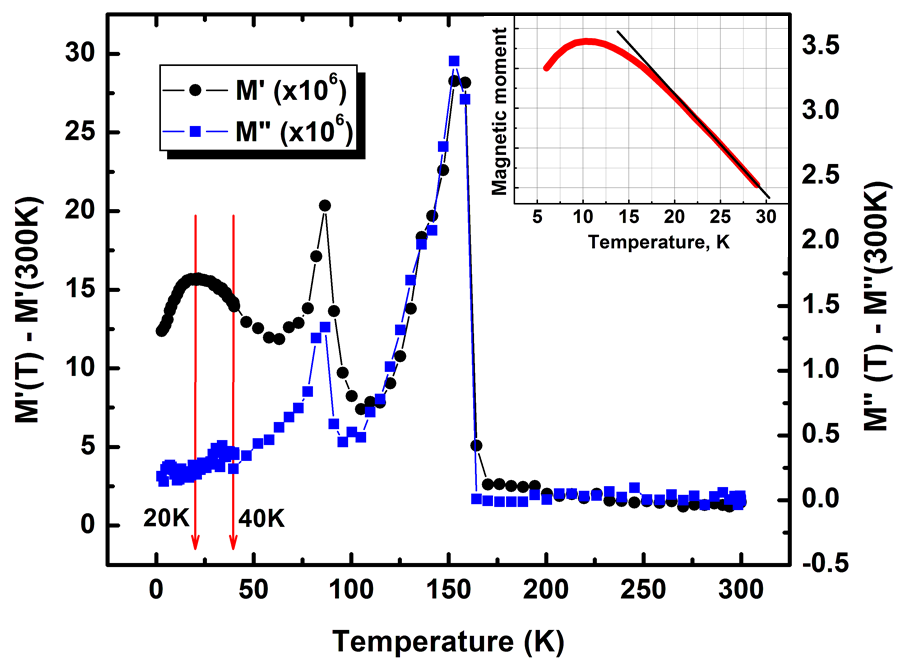
Typically, for AC magnetic susceptibility measurements, the superconducting transition reveals itself as a small jump at of the imaginary part of the magnetic susceptibility [19]. Such a jump is indeed observable on the curve of our sample at about , which comes close to the FIR data (Fig. 3). After further cooling, the polycrystalline samples with intergranular connections may have a broad hump [20, 21, 22, 23] similar to the one seen in Fig. 5. Interestingly, the major downturn of the real part of , as well as the downturn of the magnetic moment measured by the magnetometer, starts at about . It appears that the relative contribution of the surface effects is small in the case of these quantities, similar to the heat capacity (Fig. 4). These downturns may be indicative of the Meissner effect. These curves have no hysteresis: and curves coincide, which means that the applied magnetic field is above .
Resistive transitions in our material are incomplete, which is most likely the result of intergranular connections in which proximitized superconductivity is suppressed by the internal magnetic field that builds up below [12] due to the presence of phase in our heterophase sample. At the same time, the resistivity downturn becomes suppressed at the lower temperatures, as Fig. 1 indicates (see also the enlarged pattern in its inset).
To complete our discussion, we should mention that features similar to the ones which we mentioned here have been reported in the past for the composition [15]. They were attributed to magnetic fluctuations, similar to other cases [24, 25, 26, 27, 28]. Leaving aside the applicability of the magnetic fluctuations to all other facts pointing towards superconductivity in our samples, it is hardly possible that magnetic fluctuations would be able to quantitatively explain the spectroscopic data presented in Section 3 (with the ratio of the gap to the temperature of its opening being close to the BCS-value).
V Summary
Terahertz spectroscopy, taken together with other observational data on delivered indications of high temperature superconductivity with (Fig. 3). This spectroscopic value for comes close to the estimate of from the measurements of an imaginary part of the AC susceptibility (Fig. 5). Both properties are likely to be determined by the surface layer of our polycrystalline sample. Bulk characteristics, such as the heat capacity (Fig. 4) or the real part of the magnetic susceptibility (Fig. 5) also point towards superconductivity and reveal themselves at lower temperatures. That means that the bulk properties are different from the properties of the surface layer, which sets up a bridge between our findings and the recently discovered superconductivity at in solitary micronanocrystals of [8]. It is very likely that the mechanism of superconductivity is the same in both cases.
Acknowledgements.
A.D. acknowledges support by the Ministry of Science and Higher Education of the Russian Federation (project RFMEFI62119X0035 and the State assignment of the FSRC “Crystallography and Photonics” RAS) and the Shared Research Center FSRC “Crystallography and Photonics” RAS in part of X-rays diffraction study. The work of Yu.A. and A.M. is carried out within the state assignment of the Ministry of Science and Higher Education of the Russian Federation (theme ”Physics of high-temperature superconductors and novel quantum materials”, No. 0023-2019-0005). FIR measurements were done using research equipment of the Shared Facilities Center at LPI. The work of Chapman U. research team is supported by the ONR grants N00014-16-1-2269, N00014-17-1-2972, N00014-18-1-2636 and N00014-19-1-2265.References
- Armitage [2019] N. P. Armitage, Superconductivity mystery turns 25, Nature 576, 386–387 (2019).
- Maeno et al. [1994] Y. Maeno, H. Hashimoto, K. Yoshida, S. Nishizaki, T. Fujita, J. G. Bednorz, and F. Lichtenberg, Superconductivity in a layered perovskite without copper, Nature 372, 532 (1994).
- Mackenzie and Maeno [2003] A. P. Mackenzie and Y. Maeno, The superconductivity of and the physics of spin-triplet pairing, Rev. Mod. Phys. 75, 657 (2003).
- Maeno et al. [2012] Y. Maeno, S. Kittaka, T. Nomura, S. Yonezawa, and K. Ishida, Evaluation of Spin-Triplet Superconductivity in Sr2RuO4, Journal of the Physical Society of Japan 81, 011009 (2012).
- Kallin [2012] C. Kallin, Chiral p-wave order in Sr2RuO4, Reports on Progress in Physics 75, 042501 (2012).
- Liu and Mao [2015] Y. Liu and Z.-Q. Mao, Unconventional superconductivity in Sr2RuO4, Physica C: Superconductivity and its Applications 514, 339 (2015).
- Pustogow et al. [2019] A. Pustogow, Y. Luo, A. Chronister, Y.-S. Su, D. A. Sokolov, F. Jerzembeck, A. P. Mackenzie, C. W. Hicks, N. Kikugawa, S. Raghu, E. D. Bauer, and S. E. Brown, Constraints on the superconducting order parameter in Sr2RuO4 from oxygen-17 nuclear magnetic resonance, Nature 574, 72 (2019).
- Nobukane et al. [2020] H. Nobukane, K. Yanagihara, Y. Kunisada, Y. Ogasawara, K. Isono, K. Nomura, K. Tanahashi, T. Nomura, T. Akiyama, and S. Tanda, Co-appearance of superconductivity and ferromagnetism in a Ca2RuO4 nanofilm crystal, Scientific Reports 10, 3462 (2020).
- Braden et al. [1998] M. Braden, G. André, S. Nakatsuji, and Y. Maeno, Crystal and magnetic structure of Magnetoelastic coupling and the metal-insulator transition, Phys. Rev. B 58, 847 (1998).
- Zhang et al. [2019] J. Zhang, A. S. McLeod, Q. Han, X. Chen, H. A. Bechtel, Z. Yao, S. N. Gilbert Corder, T. Ciavatti, T. H. Tao, M. Aronson, G. L. Carr, M. C. Martin, C. Sow, S. Yonezawa, F. Nakamura, I. Terasaki, D. N. Basov, A. J. Millis, Y. Maeno, and M. Liu, Nano-Resolved Current-Induced Insulator-Metal Transition in the Mott Insulator , Phys. Rev. X 9, 011032 (2019).
- Bruin et al. [2013] J. A. N. Bruin, H. Sakai, R. S. Perry, and A. P. Mackenzie, Similarity of Scattering Rates in Metals Showing T-Linear Resistivity, Science 339, 804 (2013).
- Gulian and Nikoghosyan [2018] A. M. Gulian and V. R. Nikoghosyan, Serendipitous vs. systematic search for room-temperature superconductivity, Quantum Studies: Mathematics and Foundations 5, 161 (2018).
- Neumeier et al. [1994] J. J. Neumeier, M. F. Hundley, M. G. Smith, J. D. Thompson, C. Allgeier, H. Xie, W. Yelon, and J. S. Kim, Magnetic, thermal, transport, and structural properties of : Enhanced charge-carrier mass in a nearly metallic oxide, Phys. Rev. B 50, 17910 (1994).
- Steppke et al. [2017] A. Steppke, L. Zhao, M. E. Barber, T. Scaffidi, F. Jerzembeck, H. Rosner, A. S. Gibbs, Y. Maeno, S. H. Simon, A. P. Mackenzie, and C. W. Hicks, Strong peak in Tc of Sr2RuO4 under uniaxial pressure, Science 355 (2017).
- Ikeda et al. [2000] S.-I. Ikeda, Y. Maeno, S. Nakatsuji, M. Kosaka, and Y. Uwatoko, Ground state in Fermi liquid close to a ferromagnetic instability, Phys. Rev. B 62, R6089 (2000).
- Perucchi et al. [2013] A. Perucchi, L. Baldassarre, B. Joseph, S. Lupi, S. Lee, C. B. Eom, J. Jiang, J. D. Weiss, E. E. Hellstrom, and P. Dore, Transmittance and reflectance measurements at terahertz frequencies on a superconducting BaFe1.84Co0.16As2 ultrathin film: an analysis of the optical gaps in the Co-doped BaFe2As2 pnictide, The European Physical Journal B 86, 274 (2013).
- Lupi [2011] S. Lupi, Terahertz Spectroscopy of Novel Superconductors, Advances in Condensed Matter Physics 2011, 816906 (2011).
- Ortolani et al. [2006] M. Ortolani, S. Lupi, L. Baldassarre, U. Schade, P. Calvani, Y. Takano, M. Nagao, T. Takenouchi, and H. Kawarada, Low-Energy Electrodynamics of Superconducting Diamond, Phys. Rev. Lett. 97, 097002 (2006).
- Couach et al. [1985] M. Couach, A. Khoder, and F. Monnier, Study of superconductors by a.c. susceptibility, Cryogenics 25, 695 (1985).
- Goldfarb et al. [1991] R. B. Goldfarb, M. Lelental, and C. A. Thompson, Alternating-Field Susceptometry and Magnetic Susceptibility of Superconductors, in Magnetic Susceptibility of Superconductors and Other Spin Systems, edited by R. A. Hein, T. L. Francavilla, and D. H. Liebenberg (Springer US, Boston, MA, 1991) pp. 49–80.
- Civale et al. [1991] L. Civale, T. K. Worthington, L. Krusin-Elbaum, and F. Holtzberg, Nonlinear A.C. Susceptibility Response Near the Irreversibility Line, in Magnetic Susceptibility of Superconductors and Other Spin Systems, edited by R. A. Hein, T. L. Francavilla, and D. H. Liebenberg (Springer US, Boston, MA, 1991) pp. 313–332.
- Gömöry [1991] F. Gömöry, Responses of High Tc Superconductors to Various Combinations of AC and DC Magnetic Fields, in Magnetic Susceptibility of Superconductors and Other Spin Systems, edited by R. A. Hein, T. L. Francavilla, and D. H. Liebenberg (Springer US, Boston, MA, 1991) pp. 289–311.
- Müller [1991] K.-H. Müller, Detailed Theory of the Magnetic Response of High-Temperature Ceramic Superconductors, in Magnetic Susceptibility of Superconductors and Other Spin Systems, edited by R. A. Hein, T. L. Francavilla, and D. H. Liebenberg (Springer US, Boston, MA, 1991) pp. 229–250.
- Jarlborg and Freeman [1980] T. Jarlborg and A. J. Freeman, Magnetism and superconductivity in compounds from self-consistent band calculations, Phys. Rev. B 22, 2332 (1980).
- Mueller et al. [1970] F. M. Mueller, A. J. Freeman, J. O. Dimmock, and A. M. Furdyna, Electronic Structure of Palladium, Phys. Rev. B 1, 4617 (1970).
- Nakatsuji and Maeno [2000] S. Nakatsuji and Y. Maeno, Quasi-Two-Dimensional Mott Transition System , Phys. Rev. Lett. 84, 2666 (2000).
- Pfleiderer et al. [1997] C. Pfleiderer, G. J. McMullan, S. R. Julian, and G. G. Lonzarich, Magnetic quantum phase transition in MnSi under hydrostatic pressure, Phys. Rev. B 55, 8330 (1997).
- Yoshida et al. [1998] K. Yoshida, F. Nakamura, T. Goko, T. Fujita, Y. Maeno, Y. Mori, and S. NishiZaki, Electronic crossover in the highly anisotropic normal state of from pressure effects on electrical resistivity, Phys. Rev. B 58, 15062 (1998).