ANKE Collaboration
Total and differential cross sections of the reaction at excess energies between 1 and 15 MeV
Abstract
New high precision total and differential cross sections are reported for the reaction close to threshold. The measurements were performed using the magnetic spectrometer ANKE, which is an internal fixed target facility at the COSY cooler synchrotron. The data were taken for deuteron beam momenta between and , which corresponds to the range in excess energy for this reaction between and . The normalization was established through the measurement in parallel of deuteron-proton elastic scattering and this was checked through the study of the reaction. The previously indicated possible change of sign of the slope of the differential cross sections near the production threshold, which could be explained by a rapid variation of the - and -wave interference term, is not confirmed by the new data. The energy dependence of the total cross section and the slope parameter are well explained by describing the final state interaction in terms of a complex Jost function and the results are significant in the discussion of -mesic nuclei. In combination with recently published WASA-at-COSY data [P. Adlarson et al., Phys. Lett. B 782, 297 (2018)], a smooth variation of the slope parameter is achieved up to an excess energy of .
pacs:
25.45.-z, 21.85.+d, 14.40.AqI Introduction
Initial measurements at Saclay of the cross section for the reaction near threshold Berger:1988 could be most easily understood if there were a pole in the elastic scattering amplitude Wilkin:1993 at low excess energy , which is the kinetic energy in the center-of-mass system. There had already been suggestions that the interaction of the meson with nucleons was strongly attractive Bhalerao:1985cr and these led Haider and Liu in 1986 Haider:1986EtaMesicNuclei to predict a novel state of nuclear matter, where an meson is bound to a nucleus. Due to uncertainties in the strength of the -nucleon interaction, they suggested that -nuclei would only be formed for nuclei starting from 12C. Nevertheless, an anomalous behavior has also been observed in the photoproduction reaction of the same final state in Pfeiffer:2004 ; Pfeiffer:2005 ; Pheron:2012 , though these data are only available in 4 MeV bins.
The results were confirmed in much more refined measurements at ANKE Mersmann:2007 and COSY-11 Smyrski:2007 . It should be noted that the two data sets are completely compatible but the parameters deduced are different because the close-to-threshold ANKE analysis Mersmann:2007 required consideration of a non-negligible spread in beam momentum. The near-threshold energy dependence of the total cross section in all the published data is shown in Fig. 1. The rapid rise from threshold is much steeper than that expected from phase space and it is this which is interpreted as being due to a strong final state interaction (FSI) and the possible formation of a (quasi)-bound state of the -system close to the production threshold Wilkin:1993 . For excess energies above about 1 MeV the total cross section seems to reach a plateau at a level of about nb and this suggests that the FSI pole must lie in the complex plane with MeV. To account for the high and low behavior, the ANKE data were fitted with an FSI factor that was the product of two poles Mersmann:2007 and this showed that the nearby pole was indeed at MeV with relatively small errors in both the real and imaginary parts of .

In the comparison of data obtained at different facilities, the biggest uncertainty is in the absolute normalization of the cross sections. This is avoided when one looks at the logarithmic slope at , defined as
| (1) |
where , with being the angle between the momentum of the meson and that of the initial proton (or between the deuteron and 3He) in the center-of-mass frame. The published values of the asymmetry parameter are shown in Fig. 2 in terms of the center-of-mass momentum where, non-relativistically, , with being the reduced mass.
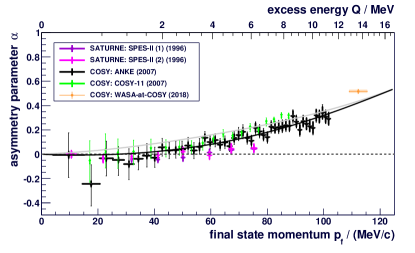
Non-zero values of arise from interference between odd and even partial waves which, at low energies, means principally - and -waves. Since near threshold the -wave amplitude increases like , one might then expect that should show a similar behavior. The experimental data presented in Fig. 2 do show a linear dependence but only for MeV/ and the values of might even go negative in the region below 40 MeV/. It was pointed out Wilkin:2007 that there would be deviations from this expected linear behavior of due to the momentum dependence of the -wave amplitude and the position of the pole in the complex plane found in the ANKE fit Mersmann:2007 would suppress the low values of , as shown in Fig. 2. Although this kind of production data will never distinguish between bound and antibound systems, the real and imaginary parts of the pole position are of great importance in the study of the development of mesic-nuclei.
In view of the importance of the system for the understanding of mesic-nuclei, it is helpful to repeat the measurements of the cross section at low energies with high statistics and better determination of the kinematics. The opportunity arose to use the data acquired for the measurement of the mass of the meson. Values of the deuteron beam momenta were first obtained by taking polarized beams and studying the position of an artificially induced depolarizing resonance Goslawski:2010 . The mass was then determined to very high accuracy purely from kinematics, using the locations of the 3He hits on the ANKE focal plane Goslawski:2012 . The energy dependence of the cross section was not used in this analysis, though the statistical precision benefitted from the high cross section near threshold that is apparent in Fig. 1. Since the experimental methodology is well explained in these papers, the description of the experiment in Sec. II can be quite brief.
Though the experimental considerations are identical to those in the -mass experiment Goslawski:2010 ; Goslawski:2012 , once the reaction has been identified, the analysis of the data described in Sec III is very different because here we are interested in studying the count rates. In order to convert count rates to cross sections it is necessary to establish the normalization, i.e., the luminosity. For internal experiments in a storage ring such as COSY it is standard to compare the corrected count rates with those of a reaction whose normalization is known. The reaction chosen for this purpose is deuteron-proton elastic scattering, which has been well studied in the energy region required for this experiment Fritzsch:2018 ; Fritzsch:2019 . As discussed in Sec. IV, the reaction is easily identified, with a high cross section that is weakly energy dependent. An independent check on the normalization is provided through the measurement of the reaction, which is discussed in Sec. V. Though the limitations on the published database make this method less precise than deuteron-proton elastic scattering, it does show clearly that we have not generated a false energy behavior through the luminosity assumptions.
Our results for the differential and total cross sections for production are presented in Sec. VI. The striking rise of the total cross section over 1 MeV in excess energy indicates that there must be a final state interaction pole for MeV, though its position in the complex plane is much more model dependent. Though there are clear differences between the angular distributions measured at our highest energy and the lowest energies studied in the WASA-at-COSY experiment Adlarson:2018 , the slope parameter varies smoothly over a wide range of final state momentum. Nevertheless, the behavior of the slope near threshold is markedly different to that found in some of the earlier experiments which had been explained as being due a strong energy dependence of the -wave amplitude Wilkin:2007 . In particular there is no sign in our data of the slope changing sign at low energies. The earlier ANKE data on the total cross section and slope parameter Mersmann:2007 were modelled with a final state interaction that was the product of two poles Wilkin:2007 but the modelling would be on much firmer ground if it were taken as the product of a zero and a pole, as is done in Sec. VII. Though the magnitude of the pole position is little changed from the 1 MeV found earlier Mersmann:2007 ; Wilkin:2007 , the phase is changed and this difference is significant in the context of the -mesic nucleus discussion. The final section, Sec. VIII, tries to summarize the results and put them into some kind of context, especially within the discussion of -mesic nuclei more broadly.
II Experiment
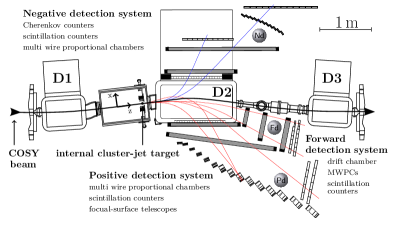
As mentioned in the Introduction, the data presented here were by-products of an experiment to measure the mass of the meson to high accuracy Goslawski:2010 ; Goslawski:2012 . The description of the experiment itself can therefore be relatively concise. The data were taken using the magnetic spectrometer ANKE Barsov:2001 , which is an internal fixed target facility situated inside the cooler synchrotron storage ring (COSY) of the Forschungszentrum Jülich. A schematic overview of ANKE is shown in Fig. 3.
The measurements were performed using an unpolarized deuteron beam incident on a hydrogen cluster-jet target Khoukaz:1999 . The experiment was carried out in the so-called SuperCycle (SC) mode of COSY, where the beam is alternated between up to eight different momentum settings, called FlatTops (FT). The advantage of the supercycle mode is that systematic effects between different beam momentum settings are minimized. To cover the range of deuteron momenta between 3120.17 and 3184.87 MeV/ three supercycles were used. The accuracy of was determined by using the spin-depolarization technique Goslawski:2010 . In total there were 15 different excess energies with respect to the threshold plus two measurements below threshold to control the background. The values of the excess energies for each of the different beam momentum settings are given in Table 1.
Following the interaction of the deuterons with the cluster-jet target Khoukaz:1999 , the ejectiles produced are separated by the dipole magnet D2 according to their rigidity. A special feature of the magnetic spectrometer ANKE is the movable D2 analyzing magnet, which can be shifted transversely to the COSY beam direction to optimize the geometrical acceptance of each reaction being investigated. Due to fixed-target kinematics, the positively charged heavy nuclei are boosted in the forward direction into the acceptance of the forward detector (Fd-system). This consists of one multi-wire drift and two multi-wire proportional chambers (used for track reconstruction) and three layers of plastic scintillators (used for energy loss and time-of-flight measurements). In general, the third layer is part of the so called side wall of the positive detection system but in order to improve the nuclei selection of this measurement it was moved behind the two scintillator layers of the forward detection system. Since the -meson has no charge, having identified the 3He the production is inferred from the missing mass in the reaction.
| SC1 | –5.15 | 1.14 | 1.63 | 2.59 | 4.09 | 6.33 | 8.60 |
|---|---|---|---|---|---|---|---|
| SC2 | –5.15 | 1.36 | 2.10 | 3.08 | 5.07 | 7.32 | 10.37 |
| SC3 | 3.79 | 4.55 | 15.01 |
III Data Analysis
Since the meson is neutral and it is not possible to detect its decay products in ANKE, the isolation of the final state relies on a good measurement of the 3He in the Fd detector and the subsequent identification of the meson using the missing-mass technique.
The data presented here were taken using a hardware trigger requiring one coincident hit in each plastic scintillator layer with a significantly higher energy deposit than that expected for deuterons or protons, which dominate the background. By plotting the energy of the nuclei deposited within the detector material as a function of the reconstructed laboratory momentum , a specific energy-loss band for each particle species can be observed. Fig. 4 (top) shows a typical example of such an energy-loss distribution for data at an excess energy of . The cuts on the energy loss were chosen to be far away from the reaction signal in order to avoid influencing the signal region.
In order to further reduce the amount of competing reactions, a track length cut was also applied using the time information from the plastic scintillator layers. The track length was determined by multiplying the time-of-flight by the relativistic velocity of the nuclei. Since the first two scintillator layers were placed only around apart, an accurate determination of the path length between them is not possible. Instead, the average of the times of the first two layers was used as a start signal and that from the third layer as the stop signal. As a typical example, Fig. 4 (bottom) shows the track length distribution at an excess energy of .


There is a Gaussian-like peak at and the red vertical lines represent the limits that were used as track length cut values.


To eliminate the remaining contributions from other reactions, a model-independent background description was applied. For this purpose, sub-threshold data at an excess energy of were collected during the first two supercycles. These data were analyzed on an event-by-event basis as if they had been taken above the threshold at the specific beam momentum settings of the beam time. This leads to shifts of the kinematic limits in the missing mass or final state momentum distributions for each of the flattops. After correcting for the different luminosities measured at the various beam momentum settings, the scaled background spectrum was subtracted from the above-threshold data. This procedure was carried out for 40 bins with a bin width of to provide an accurate investigation of the angular dependence (cf. Fig. 5, top). The signal yields for each bin was determined by summing over the range of a Gaussian fit to the background-subtracted data (cf. Fig. 5, bottom).
The geometrical acceptance of the detector was also determined from Monte Carlo simulations. Here, the same cut conditions and counting methods were applied as in the experiment in order to estimate the acceptance-corrected yields for each flattop and bin. In general, the geometrical acceptance factor is or higher, except for the highest energy. The 15 MeV data, which were taken well above the production threshold and close to the limit of full geometrical acceptance of ANKE, have acceptance factors that lie between 50% and 80%, depending upon the polar angle of the production. This geometrical acceptance factor must be estimated in an iterative way since detector resolution can cause migration effects, which means that some events will be reconstructed in a different bin to the one in which they were generated. In order to correct for this, the distributions of the acceptance corrected number of events were fitted with a polynomial, which served as the input for new Monte Carlo simulations in the next iteration. This procedure was repeated until the distribution of the geometrical acceptance factors converged.
IV Normalization through elastic scattering
The normalization of the reaction was assured by comparing the corrected count rates with those of deuteron-proton elastic scattering, which was measured in parallel. The advantage of using this reaction is the wide available data base with high differential cross sections , on the order of over the ANKE acceptance range between . This ensures an excellent signal-to-background ratio. Here is the square of the four-momentum transfer and it is important to note that has a weak energy dependence over the energy interval required for this experiment Fritzsch:2018 ; Fritzsch:2019 . The small variations, which are not more than at the highest available momentum transfers, might be due to the uncertainty in the input amplitudes that were used for the refined Glauber calculations.
The identification of elastic scattering was accomplished by detecting the fast deuterons in the Fd-system. For this purpose, a second hardware online trigger was applied to handle the enormous amount of data. In contrast to the identification of the nuclei, this trigger required at least one hit in each of the first two scintillator layers with low energy deposit, since the deuterons carry half of the charge of nuclei. In addition, a pre-scaling factor of 1024 was applied in order to reduce the dead time of the data acquisition system. Due to the low momentum transfer to the target proton, deuterons from elastic scattering have momenta close to that of the beam. A simple cut on the ratio between the reconstructed deuteron momentum and the nominal beam momentum, , removes the vast majority of the background and allows one to investigate an almost background-free elastic scattering signal.
As in the case of the reaction, the numbers of elastic scattering events were determined by fitting a Gaussian to the missing-mass spectrum and summing all events within of the peak. The determination of the acceptance factors was also made in the same way as described earlier, using Monte Carlo simulations. For each beam momentum setting this procedure was done for 18 momentum transfer bins with a bin width of . This showed that the acceptance factor drops from 15% to 7% with increasing momentum transfer.
The published elastic scattering differential cross sections Dalkhazhav:1969 ; Winkelmann:1980 ; Irom:1984 ; Velichko:1988 ; Guelmez:1991 were fit to the function
| (2) |
in the momentum transfer interval . This led to parameters , and . This function was integrated over each momentum transfer bin so that the luminosity was determined independently for 18 momentum transfer bins for each beam momentum setting. The results presented in Table 2 are the weighted mean values of the luminosity for each flattop above the threshold.
| (MeV) | () | () | () |
|---|---|---|---|
| –5.15(1) | 2215(24) | 94 | 94 |
| –5.15(1) | 2282(24) | 97 | 104 |
| 1.14(1) | 1148(13) | 50 | 49 |
| 1.36(1) | 1175(16) | 50 | 56 |
| 1.63(1) | 1193(13) | 53 | 54 |
| 2.10(1) | 1164(12) | 46 | 78 |
| 2.59(1) | 1152(14) | 46 | 50 |
| 3.08(1) | 1160(13) | 49 | 52 |
| 3.79(1) | 1194(14) | 47 | 54 |
| 4.09(1) | 1166(13) | 48 | 51 |
| 4.55(1) | 1209(14) | 51 | 50 |
| 5.07(1) | 1191(13) | 50 | 52 |
| 6.33(1) | 1137(14) | 48 | 50 |
| 7.32(1) | 1165(14) | 51 | 46 |
| 8.60(1) | 992(11) | 42 | 48 |
| 10.37(1) | 1054(12) | 42 | 49 |
| 15.01(1) | 984(11) | 51 | 45 |
With this method a systematic precision of and statistical precision were achieved, which are improvements by at least a factor of two compared to the previous measurements at ANKE Mersmann:2007 ; Rausmann:2009 . The systematic uncertainties arise mainly from the absolute normalization of the elastic scattering reference data and from possible errors in the setting of the nominal beam deflection angle of ANKE.
V Normalization through the reaction
An independent check on the luminosity is provided through the measurement in parallel of the reaction, whose analysis is described in detail in Ref. Fritzsch:2019 . This will also confirm that we have not introduced any spurious energy dependence in the excitation function through some unknown systematic effect in the elastic luminosity determination. A clear advantage of using this reaction is that the identification of the nuclei, which differ only in momentum from those shown in Fig. 4, is identical to that in the case, so that all the previously discussed software cuts can be modified and used. After doing this, Fig. 4 (top) shows a clear island corresponding to final states.
In contrast to production, the final state covers the much higher excess energy range between and . The geometrical acceptance of the forward system then restricts the detection of this reaction to near-forward events with .
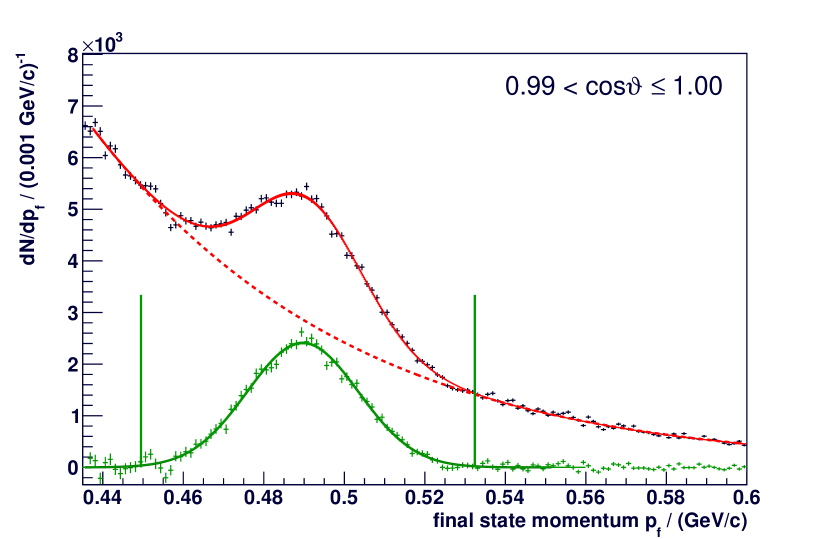
One sees in Fig. 6 a clear peak in the 3He momentum distribution corresponding to production. This is sitting on a background that arises mainly from multi-pion production as well as deuteron breakup reactions. This background was parameterized empirically as
| (3) |
Taken together with a Gaussian form to represent the signal, the data of Fig. 6 were fit to determine the parameters. Shown separately are the total fit (solid red line), the background (red dashed line), and the background-subtracted spectrum (green distribution). The signal yield was determined by summing over the range of a Gaussian fit to the background-subtracted data (solid green line). This procedure was carried out for 14 angular bins from to with uniform widths of . This was then repeated for all 17 beam momentum settings. The geometrical acceptance correction factors were determined in the same way as described in Sec. III. With increasing the acceptance correction factors rise from 15% up to 90% for all energies.
Differential cross sections were determined using the elastic luminosities given in Table 2 and the acceptance-corrected yields for the final state. As an example, the results for the kinetic energy (i.e. supercycle 2, flattop 5) are shown in Fig. 7. The red solid line is a fit of the form
| (4) |
and the red shaded area describes the uncertainty of the fit. The parameters from the fits are given in Table 3 for all beam momenta. Since the identification of the nuclei is exactly the same as for the , when using this reaction for the normalization, the systematic uncertainties of the differential cross sections are completely dominated by those of the luminosity given in Table 2.
The only published data in our kinematic region were obtained at Saclay in 200 MeV steps at Kerboul:1986 and the only one in our energy range was taken at 1800 MeV. This is represented by the blue data point in Fig. 7. In addition to the statistical error, there is an normalization uncertainty in the data of Ref. Kerboul:1986 as well as the normalization uncertainty of our data shown in Table 2.

In order to facilitate a comparison with our results, the Saclay data were fitted with a fourth order polynomial to extract the differential cross sections as a function of , This curve is compared in Fig. 8 to the extrapolation of our results to the forward direction. Given the statistical uncertainty of the interpolation to our values, the normalization uncertainty of Ref. Kerboul:1986 , as well as the normalization uncertainty of our data shown in Table 2, it is seen that our results are consistent with those obtained at Saclay Kerboul:1986 . Just as important, one sees from Fig. 8 that the slopes of the fit to the Saclay data and that of our results are very similar. This means that any possible systematic energy dependence of the introduced through the use of elastic scattering for normalization can be ruled out.

| (MeV) | (b/sr) | (b/sr) | (b/sr) | (b/sr) | (b/sr) | (b/sr) | |
|---|---|---|---|---|---|---|---|
| 1.25 | 0.04 | 10.4 | 1.2 | 28 | 8 | 2.8 | |
| 1.28 | 0.04 | 10.8 | 1.0 | 31 | 6 | 1.9 | |
| 1.15 | 0.02 | 9.8 | 0.5 | 30 | 4 | 1.7 | |
| 1.16 | 0.05 | 9.8 | 1.4 | 27 | 9 | 3.1 | |
| 1.15 | 0.04 | 9.9 | 1.1 | 29 | 7 | 2.2 | |
| 1.15 | 0.04 | 9.7 | 1.1 | 29 | 7 | 1.9 | |
| 1.15 | 0.03 | 10.3 | 0.8 | 33 | 5 | 1.2 | |
| 1.14 | 0.03 | 10.2 | 0.8 | 32 | 5 | 1.4 | |
| 1.14 | 0.03 | 9.7 | 0.9 | 29 | 5 | 1.5 | |
| 1.13 | 0.03 | 9.4 | 0.7 | 25 | 5 | 1.2 | |
| 1.14 | 0.04 | 10.8 | 1.1 | 38 | 7 | 2.6 | |
| 1.10 | 0.04 | 8.7 | 1.2 | 21 | 8 | 2.9 | |
| 1.09 | 0.05 | 9.1 | 1.4 | 27 | 8 | 2.9 | |
| 1.10 | 0.03 | 8.8 | 0.9 | 23 | 6 | 1.8 | |
| 1.13 | 0.02 | 10.7 | 0.7 | 35 | 4 | 0.8 | |
| 1.09 | 0.04 | 9.9 | 1.2 | 31 | 8 | 2.7 | |
| 1.04 | 0.03 | 9.4 | 0.8 | 30 | 5 | 1.3 |
VI Results
The measured luminosities and acceptance-corrected count yields of the final state were used to determine total and differential cross sections. Table 4 shows the resulting total cross sections. The systematic uncertainties are dominated by those of the normalization based upon deuteron-proton elastic scattering. Neither a variation of the track length limits from to or nor a variation of the energy loss limits influences the results.
Only for the highest flattop at can one apply also above-threshold data, using the same method to study the background as already described in Sec. III. This is because for data up to the shifted signals do not overlap with those seen in the spectrum. The total cross sections determined using the above-threshold data in the description of the background show a systematic deviation of . This leads to an additional asymmetric uncertainty at 15.01 MeV and this effect has already been included in the uncertainties given in Table 4.
| (MeV) | (nb) | (nb) | (nb) | |
|---|---|---|---|---|
| 355(9) | 15 | 15 | 0.048(8) | |
| 357(9) | 17 | 15 | 0.067(9) | |
| 357(9) | 16 | 16 | 0.045(8) | |
| 366(10) | 25 | 15 | 0.068(10) | |
| 367(10) | 16 | 15 | 0.133(8) | |
| 371(10) | 17 | 16 | 0.117(8) | |
| 378(11) | 17 | 15 | 0.107(10) | |
| 374(10) | 16 | 16 | 0.146(9) | |
| 379(11) | 16 | 16 | 0.144(9) | |
| 376(11) | 16 | 16 | 0.179(8) | |
| 379(11) | 17 | 16 | 0.238(7) | |
| 388(11) | 15 | 17 | 0.242(9) | |
| 384(12) | 19 | 16 | 0.310(9) | |
| 390(12) | 18 | 15 | 0.375(11) | |
| 403(17) | 18 | 23 | 0.570(34) |

Fig. 9 shows the differential cross sections for all excess energies as well as a linear fit (red line) of the form
| (5) |
and the uncertainty of the fit (red shaded area). In the case of the highest excess energy data point, a third order polynomial fit function of the form
| (6) |
is displayed (green line), which has a significance of compared to a linear fit. The results for the fit parameters are given in Table 4. An extensive study of uncertainties was also done here by varying, e.g., the software cut limits. Since the systematic uncertainty of the luminosity, which was the dominant effect for the total cross sections, plays no role for the asymmetry parameter , the systematic uncertainties are roughly only one-fifth of the statistical uncertainties shown in Table 4.
The WASA-at-COSY collaboration recently published data on the reaction with a proton beam Adlarson:2018 . Their lowest excess energies were and and these results, normalized to the total cross section of this work at 15.01 MeV, are compared with our data in the final panel of Fig. 9. Since there are clear differences between the two data sets, a further investigation of the ANKE acceptance was undertaken. In the vicinity of there was a significant dependence on the azimuthal angle , which is not permissable for a two-body reaction involving unpolarized particles. This effect may be due to the 3He hitting boundary areas of the ANKE detector where systematic problems with the acceptance corrections are known to occur. In order to analyze this last energy, arbitrary cuts in the plane were made. It should be noted that 15.01 MeV is the only excess energy where there is not full acceptance in the ANKE detector. It is therefore reassuring that for none of the other excess energies does one observe the troubling dependence.

Fig. 10 shows the total cross sections as well as the corresponding asymmetry parameters from the previous ANKE (gray) and COSY-11 (green) measurements Mersmann:2007 ; Smyrski:2007 . Given the normalization uncertainties of the different measurements, these earlier total cross sections were renormalized to the present data in order to compare the shapes. The scaling factors were defined by the ratios of the average total cross sections between and . It can be seen that the new ANKE data (red) also show a plateau-like behavior with a slight tendency to increase with rising beam momentum, which is similar to the COSY-11 data.

There is, of course, no normalization uncertainty in the different measurements of the asymmetry parameters and, given the large error bars of some of the older data, the various results are broadly similar. The high precision of the new ANKE data excludes the possibility that might change sign for though all the data do show a monotonically increasing behavior for . Fig. 11 shows the values of the asymmetry parameters extracted from this experiment and from that of WASA-at-COSY Adlarson:2018 . To emphasize the smooth behavior of this parameter, even in the overlap region of these two experiments, the blue line represents a polynomial fit to the combined data set in terms of odd powers of .
VII Final state interactions
Since the new ANKE data do not extend to the very near-threshold region of , a combined fit was made of the total cross sections and asymmetry parameters measured in the previous ANKE and COSY-11 experiments Mersmann:2007 ; Smyrski:2007 as well as the new ANKE data of this work. For this purpose the total cross sections of the previous ANKE and COSY-11 data were normalized to the new data, as described in the previous section.
If only - and -waves are retained, the observables may be parameterized as
| (7) |
with the effective -wave amplitude being taken as a complex constant.
In the previous ANKE analysis Mersmann:2007 , the -wave amplitude was taken as the product of two poles, it being argued that the second pole was so far away that this would have little influence on the parameters deduced for the near-threshold pole. The analysis is on much firmer theoretical grounds if one describes the final state interaction in terms of a Jost function that goes to a non-zero constant for large Newton:1982 . Thus we take
| (8) |
A combined fit was made to the total cross section and asymmetry parameter using the functions of Eqs. (7) and (8). A fit range of was chosen to minimize contributions from higher partial waves. It should also be noticed that, in addition, as increases the -wave final state interaction becomes less important. This fit range leads to the parameters
| (9) |
where, it should be stressed, the uncertainties are strongly correlated. This is to be compared to the two-pole description of the earlier ANKE data given in Ref. Wilkin:2007 , which had . The real parts of differ by large amounts compared to the quoted errors but these do not include any uncertainty arising from the FSI assumption in Eq. (8) and the corresponding one in Ref. Mersmann:2007 . This difference in leads to one in the pole position, viz., MeV versus MeV Mersmann:2007 . The changes in the value of are significant in the question of the possible existence of a He mesic nucleus.
The form used in Eq. (8) corresponds completely to that of a complex Bargman potential Bargmann:1949 for which the He scattering length becomes
| (10) |
The value resulting from our measurements is .
VIII Summary
The differential cross section for the reaction was measured with the ANKE magnetic spectrometer at 15 different excess energies from to . The 3He was clearly identified in the spectrometer and the meson determined from the missing mass in the reaction. After making acceptance corrections, the normalization (i.e., the luminosity ) was determined from deuteron-proton elastic scattering that was measured in parallel. This led to a systematic precision of and statistical precision , which are improvements by at least a factor of two compared to the earlier measurements at ANKE Mersmann:2007 ; Rausmann:2009 . The normalization could be checked through the measurement of the differential cross section at small angles, though this method is hindered by the 8% systematic uncertainty in the only available reference data Kerboul:1986 . Nevertheless, these results do show that the energy dependence of the normalization achieved through elastic scattering is broadly correct. As a byproduct of these production data, we have obtained well normalized differential cross section in small energy steps around a deuteron beam energy of MeV.
Due to full geometrical coverage over the entire range and the high event rates, angular distributions with a bin width of could be extracted for each beam momentum setting. Apart from the highest excess energy, the differential cross sections seem to be linear in , with a slope that increases with rising . However, at 15.01 MeV a third order polynomial was needed to describe the data and this is a sign that higher partial waves are present.
The asymmetry parameters vary smoothly from MeV in our measurements at ANKE to the MeV at WASA Adlarson:2018 . Taken together, the data show in unprecedented detail up to an excess energy of . Furthermore, the possible change of sign of the asymmetry parameter near threshold, indicated in earlier measurements, is not confirmed by the new ANKE data. Fitting the low energy total cross section and asymmetry parameter with an -wave FSI function that has a more believable large behaviour changes the position of the near-threshold pole and this is important in the discussions of -mesic nuclei, of which the case of He studied here is probably the best example. It is reassuring that the value of the scattering length estimated using an optical potential ansatz is fmXie:2017 , which is compatible with our experimental result of fm. Other reactions are less favored and, to illustrate this point, the only similar possible signal is found in the reaction Willis:1997 and the cross section is about a factor of 50 lower than that measured here. Other above-threshold experiments involving heavier nuclei give even smaller values.
Above-threshold measurements cannot distinguish between bound and antibound (virtual) states but searches below threshold for signs of an He, such as that carried out at WASA Adlarson:2017 , are hampered by the necessary absence of an signal. In 1988 no convincing sign was found for -mesic nuclei in below-threshold measurements Chrien:1988 and this is still the situation now.
We turn finally to attempts to provide a theoretical description of the reaction. Due to the large mass of the meson, a single-nucleon mechanism is much reduced in importance and it is likely that both nucleons in the deuteron must be involved dynamically Laget:1988 . A simple semi-classical model based on these ideas was proposed Kilian:1990 and later put in quantum mechanical form Kondratyuk:1995 ; FaeldtWilkin:1995 . Although this approach has some success at threshold, it fails to describe the energy dependence and the shapes of the cross section away from threshold. There is therefore much theoretical work to do, especially to connect the reaction mechanism with the final state interaction.
Acknowledgments
The authors express their thanks to the COSY machine crew for producing such good experimental conditions and also to the other members of the ANKE collaboration for diverse help in the experiment. This work was supported in part by the JCHP Fremde Forschungs und Entwicklungsarbeiten (FFE) of the Forschungszentrum Jülich and also by the DFG through the Research Training Group GRK2149.
References
- (1) J. Berger et al., Phys. Rev. Lett. 61 919 (1988).
- (2) C. Wilkin, Phys. Rev. C 47, R938 (1993).
- (3) R.S. Bhalerao and L.C. Liu, Phys. Rev. Lett. 54, 865 (1985).
- (4) Q. Haider and L.C. Liu, Phys. Lett. B 172, 257 (1986).
- (5) M. Pfeiffer et al., Phys. Rev. Lett. 92, 252001 (2004).
- (6) M. Pfeiffer et al., Phys. Rev. Lett. 94, 049102 (2005).
- (7) F. Pheron et al., Phys. Lett. B 709, 21 (2012).
- (8) T. Mersmann et al., Phys. Rev. Lett. 98, 242301 (2007).
- (9) J. Smyrski et al., Phys. Lett. B 649, 258 (2007).
- (10) P. Adlarson et al., Phys. Lett. B 782, 297 (2018).
- (11) B. Mayer et al., Phys. Rev. C 53, 2068 (1996).
- (12) H.-H. Adam et al., Phys. Rev. C 75, 014004 (2007).
- (13) C. Wilkin et al., Phys. Lett. B 654, 92 (2007).
- (14) P. Goslawski et al., Phys. Rev. ST Accel. Beams 13, 022803 (2010).
- (15) P. Goslawski et al., Phys. Rev. D 85, 112011 (2012).
- (16) T. Rausmann et al., Phys. Rev. C 80, 017001 (2009).
- (17) C. Fritzsch et al., Phys. Lett. B 784, 277 (2018).
- (18) C. Fritzsch, PhD thesis, Westfälische Wilhelms-Universität, Münster (2019).
- (19) S. Barsov et al., Nucl. Instrum. Meth. Phys. Res. A 462, 364 (2001).
- (20) A. Khoukaz et al., Eur. Phys. J. D 5, 275 (1999).
- (21) M. Tanabashi et al., Phys. Rev. D 98, 030001 (2018).
- (22) N. Dalkhazhav et al., Sov. J. Nucl. Phys. 8, 196 (1969).
- (23) E. Winkelmann et al., Phys. Rev. C 21, 2535 (1980).
- (24) F. Irom et al., Phys. Rev. C 28, 2380 (1983).
- (25) G.N. Velichko et al., Sov. J. Nucl. Phys. 47, 755 (1988).
- (26) E. Guelmez et al., Phys. Rev. C 43, 2067 (1991).
- (27) C. Kerboul et al., Phys. Lett. B 181, 28 (1991).
- (28) R. G. Newton, Scattering Theory of Waves and Particles, (Springer-Verlag, New York, 1982).
- (29) V. Bargmann, Phys. Rev. 75, 301 (1949).
- (30) Ju-Jun Xie et al., Phys. Rev. C 95, 015202 (2017).
- (31) N. Willis et al., Phys. Lett. B 406, 14 (1997).
- (32) P. Adlarson et al., Nucl. Phys. A 959, 102 (2017).
- (33) R.E. Chrien et al., Phys. Rev. Lett. 60, 2595 (1988).
- (34) J.M. Laget and J.F. Lecolley, Phys. Rev. Lett. 61 2069 (1988).
- (35) K. Kilian and H. Nann, AIP Conf. Proc. 221, 185 (1991).
- (36) L.A. Kondratyuk, A.V. Lado, and Yu.N. Uzikov, Phys. At Nucl. 58, 473 (1995).
- (37) G. Fäldt and C. Wilkin, Nucl. Phys. A 587, 769 (1995).