A Catalog of Solar Flare Events Observed by the SOHO/EIT
Abstract
We have compiled a catalog of solar flares as observed by the Extreme ultraviolet Imaging Telescope (EIT) aboard the Solar and Heliospheric Observatory (SOHO) spacecraft and the GOES spacecraft over a span from 1997 to 2010. During mid-1998, the cadence of EIT images was revised from two images per day to 12 minutes. However, the low temporal resolution causes significant data gaps in capturing much of the flaring phenomenon. Therefore, we monitor possible errors in flare detection by flare parameters such as temporal overlap, observational wavelength, and considering full field of view (FOV) images. We consider the GOES flare catalog as the primary source. We describe the technique used to enhance the GOES detected flares using the Extreme Ultraviolet (EUV) image captured by the EIT instrument. In order to detect brightenings, we subtract the images with a maximum cadence of 25 minutes. We have downloaded and analyzed the EIT data via the Virtual Solar Observatory (VSO). This flare dataset from the SOHO/EIT period proves indispensable to the process of the solar flare predictions as the instrument has covered most of Solar Cycle 23.
1 Introduction
Solar flares (SFs) are sudden brightening features across the electromagnetic spectrum observed due to the release of stored magnetic energy in the solar atmosphere (Benz, 2016). Such an instant explosion of energy is followed by a release of intense radiation into space. SFs are one of the most prominent activities that are often accompanied by coronal mass ejections (CMEs). However, not all flares have accompanying CMEs. Larger CMEs lead to solar energetic particle (SEP) emissions. These high-energy particles consist of electrons, protons, and higher ions accelerated to near-relativistic speeds. Often, SEP events are classified as gradual and impulsive where the latter focus on SFs while the former are relevant to those SEPs originating from CMEs (Kouloumvakos et al., 2015; Desai & Giacalone, 2016; Kahler et al., 2017). Even though SEPs are associated with large flares, not every large flare has SEPs associated with it. In this regard, the X-ray peak contends as a strong indicator for a large SF that is capable of accelerating high-energy particles toward the Earth.
In space weather (SWx) research, the solar events are studied for (i) their influences on the nature of geomagnetic fields and (ii) how they can interact with the electromagnetic systems of the Earth (Pevtsov, 2016). Some extreme events affect the radiation environment traveled by many spacecraft and astronauts outside the Earth’s magnetosphere, posing an extreme threat to humans on space missions (Dartnell, 2011; Melott & Thomas, 2011). High-energy rays from SFs can cause disturbances in the upper atmosphere of the Earth at km, which can cause radio blackouts. The degradation of high-frequency radio signals occurs due to ionization in the D region of a more dense and lower layers of the ionosphere, primarily impacting the 3-30 MHz band (Benson, 1964; McNamara, 1979; Frissell et al., 2019) This includes affecting certain types of global military communications and air traffic control (Knipp & Gannon, 2019).
SFs are monitored continuously in white light, radio waves, soft and hard X-rays, and in extreme ultraviolet (EUV) wavelengths by several instruments on the ground and in space (Benz, 2016). The Geostationary Operational Environmental Satellites111https://www.ngdc.noaa.gov/stp/solar/solarflares.html (GOES, Bornmann et al. (1996)) have collected a database of solar flares providing temporal and spatial data along with intensity classifications. Most of the solar missions such as, YOHKOH222http://ylstone.physics.montana.edu/ylegacy/HXT_catalog/index.html (Bentley, 1994), the Reuven Ramaty High Energy Solar Spectroscopic Imager333https://hesperia.gsfc.nasa.gov/hessidata/dbase/hessi_flare_list.txt (RHESSI, Hurford (2003)), HINODE444http://xrt.cfa.harvard.edu/flare_catalog/ (Kosugi et al., 2007), and the Solar Dynamics Observatory (SDO)555https://www.lmsal.com/isolsearch ((Lemen et al., 2012)) have their flare catalogs, whose events are curated using onboard instruments. These catalogs use GOES X-rays mostly to detect flares but imaging from other ones to localize the flare.
The metadata obtained from various observational instruments has been processed and produced in the form of a catalog by many researchers for scientific study essential to solar physicists and space weather researchers (e.g., Yohkoh Flare Catalog: Sato et al. (2006), Hinode Flare Catalog: Watanabe et al. (2012), SDO/EUV Variability Experiment (EVE) Catalog: Hock (2012)). There are also efforts by Sadykov et al. (2017) in combining metadata from various instruments into one database useful for predictive analytics. The integration of data as well supports researchers alongside the technology of Big Data.666Interactive Multi-Instrument Database of Solar Flares https://helioportal.nas.nasa.gov/ To analyze flares, the data from a specific instrument and observation information are essential for statistical as well as analytical studies. For example, an active region (AR) producing a GOES M1.0 flare has a larger probability of producing flares in the next 24 hr (Park et al., 2018). The location of the parent SF is an essential parameter for the efficient prediction of a possible SEP event (Gopalswamy et al., 2014).
Since 1974, two X-ray sensors (XRS) on each GOES satellites measure solar X-ray fluxes for the wavelength bands of 0.5-4 Å (short channel) and 1-8 Å (long channel; (Garcia, 1994). The flares from GOES are detected through hard X-ray detectors and provides the flare location on the Sun using the H-alpha images and the Solar X-ray Imager instrument uninterrupted from 2003 (Bornmann et al., 1996). GOES has traced flaring activity since the beginning of 1974 and has a catalog available with spatial and temporal specifications along with an associated AR number. However, some flare locations and/or AR numbers are missing from the GOES catalog or probably have errors (Milligan & Ireland, 2018; Angryk et al., 2020a, b).
Amongst several operational instruments, the Extreme ultraviolet Imaging Telescope (EIT) on board the Solar and Heliospheric Observatory (SOHO) observed the Sun in EUV wavelengths (Delaboudinière et al., 1995). Although EIT was not designed to observe flares, SOHO did capture a large number of flares during Solar Cycle 23. Nonetheless, no catalog of flares has been available based on the EIT data until now. Although our work is not exclusive to EIT, we are enhancing the GOES detected flares using EIT data. The enhancement is rather the important localization aspect as it increase the quality of the flare database. Such a catalog would be very useful to researchers to investigate more for statistical and other SF studies further.
In this paper, we present a catalog of SFs, as seen by the SOHO/EIT instrument. This part of our work is introduced in Section 2. We choose the duration of the EIT’s primary operations, i.e., from 1997 to 2010, to get the flare locations. The main purpose behind this effort is to improve the quality of the flare locations in the existing database curated for machine learning (ML) and to make the flare metadata during the SOHO-era available for interested researchers. We have examined all the spatiotemporal attributes and/or characteristics of the EIT flares alongside the GOES SF catalog that is explained with the results in Section 3. We summarize our results in Section 4. Our catalog will be made publicly available on Harvard dataverse at https://doi.org/10.7910/DVN/C9H34R.
2 DATA
In addition to the traditional statistical survey, for ML-based SWx forecasts, it is crucial to verify and establish the input data in the GOES catalog with other space-borne instruments (Angryk et al., 2020a). Flare prediction is one of the most prominent SWx forecasting applications for which flare localizations are of utmost importance. In this regard, Angryk et al. (2020b) developed a benchmark dataset of ARs, together with flares consisting of a clean, verified, and easily accessible database put together from several sources using SDO data. In order to extend the quality of this benchmark dataset, we choose to analyze the pre-SDO period utilizing the SOHO data.
2.1 EIT Imaging
Level Zero science data from the EIT instrument was downloaded by querying the Virtual Solar Observatory (VSO)777https://vso.nascom.nasa.gov/cgi/search using the Solarsoft888http://www.lmsal.com/solarsoft/ssw_whatitis.html IDL routines. The EIT images are already corrected for pointings in the header. The EIT captures the Sun in four different EUV wavelengths, which are, 171, 195, 284, and 304 Å. The EIT instrument has a Nyquist limited resolution of 5.2 arcsec (2.6 arcsec pixels) (Delaboudinière et al., 1995). The initial cadence for observing was six hours but was improved to 12 minutes from July 1998 on (ESA, 2010). Nonetheless, the available 195 Å synoptic images have a varying cadence from seven minutes to 13 minutes.
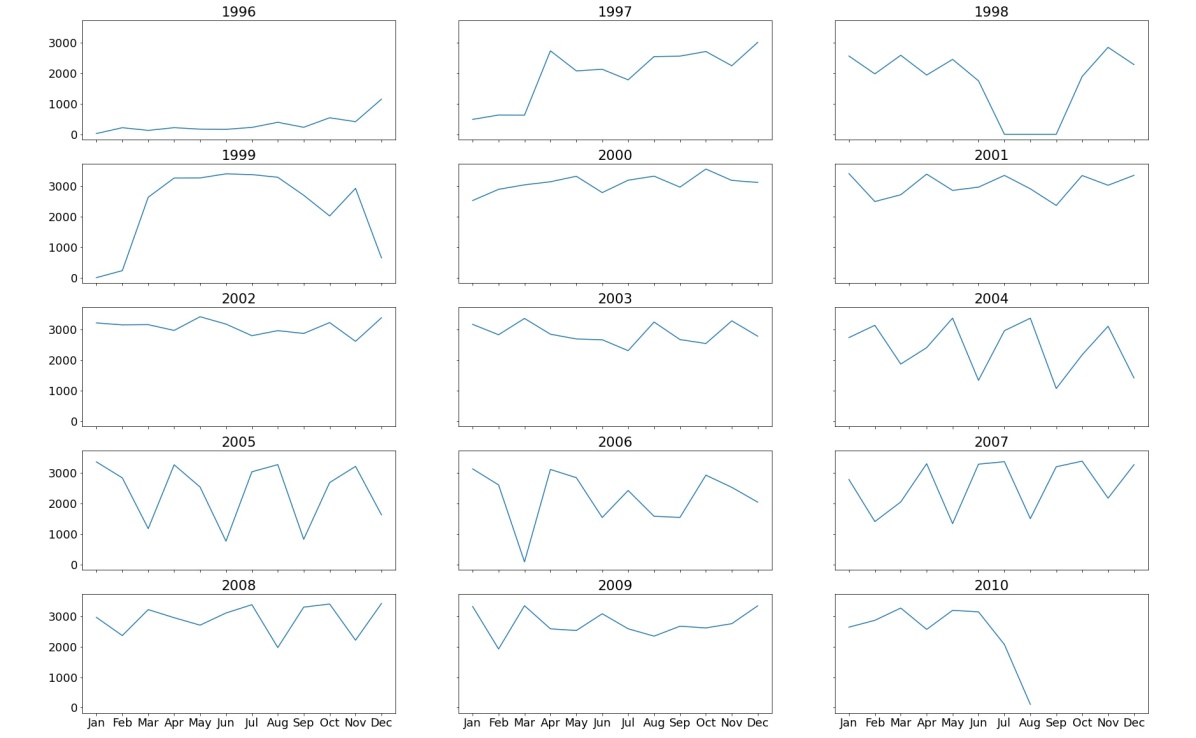
In Figure 1, the number of available EIT images per month from 1996 to 2010 is shown. At the specified cadence of 12 minutes, there should be approximately 3600 images captured by EIT every month. However, that is not the case. Noticeably, there is a significant irregularity in the available EIT images, which is a primary challenge for finding flare locations. There is an intrinsic difference between X-ray observations and those in the EUV images and they do not necessarily correspond one-to-one with each other. In the 195 Å band, Fe XII, Ca XVII, and Fe XXIV lines are dominated, which have their maximum fractional abundances at 1.4 K, 5 K, and (1–2) K, respectively (Feldman et al., 1999). The 195 Å wavelength shows significantly hot flaring regions on the Sun, giving a better choice to detect flares. However, 304 Å also shows the transition region of the solar atmosphere, effectively reducing the contrast between flares and the background Sun compared to the other three wavelengths, and therefore was not considered in this work.
2.2 Data selection
To localize the flares and associate them with ARs, three data resources are needed: (1) the GOES flare catalog999https://www.ngdc.noaa.gov/stp/space-weather/solar-data/solar-features/solar-flares/x-rays, (2) the National Oceanic and Atmospheric Administration (NOAA) AR summary, and (3) the full field-of-view EIT images. For our study, we used 195 Å images of the EIT instrument with a resolution of 1024 x 1024 pixels. The EIT Web catalog interface and VSO hold the data products from SOHO/EIT, which were downloaded to our server. More details about the instrument and calibration can be obtained from the official website.101010https://umbra.nascom.nasa.gov/eit/eit_guide/
3 Methodology
Flare detection schemes are often built upon (1) time series data and/or (2) image data, for automatic detection (Fernandez Borda et al., 2002; Qu et al., 2003; Kano et al., 2008; Grigis et al., 2009; Aranda & Caballero, 2010; Bonte et al., 2013; Caballero & Aranda, 2014; Kraaikamp & Verbeeck, 2015). For this work, we utilized Solarsoft’shttps://hesperia.gsfc.nasa.gov/ssw/gen/idl/ssw_util/ssw_flare_locator.pro (catalog Flare Locator) algorithm (Freeland & Handy, 1998) that works on the second principle-that is, image-based data. The flares are detected by measuring a threshold of the peak light intensity per macro pixel of an EIT 195 Å image closest to the GOES start time and then taking the relative difference with an image closest to the GOES peak time. Milligan & Ireland (2018) report that this process of image subtraction does not actually guarantee a flaring emission is detected but only that the timing and pointing given in GOES dataset are consistent with the timing and location of the flare. The image subtraction using Flare Locator algorithm also extracted information about dynamic flaring events in the EIT data that are not seen in X-ray images and, hence, cannot be related to a GOES flare. These are not false reports but are multiple events or, in some cases, post-flare loops occurring over a different active region or part of the Sun. Timing and position information from each event can be cross-checked with the metadata from other instruments to determine the observation of these events at the same time in the same location. The procedure to obtain the input images to the Flare Locator is discussed below.
3.1 Flare detection and verification
The steps followed in preparing the EIT Flare Catalog include:
-
1.
All the flares reported in the GOES catalog are downloaded from the NOAA site during SOHO/EIT’s primary operation from 1997 to 2010.
-
2.
For each flaring event of GOES class C1.0, a full-disk EIT image at 195 Å is identified, such that the imaging time corresponds to the GOES start time of the flare within the range of 5 minutes.
-
3.
Every available image is then input as a primary image to the Flare Locator with a reference image taken after the primary within the range 25 minutes. If multiple images are available within the considered time range, then the closest image observed after the GOES flare peak time is selected as the reference image.
The verification process between the EIT flare coordinates and GOES flare coordinates is two-fold based on the following convention:
-
1.
Exclusive flare positions in the GOES catalog are compared with the EIT flare coordinates such that the flares overlap in their temporal occurrence.
-
2.
The implicit location derived from the centroid of NOAA AR is used if the explicit point coordinates are not available
In Table 1, a sample dataset of verified X-class flares from 1997 to 2000 is shown. The dataset provides the index, start and end times of the event detection, location of the flaring region, the GOES X-ray classification, and the NOAA AR number. The following convention is used to determine whether a flare is flagged as verified or not verified: If the flare position (X, Y) in the EIT image is within 25 arcsec compared to the GOES location, then it is considered verified. The selection of the distance is based on a similar convention implemented by the Hinode flare catalog to identify the overlapping flaring regions (Watanabe et al., 2012). If the EIT flare coordinates within 25 arcsec do not overlap with the GOES flare catalog, then they are considered as not verified. There are some events detected in the EIT images where the corresponding locations vary largely from GOES coordinates. This is due to co-occurring events around the same time on different parts of the Sun. Such events are also flagged as not verified. The not verified class would include the flares occurring near-limb or behind the limb that would be detected by GOES X-rays as a result and if there is no way here to localize those events. If there are no existing coordinates in the GOES catalog to cross-check the EIT coordinates, then such flares are also flagged as not verified. The structure of the database schema-that is, the headers in Table 1-are as follows:
-
•
start_time_detection corresponds to the observation time of the initial EIT image used for detection. This is the primary image input to the flare detection software.
-
•
end_time_detection corresponds to the observation time of the preceding EIT image used for detection where the second image is input as a reference to obtain the difference image.
-
•
eit_fl_location is the value of flare locations in Heliographic Stonyhurst (HGS) coordinates where north and west is positive while south and east is negative. The number of decimal places here is limited to two values.
-
•
goes_class represents the classification of the flare magnitude according to GOES standards.
-
•
noaa_active_region is a number assigned to the flaring region by the NOAA group available in the GOES catalog. Here, N/A refers to not available AR numbers in the GOES catalog.
The dataset consists of a ’Remarks’ column specifying whether the flare is verified or not. If not verified, then the co-occurring events or those with unavailable GOES location are specified correspondingly to maintain distinction. For such events, the GOES classification column in the EIT catalog retains the original values of that flare from the GOES catalog.
I
| Index | start_time_detection | end_time_detection | eit_fl_location | goes_class | noaa_active_region |
|---|---|---|---|---|---|
| (hgc degrees) | |||||
| 1 | 1997-11-04T05:41 | 1997-11-04T05:58 | (30.50,-17.96) | X2.1 | 8100 |
| 2 | 1997-11-6T11:41 | 1997-11-06T12:01 | (61.00,-19.57) | X9.4 | 8100 |
| 3 | 1997-11-27T13:12 | 1997-11-27T13:38 | (-62.77,15.29) | X2.6 | 8113 |
| 4 | 1998-04-23T05:35 | 1998-04-23T05:51 | (70.66,19.47) | X1.2 | N/A |
| 5 | 1998-04-27T09:21 | 1998-04-27T09:36 | (-53.24,-16.70) | X1.0 | 8210 |
| 6 | 1998-05-02T13:21 | 1998-05-02T13:42 | (9.55,-15.04) | X1.1 | 8210 |
| 7 | 1998-05-06T08:10 | 1998-05-06T08:23 | (65.46,-15.81) | X2.7 | N/A |
| 8 | 1998-11-22T06:29 | 1998-11-22T06:44 | (55.16,-27.63) | X3.7 | N/A |
| 9 | 1998-11-22T16:09 | 1998-11-22T16:23 | (65.30,-27.97) | X2.5 | N/A |
| 10 | 1998-11-23T06:29 | 1998-11-23T06:44 | (69.10,-28.12) | X2.2 | 8384 |
| 11 | 1998-11-24T02:12 | 1998-11-24T02:24 | (78.82,-29.50) | X1.0 | N/A |
| 12 | 1998-11-28T05:12 | 1998-11-28T05:48 | (-53.08,20.03) | X3.3 | N/A |
| 13 | 1999-08-02T21:24 | 1999-08-02T21:36 | (46.53,-17.45) | X1.4 | 8647 |
| 14 | 1999-08-28T18:00 | 1999-08-28T18:12 | (13.93,-29.55) | X1.1 | 8674 |
| 15 | 1999-11-27T12:00 | 1999-11-27T12:12 | (62.70,-14.99) | X1.4 | 8771 |


3.1.1 Statistics
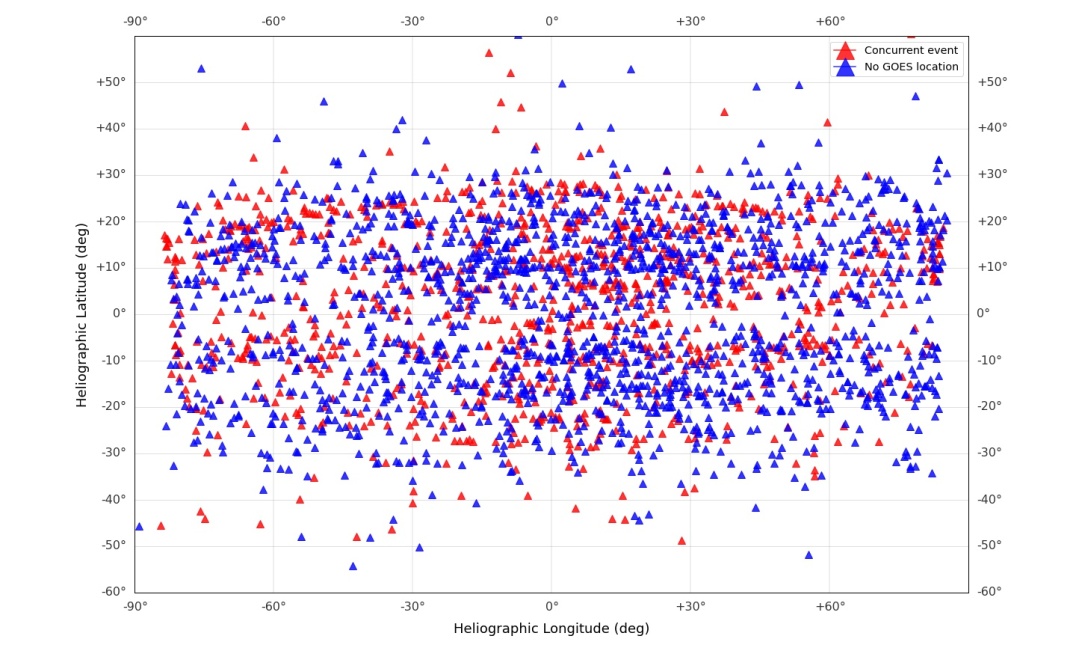
Figure 2 shows a bar plot of the EIT flares from Jan 1997 to Aug 2010. Overall, we have obtained 4602 flares from the EIT data. In terms of numbers, 1881 flares are matching spatially and temporally with GOES flares, which is considered verified, while 1083 EIT flares match temporally. However, 1638 flares do not have a corresponding GOES location. Figure 3 shows a comparison between the number of flares in the GOES catalog for GOES class C1.0 with and without coordinate values, respectively. The number of flares with no locations in the GOES catalog dominates for all the years except 2003. This gap greatly influences the verification process as a result, and the ratio of verified to non-verified EIT flares is sharply reduced. However, the overall ratio is similar between the verified EIT flares and the GOES flares with a location. It remains between 20% to 40% from 1997 to 2003, while it is 40% from 2004 to 2006 and 2010. The ratio falls below 20% for 2008 and 2009. Figure 4 compares the total number of GOES and EIT flares for our analysis. Figures 5 and 6 show scatter plots of all the verified and non-verified EIT flares, respectively, based on the GOES classes. Figure 5 shows scatter plot of all the verified flares in accordance to the GOES classes. The two sub-types of non verified flares are shown in Figure 6 but are not represented based on flare intensities as they cannot be confirmed. Also seen are some of the flares occurring near-limb.
| Source | Period | C-Class | M-Class | X-Class |
|---|---|---|---|---|
| SOHO/EIT | 1997-01-01 to 2010-06-30 | 1182 | 647 | 52 |
| SDO/AIA (Angryk et al., 2020b) | 2010-05-01 to 2018-09-01 | 6319 | 694 | 50 |
Statistical analysis shows that 41 of the EIT flares are verified with the GOES catalog while 35.5 of the EIT flares do not have a corresponding GOES location. The remaining 23.5 of the EIT flares do not match spatially with GOES. Our statistics show satisfactory results despite many challenges, as stated earlier. We present a summary of our verified EIT flare findings in Table 2 along with the SDO data from Angryk et al. (2020b).
4 Conclusions
The SOHO/EIT flare catalog for 195 Å is developed for predictive and exploratory analytics using ML in flare prediction and to the scientific community for investigation of flares during the Solar Cycle 23. This catalog primarily serves to verify the locations of flares reported in the GOES catalog as a first step to generate a benchmark dataset used for flare prediction. Here, verification implies the spatiotemporal matching of the flaring events between the GOES and EIT data. However, some events are not verified because (i) the GOES catalog has no report of exclusive coordinate locations for many flares in order to cross-check and (ii) multiple events are detected in the EIT images. Altogether, we identified 4602 events from the EIT images between January 1997 and July 2010, out of which 1881 flares overlap with the GOES catalog in temporal and spatial coordinates. The SOHO/EIT Flare Catalog will be publicly available on Harvard dataverse for the solar physics community in https://doi.org/10.7910/DVN/C9H34R. We appreciate any suggestions concerning the catalog.
As far as the combining of EIT and GOES data is concerned, our foremost goal is to link the GOES flares with the correct magnetogram locations. So, the preflare magnetogram data can be used for testing flare prediction algorithms. Furthermore, it has become clear that there may be signs in preflare EUV emission predicting an upcoming flare. We can now verify those signatures from a large database of the EIT and Atmospheric Imaging Assembly (AIA) observed flares.
References
- Angryk et al. (2020a) Angryk, R., Aydin, B., Kempton, D., et al. 2020a, Multivariate Time Series Dataset for Space Weather Data Analytics, DRAFT VERSION, Harvard Dataverse, doi: 10.7910/DVN/EBCFKM
- Angryk et al. (2020b) Angryk, R. A., Martens, P. C., Aydin, B., et al. 2020b, Nature:Scientific Data. http://dmlab.cs.gsu.edu/wp-content/uploads/mvts4swa.pdf
- Aranda & Caballero (2010) Aranda, M. C., & Caballero, C. 2010, in Computational Intelligence for Knowledge-Based Systems Design, ed. E. Hüllermeier, R. Kruse, & F. Hoffmann (Berlin, Heidelberg: Springer Berlin Heidelberg), 69–78
- Benson (1964) Benson, R. 1964, J. Res. Natl. Bur. Std., 68D, 1123, doi: 10.6028/jres.068D.111
- Bentley (1994) Bentley, R. D. 1994, in Advances in Solar Physics, ed. G. Belvedere, M. Rodonò, & G. M. Simnett (Berlin, Heidelberg: Springer Berlin Heidelberg), 311–314
- Benz (2016) Benz, A. O. 2016, Living Reviews in Solar Physics, 14, 2, doi: 10.1007/s41116-016-0004-3
- Bonte et al. (2013) Bonte, K., Berghmans, D., De Groof, A., Steed, K., & Poedts, S. 2013, Sol. Phys., 286, 185, doi: 10.1007/s11207-012-0165-8
- Bornmann et al. (1996) Bornmann, P. L., Speich, D., Hirman, J., et al. 1996, in Proc. SPIE, Vol. 2812, GOES-8 and Beyond, ed. E. R. Washwell, 309–319, doi: 10.1117/12.254078
- Caballero & Aranda (2014) Caballero, C., & Aranda, M. C. 2014, Sol. Phys., 289, 1643, doi: 10.1007/s11207-013-0415-4
- Dartnell (2011) Dartnell, L. R. 2011, Astrobiology, 11, 551, doi: 10.1089/ast.2010.0528
- Delaboudinière et al. (1995) Delaboudinière, J. P., Artzner, G. E., Brunaud, J., et al. 1995, Sol. Phys., 162, 291, doi: 10.1007/BF00733432
- Desai & Giacalone (2016) Desai, M., & Giacalone, J. 2016, Living Reviews in Solar Physics, 13, 3, doi: 10.1007/s41116-016-0002-5
- ESA (2010) ESA. 2010, A change of pace for EIT, the ground-breaking Sun-watching camera, ESA Science & Technology. https://sci.esa.int/s/8DR1npw
- Feldman et al. (1999) Feldman, U., Laming, J. M., Doschek, G. A., Warren, H. P., & Golub, L. 1999, The Astrophysical Journal, 511, L61, doi: 10.1086/311835
- Fernandez Borda et al. (2002) Fernandez Borda, R. A., Mininni, P. D., Mand rini, C. H., et al. 2002, Sol. Phys., 206, 347, doi: 10.1023/A:1015043621346
- Freeland & Handy (1998) Freeland, S. L., & Handy, B. N. 1998, Sol. Phys., 182, 497, doi: 10.1023/A:1005038224881
- Frissell et al. (2019) Frissell, N. A., Vega, J. S., Markowitz, E., et al. 2019, Space Weather, 17, 118, doi: 10.1029/2018SW002008
- Garcia (1994) Garcia, H. A. 1994, Sol. Phys., 154, 275, doi: 10.1007/BF00681100
- Gopalswamy et al. (2014) Gopalswamy, N., Xie, H., Akiyama, S., Mäkelä, P. A., & Yashiro, S. 2014, Earth, Planets and Space, 66, doi: 10.1186/1880-5981-66-104
- Grigis et al. (2009) Grigis, P. C., Davey, A. R., Martens, P. C., et al. 2009, in AGU Fall Meeting Abstracts, Vol. 2009, SH51B–1277
- Hock (2012) Hock, R. A. 2012, PhD thesis, University of Colorado at Boulder
- Hurford (2003) Hurford, G. J. 2003, in Innovative Telescopes and Instrumentation for Solar Astrophysics, ed. S. L. Keil & S. V. Avakyan, Vol. 4853, International Society for Optics and Photonics (SPIE), 31 – 40, doi: 10.1117/12.460295
- Kahler et al. (2017) Kahler, White, & Ling. 2017, J. Space Weather Space Clim., 7, A27, doi: 10.1051/swsc/2017025
- Kano et al. (2008) Kano, R., Sakao, T., Hara, H., et al. 2008, Sol. Phys., 249, 263, doi: 10.1007/s11207-007-9058-7
- Knipp & Gannon (2019) Knipp, D. J., & Gannon, J. L. 2019, Space Weather, 17, 794, doi: 10.1029/2019SW002254
- Kosugi et al. (2007) Kosugi, T., Matsuzaki, K., Sakao, T., et al. 2007, Solar Physics, 243, 3, doi: 10.1007/s11207-007-9014-6
- Kouloumvakos et al. (2015) Kouloumvakos, A., Nindos, A., Valtonen, E., et al. 2015, A&A, 580, A80, doi: 10.1051/0004-6361/201424397
- Kraaikamp & Verbeeck (2015) Kraaikamp , & Verbeeck. 2015, J. Space Weather Space Clim., 5, A18, doi: 10.1051/swsc/2015019
- Lemen et al. (2012) Lemen, J. R., Title, A. M., Akin, D. J., et al. 2012, Solar Physics, 275, 17, doi: 10.1007/s11207-011-9776-8
- McNamara (1979) McNamara, L. F. 1979, Radio Science, 14, 1165, doi: 10.1029/RS014i006p01165
- Melott & Thomas (2011) Melott, A. L., & Thomas, B. C. 2011, Astrobiology, 11, 343, doi: 10.1089/ast.2010.0603
- Milligan & Ireland (2018) Milligan, R. O., & Ireland, J. 2018, Sol. Phys., 293, 18, doi: 10.1007/s11207-017-1233-x
- Park et al. (2018) Park, S.-H., Guerra, J. A., Gallagher, P. T., Georgoulis, M. K., & Bloomfield, D. S. 2018, Solar Physics, 293, doi: 10.1007/s11207-018-1336-z
- Pevtsov (2016) Pevtsov, A. A. 2016, Space weather research and forecast in USA. https://arxiv.org/abs/1611.02652
- Qu et al. (2003) Qu, M., Shih, F. Y., Jing, J., & Wang, H. 2003, Sol. Phys., 217, 157, doi: 10.1023/A:1027388729489
- Sadykov et al. (2017) Sadykov, V. M., Kosovichev, A. G., Oria, V., & Nita, G. M. 2017, The Astrophysical Journal Supplement Series, 231, 6, doi: 10.3847/1538-4365/aa79a9
- Sato et al. (2006) Sato, J., Matsumoto, Y., Yoshimura, K., et al. 2006, Sol. Phys., 236, 351, doi: 10.1007/s11207-006-1831-5
- Watanabe et al. (2012) Watanabe, K., Masuda, S., & Segawa, T. 2012, Sol. Phys., 279, 317, doi: 10.1007/s11207-012-9983-y