Percolation framework reveals limits of privacy in Conspiracy, Dark Web, and Blockchain networks
Abstract
We consider the privacy of interactions between individuals in a network. For many networks, while nodes are anonymous to outside observers, the existence of a link between individuals implies the possibility of one node revealing identifying information about its neighbor. Moreover, while the identities of the accounts are likely hidden to an observer, the network of interaction between two anonymous accounts is often available. For example, in blockchain cryptocurrencies, transactions between two anonymous accounts are published openly. Here we consider what happens if one (or more) parties in such a network are deanonymized by an outside identity. These compromised individuals could leak information about others with whom they interacted, which could then cascade to more and more nodes’ information being revealed. We use a percolation framework to analyze the scenario outlined above and show for different likelihoods of individuals possessing information on their counter-parties, the fraction of accounts that can be identified and the idealized minimum number of steps from a deanonymized node to an anonymous node (a measure of the effort required to deanonymize that individual). We further develop a greedy algorithm to estimate the actual number of steps that will be needed to identify a particular node based on the noisy information available to the attacker. We apply our framework to three real-world networks: (1) a blockchain transaction network, (2) a network of interactions on the dark web, and (3) a political conspiracy network. We find that in all three networks, beginning from one compromised individual, it is possible to deanonymize a significant fraction of the network (%) within less than 5 steps. Overall these results provide guidelines for investigators seeking to identify actors in anonymous networks, as well as for users seeking to maintain their privacy.
The rise of privacy concerns in modern society has led to an increased interest in possible methods for individuals to interact while preserving their anonymity Gross and Acquisti (2005); Garcia (2017); Bagrow et al. (2019); Reid and Harrigan (2013); Lazer et al. (2009); Song et al. (2010); Onnela et al. (2007). These individual interactions form a network between different parties and in many cases, while the anonymity and privacy of an individual node is preserved, the global structure of the network may be visible to others Zheleva and Getoor (2009). Often times the very act of interacting via a network link will involve the two individuals at the ends of the link exchanging information that allows them to identify one another Xu and Chen (2004). Thus, if one individual is identified, it may (with some probability) be possible to obtain information on some of her connections in the network Barucca et al. (2018).
For example, if a physical item is purchased via an anonymous transaction network e.g., Blockchain cryptocurrencies Pappalardo et al. (2018), then the buyer must provide a shipping address to receive the item and thus reveals some aspect of their location. Likewise, if two individuals communicate via phone, then it is likely that they possess some knowledge of the person on the other end of the call. Finally, in the case of online interactions, if user A’s computer is hacked then A’s identity will become known to the hacker. The hacker could then search for additional information on A’s computer e.g., email correspondence or private messages through online forums, to learn the identities of other individuals who interacted with A. After doing so, the hacker could then attempt to hack into these individuals computers (e.g., via a Trojan horse email) and with some probability, successfully traverse the network. The very fact that A was hacked could also be useful in hacking the neighbors of A as individuals are more likely to trust emails (that might contain a hidden Trojan) from known sources Moody et al. (2017). Similarly, in the context of criminal, terrorist or conspiracy networks, if a set of individuals interact via anonymous communications if one member of the group is identified, they could potentially be monitored or interrogated leading to the revelation of information on other individuals, who could then also be monitored to identify other members of the network, and so on. Specific examples would include users of burner phones who do not provide their names, but whose calls can be tracked; anonymous email accounts where a name is not provided, but a user’s messages may be saved by the email provider; Telegram Messenger, where anonymous users may interact in public groups; and other criminal or conspiracy networks.
Here we show that the question of anonymity between network actors, and the corresponding ability of a party seeking to deanonymize the individuals based on information from their neighbors, can be solved using tools and methods of percolation from statistical physics Newman (2010); Cohen and Havlin (2010); Castellano et al. (2009); Barabási et al. (2016). Furthermore, we demonstrate that classical quantities from statistical physics have important meanings and provide crucial information on the scope to which anonymity can be maintained among individuals in real hidden networks.
We focus on three example networks: (1) transactions through blockchain-based cryptocurrencies Chen et al. (2018), (2) interactions related to illegal activities via the dark web da Cunha et al. (2020), and (3) a political conspiracy network Ribeiro et al. (2018). In all three of these networks, the question of anonymity is very important- as cryptocurrencies and the dark-web are often used by criminal organizations, Ron and Shamir (2013); Ober et al. (2013); Meiklejohn et al. (2013); De Domenico and Arenas (2017) whereas conspirators depend on not being uncovered in order to avoid criticism and possible criminal charges.
While some approaches have considered deanonymizing the individuals behind nodes in a network Ron and Shamir (2013), these have typically related to specific encrypted protocols and users have found ways to overcome these issues. In contrast, our approach is fundamental to the nature of privacy when interacting in a network i.e., when interacting with another party, a user often must reveal some identifying information. Using our general framework demonstrated in Fig 1 and based on the topologies of three real hidden networks, we are able to quantify the extent to which this information can be exploited and thus reveal how individuals can be unwittingly identified by their neighbors who failed to remain anonymous.
I Results
As explained above, we seek to understand how investigators could leverage information exchanged between interacting parties in order to identify them. Nonetheless, in some cases, an individual may not have any identifiable information about the party at the other end of the transaction. In this sense, one could consider such a link ‘failed’ in the sense that no deanonymization can be carried out via that link. Thus, the fraction of links exchanging identifying information can be mapped to the link-occupation probability from percolation, such that fraction of links exchanged identifying information. Traditionally, in percolation frameworks the key quantity of interest is then the fractional size of the giant connected component . In the context of anonymity, if a single node in the giant component is deanonymized, then the entire giant component could be discovered (within some time) via individuals revealing information about their neighbors.
Similarly, for the other components, we can state that each component is a set of nodes where if any one of these is deanonymized, then the rest of the set could also be identified. Therefore the total number of components, , represents the minimal number of source nodes (in distinct components) that need to be identified independently in order to deanonymize the entire network. Similarly if one has a set of source nodes each in a different component, then the total number of nodes that can be identified is the sum of the sizes of all of those separate components , where is the total number of nodes that can be identified (see SI- Distribution of Component Sizes).
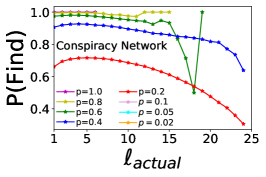
Also of significant importance for privacy is the actual number of interrogations that an investigator must carry out in order to deanonymize a specific target node, given that the investigators know the identity of some given source nodes. For example, perhaps investigators identify one dark web user posting large amounts of child pornography or a specific account participating in suspicious transactions on the Blockchain. The investigators could begin by seeking information from their source individual on her neighbors and then move on to the neighbors’ neighbors and so on, until reaching the desired node of interest. This minimum number of individuals that must be identified to reach the desired node is the shortest path length, , from the source node/s to the target node and it represents a measure of effort the investigators must expend since each individual that must be identified along the path will require dedication of resources.. Lastly, we propose a new measure related to the fact that while the investigators presumably know that some individuals will not have identifying information on all of their neighbors, they do not know in advance which links will be helpful. Therefore, we propose a greedy algorithm, described later, where the investigators first interrogate the nodes along the initial shortest path from their source node/s to the target and then update to a new path if the investigation reaches a dead end; i.e. a link where the node on the other end cannot be identified. We define the number of steps along the path using our greedy algorithm as as it approximates what could be taken as a possible ‘actual’ number of steps needed to reach a specific node given that investigators do not know which links are useful. These and other relevant measures from percolation theory are described in Table 1.
| Parameter | Percolation Theory Definition | Interpretation |
|---|---|---|
| Fraction of occupied links | Fraction of links where nodes can identify one another | |
| Giant connected component (GCC) | Largest group of mutually vulnerable nodes | |
| Second largest connected component | Second largest group of mutually vulnerable nodes | |
| Number of Components | Min. num. of source nodes to identify whole network | |
| Shortest Path Length | Optimal number of interrogations | |
| Greedy Algorithm Path Length | Realistic number of interrogations |
We apply the framework described above to three publicly available hidden networks: (i) the flow of funds within the Ethereum blockchain-based cryptocurrency Chen et al. (2018), which is the second largest cryptocurrency by market cap; (ii) A forum of users participating in sharing of child pornography on the dark web da Cunha et al. (2020); and (iii) A network of political conspirators in Brazil Ribeiro et al. (2018). Summary statistics on these datasets are available in Table 2.
| Metric/Network | Blockchain | Dark Web | Conspiracy |
| N | 2,291,941 | 10,407 | 404 |
| V | 5,262,468 | 820,272 | 3350 |
| 2.8 | 150 | 9.7 | |
| 0.21 | 0.83 | 0.85 | |
| 2.15 | 2.98 | ||
| Density | 0.0076 | 0.022 |
∗ Median is listed rather than mean due to long tail.
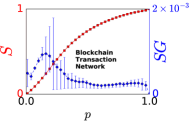
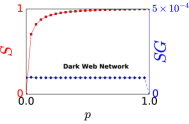
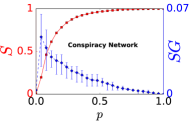
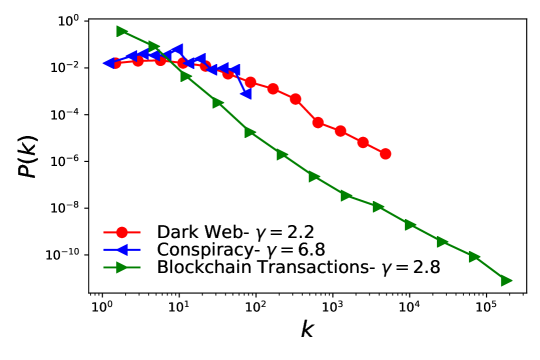
Using our percolation approach we analyze the sizes of the largest component in our three real-world networks. This corresponds to the mean number of accounts that can be deanonymized after a single source node is identified. In Fig 2, we show the fractional size of the giant connected component, , and the second largest connected component, , for each of our networks. We see that the second largest component is typically quite small (0.07 at max for the Conspiracy network) in comparison to the largest component whereas typically constitutes a large fraction of the network. Also we can see that as the probability of deanonymize , increases the giant component increases and the second giant component passes through a peak. The fact that only near does is typical of networks with long-tail degree distributions, which is true for our 3 networks here (See Fig. A.1).
Overall, these results imply that the key deanonymization efforts should focus on the giant component, and suggest that our approach is highly feasible in terms of deanonymizing a large fraction of accounts since only a single source node is needed, and then all the nodes in are potentially identifiable.
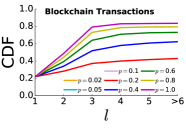
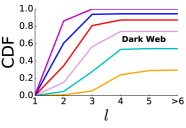
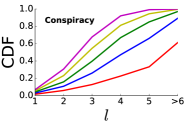
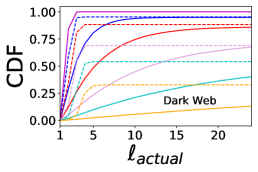
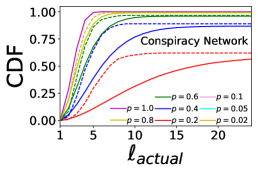
Aside from the possibility of identifying individuals, there is also a question of the amount of resources that must be dedicated in order to do so. Therefore an important aspect of our proposed method is the minimum number of other intermediate individuals that the investigators must identify on the way towards identifying a specific target node. Each identified individual requires considerable effort such as surveillance, hacking efforts, interrogations, etc. This number of intermediate steps will inherently depend on the initial source node where the investigators begin their search and on the topology of the network. In terms of percolation theory quantities, it is related to the shortest path length from the source node to a given target node. To capture an overall picture of the necessary effort, in Fig. 3 we show the cumulative distribution (CDF) of the fraction of nodes that can be found within steps for different values of , and for each of the three networks that are analyzed. We note that for the Dark Web network we explore several very small values of because interactions on a forum in the Dark Web are less likely to involve individuals having information on one another than in the case of transferring money or cooperating in a conspiracy. The CDF essentially demonstrates for any possible source and target node the range of possible levels of effort needed.
We note that in the case of the Blockchain Transaction Network, rather than considering shortest paths between all pairs of nodes, we begin with a set of known nodes that are so-called ‘exchanges,’ which convert between cryptocurrency and fiat currency. This choice was made because exchanges inherently know the identities of their neighbors due to legal policies they have in place to prevent money laundering Sapovadia (2015). Moreover, exchanges are the hubs of the Blockchain Transaction Network Chen et al. (2018) and thus serve as most likely initial targets for investigators (for more on this choice, see SI). In contrast, for the Dark Web Network and the Conspiracy Network, there is no initial reason to suspect that any particular node is more likely to serve as an initial source. We see that in all three of our networks the optimal shortest paths are typically within or steps, meaning that the network can be considered a ‘small-world’ Amaral et al. (2000) with most nodes being within an identification range of a fairly small number of interrogations.
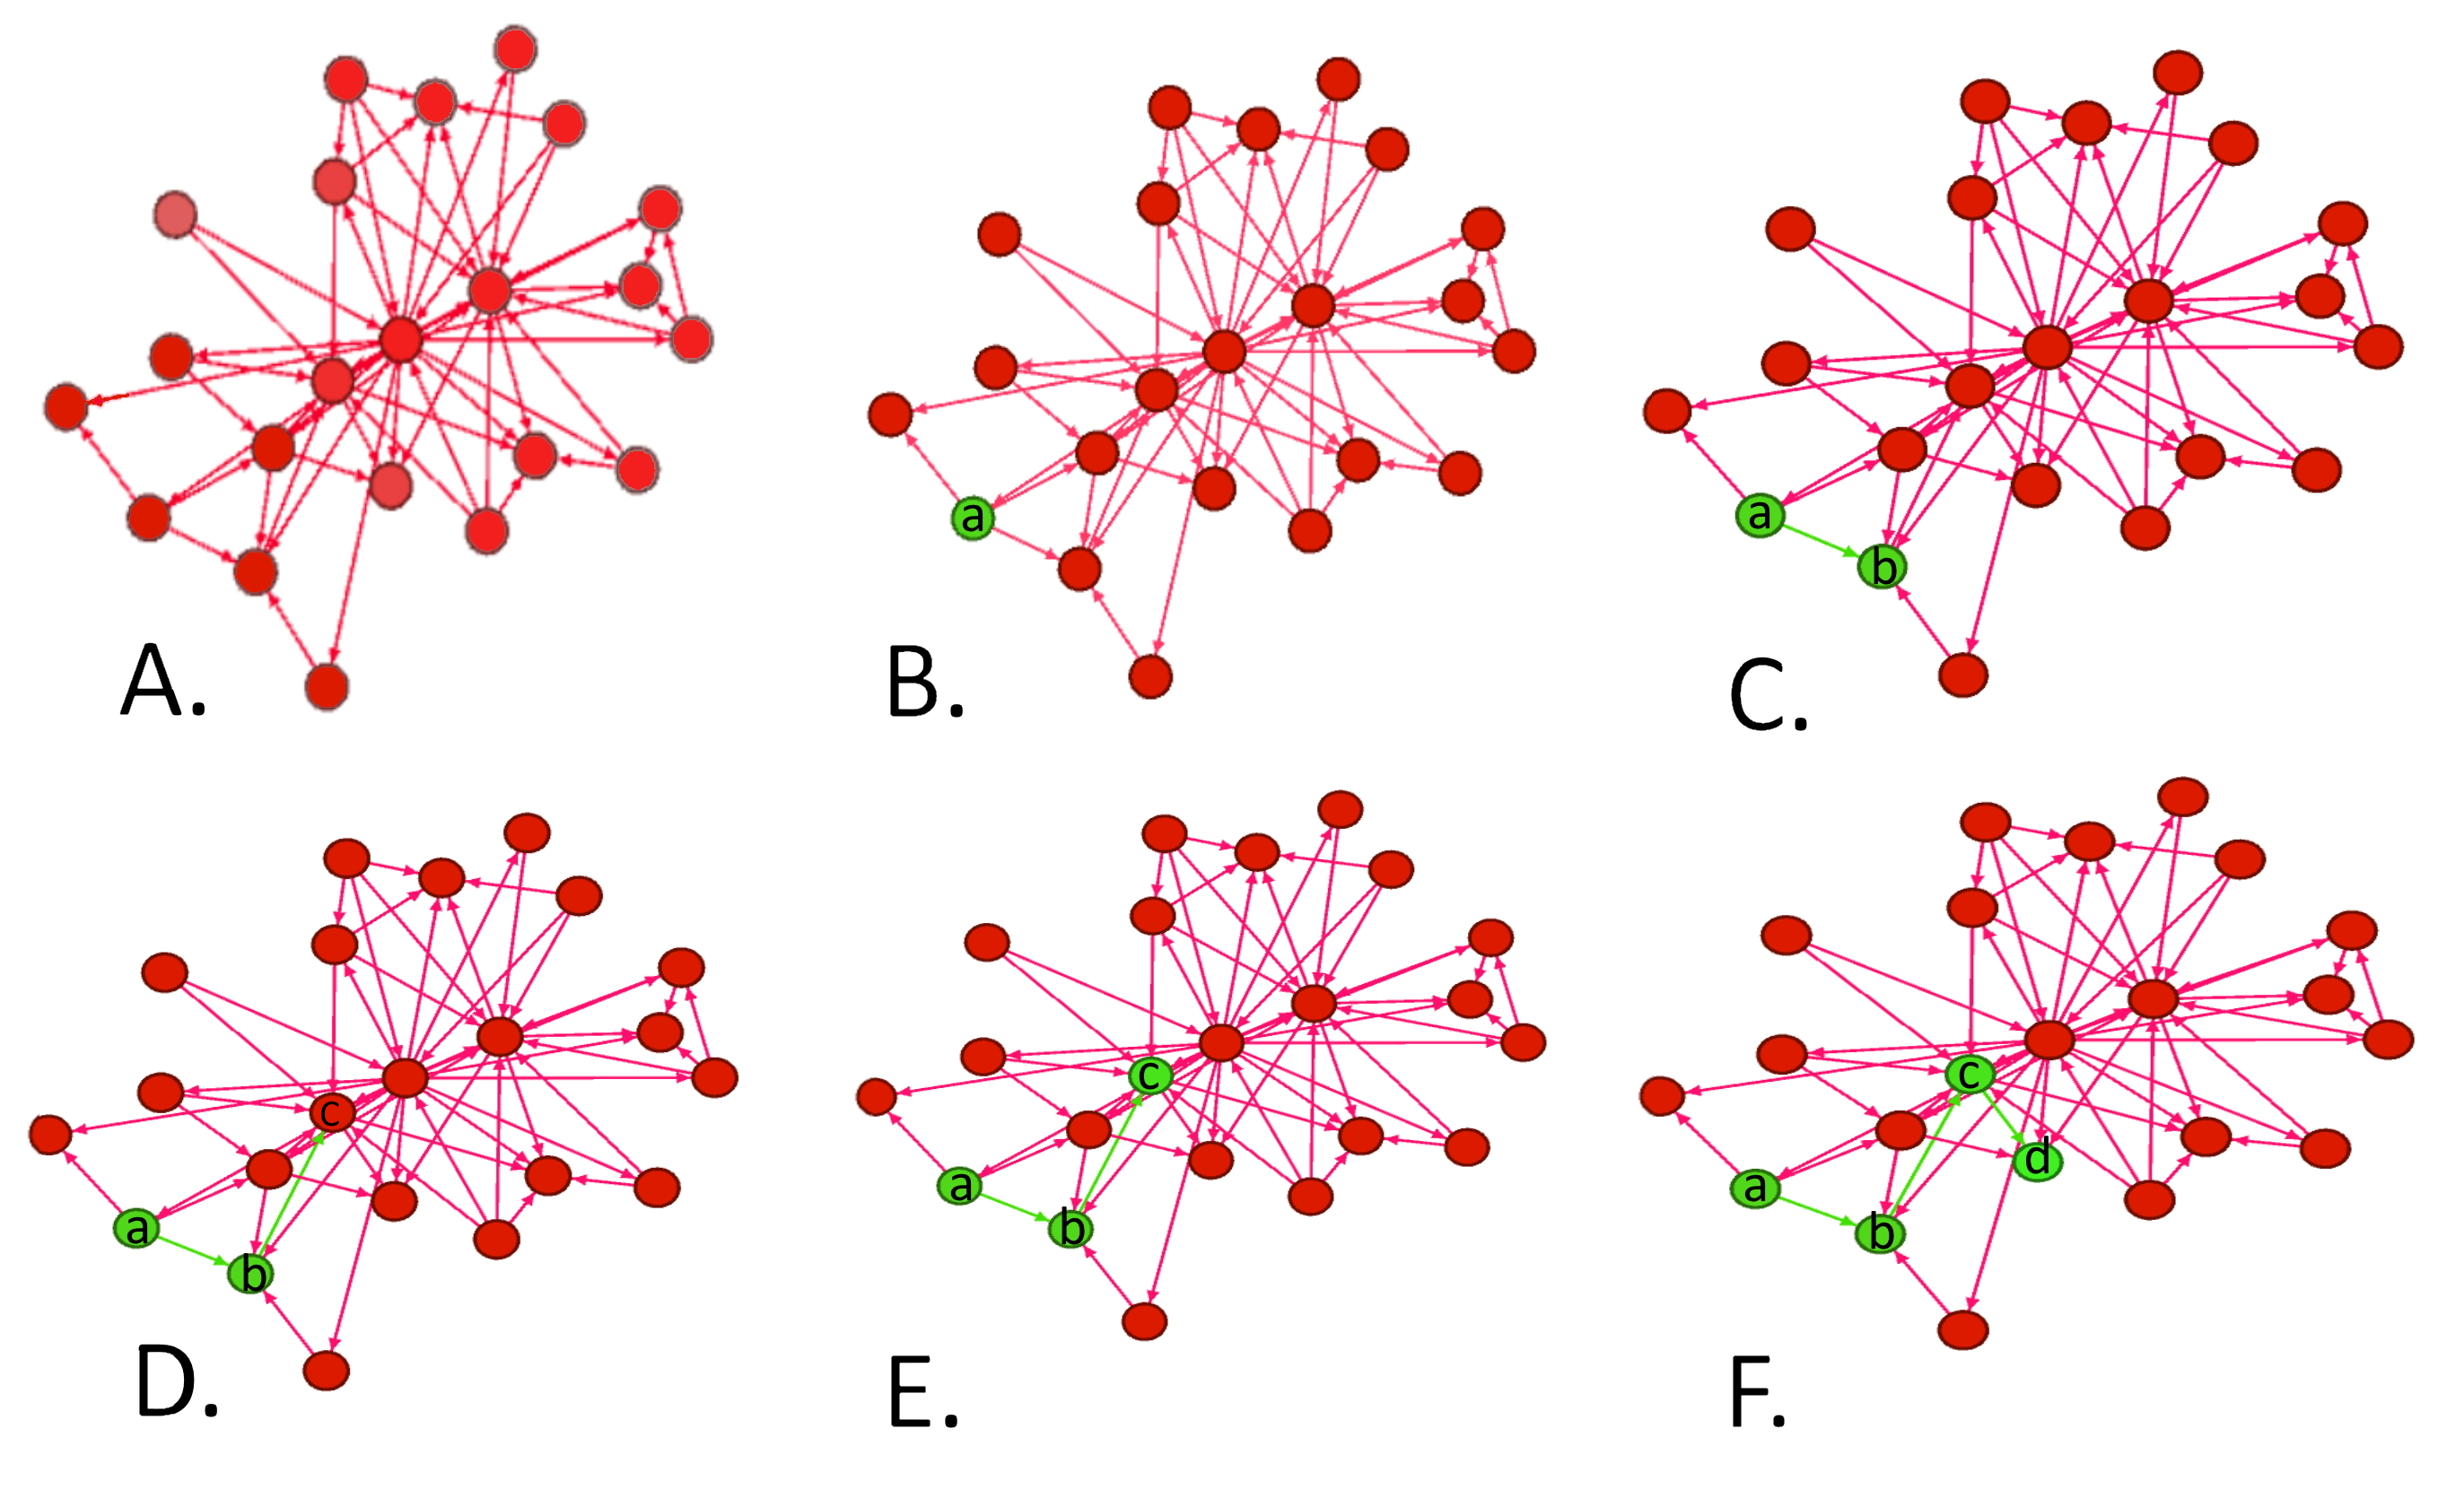
However, the shortest path length is only the minimal number of interrogations an investigator would need if they had perfect knowledge in advance about which interactions involved identifiable information. On a practical level, the investigator will be confronted with the ‘noise’ of links that occurred between individuals but did not involve identifying information. Therefore, we propose a naive greedy algorithm (Algorithm 1) that investigators could use in order to carry out their investigation. Essentially, our greedy algorithm calculates the shortest path between the source node/s and the target. The investigators then interrogate the nodes along the shortest path until they hit a dead end i.e., reach a node that cannot communicate identifying information about the desired neighbor. They then remove that link from the network, calculate the new shortest path to the target node in the modified network, and attempt to traverse the new shortest path. This process can be done iteratively until the target node is reached or until it is known that no other possible paths exist. We note that this algorithm is not necessarily optimal, but on the contrary, provides a simplistic upper bound on the effort needed.
Given graph , set of source nodes , target node .
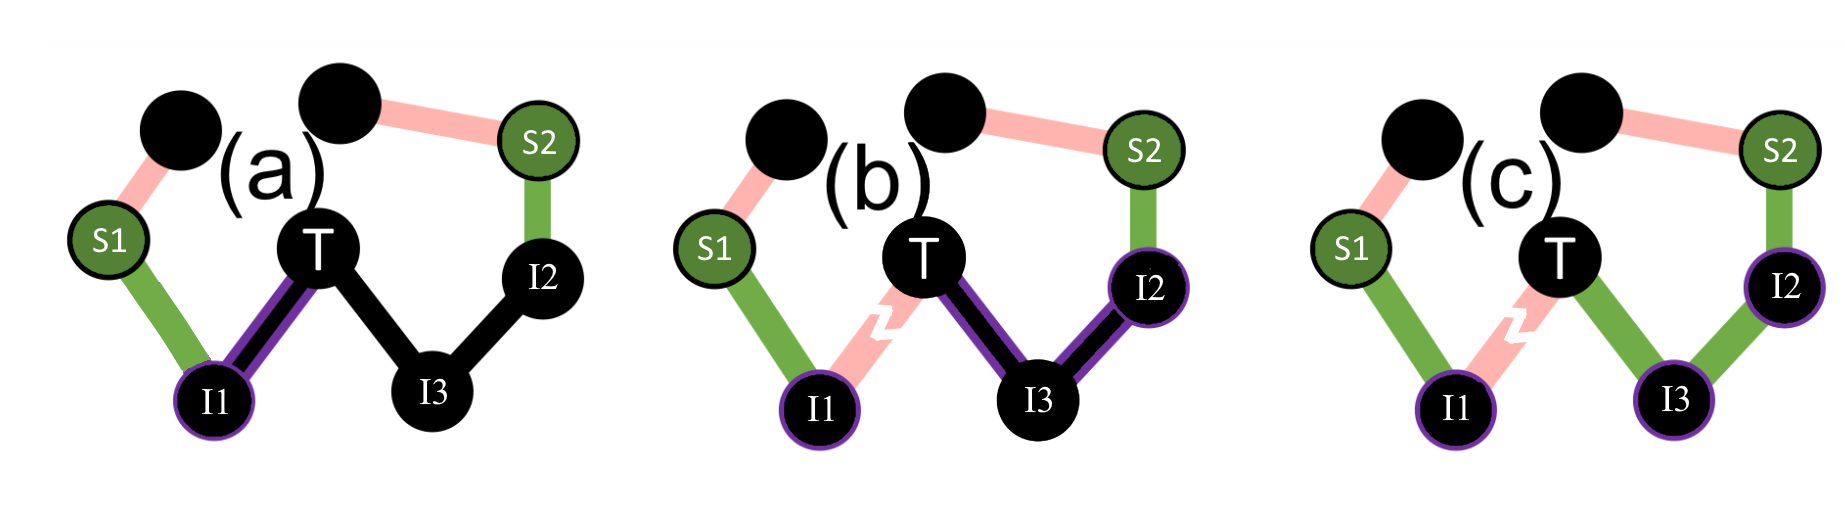
In Algorithm 1 we formally present our greedy algorithm and in Fig. 4 we demonstrate the process of our algorithm visually. If all of the links on the original shortest path are indeed identifiable then our algorithm will lead to the minimal number of interrogations. In contrast, if we hit dead ends along the paths we pursue, then our algorithm will lead to a greater number of interrogations than optimal.
We next apply our greedy algorithm to our three datasets. As before, for the Blockchain Transaction Network, we consider all of the exchange nodes as our source nodes (with all of their links known), whereas for the Dark Web Network and Conspiracy Network we choose source nodes randomly (and do not assume them to necessarily have any prior knowledge of all neighbors). We then choose 100 random target nodes and assess how many actual steps are required to reach them for different values of . In order to understand the network effects, we focus on identifying nodes that are at least steps away from a source node.
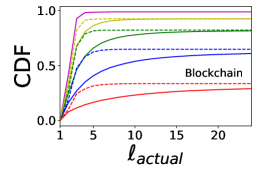
In Fig. 5 we show the CDF of how many nodes are reached within steps using our greedy algorithm and compare it to the number of nodes reached if the actual shortest path, were known. We find that the investigators’ lack of knowledge about which links involve exchange of identifiable information is a significant detriment to their ability to optimally traverse the network for low values of . For higher levels of , the detriment is less pronounced as most of the links will actually involve identifiable information and thus attempting to traverse the shortest path will often succeed.
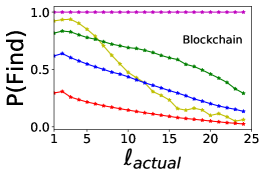
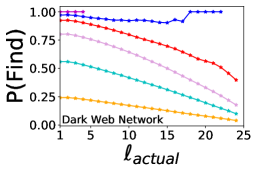
This detriment is further observed when we consider an investigators likelihood of success from continuing to investigate additional individuals. In other words, given that an investigator has investigated individuals, what is the likelihood that continuing to investigate the st individual (and so on if necessary) will lead to identifying the desired target? In Fig. 6 we show this likelihood for differing levels of . We see that for the Blockchain network, until investigations, the likelihood of continuing to investigate is worthwhile, while after that, the probability of ultimate success decreases. Also, it is worth noting that for , the success rate actually drops faster than for lower . This is because for higher , more individuals will be identified thus leading investigators to believe that they still may succeed, while for lower they will more quickly determine that the target is not identifiable (that is, the target is outside the giant component). For the other networks, we see that the value in continuing to investigate depends on , as for high , the likelihood of success continues to be significant, while for lower it drops fairly quickly.
We note that our greedy algorithm does not use any metadata that may be associated with the links, which could improve an investigators ability to guess which links involved exchange of identifiable information. For example, one could look at the frequency that the different links appear e.g. how often transactions are made or how often two individuals communicate, and thus improve the success rate. Incorporating such information into a scoring system for the links could lead to improved values of .
II Discussion
We have demonstrated the fundamental mapping between percolation and privacy. Our framework can be used to understand networks where the actors (nodes) interact anonymously. Nonetheless, within the links (or at least within some of them) there often exists exchange of information that could allow for deanonmyization. This naturally leads to our percolation mapping with corresponding interpretations for the size of the giant component, number of components, and shortest path lengths. We observed an existence of hubs in all three of our networks, which is a topological structure that is common in many networks. Importantly, we note that the existence of hubs exacerbates privacy issues as hubs can be potentially identified via their many spokes and then can reveal information on the remainder of the network. This is particularly true in the case of the Blockchain Transaction network where the hubs are exchanges which are known to collect information on their neighbors.
We further developed a greedy algorithm to account for the fact that the shortest path is not easily discovered and pursuing what appears to be the shortest path can often lead to a dead end. Thus, our greedy algorithm demonstrates the feasibility of actually effort that is required for discovering the identity of a chosen target node. Overall, our results provide a framework for investigators to approach deanonymization and consider their likelihood of success and required effort in order to deanonymize a particular node in the network or a given desired fraction of the entire hidden network.
III Acknowledgement
This work was supported by the BIU Center for Research in Applied Cryptography and Cyber Security in conjunction with the Israel National Cyber Directorate in the Prime Minister’s Office and also the Ariel Cyber Innovation Center in conjunction with the Israel National Cyber directorate in the Prime Minister’s Office.
References
- Gross and Acquisti [2005] Ralph Gross and Alessandro Acquisti. Information revelation and privacy in online social networks. In Proceedings of the 2005 ACM workshop on Privacy in the electronic society, pages 71–80, 2005.
- Garcia [2017] David Garcia. Leaking privacy and shadow profiles in online social networks. Science advances, 3(8):e1701172, 2017.
- Bagrow et al. [2019] James P Bagrow, Xipei Liu, and Lewis Mitchell. Information flow reveals prediction limits in online social activity. Nature human behaviour, 3(2):122, 2019.
- Reid and Harrigan [2013] Fergal Reid and Martin Harrigan. An analysis of anonymity in the bitcoin system. In Security and privacy in social networks, pages 197–223. Springer, 2013.
- Lazer et al. [2009] David Lazer, Alex Pentland, Lada Adamic, Sinan Aral, Albert-László Barabási, Devon Brewer, Nicholas Christakis, Noshir Contractor, James Fowler, Myron Gutmann, et al. Computational social science. Science, 323(5915):721–723, 2009.
- Song et al. [2010] Chaoming Song, Zehui Qu, Nicholas Blumm, and Albert-László Barabási. Limits of predictability in human mobility. Science, 327(5968):1018–1021, 2010.
- Onnela et al. [2007] J-P Onnela, Jari Saramäki, Jorkki Hyvönen, György Szabó, David Lazer, Kimmo Kaski, János Kertész, and A-L Barabási. Structure and tie strengths in mobile communication networks. Proceedings of the national academy of sciences, 104(18):7332–7336, 2007.
- Zheleva and Getoor [2009] Elena Zheleva and Lise Getoor. To join or not to join: the illusion of privacy in social networks with mixed public and private user profiles. In Proceedings of the 18th international conference on World wide web, pages 531–540. ACM, 2009.
- Xu and Chen [2004] Jennifer J Xu and Hsinchun Chen. Fighting organized crimes: using shortest-path algorithms to identify associations in criminal networks. Decision Support Systems, 38(3):473–487, 2004.
- Barucca et al. [2018] Paolo Barucca, Guido Caldarelli, and Tiziano Squartini. Tackling information asymmetry in networks: a new entropy-based ranking index. Journal of Statistical Physics, 173(3-4):1028–1044, 2018.
- Pappalardo et al. [2018] Giuseppe Pappalardo, Tiziana Di Matteo, Guido Caldarelli, and Tomaso Aste. Blockchain inefficiency in the bitcoin peers network. EPJ Data Science, 7(1):30, 2018.
- Moody et al. [2017] Gregory D Moody, Dennis F Galletta, and Brian Kimball Dunn. Which phish get caught? an exploratory study of individualsśusceptibility to phishing. European Journal of Information Systems, 26(6):564–584, 2017.
- Newman [2010] Mark Newman. Networks: an introduction. Oxford university press, 2010.
- Cohen and Havlin [2010] Reuven Cohen and Shlomo Havlin. Complex networks: structure, robustness and function. Cambridge university press, 2010.
- Castellano et al. [2009] Claudio Castellano, Santo Fortunato, and Vittorio Loreto. Statistical physics of social dynamics. Reviews of modern physics, 81(2):591, 2009.
- Barabási et al. [2016] Albert-László Barabási et al. Network science. Cambridge university press, 2016.
- Chen et al. [2018] Ting Chen, Yuxiao Zhu, Zihao Li, Jiachi Chen, Xiaoqi Li, Xiapu Luo, Xiaodong Lin, and Xiaosong Zhange. Understanding ethereum via graph analysis. In IEEE INFOCOM 2018-IEEE Conference on Computer Communications, pages 1484–1492. IEEE, 2018.
- da Cunha et al. [2020] Bruno Requião da Cunha, Pádraig MacCarron, Jean Fernando Passold, Luiz Walmocyr dos Santos, Kleber A Oliveira, and James P Gleeson. Assessing police topological efficiency in a major sting operation on the dark web. Scientific Reports, 10(1):1–10, 2020.
- Ribeiro et al. [2018] Haroldo V Ribeiro, Luiz GA Alves, Alvaro F Martins, Ervin K Lenzi, and Matjaž Perc. The dynamical structure of political corruption networks. Journal of Complex Networks, 6(6):989–1003, 2018.
- Ron and Shamir [2013] Dorit Ron and Adi Shamir. Quantitative analysis of the full bitcoin transaction graph. In International Conference on Financial Cryptography and Data Security, pages 6–24. Springer, 2013.
- Ober et al. [2013] Micha Ober, Stefan Katzenbeisser, and Kay Hamacher. Structure and anonymity of the bitcoin transaction graph. Future internet, 5(2):237–250, 2013.
- Meiklejohn et al. [2013] Sarah Meiklejohn, Marjori Pomarole, Grant Jordan, Kirill Levchenko, Damon McCoy, Geoffrey M Voelker, and Stefan Savage. A fistful of bitcoins: characterizing payments among men with no names. In Proceedings of the 2013 conference on Internet measurement conference, pages 127–140. ACM, 2013.
- De Domenico and Arenas [2017] Manlio De Domenico and Alex Arenas. Modeling structure and resilience of the dark network. Physical Review E, 95(2):022313, 2017.
- Sapovadia [2015] Vrajlal Sapovadia. Legal issues in cryptocurrency. In Handbook of Digital Currency, pages 253–266. Elsevier, 2015.
- Amaral et al. [2000] Luıs A Nunes Amaral, Antonio Scala, Marc Barthelemy, and H Eugene Stanley. Classes of small-world networks. Proceedings of the national academy of sciences, 97(21):11149–11152, 2000.
IV Supplementary Information
IV.1 Data
We collected our data from 3 public datasets corresponding to the cryptocurrency Ethereum Chen et al. [2018], a network of interactions on the dark web da Cunha et al. [2020], and a political conspiracy network Ribeiro et al. [2018].
For the Ethereum network, we note that we specifically looked at what is referred to as the Money Flow Graph (MFG), which corresponds to the flow of funds through the network. Ethereum due to its design can also have nodes that are not related to the flow of money. We ignore these nodes and interactions between them since if no money is involved it is less likely that the ends of the two nodes will have identifiable information on one another. In the particular case of Ethereum in fact, many of these nodes are presumably ‘functions’ that were written by a single developer but are perhaps used by many others.
We use the Dark Web network as provided by the authors da Cunha et al. [2020].
For the Conspiracy Network Ribeiro et al. [2018], we reduce the initial network to only include the GCC since the provided data involves actors in several conspiracy plots, some of which are not related to one another and thus represent distinct networks.
IV.2 Distribution of Component Sizes
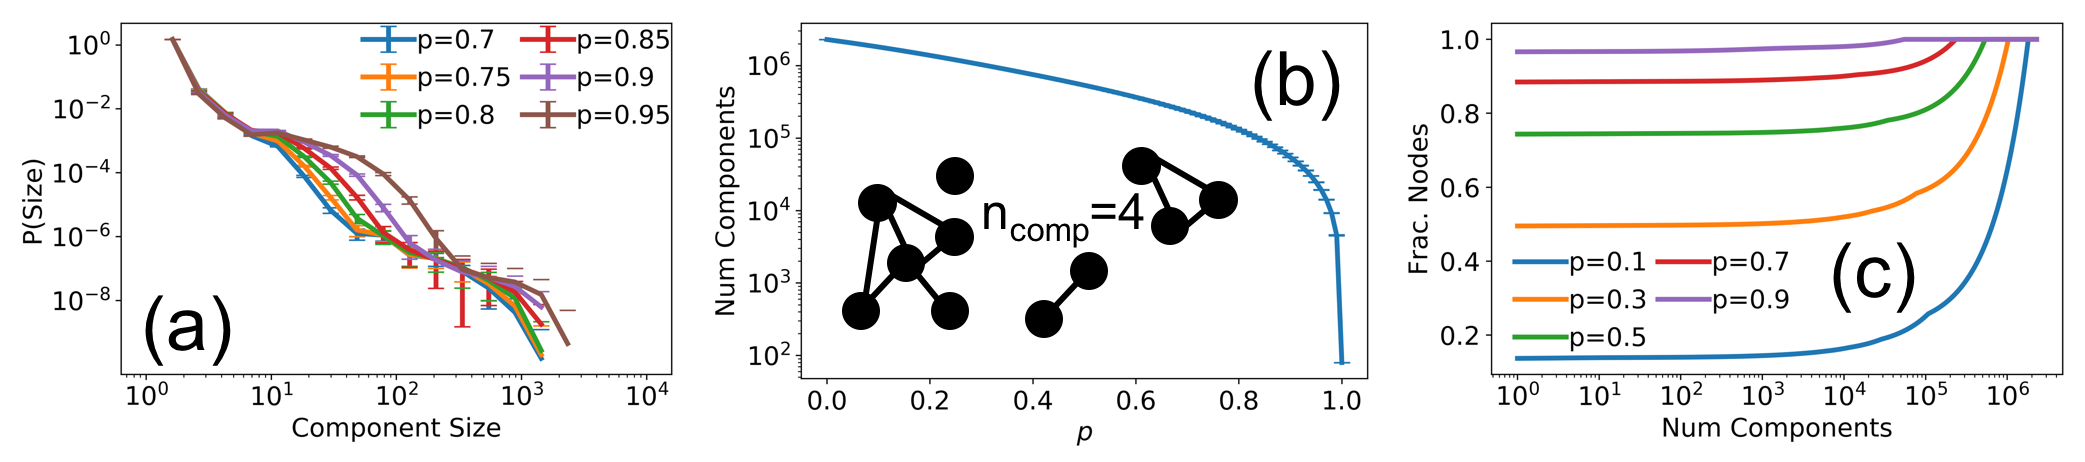
An interesting point mentioned briefly in the main text, is that should a network consist of distinct components, an investigator would simply need a source node in each component in order to traverse the network and identify individuals. The Dark Web Network and Conspiracy Network are too small for us to observe a distribution of component sizes, however for the Blockchain Network, we show in Fig. A.2 several graphs related to component sizes. First we show the distribution of small components (Fig. A.2a), which we see rapidly decreases with very few components above 10 nodes. We also show (Fig. A.2b), the number of components in the network for different values of , which even for low values of , may be many. However, many of these separate components are actually just a single isolated node, so their identification is difficult. To make this point clearer we show in Fig. A.2c the fraction of nodes reached given that a varying number of components are identified. It is noteworthy that adding additional components has a minimal effect beyond the giant component until the number of components essentially covers all of the isolated nodes as well.
IV.3 Exchanges in the Blockchain Network
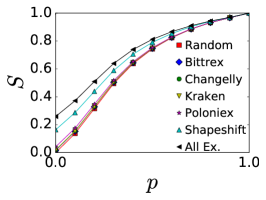
Our results in Fig. 2 suggested that all of our networks contains hubs. However, in the case of blockchain-based cryptocurrencies, these hubs are of a unique nature as prior work has noted that these hubs tend to be ‘exchanges’ where one can convert cryptocurrency into ordinary fiat currencies Chen et al. [2018]. The exchanges have many more transactions than a typical consumer as they essentially serve as gatekeepers for their respective currencies. More importantly, nearly all of these exchanges now have know-your-customer (KYC) policies wherein they require passport information and other identifying information about their consumers Sapovadia [2015]. This means that transactions with an exchange inherently involve sharing identifiable information.
To include the knowledge of exchanges in our percolation framework, we assumed that all exchange links involve identifiable information (due to KYC policies) and then assumed that fraction of the remaining transactions also involve sharing identifiable information. This framework was used throughout the main text when relating to the Blockchain Network.
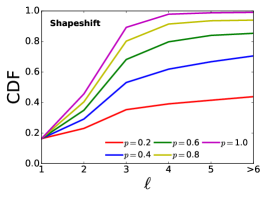
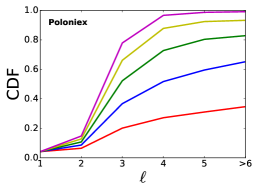
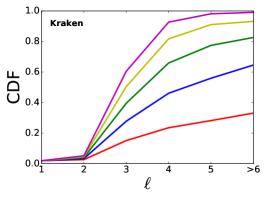
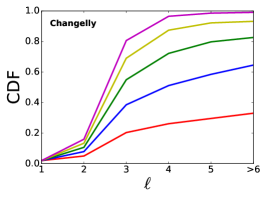
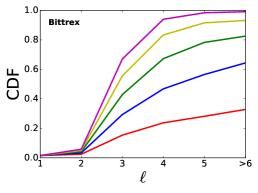
Nonetheless, to expand on the results of the main text, we also include here the case where an investigator obtains information from only one of the exchanges i.e., Bittrex, Changelly, Kraken, Poloniex, or Shapeshift. We show both the sizes of the giant component and the CDF of the path lengths for each individual exchange in Fig. A.3.
We note that for the remaining networks (Dark Web and Conspiracy), we randomly selected a source node and did not assume that it necessarily knew the identities of its neighbors.
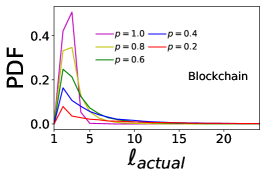
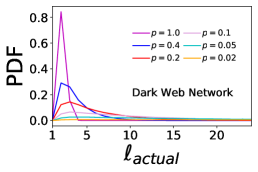
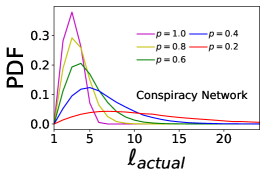
IV.4 Actual Path lengths
Here we present the probability distribution function (PDF) corresponding the CDF shown in Fig. 5.