Detection of two bright radio bursts from magnetar SGR 19352154
1 Abstract
Fast radio bursts (FRBs) are millisecond-duration, bright radio signals (fluence ) emitted from extragalactic sources of unknown physical origin. The recent CHIME/FRB and STARE2 detection of an extremely bright (fluence MJy ms) radio burst from the Galactic magnetar SGR 19352154 supports the hypothesis that (at least some) FRBs are emitted by magnetars at cosmological distances. In follow-up observations totalling 522.7 hrs on source, we detect two bright radio bursts with fluences of and , respectively. Both bursts appear affected by interstellar scattering and we measure significant linear and circular polarisation for the fainter burst. The bursts are separated in time by 1.4 s, suggesting a non-Poissonian, clustered emission process – similar to what has been seen in some repeating FRBs. Together with the burst reported by CHIME/FRB and STARE2, as well as a much fainter burst seen by FAST (fluence 60), our observations demonstrate that SGR 19352154 can produce bursts with apparent energies spanning roughly seven orders of magnitude, and that the burst rate is comparable across this range. This raises the question of whether these four bursts arise from similar physical processes, and whether the FRB population distribution extends to very low energies (erg, isotropic equivalent).
2 Introduction
Many different progenitor and emission models have been proposed to explain the FRB phenomenon1, with one popular class of theories invoking neutron stars with exceptionally strong () magnetic fields, commonly known as magnetars. Until now, the absence of multi-wavelength detections of prompt emission2, 3 as well as the large distances to FRBs (FRB 180916.J0158+65 is the closest known, at 150 Mpc 4) have made it hard to study their broadband emission mechanism and local environments. This limits the avenues to differentiate between competing models. The localisation of very nearby (tens of Mpc) FRBs could help, as would the discovery of an FRB source, at kpc distances, in the Milky Way.
On 2020 April 28 a breakthrough was made when CHIME/FRB Collaboration et al. 5 and Bochenek et al. 6 independently detected an extremely bright radio burst from the Galactic magnetar SGR 19352154, using the Canadian Hydrogen Intensity Mapping Experiment Fast Radio Burst Project (CHIME/FRB 7) and the Survey for Transient Astronomical Radio Emission 2 (STARE2 8), respectively. The reported burst fluence was at 1.4 GHz 6, and the equivalent isotropic energy of the burst was approximately three orders of magnitude greater than any previously observed magnetar radio burst. The specific energy of the burst is similar to, although approximately 30 times less than, the specific energy of the faintest known FRB 6, 4. These detections strongly suggest that at least some FRBs are produced by magnetars. For this reason, this burst has been referred to as FRB 200428 in the literature. While it is not conclusively established that this burst comes from the same physical process(es) as extragalactic FRBs, we will nonetheless use this nomenclature for the rest of this paper.
Temporally coincident with the radio pulse, a bright, hard X-ray burst was detected independently by the Konus-Wind9, INTEGRAL10, AGILE11, and Insight-HXMT12 satellites. SGR 19352154 has been known to undergo periods of X-ray outbursts in 2014, 2015, and 2016, but simultaneous radio observations at these times did not produce any significant detections13. The radio bursts from this most recent outburst are the first to be detected from this source, and the simultaneous radio/X-ray detection is a first for any Galactic magnetar (or FRB source) in general.
A few days after the announcement of FRB 200428, Zhang et al. 14 used the Five-hundred-meter Aperture Spherical radio Telescope (FAST 15) to detect a much fainter (fluence 60), highly linearly polarised burst from SGR 19352154. Its polarisation properties are very similar to FRB 121102 16 and FRB 180916.J0158+65 17.
The detection of more radio bursts from SGR 19352154, and a more detailed characterisation of its activity levels, can help understand whether it is genuinely an FRB source, with similar physical nature to the sources of (repeating) extragalactic FRBs. Given the great brightness of FRB 200428, a coordinated campaign of small radio telescopes (25-m diameter) with large on-sky time (hundreds of hours) can complement deeper, but shorter campaigns using larger radio telescopes. Furthermore, the relatively narrow-band emission seen from some FRBs 18, 19, 20 motivates a coordinated, multi-telescope campaign that spans a wide range of radio frequencies simultaneously.
3 The data
Between 2020 April 29 and 2020 July 27 we observed SGR 19352154 for a total of 763.3 hrs, which corresponds to 522.7 hrs of on-source time, taking overlap between the participating stations into account. The stations involved were the 25-m single dish RT1 at Westerbork in the Netherlands, the 25-m and 20-m telescopes at Onsala Space Observatory (OSO) in Sweden, and the 32-m dish in Toruń, Poland (see Table 1 and Methods for details). All stations operated independently as single dishes, recording 2-bit baseband data (circular polarisations) in VLBI Data Interchange Format (VDIF 21). The data from all four stations were processed and searched for bursts at OSO using a pipeline that was developed to search for FRBs in baseband data. In essence, the pipeline uses standard pulsar software (DSPSR 22) in combination with Heimdall and FETCH23 to create channelised total intensities, search for single pulses, and classify the candidates as radio frequency interference (RFI) or potential real bursts (Methods).
In order to investigate the presence of X-ray bursts from SGR 19352154, we searched the heasarc archive for X-ray observations performed simultaneously with our radio observations. We found relevant overlap with our radio campaign at NICER, Swift, and Fermi (see Methods for details). Finally, we considered the observing schedule and burst list24 from the Hard X-ray Modulation Telescope (HXMT 25).
| Stationa | Bandb | Bandwidth [MHz]c | SEFD [Jy]d | Completeness [Jy ms]e | Time observed [hrs]f |
| Wb | P | 40 | 2100 | 78 | 102.6 |
| Wb | LWb | 100 | 420 | 10 | 278.8 |
| O8 | LO8 | 100, 175, 250 | 350 | 8, 6, 5 | 208.5 |
| Tr | C | 240 | 220 | 3 | 151.0 |
| O6 | X | 500 | 785 | 8 | 22.4 |
| Total telescope time/total time on source [hrs]g | 763.3/522.7 | ||||
| a Wb: Westerbork RT1, O8: Onsala 25m, Tr: Toruń, O6: Onsala 20m. | |||||
| b P: 314–377 MHz; LWb: 1260–1388 MHz; LO8: varying ranges between 1227–1739 MHz, see full details in Table LABEL:tab:observations; | |||||
| C: 4550–4806 MHz; X: 8080–8592 MHz. | |||||
| c Effective bandwidth accounting for RFI and band edges. | |||||
| d From the EVN status page. | |||||
| e Assuming a detection threshold | |||||
| f Please see Fig. 5 and Table LABEL:tab:observations for exact time ranges of the observations. | |||||
| g Total time on source accounts for overlap between the participating stations. | |||||
4 Results
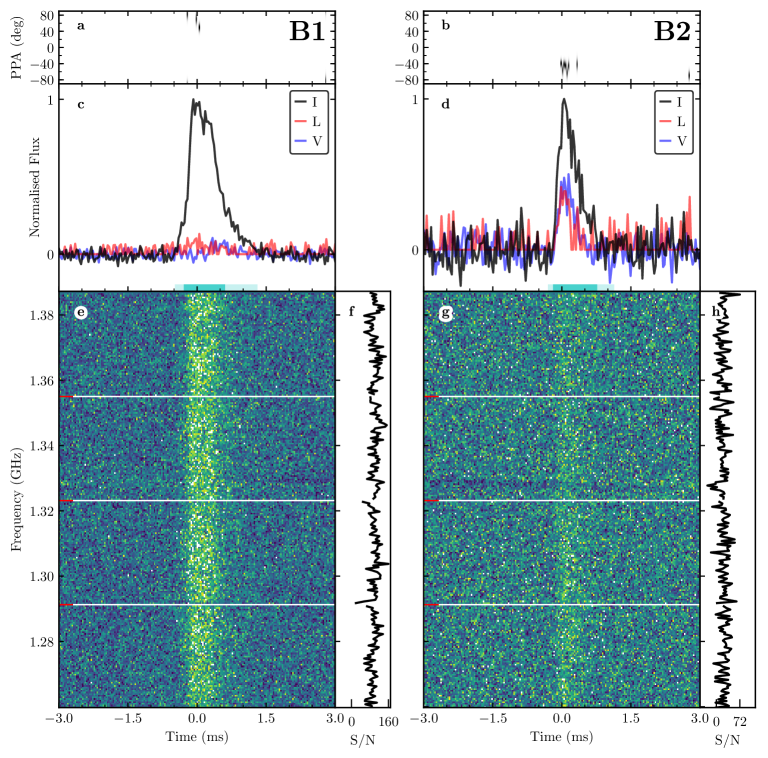
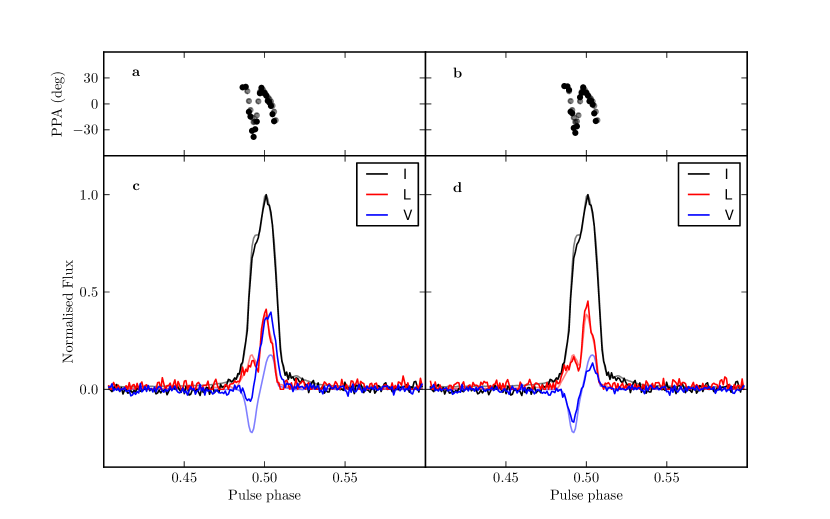
We detected two bursts in the data from Wb (central observing frequency MHz, Table 1) on 2020 May 24 at barycentric arrival times 22:19:19.67464 UT and 22:19:21.07058 UT (B1 and B2, respectively, dispersion corrected to infinite frequency). Heimdall detected the bursts at a S/N of for B1 and for B2. FETCH (model A), in turn, reports a probability of 1.0 for both bursts to be of astrophysical origin.
We subsequently create coherently dedispersed filterbanks with SFXC using5 (Methods). In Fig. 1 we show the resulting dynamic spectra and full-polarisation burst profiles. A coherently dedispersed filterbank with a time resolution of s and a frequency resolution kHz is used to determine the arrival times, fluences, peak flux densities, spectral energy densities, intrinsic pulse widths, observed burst widths and scattering time scales. The dynamic spectra are summed over frequency to create a normalised time series. We fit a Lorentzian distribution to the autocorrelation function of the time series to determine the full-width at half-maximum (FWHM) of the burst profiles. The resulting observed burst widths are s for B1 and s for B2, and are shown using a dark cyan bar in Fig. 1. The fluences of the bursts are determined by integrating over the light cyan bar shown in Fig. 1, which have widths of and times the FWHM for B1 and B2, respectively. These factors were chosen such that the light cyan bars fully cover the entire burst envelope. The fluence and peak flux density are converted to physical units using the radiometer equation26, and the spectral energy density is determined assuming a distance to SGR 19352154 of 27. The burst properties are presented in Table 2. Given the system equivalent flux density (SEFD) and available bandwidth at each station we estimate our burst searches to be complete to the -fluence limits listed in Table 1.
| B1 | B2 | |
| Barycentric arrival time [MJD]a | 58993.93008882 | 58993.93010498 |
| Dispersion measure [pc cm-3]b | ||
| Fluence [Jy ms]c,d | ||
| Peak flux density [Jy]c | ||
| Spectral energy density [erg/Hz]c,e | ||
| Intrinsic pulse width [s]f | ||
| Observed burst width [s]h | ||
| Scattering time scale [s] | ||
| Decorrelation bandwidth [kHz] | Hz | Hz |
| Linear polarisation Lunbias/I [%]i | 8.3 1 | 27.7 2 |
| Circular polarisation V/I [%]i | 7.7 1 | 39.4 3 |
| a Time of arrival of the peak of the burst envelope at the Solar System | ||
| Barycentre after correcting to infinite frequency using | ||
| . | ||
| bDetermined using PSRCHIVE’s pdmp. | ||
| cUncertainties are based on a 20%-uncertainty in the system | ||
| temperature measurements. | ||
| dIntegrated over the light cyan bar shown in Fig. 1. | ||
| eAssuming a distance kpc27. | ||
| fDefined as the FWHM of the Gaussian component before convolution. | ||
| gAs per the sum of both widths from the 2-component fit in Fig. 2. | ||
| hDefined as the FWHM of the Lorentzian distribution fitting the | ||
| autocorrelation function of the time series and using a | ||
| 10%-fractional error. | ||
| iErrors quoted are statistical errors that assume the errors on | ||
| the Stokes parameters are independent, and the errors are independent per time bin. | ||
| These uncertainties do not account for calibration errors and the effect of removing the baseline. | ||
4.1 Polarimetric properties of the bursts
We used full-polarisation data, with time and frequency resolution and , respectively, to study the polarimetric properties of the bursts from SGR 19352154. In this analysis we did not perform a calibration scan to use for polarimetric calibration. Instead, we used our test pulsar observation, of PSR J19351616, to determine the leakage correction (10%) and the delay correction (2 ns) between the recorded right and left circular polarisation (Methods). We assume that there are no significant changes to the calibration required between the test pulsar scan and the detected bursts as the respective scans are less than 1 hr apart.
We measure the rotation measure (RM) of B2 to be (Methods), consistent with the previous measurements5, 14. For burst B1, however, we cannot measure the RM which we attribute to the double-component structure seen in B1 (Fig. 2). The possibly two independent bursts overlap in time such that their polarisation properties are superimposed which, effectively, leads to a depolarised signal. We deem the depolarisation unlikely to arise from a significant change to the calibration solutions, since we find consistent results from PSR J19351616 (before burst B1) and burst B2 ( after B1). Assuming that the RM has not changed significantly between the two bursts, i.e. the RM of burst B1 is consistent with B2, we use to de-Faraday both B1 and B2. In Fig. 1 we show the Faraday-corrected (Methods) polarisation profiles of both bursts, and the polarisation position angle, . For B2, the PPA is consistent with being flat across the burst profile, similar to what CHIME/FRB Collaboration et al. 5 report. In Table 2, we quote the linear and circular polarisation fractions for B1 and B2 determined by summing the polarisation profile and dividing by the sum of the Stokes I profile. The uncertainties quoted are 1 errors assuming the errors in the Stokes parameters are independent, and the error in each time bin is independent. The uncertainties quoted also do not encapsulate calibration uncertainties or the effect of removing the background from the data.
4.2 Scattering and scintillation
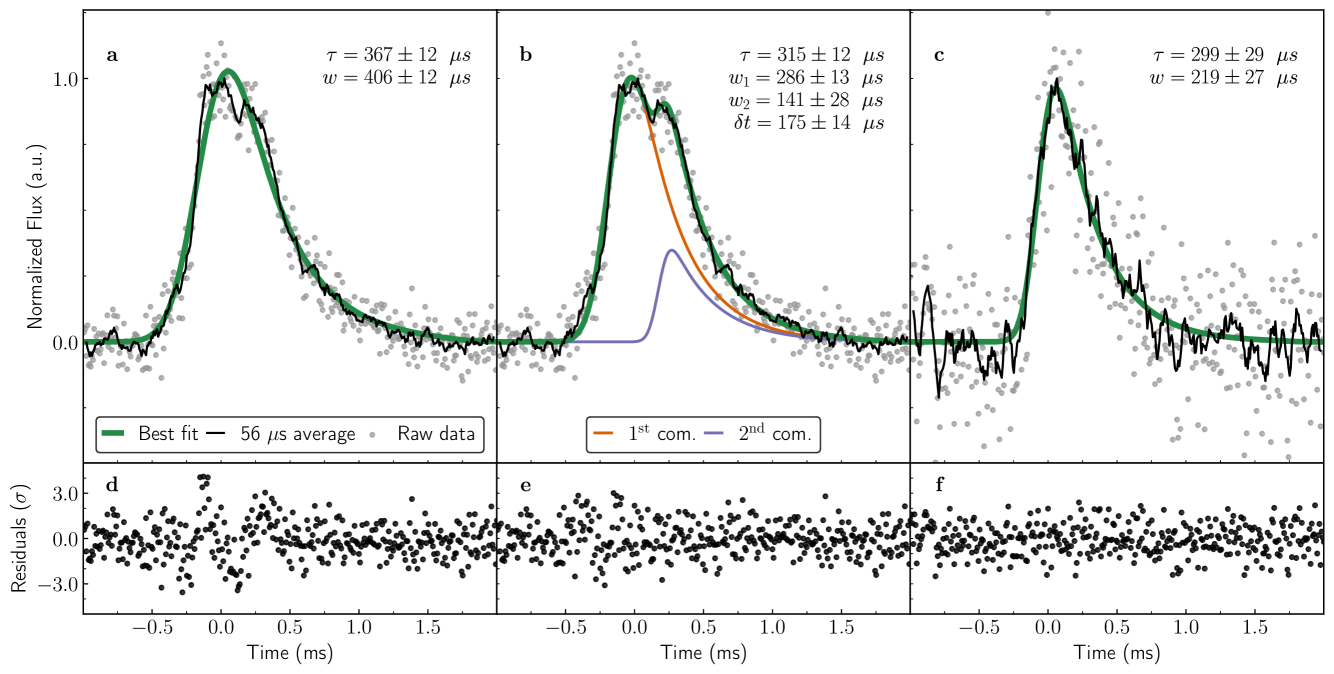
To determine the scattering times, a Gaussian profile convolved with an exponential decay, i.e. a thin screen model, is fit to each profile. As can be seen in the burst profiles of Fig. 1, B1 exhibits a double-peaked structure. Therefore, we fit both a single and a double component burst to the profile of B1. For the double component fit, the decay time was fixed to be the same for both components. We find a reduced chi-square value for the single component fit and for the double component fit. Furthermore, the difference in the value, is for three additional degrees of freedom, which indicates that the double component fit is a improvement over the single component fit. We conclude that B1 is consistent with exhibiting a double component temporal structure. For B2 we find . The double component fit for B1 and the single component fit for B2 result in scattering times s and s. The weighted average is s at MHz, where we added the uncertainties in quadrature. Within the model of a thin scattering screen, where the scattering time scale and the scintillation bandwidth are related via , our implies a scintillation bandwidth of about 500 Hz. An autocorrelation analysis of coherently dedispersed data with a frequency resolution of 488 Hz yields no scintillation bandwidth larger than the width of one channel. Producing a filterbank with even higher frequency resolution would require a time resolution of ms, and would reduce the S/N of any apparent scintillation because this timescale is significantly longer than the burst duration.
4.3 Burst rates
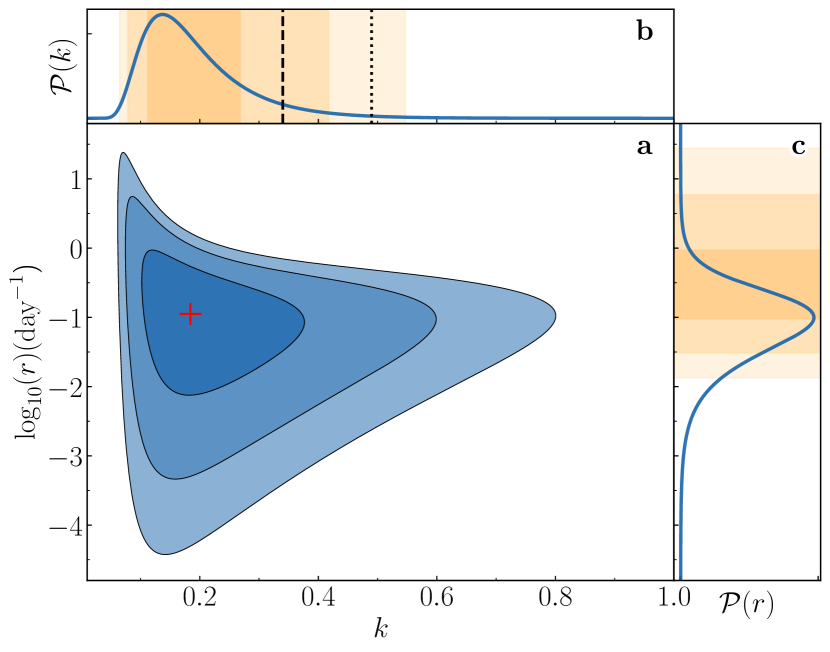
The time span between bursts B1 and B2 is only 1.4 s, which is very short compared to the roughly 421 hrs total duration of non-overlapping observations taken at L-band. Therefore, we assume a Weibull distribution29 to estimate the burst rate and the shape parameter valid in this frequency band (Methods). The most likely values of and taken jointly are and (Fig. 3). Moreover, the 68% confidence interval for is 0.11–0.27, while the 68% confidence interval for is 0.10–0.93. Thus the data do not support a Poissonian model (for which ), and there is evidence for clustering. Interestingly, the 95% confidence interval for (0.08–0.42) is consistent with the 2-region for derived for FRB 12110229, 30 (Fig. 3). This is an intriguing similarity between repeating extragalactic FRBs and SGR 19352154, although we cannot draw inferences about the exact mechanism itself.
4.4 X-ray bursts during the radio campaign
The pointed Swift and NICER observations did not reveal any X-ray bursts from SGR 19352154. While the source was in the field of view of Fermi/GBM during the two radio bursts on 2020 May 24, no simultaneous X-ray bursts were detected. HXMT was not observing SGR 19352154 during the radio bursts 24, while the source was not in the Swift/BAT field of view at that time.
On the other hand, several X-ray bursts were observed overlapping with our radio monitoring, without an associated radio burst detection. No radio bursts31 were seen during the X-ray burst detected with several X-ray instruments32 on 2020 May 10. Similarly, no radio burst was observed when Fermi triggered on a SGR 19352154 burst on 2020 May 20 (event bn200520908). We fit the spectrum of this burst with a double blackbody model (bbody+bbody in xspec), adding a cross-correlation multiplication constant between the spectra from detectors n3, n6, and n7. We measure temperatures of keV and keV for a fit with . We measure a 8–200 keV fluence of .
Comparing the HXMT burst list with the radio campaign, we find 59 X-ray bursts overlapping the radio observations (see Table 3). None of these are accompanied by a radio burst. At the time of writing, no information beyond fluence and values are reported for these bursts 24. The brightest of these 59 overlapping X-ray bursts had a fluence of , significantly brighter than the Fermi burst discussed above. The faintest of these X-ray bursts, on the other hand, had a reported fluence of .
5 Discussion
5.1 Completeness and burst energy distribution
The rate and shape parameter determined above are valid for bursts brighter than our detection threshold of 8–10 at L-band (Table 1). It is possible that we have missed bursts of lower fluence, e.g. bursts like the one reported by Zhang et al. 14. On the other hand, the two bursts that we see within 522.7 hrs on source are well above our detection threshold. In combination with the first-known burst5, 6, which is also the only one detected within hundreds of hours of observations with CHIME/FRB and STARE2, this is indicative of an almost flat cumulative distribution function of burst energies (Fig. 4). Assuming that a single emission mechanism is responsible for all reported radio bursts from SGR 19352154, it has to be of such type that the burst rate is close to independent of the amount of energy emitted across more than seven orders of magnitude. Alternatively, different parts of the emission cone might cross our line of sight in case the beaming direction changes significantly over time.
We note that there also exists an upper detection threshold, which we estimate to be of order 10 for our system. Any signal above this fluence could lead to non-linearities in the receiver system causing us to miss such bursts. However, during the time range of our observations neither CHIME/FRB nor STARE2 reported further bursts as bright as FRB 200428. In addition, there is no S/N-limit above which signals are masked as RFI in our analysis. Thus, it appears unlikely that we have missed any extremely bright bursts during our observations.

5.2 Polarimetry
Zhang et al. 14 presented the detection of a low-fluence, highly linearly polarised burst from SGR 19352154 with no circular polarisation detected. This is in contrast to the polarisation properties of the two bursts presented in this work. Our B2 is significantly less strongly polarised compared to the L/I of the FAST-detected burst, and B1 exhibits no significant polarisation () at all. Radio magnetars show a wide range of polarisation properties33, 34, 35; it is possible, perhaps unsurprising, that B1 and B2 are intrinsically not polarised. However, we find evidence for scattering in the burst profiles of both B1 and B2 which could lead to partial depolarisation34, 35. Alternatively, the low linear polarisation observed in burst B1 can be caused by the superposition of the polarisation properties of the two closely spaced sub-bursts (Fig. 2).
5.3 Simultaneity of X-ray and radio bursts
During the CHIME/FRB and STARE2 radio burst, with an estimated fluence of at 1378 MHz6, an X-ray burst with a fluence in the range of 6.1–9.7 was detected by INTEGRAL, Konus-Wind, and HXMT (in different energy ranges between 1 and 500 keV10, 9, 12; note that AGILE also detected the burst but has not yet reported a fluence measurement). Our brightest burst seen on 2020 May 24, B1, had a fluence four orders of magnitude weaker than the burst seen by STARE2. Assuming a similar ratio10 between radio and X-ray fluence during both bursts (), we would expect a fluence of the order of in X-rays. As this value is orders of magnitude lower than typical detection thresholds for Fermi (of the order of for 1 s bursts39, 40), it is not surprising that Fermi detects no X-ray bursts during the radio bursts.
Conversely, another three bright X-ray bursts coincident with our campaign were reported and a further 59 overlapping bursts are listed in Table 3. We found no radio counterparts to any of these bursts in our radio observations31, which allows us to place upper limits on the radio fluences — as listed in Table 1. Lin et al. 41 also report a non-detection of pulsed radio emission in an observing campaign with FAST, during which 29 high energy bursts were reported by the Fermi Gamma Ray Burst monitor. Therefore it seems that the majority of X-ray/Gamma ray bursts are not associated with pulsed radio emission. The parameters and fluences that we measure for the X-ray bursts discussed in Section 4.4 are consistent with typical values observed for SGR 19352154 42, fitting with the idea that radio bursts are instead associated with atypical, harder X-ray bursts 43.
5.4 Implications for magnetars and FRBs
To date, five Galactic magnetars, all of which are considered ‘transient magnetars’, have shown pulsed radio emission 44, 45. This emission is transient, lasting weeks to months, and associated with an X-ray outburst. In comparison to the radio-pulsing magnetars, SGR 19352154 produces much more sporadic bursts, and suggests that high-cadence monitoring of other Galactic magnetars might also discover radio bursts associated with X-ray burst storms. Along with SGR 19352154, the discovery of two bright, sporadic bursts from the radio-emitting magnetar J15505418 46 strengthens the idea that this may not be uncommon.
The 1.396-s separation between bursts B1 and B2 corresponds to 0.43 of SGR 19352154’s 3.245-s rotational period. Currently it is impossible to assign rotational phases to our and all other detected radio and X-ray bursts from SGR 19352154 due to the lack of a phase-coherent rotational ephemeris. This is important though for understanding the burst emission mechanism. It might contribute to understanding the apparent lack of burst arrival time periodicity from repeating FRBs, which could in principle be attributed to bursts occurring at a wide and varying range of rotational phases 47, i.e. from varying emission sites — as opposed to being from a relatively stable location of origin, as is the case in rotation-powered radio pulsars. Our SGR 19352154 results suggest that its bursts can occur at a wide range of rotational phases, but with only two bursts we can not rule out a more stable pulse-interpulse configuration.
The four reported radio bursts from SGR 19352154 span more than seven orders of magnitude in observed fluence. While beaming of the radio emission certainly must affect the observed fluences at some level, this nonetheless demonstrates that SGR 19352154’s radio burst emission spans the typical luminosities seen from rotation-powered radio pulsars up to the closest-known extragalactic FRBs (see Fig. 4). It is unclear whether the four known SGR 19352154 bursts were produced by the exact same type of physical process. Neutron stars are known to produce radio bursts of various types (polar-cap pulsar emission, giant pulses, radio magnetar emission). Perhaps the observational differences between the bursts from repeating and (apparently) non-repeating sources are also a reflection of this diversity of emission mechanisms seen from neutron stars.
Observationally, one can pose the question: are low-luminosity radio bursts, that can only be detected from a Galactic source, also ‘FRBs’? The repeater FRB 121102 has been observed to produce radio bursts with fluences spanning three orders-of-magnitude; for FRBs in general, the detection of lower/higher fluences is limited by telescope sensitivity and available observing time, respectively.
Overall, SGR 19352154 makes a compelling case that there is a link between (at least some) FRBs and magnetars. However, important observational differences remain. For instance, some repeating FRBs have shown periodicity in their activity level48 on timescales of weeks to months — suggesting that the source may be in a binary system, extremely slowly rotating, or rapidly precessing49, 50, 51. SGR 19352154 is not known to be in a binary, and there are not yet enough detected radio bursts to look for a periodicity in its radio burst activity. Using 174 X-ray bursts detected from 2014–2020, Grossan 52 claim periodic windowed activity with a period of 232 days and a fractional activity window of 56%. Continued radio monitoring of SGR 19352154 can help verify this claim.
So SGR 19352154 is not a flawless analogue of the extragalactic FRB population. Nonetheless, magnetars can plausibly explain the diverse phenomena observed from FRBs. Perhaps the distant, periodically active FRB sources are brighter and more active because they are significantly younger than SGR 19352154 and because their magnetospheres are perturbed by the ionised wind of a nearby companion. Similarly, perhaps non-repeating FRBs are older, non-interacting, and thus less active. Detailed characterisation of FRB local environments is critical to investigating these possibilities.
6 Methods
6.1 Observations
6.1.1 Radio observations
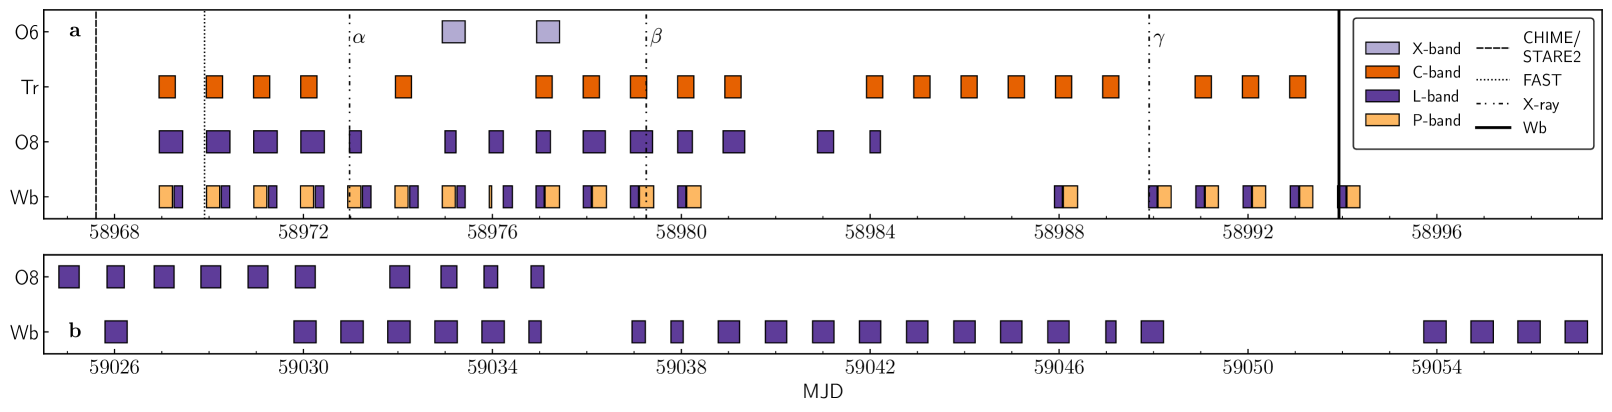
Since the announcement of FRB 20042853, 54, we observed SGR 19352154 daily for up to almost 12 hours, between 2020 April 29 UT 22:45 (MJD 58968.94791) and 2020 May 25 UT 09:00 (MJD 58994.37500). After detecting bursts, we resumed the campaign with a similar cadence between 2020 June 24 UT 19:30 (MJD 59024.81250) and 2020 July 27 UT 04:30 (MJD 59057.18750). See Fig. 5, Table 1 and Table LABEL:tab:observations for a summary of the observing campaign. The telescopes involved were the 25-m single dish RT1 at Westerbork in the Netherlands (Wb, P- and L-band), the 25-m and 20-m telescopes at Onsala Space Observatory in Sweden (O8, O6; L- and X-band) and the 32-m dish in Toruń, Poland (Tr, C-band). All stations operated independently as single dishes, recording 2-bit baseband data (circular polarisations) in VLBI Data Interchange Format VDIF, 21 with the local Digital Base Band Converters (DBBC2 or DBBC3 systems). In total, we observed for 763 hrs, which reduces to 522.7 hrs on source when accounting for overlap between the stations.
Westerbork RT1: Wb observed in two different frequency ranges, covering 313.49–377.49 MHz (P-band) split into eight 8 MHz wide subbands during part of each run. The other part of a run covered 1260–1388 MHz (L-band) split at first into four 32 MHz wide bands (29 April–19 May). This was changed to eight 16 MHz wide bands for easier processing as of 20 May. We recorded 3-minute scans with a 1-minute gap in between scans during the first seven runs (29 April–06 May); for the remaining observations this was changed to 10-minute recordings and 20-second gaps. At the beginning of both the P-band observations and the L-band observations we observed either pulsar PSR J19212153 or the pulsar PSR J19351616 as test sources to verify the system.
Onsala: The Onsala 25-m dish (O8) observed at L-band with varying frequency ranges and bandwidths over 14 nights. We recorded the entire available bandwidth of 512 MHz between 1222–1739 MHz during the first three observations (29 April–02 May). Owing to the large fraction of radio frequency interference (RFI, 50%) in the band we subsequently tested setups with 256 MHz of continuous bandwidth placed within the above range (02–09 May). Eventually, we settled for a 128 MHz wide band split into eight 16 MHz wide bands between 1360–1488 MHz for the rest of the campaign (Table LABEL:tab:observations). We observed either PSR J03585413 or PSR J19351616 as test sources towards the beginning of the observations. For two runs (06–08 May) the Onsala 20-m telescope (O6) joined the observations covering the frequency range 8080–8592 MHz (X-band), split into sixteen 32 MHz wide subbands. Both stations O8 and O6 observed for five to twelve hours during each run, recording 15-minute scans with a 12-second gap in between scans.
Toruń: The 32-m dish at Toruń (Tr) observed at C-band for about 8 hrs during a total of 19 nights. We recorded the entire 256 MHz of bandwidth covering the frequency range of 4550–4806 MHz, split into eight 32 MHz wide subbands. We performed 5-minute scans on the tests pulsars at the beginning and the end of each observing run. During the first six nights (29 April–5 May) we scheduled a main 15-minute observing loop that consisted of 880 s of recording on SGR 19352154 and 20-second gaps dedicated to gain correction. For these first runs we observed PSR J19351616 and PSR J20222854 as the test sources. Thereafter we increased the gaps by 10 s but the length of the observing loop was left unchanged. Also, from 7 May onward only PSR J20222854 was observed for the system performance checking. We also observed during the night of 3 May 2020 for which Li et al. 57 reported a bright X-ray burst, but due to a wrong setup the antenna was off source, hence all data were discarded.
6.1.2 X-ray data
Publicly available pointed observations were taken by the Neutron star Interior Composition ExploreR (NICER 58) and the Neil Gehrel’s Swift Observatory (Swift 59), observing SGR 19352154 seven (ObsIDs 3020560107/8/25/33/37/40/42) and ten (ObsIDs 00033349049/50/56/58/60-63/66/76) times during the radio campaign, respectively. In addition, the target was in the field of view of the monitoring instruments aboard Swift (the Burst Alert Telescope or BAT) and Fermi (the Gamma-ray Burst Monitor or GBM 60) the majority of the time. Swift/BAT did not report any burst triggers during the radio observations. Fermi/GBM records in Time-tagged Event (TTE) mode with a high, s time resolution. Therefore, we focused on the Fermi/GBM data at times of particular interest in the radio campaign.
6.2 Data reduction and analysis
6.2.1 Radio observations
The baseband data from each participating station was transferred via the internet to Onsala Space Observatory (OSO) where we searched the data from each station separately with a pipeline that was developed to search for FRBs in baseband recordings. We performed the following steps on a per station basis for each recorded scan:
-
1.
Create separate (baseband) files for each subband;
-
2.
Channelise each subband and form Stokes I;
-
3.
Splice all subbands together into one filterbank;
-
4.
Dedisperse the filterbanks and search for bursts;
-
5.
Classify and inspect burst candidates;
-
6.
Create coherently dedispersed filterbanks for the best candidates and verify.
In the current recording setup the electric voltages are sampled as 2-bit real numbers. At each station each scan (i.e. each integration lasting 3–15 minutes, rf. Section 6.1.1) is recorded in a single VDIF-file that contains both polarisations of all subbands (e.g. for Toruń which recorded eight 32 MHz wide subbands to capture 256 MHz of bandwidth). The software package that we use to channelise the baseband data and create total intensities (digifil from DSPSR 22) can currently only unpack VDIF files that contain two polarisations of one single subband. Therefore, prior to creating 8-bit filterbanks with digifil we use jive5ab to split each scan into separate files that contain both circular polarisations. Each subband is processed separately (but simultaneously) and the resulting filterbank files are combined in one single file that contains the entire observed frequency range with the utility splice from SIGPROC61. The time resolution of the filterbanks at L-, C-, and X-band is s while the frequency resolution is 125 kHz, 250 kHz and 2 MHz, respectively. Given the dispersion measure (DM) of SGR 19352154 (5), this implies a maximal intra-channel time smearing of s in our lowest channel at L-band (1227 MHz). The filterbanks created from the P-band data have a much finer channelisation (7.8 kHz) to limit residual intra-channel time smearing to 700s at the lower end of the band. Time resolution is accordingly lower (1 ms) than in the other bands.
We manually inspect subsections of the data from each station to identify frequency ranges that are continuously affected by RFI. Based on this analysis, we create channel masks for flagging that are passed on to all subsequent steps of the burst search pipeline.
We search the filterbanks for bursts with Heimdall as the dedispersion and burst finder engine. Since the dedispersion is known a priori we do not perform a full search in DM-space but instead limit the search range to . The candidates found by Heimdall above a signal-to-noise (S/N) threshold of seven are then classified either as RFI or potential candidates by FETCH (model A)23. We chose this particular S/N-threshold since while testing the pipeline a lower threshold led to an extensive number of false positives. This is easily explained by the fact that FETCH was trained and tested on data with S/N, i.e. the classifier employed by FETCH is potentially less reliable for low S/N-candidates. We inspect the candidates by eye and, as a final step, we use the software correlator SFXC 62 to create coherently dedispersed filterbanks around the times of the most convincing candidates, for final verification.
As mentioned above, we observed well-known pulsars in each observing run to verify the integrity of our data and the reliability of our processing pipeline. To that end, we perform the steps described above also on the pulsar scans. In addition, we fold the filterbank files that contain a scan of a pulsar with DSPSR’s dspsr and inspect the folded profiles. The respective pulsars were detected each time with the exception of PSR J19212153 observed with station Wb at L-band. At this frequency the pulsar was detected only about half the time, which we attribute to diffractive scintillation from the Galactic interstellar medium. The test pulsar PSR J19351616 is bright enough to detect several individual pulses with our pipeline almost each time it is observed.
6.2.2 Dispersion measure optimisation
To optimise the DM we run the PSRCHIVE 63 tool pdmp on the filterbank data of each burst separately, which yields and for B1 and B2, respectively. These values are consistent with DMSGR as measured by CHIME/FRB Collaboration et al. 5 (), albeit marginally higher. We attribute the higher DM to the optimisation algorithm employed by pdmp which essentially maximises the S/N of the burst by modifying the DM. Given the scattering tails of the bursts, this can lead to a peak in S/N at a DM higher than the true value. We do not attempt to determine an optimal DM based on higher-time-resolution baseband data because the burst width is dominated by scattering. Furthermore, we consider DMSGR to likely be more accurate, because of the larger fractional bandwidth of those observations.
6.2.3 Burst statistics
If a stochastic process can be described as a Poisson point process with a constant rate parameter , then the random variable describing the wait times between events generated by the process will follow an exponential distribution,
| (1) |
On the contrary, repeating FRBs are known to show clustering in their burst patterns, and therefore cannot be described with a Poissonian model. As described in Oppermann et al. 29, a possible generalisation of the wait time distribution is given by the Weibull distribution,
| (2) |
with shape parameter and rate parameter , which reduces to an exponential distribution if . Here is the Gamma function. The posterior distribution of and can therefore be used to test whether the data supports a Poissonian model, because Poissonian data should necessarily produce a posterior distribution consistent with . To calculate the posterior distribution, we follow the formalism described in Oppermann et al. 29. We only include scans at Westerbork and Onsala L-band. Whenever Westerbork and Onsala overlap we only include scans taken with the Westerbork station to avoid possible correlations between scans (amounts to a grand total of 421.2 hrs of on-source time). Therefore, we assume that all scans are independent, and calculate the total likelihood of the data as the product of the likelihoods of each individual scan. For the scan containing B1 and B2, we use the topocentric arrival time from the beginning of the scan to calculate the likelihood function. Finally, we use a uniform prior distribution and calculate the posterior distribution in the usual way as
| (3) |
where represents the likelihood of all the data, and represents the prior.
6.2.4 Burst energy distribution
To create Fig. 4, we made the following simplifying assumptions. Firstly, we considered only the active phase of SGR 19352154 in April and May 2020 to estimate observing hours. During this period, for CHIME/FRB and STARE2 we assumed daily exposures of 3 hrs and 9.2 hrs, respectively, for 61 days. FAST reported one burst in 9 hrs of observing time41, 14. For our campaign, we considered only our non-overlapping L-band observations in April and May 2020 (163.5 hrs). Due to the lack of reported observed burst widths, we assume a width of ms for the bursts reported by CHIME/FRB, STARE2 and FAST. For bursts B1 and B2 we use the values listed in Table 2. Furthermore, we use the fluences as reported in the respective publications and from Table 2.
6.2.5 Polarimetric calibration
In our observations, we did not perform a noise-diode scan to use for polarimetric calibration. Instead, we used our test pulsar observation, PSR J19351616, to determine the leakage correction between the recorded right and left circular polarisation (RCP and LCP). First we assume that the leakage calibration only significantly affects Stokes V (defined as , using the PSR/IEEE convention for the Stokes parameters; RR and LL are the detected power in RCP and LCP, respectively64). This is approximately equivalent to moving of the flux density in LL to RR, i.e. we correct for a 10%-leakage between RCP and LCP. Since Wb has an equatorial mount, we do not need to apply any corrections for parallactic angle.
We still have to account for a delay between the two polarisation hands, which we assume only significantly affects Stokes Q and U. We use the tool rmfit from PSRCHIVE, which performs a search for the rotation measure (RM) by maximising the linear polarisation fraction. Since we did not correct for the delay between the two polarisation hands beforehand, this manifests as an offset in the RM (compared with the true RM of the source), assuming the delay is constant across all frequencies. For PSR J19351616, we measure an RM of , which is 88 units from the true RM of 65. Under our assumption that a delay approximately corresponds to an offset in RM, an offset of translates to 2 ns in delay. By correcting for Faraday rotation in PSR J19351616 using the rmfit-determined RM (), we reproduced the polarimetric profile and polarisation position angle (PA) swing of PSR J19351616 within % of the published polarisation properties 66. Figure 6 shows the Faraday-corrected polarisation profile and PA swing of PSR J19351616 using the true RM of the source, the rmfit-determined RM and comparing both with the profile and PA presented in the literature 66.
We apply the leakage calibration to the bursts detected from SGR 1935+2154. We first run rmfit to find the RM that maximises the linear polarisation. For burst B2, we find the rmfit-measured RM to be 82 higher than what was expected from the previously measured RM from a SGR 1935+2154 radio burst (; Zhang et al. 14), which is consistent with our RM offset measured for PSR J19351616.
We then perform a joint QU fit to Stokes parameters Q/I and U/I as a function of frequency, , using the following equations:
| (4) |
| (5) |
where is the speed of light, and we fit for the linear polarisation fraction , the delay between the hands , and , where is the absolute angle of the polarisation on the sky (referenced to infinite frequency), and is the phase difference between the polarisation hands. We perform the joint fit on Q/I and U/I spectra for PSR J19351616 and for burst B2 from SGR 19352154, where the delay is assumed to be the same for both the pulsar scan and target scan. We fix the RM of the pulsar at the known65 RM of PSR J19351616, . We find , consistent with our prediction. Additionally, we measure the RM of B2 to be , consistent with the previously measured14 value (). The fractional error on the measured RM is large since we did not perform an independent, noise-diode polarisation calibration scan, and therefore cannot remove the covariance between the fit parameters.
We debias the linear polarisation fraction following Everett & Weisberg 28:
| (6) |
where , for Stokes parameters and , and is the standard deviation in the off-pulse Stokes .
6.2.6 X-ray observations
To search for X-ray bursts during the two NICER and nine Swift/X-ray Telescope (XRT) pointed observations, we followed standard data reduction procedures in HEASOFT v6.25 to extract light curves, using the latest calibration files via the online database caldb. The NICER data were reduced using nicerdas, applying standard filtering with additional constraints (SUN_ANGLE and COR_SAX ) generated with nimaketime and applied with niextract-events. For Swift/XRT, we applied the xrtpipeline v0.13.4. After data calibration, we extracted light curves for both observatories using xselect v2.4e at various time resolutions: , and second for NICER, and s for Swift/XRT in Window-timing mode, and s for the Swift/XRT in Photon-counting mode. Finally, we checked our methods by following the same procedures for NICER observation 3020560101, which did not overlap with the radio campaign but was reported to contain numerous X-ray bursts43. We clearly recover the X-ray bursts reported therein, confirming our data reduction procedure.
For Fermi/GBM, we focused primarily on two events: firstly, the GBM trigger on an X-ray burst of SGR 19352154 on 2020 May 20, 21:47:07.548 UT (event bn200520908), and secondly the TTE data on 2020 May 24 22:00–23:00 UT, during which we observed radio bursts (see Section 4). For the GBM trigger data, we analysed the cspec files of detectors n3, n6, and n7, which showed the strongest bursts in the quicklook images. Using gspec v0.9.1, we extracted burst and background spectra per detector for the SGR 19352154 burst, which we then fitted jointly using xspec v12.10.1. To analyse the TTE data on 2020 May 24, we used the gtbin tool in the FERMITOOLS package to extract light curves at a , , and s time resolutions for all twelve GBM detectors. We then used the fermi gbm data tools v1.0.2, combined with the spacecraft pointing, to measure the viewing angle between each GBM detector and SGR 19352154. This comparison confirms that the source was visible during the radio bursts and reveals that detectors n9 and na had the smallest viewing angles, at and , respectively.
While Fermi/GBM triggered several additional times after the start of our radio campaign, none of these events overlapped with our radio campaign: trigger bn200503976 on 2020 May 3, also reported by Ursi et al. 55 and Li et al. 57, fell into a recording gap at Wb, while station O8 was affected by exceptionally strong RFI and the Tr antenna was off source. On 2020 May 10, Fermi passed through the South Atlantic Anomaly during the X-ray burst reported by Hurley et al. 32 and no TTE data was recorded. Later on May 10, Fermi/GBM trigger bn200510911 occurred just before the start of our radio observations.
6.3 Scattering time scale and scintillation
CHIME/FRB Collaboration et al. 5 report a scattering time at a frequency of MHz, while Bochenek et al. 6 report a scattering time at GHz. Assuming a thin screen model for scattering and Kolgomorov turbulence, the scattering time scales with frequency as , with being the frequency scaling parameter. In this scheme, given the CHIME and STARE2 results we would expect s at our central observing frequency GHz. However, the value we measure is a factor higher (s) and implies a frequency scaling , much shallower than the canonical value. We note that the scaling implied by and is very similar, with . Such a shallow scaling and the fact that Bochenek et al. 6 can reconcile their observations with no scattering, suggest that the tails that we observe could be intrinsic. Along the line of sight to SGR 19352154, the two available electron density models, NE200167 and YMW1668, predict scattering time scales of 10s and 1 ms, respectively; i.e in combination they support both notions of an intrinsic tail and of a scattering tail.
A number of recent studies of pulsar scattering at low radio frequencies (MHz) also measure values for that are lower than the theoretically expected one69, 70, 71. This can be caused by several factors among which are that the assumption of Kolmogorov turbulence and a single thin scattering screen geometry are in fact not valid. To measure the scattering time scale we assumed an intrinsic Gaussian pulse shape whose rise time can mimic that expected for an impulsive signal that travels through an extended screen, i.e. a thick screen geometry 72. Moreover, the assumption of a single screen might be invalid as SGR 19352154 is associated with the supernova remnant (SNR) G57.2+0.8 with high probability 73. Thus, besides an interstellar scattering screen about half way towards the source there could well be a second screen within the SNR, i.e. much closer to the magnetar itself. In fact, Simard & Ravi 74 invoke the existence of such a screen to explain the spectral structure of the burst reported by CHIME/FRB Collaboration et al. 5. In their model, the screen closest to the magnetar causes what can be interpreted as scintillation with a characteristic scintillation bandwidth of MHz at an observing frequency of MHz. Scaled to our observing frequency this translates to MHz. This is consistent with our observations in the sense that we observe during a phase of a bright scintil (caused by the screen close to the source). Any scintillation that could be caused by the interstellar screen (that is also the cause for the temporal broadening) is too narrow in bandwidth for us to resolve.
| HXMT burst time [UT] | Burst time [UT; continued] | Burst time [UT; continued] |
|---|---|---|
| 2020-04-30T09:25:22.750 | 2020-05-08T06:17:16.589 | 2020-05-15T00:37:16.000 |
| 2020-04-30T10:28:03.000 | 2020-05-08T09:17:05.185 | 2020-05-16T01:50:23.542 |
| 2020-05-02T02:49:27.800 | 2020-05-08T09:49:21.134 | 2020-05-16T02:09:32.000 |
| 2020-05-02T04:39:05.812 | 2020-05-09T01:56:38.750 | 2020-05-17T00:26:07.845 |
| 2020-05-02T05:40:53.151 | 2020-05-09T23:47:15.000 | 2020-05-17T03:18:10.320 |
| 2020-05-02T10:17:26.000 | 2020-05-10T01:30:01.000 | 2020-05-18T01:54:21.550 |
| 2020-05-02T10:25:25.777 | 2020-05-10T01:38:45.000 | 2020-05-18T05:17:57.715 |
| 2020-05-03T01:06:02.666 | 2020-05-10T03:03:38.000 | 2020-05-18T22:21:05.000 |
| 2020-05-03T04:08:26.000 | 2020-05-10T03:17:15.000 | 2020-05-19T00:15:15.000 |
| 2020-05-03T04:30:59.050 | 2020-05-10T05:00:28.195 | 2020-05-20T21:47:07.480 |
| 2020-05-03T05:53:45.000 | 2020-05-10T06:12:01.622 | 2020-05-20T22:06:45.330 |
| 2020-05-03T06:50:42.990 | 2020-05-10T06:16:41.100 | 2020-05-21T01:24:06.000 |
| 2020-05-03T10:34:35.637 | 2020-05-10T06:20:09.400 | 2020-05-21T23:33:39.000 |
| 2020-05-03T23:25:13.250 | 2020-05-10T06:21:26.023 | 2020-05-22T21:49:36.000 |
| 2020-05-04T00:48:07.343 | 2020-05-10T06:36:51.400 | 2020-05-22T23:27:47.800 |
| 2020-05-05T02:30:28.450 | 2020-05-10T08:55:46.300 | 2020-05-23T05:30:05.600 |
| 2020-05-06T03:53:15.000 | 2020-05-11T02:52:18.000 | 2020-05-24T22:05:03.480 |
| 2020-05-06T22:48:21.550 | 2020-05-11T04:22:52.560 | 2020-05-24T23:18:15.000 |
| 2020-05-08T03:23:13.000 | 2020-05-11T23:28:40.880 | 2020-05-25T00:57:45.000 |
| 2020-05-08T03:34:15.000 | 2020-05-12T06:12:09.300 |
| MJD starta | MJD enda | Bandb | Time [h]c | Stationd |
|---|---|---|---|---|
| 0.94240 | 1.28586 | C | 7.99 | Tr |
| 0.94689 | 1.44284 | L1 | 11.72 | O8 |
| 0.94795 | 1.22499 | P | 4.91 | Wb |
| 1.26045 | 1.44025 | L | 3.19 | Wb |
| 1.94240 | 2.28586 | C | 7.99 | Tr |
| 1.94689 | 2.44284 | L1 | 11.72 | O8 |
| 1.94795 | 2.22499 | P | 4.93 | Wb |
| 2.26045 | 2.43748 | L | 3.14 | Wb |
| 2.94240 | 3.28586 | C | 7.99 | Tr |
| 2.94689 | 3.44284 | L1 | 11.71 | O8 |
| 2.94795 | 3.22495 | P | 4.94 | Wb |
| 3.26045 | 3.43470 | L | 3.09 | Wb |
| 3.93753 | 4.21457 | P | 4.91 | Wb |
| 3.94241 | 4.28586 | C | 7.99 | Tr |
| 3.94492 | 4.44087 | L2 | 11.72 | O8 |
| 4.25005 | 4.43263 | L | 3.23 | Wb |
| 4.93755 | 5.21457 | P | 4.89 | Wb |
| 4.97311 | 5.22628 | L2 | 5.99 | O8 |
| 5.25005 | 5.42985 | L | 3.18 | Wb |
| 5.93753 | 6.21457 | P | 4.93 | Wb |
| 5.94934 | 6.28679 | C | 7.85 | Tr |
| 6.25003 | 6.42706 | L | 3.14 | Wb |
| 6.93752 | 7.21454 | P | 4.92 | Wb |
| 6.93825 | 7.42361 | X | 11.2 | O6 |
| 6.99700 | 7.22906 | L3 | 5.49 | O8 |
| 7.25002 | 7.42428 | L | 3.09 | Wb |
| 7.93080 | 8.23002 | L4 | 5.63 | O8 |
| 7.93432 | 7.98428 | P | 1.16 | Wb |
| 8.22946 | 8.42294 | L | 4.48 | Wb |
| 8.92307 | 9.26666 | C | 7.93 | Tr |
| 8.92390 | 9.09586 | L | 3.98 | Wb |
| 8.93057 | 9.23020 | L5 | 6.97 | O8 |
| 8.93825 | 9.42361 | X | 11.2 | O6 |
| 9.11488 | 9.42317 | P | 7.12 | Wb |
| 9.92307 | 10.26666 | C | 7.95 | Tr |
| 9.92362 | 10.39216 | L5 | 10.97 | O8 |
| 9.92390 | 10.09586 | L | 3.98 | Wb |
| 10.11488 | 10.41600 | P | 6.95 | Wb |
| 10.92307 | 11.26666 | C | 7.95 | Tr |
| 10.92362 | 11.39218 | L3 | 10.99 | O8 |
| 10.92391 | 11.09587 | L | 3.98 | Wb |
| 11.11487 | 11.41600 | P | 6.97 | Wb |
| 11.92307 | 12.26666 | C | 7.95 | Tr |
| 11.92362 | 12.23384 | L3 | 7.24 | O8 |
| 11.92390 | 12.09586 | L | 3.98 | Wb |
| 12.11488 | 12.41600 | P | 6.96 | Wb |
| 12.88544 | 13.34343 | L3 | 10.74 | O8 |
| 12.92307 | 13.26666 | C | 7.94 | Tr |
| 14.88543 | 15.22730 | L3 | 7.98 | O8 |
| 15.92307 | 16.26667 | C | 7.95 | Tr |
| 15.99524 | 16.21676 | L3 | 5.24 | O8 |
| 16.92307 | 17.26666 | C | 7.95 | Tr |
| 17.92307 | 18.26666 | C | 7.95 | Tr |
| 18.92307 | 19.26666 | C | 7.95 | Tr |
| 19.90307 | 20.06785 | L | 3.81 | Wb |
| 19.92307 | 20.26666 | C | 7.94 | Tr |
| 20.09058 | 20.39169 | P | 6.96 | Wb |
| 20.92307 | 21.26666 | C | 7.94 | Tr |
| 21.89622 | 22.07537 | L | 4.14 | Wb |
| 22.09414 | 22.37373 | P | 6.46 | Wb |
| 22.88140 | 23.22499 | C | 7.95 | Tr |
| 22.89623 | 23.07535 | L | 4.14 | Wb |
| 23.09414 | 23.37373 | P | 6.46 | Wb |
| 23.88140 | 24.22488 | C | 7.94 | Tr |
| 23.89623 | 24.07535 | L | 4.14 | Wb |
| 24.09414 | 24.37373 | P | 6.46 | Wb |
| 24.88140 | 25.22499 | C | 7.95 | Tr |
| 24.89623 | 25.07535 | L | 4.14 | Wb |
| 25.09414 | 25.37373 | P | 6.46 | Wb |
| 25.89623 | 26.07537 | L | 4.14 | Wb |
| 26.09414 | 26.36994 | P | 6.24 | Wb |
| 56.82084 | 57.24919 | L3 | 9.49 | O8 |
| 57.79865 | 58.26625 | L | 9.61 | Wb |
| 57.84075 | 58.20545 | L3 | 8.24 | O8 |
| 58.83825 | 59.25847 | L3 | 9.74 | O8 |
| 59.82784 | 60.24806 | L3 | 9.70 | O8 |
| 60.82784 | 61.24804 | L3 | 9.74 | O8 |
| 61.79862 | 62.26625 | L | 9.60 | Wb |
| 61.82784 | 62.24806 | L3 | 9.74 | O8 |
| 62.79170 | 63.26584 | L | 10.44 | Wb |
| 63.78473 | 64.25889 | L | 10.44 | Wb |
| 63.82784 | 64.24804 | L3 | 9.73 | O8 |
| 64.78128 | 65.25541 | L | 10.44 | Wb |
| 64.91228 | 65.24806 | L3 | 7.74 | O8 |
| 65.77779 | 66.25193 | L | 10.44 | Wb |
| 65.82293 | 66.11082 | L3 | 3.75 | O8 |
| 66.77434 | 67.03318 | L | 5.46 | Wb |
| 66.81742 | 67.09171 | L3 | 6.49 | O8 |
| 68.95837 | 69.23874 | L | 5.96 | Wb |
| 69.78128 | 70.04013 | L | 5.47 | Wb |
| 70.78127 | 71.23389 | L | 9.94 | Wb |
| 71.78128 | 72.23388 | L | 9.94 | Wb |
| 72.78127 | 73.23388 | L | 9.95 | Wb |
| 73.77087 | 74.22346 | L | 9.65 | Wb |
| 74.77086 | 75.22346 | L | 9.78 | Wb |
| 75.77087 | 76.22348 | L | 9.94 | Wb |
| 76.76044 | 77.21304 | L | 9.94 | Wb |
| 77.76046 | 78.21304 | L | 9.92 | Wb |
| 78.98963 | 79.20541 | L | 4.46 | Wb |
| 79.73963 | 80.2113 | L | 10.37 | Wb |
| 85.72225 | 86.19639 | L | 10.40 | Wb |
| 86.72226 | 87.19638 | L | 9.13 | Wb |
| 87.71531 | 88.18946 | L | 10.12 | Wb |
| 88.71530 | 89.18946 | L | 10.45 | Wb |
| a For clarity has been subtracted from all MJD’s. | ||||
| b P:314–377 MHz, L:1260–1388 MHz, | ||||
| L1:1227–1739 MHz, L2:1259–1515 MHz, | ||||
| L3:1360–1488 MHz, L4:1232–1488 MHz, | ||||
| L5:1360–1616 MHz, | ||||
| C:4550–4806 MHz, X:8080–8592 MHz. | ||||
| c Total on source recording time in hours. | ||||
| d Wb: Westerbork RT1, Tr: Toruń, O8: Onsala 25m, | ||||
| O6: Onsala 20m. | ||||
7 Data availability
Associated data products and plotting scripts are available at this placeholder link. The baseband data can be made available upon request to the corresponding author (franz.kirsten@chalmers.se).
8 Code availability
The pipeline written to process the baseband data can be found at https://github.com/pharaofranz/frb-baseband. The code used to calculate the posterior distribution and generate Fig. 3 can be found at https://github.com/MJastro95.
References
- Platts et al. 2019 Platts, E. et al. A living theory catalogue for fast radio bursts. Phys. Rep. 821, 1–27 (2019).
- Chen et al. 2020 Chen, G., Ravi, V. & Lu, W. The Multiwavelength Counterparts of Fast Radio Bursts. Astrophys. J. 897, 146 (2020).
- Scholz et al. 2017 Scholz, P. et al. Simultaneous X-Ray, Gamma-Ray, and Radio Observations of the Repeating Fast Radio Burst FRB 121102. Astrophys. J. 846, 80 (2017).
- Marcote et al. 2020 Marcote, B. et al. A repeating fast radio burst source localized to a nearby spiral galaxy. Nature 577, 190–194 (2020).
- CHIME/FRB Collaboration et al. 2020 CHIME/FRB Collaboration et al. A bright millisecond-duration radio burst from a Galactic magnetar. Preprint at arXiv:2005.10324 (2020).
- Bochenek et al. 2020a Bochenek, C. D. et al. A fast radio burst associated with a Galactic magnetar. Preprint at arXiv:2005.10828 (2020).
- CHIME/FRB Collaboration et al. 2018 CHIME/FRB Collaboration et al. The CHIME Fast Radio Burst Project: System Overview. Astrophys. J. 863, 48 (2018).
- Bochenek et al. 2020b Bochenek, C. D. et al. STARE2: Detecting Fast Radio Bursts in the Milky Way. Publ. Astron. Soc. Pac. 132, 034202 (2020).
- Ridnaia et al. 2020 Ridnaia, A. et al. A peculiar hard X-ray counterpart of a Galactic fast radio burst. Preprint at arXiv:2005.11178 (2020).
- Mereghetti et al. 2020 Mereghetti, S. et al. INTEGRAL discovery of a burst with associated radio emission from the magnetar SGR 1935+2154. Preprint at arXiv:2005.06335 (2020).
- Tavani et al. 2020 Tavani, M. et al. AGILE detection of a hard X-ray burst in temporal coincidence with a radio burst from SGR 1935+2154. The Astronomer’s Telegram 13686, 1 (2020).
- Li et al. 2020a Li, C. K. et al. Identification of a non-thermal X-ray burst with the Galactic magnetar SGR 1935+2154 and a fast radio burst with Insight-HXMT. Preprint at arXiv:2005.11071 (2020).
- Younes et al. 2017 Younes, G. et al. X-Ray and Radio Observations of the Magnetar SGR J1935+2154 during Its 2014, 2015, and 2016 Outbursts. Astrophys. J. 847, 85 (2017).
- Zhang et al. 2020a Zhang, C. F. et al. A highly polarised radio burst detected from SGR 1935+2154 by FAST. The Astronomer’s Telegram 13699, 1 (2020).
- Nan et al. 2011 Nan, R. et al. The Five-Hundred Aperture Spherical Radio Telescope (fast) Project. International Journal of Modern Physics D 20, 989–1024 (2011).
- Michilli et al. 2018 Michilli, D. et al. An extreme magneto-ionic environment associated with the fast radio burst source FRB 121102. Nature 553, 182–185 (2018).
- CHIME/FRB Collaboration et al. 2019 CHIME/FRB Collaboration et al. CHIME/FRB Discovery of Eight New Repeating Fast Radio Burst Sources. Astrophys. J. Lett. 885, L24 (2019).
- Hessels et al. 2019 Hessels, J. W. T. et al. FRB 121102 Bursts Show Complex Time-Frequency Structure. Astrophys. J. Lett. 876, L23 (2019).
- Gourdji et al. 2019 Gourdji, K. et al. A Sample of Low-energy Bursts from FRB 121102. Astrophys. J. Lett. 877, L19 (2019).
- Majid et al. 2020 Majid, W. A. et al. A Dual-band Radio Observation of FRB 121102 with the Deep Space Network and the Detection of Multiple Bursts. Astrophys. J. Lett. 897, L4 (2020).
- Whitney et al. 2010 Whitney, A., Kettenis, M., Phillips, C. & Sekido, M. VLBI Data Interchange Format (VDIF). In Navarro, R. et al., editors, Sixth International VLBI Service for Geodesy and Astronomy. Proceedings from the 2010 General Meeting 192–196 (2010).
- van Straten & Bailes 2011 van Straten, W. & Bailes, M. DSPSR: Digital Signal Processing Software for Pulsar Astronomy. Pubs. Astron. Soc. Australia 28, 1–14 (2011).
- Agarwal et al. 2019 Agarwal, D., Aggarwal, K., Burke-Spolaor, S., Lorimer, D. R. & Garver-Daniels, N. Towards deeper neural networks for Fast Radio Burst detection. Preprint at arXiv:1902.06343 (2019).
- Li et al. 2020b Li, C. K. et al. Updated catalog of X-ray bursts of SGR J1935+2154 from Insight-HXMT observations. GRB Coordinates Network 28027, 1 (2020).
- Zhang et al. 2020b Zhang, S.-N. et al. Overview to the Hard X-ray Modulation Telescope (Insight-HXMT) Satellite. Science China Physics, Mechanics, and Astronomy 63, 249502 (2020).
- Cordes & McLaughlin 2003 Cordes, J. M. & McLaughlin, M. A. Searches for Fast Radio Transients. Astrophys. J. 596, 1142–1154 (2003).
- Zhong et al. 2020 Zhong, S. Q., Dai, Z. G., Zhang, H. M. & Deng, C. M. On the Distance of SGR 1935+2154 Associated with FRB 200428 and Hosted in SNR G57.2+0.8. Preprint at arXiv:2005.11109 (2020).
- Everett & Weisberg 2001 Everett, J. E. & Weisberg, J. M. Emission Beam Geometry of Selected Pulsars Derived from Average Pulse Polarization Data. Astrophys. J. 553, 341–357 (2001).
- Oppermann et al. 2018 Oppermann, N., Yu, H.-R. & Pen, U.-L. On the non-poissonian repetition pattern of frb121102. Mon. Not. R. Astron. Soc. 475, 5109–5115 (2018).
- Oostrum et al. 2020 Oostrum, L. C. et al. Repeating fast radio bursts with WSRT/Apertif. Astron. Astrophys. 635, A61 (2020).
- Kirsten et al. 2020 Kirsten, F. et al. Simultaneous multi-frequency limits on radio emission at the time of a bright X-ray burst from SGR 1935+2154. The Astronomer’s Telegram 13735, 1 (2020).
- Hurley et al. 2020 Hurley, K. et al. IPN triangulation of a bright burst from SGR 1935+2154 on 2020-05-10 at 06:12 UT. GRB Coordinates Network 27714, 1 (2020).
- Kramer et al. 2007 Kramer, M., Stappers, B. W., Jessner, A., Lyne, A. G. & Jordan, C. A. Polarized radio emission from a magnetar. Mon. Not. R. Astron. Soc. 377, 107–119 (2007).
- Camilo et al. 2008 Camilo, F., Reynolds, J., Johnston, S., Halpern, J. P. & Ransom, S. M. The Magnetar 1E 1547.0-5408: Radio Spectrum, Polarimetry, and Timing. Astrophys. J. 679, 681–686 (2008).
- Levin et al. 2012 Levin, L. et al. Radio emission evolution, polarimetry and multifrequency single pulse analysis of the radio magnetar PSR J1622-4950. Mon. Not. R. Astron. Soc. 422, 2489–2500 (2012).
- Petroff et al. 2015 Petroff, E. et al. A real-time fast radio burst: polarization detection and multiwavelength follow-up. Mon. Not. R. Astron. Soc. 447, 246–255 (2015).
- Masui et al. 2015 Masui, K. et al. Dense magnetized plasma associated with a fast radio burst. Nature 528, 523–525 (2015).
- Ravi et al. 2016 Ravi, V. et al. The magnetic field and turbulence of the cosmic web measured using a brilliant fast radio burst. Science 354, 1249–1252 (2016).
- Wood et al. 2019 Wood, J., Fermi-GBM Team & GBM-LIGO/Virgo Group. LIGO/Virgo S190930t: Upper limits from Fermi-GBM Observations. GRB Coordinates Network 25887, 1 (2019).
- Wood & Fermi-GBM Team 2020 Wood, J. & Fermi-GBM Team. Fermi-LAT ANTARES coincidence: Upper limits from Fermi-GBM Observations. GRB Coordinates Network 26676, 1 (2020).
- Lin et al. 2020a Lin, L. et al. Stringent upper limits on pulsed radio emission during an active bursting phase of the Galactic magnetar SGRJ1935+2154. Preprint at arXiv:2005.11479 (2020).
- Lin et al. 2020b Lin, L. et al. Burst Properties of the Most Recurring Transient Magnetar SGR J1935+2154. Astrophys. J. 893, 156 (2020).
- Younes et al. 2020 Younes, G. et al. A possible polar origin for the FRB associated with a Galactic magnetar. Preprint at arXiv:2006.11358 (2020).
- Kaspi & Beloborodov 2017 Kaspi, V. M. & Beloborodov, A. M. Magnetars. Annu. Rev. Astron. Astrophys. 55, 261–301 (2017).
- Lower et al. 2020 Lower, M. E., Shannon, R. M., Johnston, S. & Bailes, M. Spectropolarimetric Properties of Swift J1818.0-1607: A 1.4 s Radio Magnetar. Astrophys. J. Lett. 896, L37 (2020).
- Burgay et al. 2018 Burgay, M. et al. Search for FRB and FRB-like single pulses in Parkes magnetar data. In Weltevrede, P., Perera, B. B. P., Preston, L. L. & Sanidas, S., editors, Pulsar Astrophysics the Next Fifty Years volume 337 of IAU Symposium 319–321 (2018).
- Spitler et al. 2016 Spitler, L. G. et al. A repeating fast radio burst. Nature 531, 202–205 (2016).
- Chime/Frb Collaboration et al. 2020 Chime/Frb Collaboration et al. Periodic activity from a fast radio burst source. Nature 582, 351–355 (2020).
- Lyutikov et al. 2020 Lyutikov, M., Barkov, M. V. & Giannios, D. FRB Periodicity: Mild Pulsars in Tight O/B-star Binaries. Astrophys. J. Lett. 893, L39 (2020).
- Beniamini et al. 2020 Beniamini, P., Wadiasingh, Z. & Metzger, B. D. Periodicity in recurrent fast radio bursts and the origin of ultralong period magnetars. Mon. Not. R. Astron. Soc. 496, 3390–3401 (2020).
- Levin et al. 2020 Levin, Y., Beloborodov, A. M. & Bransgrove, A. Precessing Flaring Magnetar as a Source of Repeating FRB 180916.J0158+65. Astrophys. J. Lett. 895, L30 (2020).
- Grossan 2020 Grossan, B. Periodic Windowed Behavior in SGR1935+2154 SGR Bursts. Preprint at arXiv:2006.16480 (2020).
- Scholz & CHIME/FRB Collaboration 2020 Scholz, P. & CHIME/FRB Collaboration. A bright millisecond-timescale radio burst from the direction of the Galactic magnetar SGR 1935+2154. The Astronomer’s Telegram 13681, 1 (2020).
- Bochenek et al. 2020c Bochenek, C. et al. Independent detection of the radio burst reported in ATel #13681 with STARE2. The Astronomer’s Telegram 13684, 1 (2020).
- Ursi et al. 2020 Ursi, A. et al. AGILE detection of a short and hard X-ray burst possibly related to SGR 1935+2154. GRB Coordinates Network 27687, 1 (2020).
- Verrecchia et al. 2020 Verrecchia, F. et al. AGILE detection of a burst from SGR 1935+2154 on May 10, 2020. GRB Coordinates Network 27727, 1 (2020).
- Li et al. 2020c Li, X. B. et al. Insight-HXMT detection of a short bright burst from SGR 1935+2154. GRB Coordinates Network 27688, 1 (2020).
- Gendreau et al. 2016 Gendreau, K. C. et al. The Neutron star Interior Composition Explorer (NICER): design and development. In Space Telescopes and Instrumentation 2016: Ultraviolet to Gamma Ray volume 9905 of Society of Photo-Optical Instrumentation Engineers (SPIE) Conference Series 99051H (2016).
- Gehrels et al. 2004 Gehrels, N. et al. The Swift Gamma-Ray Burst Mission. Astrophys. J. 611, 1005–1020 (2004).
- Meegan et al. 2009 Meegan, C. et al. The Fermi Gamma-ray Burst Monitor. Astrophys. J. 702, 791–804 (2009).
- Lorimer 2011 Lorimer, D. R. SIGPROC: Pulsar Signal Processing Programs (2011).
- Keimpema et al. 2015 Keimpema, A. et al. The SFXC software correlator for very long baseline interferometry: algorithms and implementation. Experimental Astronomy 39, 259–279 (2015).
- van Straten et al. 2011 van Straten, W. et al. PSRCHIVE: Development Library for the Analysis of Pulsar Astronomical Data (2011).
- van Straten et al. 2010 van Straten, W., Manchester, R. N., Johnston, S. & Reynolds, J. E. PSRCHIVE and PSRFITS: Definition of the Stokes Parameters and Instrumental Basis Conventions. Pubs. Astron. Soc. Australia 27, 104–119 (2010).
- Han et al. 2018 Han, J. L., Manchester, R. N., van Straten, W. & Demorest, P. Pulsar Rotation Measures and Large-scale Magnetic Field Reversals in the Galactic Disk. Astrophys. J. Suppl. Ser. 234, 11 (2018).
- Johnston & Kerr 2018 Johnston, S. & Kerr, M. Polarimetry of 600 pulsars from observations at 1.4 GHz with the Parkes radio telescope. Mon. Not. R. Astron. Soc. 474, 4629–4636 (2018).
- Cordes & Lazio 2002 Cordes, J. M. & Lazio, T. J. W. NE2001.I. A New Model for the Galactic Distribution of Free Electrons and its Fluctuations. Preprint at astro-ph/0207156 (2002).
- Yao et al. 2017 Yao, J. M., Manchester, R. N. & Wang, N. A New Electron-density Model for Estimation of Pulsar and FRB Distances. Astrophys. J. 835, 29 (2017).
- Kirsten et al. 2019 Kirsten, F. et al. Probing Pulsar Scattering between 120 and 280 MHz with the MWA. Astrophys. J. 874, 179 (2019).
- Geyer et al. 2017 Geyer, M. et al. Scattering analysis of LOFAR pulsar observations. Mon. Not. R. Astron. Soc. 470, 2659–2679 (2017).
- Meyers et al. 2017 Meyers, B. W. et al. Spectral Flattening at Low Frequencies in Crab Giant Pulses. Astrophys. J. 851, 20 (2017).
- Williamson 1972 Williamson, I. P. Pulse broadening due to multiple scattering in the interstellar medium. MNRAS 157, 55 (1972).
- Gaensler 2014 Gaensler, B. M. GRB 140705A / SGR 1935+2154: Probable association with supernova remnant G57.2+0.8. GRB Coordinates Network 16533, 1 (2014).
- Simard & Ravi 2020 Simard, D. & Ravi, V. Scintillation can explain the spectral structure of the bright radio burst from SGR 1935+2154. Preprint at arXiv:2006.13184 (2020).
9 Additional information
Correspondence and requests for material should be address to F.K.
10 Acknowledgements
We would like to thank Richard Blaauw and Paul van Dijk for scheduling and running the observations at Westerbork. At Onsala we acknowledge the help of Eskil Varenius with running the observations at X-band on the Onsala 20-m telescope and we are thankful to Mitchell Mickaliger for helping with the initial setup for running FETCH. We appreciate the help of Nathalie Degenaar with interpreting the X-ray observations and we are in debt to Aard Keimpema who modified the software correlator SFXC to our needs. We also thank George Younes for useful discussions; and we thank Shri Kulkarni, Vikram Ravi, Walid Majid, Jonathan Katz, Aaron Tohuvavohu, and Bruce Grossan for helpful comments. F.K. acknowledges support by the Swedish Research Council. J.v.d.E. is supported by the Netherlands Organisation for Scientific Research (NWO). Research at the University of Amsterdam and ASTRON is supported by an NWO Vici grant to J.W.T.H. This work is based in part on observations carried out using the 32-m radio telescope operated by the Institute of Astronomy of the Nicolaus Copernicus University in Toruń (Poland) and supported by a Polish Ministry of Science and Higher Education SpUB grant.
11 Author contributions
F.K. wrote and ran the search pipeline, led the observations at Onsala, interpreted the data and led the paper writing. M.P.S. ran the scattering analysis, created Figs. 1–5 and populated Table 4. M.J. performed the Weibull analysis and wrote the associated sections. M.P.S. and M.J. co-led the Westerbork observing campaign. K.N. ran the polarisation analysis, created Fig. 6, and wrote the respective sections. J.v.d.E. searched and analysed the X-ray observations, wrote the respective sections and populated Table 3. J.W.T.H interpreted the data scientifically, supervised student work, and wrote parts of the manuscript. M.P.G. led the observations at Toruń and wrote the section describing those data. J.Y. supported the observations at Onsala and also interpreted the data.
12 Competing interests
The authors declare no competing interests.