Anharmonic theory of superconductivity in the high-pressure materials
Abstract
Electron-phonon superconductors at high pressures have displayed the highest values of critical superconducting temperature on record, now rapidly approaching room temperature. Despite the importance of high- superconductivity in the quest for room-temperature superconductors, a mechanistic understanding of the effect of pressure and its complex interplay with phonon anharmonicity and superconductivity is missing, as numerical simulations can only bring system-specific details clouding out key players controlling the physics. Here we develop a minimal model of electron-phonon superconductivity under an applied pressure which takes into account the anharmonic decoherence of the optical phonons. We find that behaves non-monotonically as a function of the ratio , where is the optical phonon damping and the optical phonon energy at zero pressure and momentum. Optimal pairing occurs for a critical ratio when the phonons are on the verge of decoherence (“diffuson-like” limit). Our framework gives insights into recent experimental observations of as a function of pressure in the complex BCS material TlInTe2.
I Introduction
When a crystal lattice is subjected to a (hydrostatic) pressure deformation, its phonon frequencies change in response to the change of volume, in a way which is controlled by the materials’s Grüneisen parameter, hence by the anharmonicity of the vibration modes. However, the effects of these changes in the phonon frequencies, and of the related anharmonicity, on the superconducting properties of a material have largely remained poorly understood. Filling this knowledge gap is an urgent problem in order to develop an understanding of superconductivity in materials under pressure, which include the highest- values recorded so far in the high-pressure hydride materials Drozdov et al. (2015); Quan et al. (2019); Drozdov et al. (2019); Pickard et al. (2020).
On one hand, a large number of experimental works have shown how the superconducting critical temperature changes as a function of pressure for a variety of materials. For elemental superconductors, a commonly observed trend in experiments is a decrease of with increasing , which has been theoretically predicted upon analyzing the behaviour of the Eliashberg electron-phonon coupling function as a function of , see Refs.Trofimenkoff and Carbotte (1969, 1970); N.V. Zavaritskii (1971); Hodder (1969); Brandt and Ginzburg (1969). A similar behaviour is seen in many technologically important materials, such as Nb3Sn, see Ref. Ren et al. (2017). An increase of typically shifts the distribution to higher frequencies, thus driving the system into an unfavorable regime as per the Bergmann-Rainer criterion Bergmann and Rainer (1973) for the electron-phonon coupling. Notable exceptions to the above standard rule for elemental superconductors is represented by -uranium Gardner and Smith (1967); Brandt and Ginzburg (1969), while another puzzling material such as bismuth is known to have a very low at ambient pressure (on the order of the mK) Prakash et al. (2017); Behnia (2017) and a decent (K) at higher pressures Wittig (1966). In both these systems, new effects play a role. In -uranium the phonon density of states is very rich of soft vibrational modes Manley et al. (2001), traditionally attributed to anharmonicity in crystals Baggioli and Zaccone (2019), although their origin in -uranium is still under debate Manley et al. (2001). In bismuth, instead, the Debye energy is very close to the Fermi energy, thus leading to an almost vanishing attraction for the Cooper pairs Behnia (2017). At high pressure, a more close-packed structure becomes favourable, which changes the underlying phonon physics leading to more favourable conditions for pairing.
On the other hand, exploring the effect of pressure on more complex non-elemental materials has led to a zoology of trends of as a function of , see e.g. Ref. Lorenz and Chu (2005). In such materials, exceptions to canonical behavior with pressure according to phonon frequency shifts and the Bergmann-Rainer criterion lay abound. In almost all cases, understanding and isolating the key ingredients that affect as a function of pressure at the level of model Hamiltonians is a futile exercise given their incredible microscopic complexity. The cuprates form a case in point where even the pairing mechanism is highly debated and the quasiparticle picture is ill-defined. Nevertheless, in phonon mediated superconductors, numerical simulations have provided invaluable quantitative insights into the phonon dispersion relations, and into the structural stability of superconducting compounds, including many new materials.
More specifically, numerical calculations allow one to estimate the anharmonicity of the various phonon modes involved, by comparing fully anharmonic calculations with harmonic calculations Errea et al. (2015); Pickard et al. (2020). As a matter of fact, early theoretical approaches Trofimenkoff and Carbotte (1969, 1970); N.V. Zavaritskii (1971); Hodder (1969); Brandt and Ginzburg (1969) ignored phonon anharmonicity while other approaches Ganguly (1976); Karakozov and Maksimov (1978); Freericks et al. (1996), including more recent works on the high- hydrides Errea et al. (2015); Rousseau and Bergara (2010); Errea et al. (2013, 2014, 2016); Sano et al. (2016); Borinaga et al. (2016a, b); Szcześniak and Zemła (2015); Kostrzewa et al. (2020); Errea et al. (2020); Camargo-MartÃnez et al. (2020) focus mainly on the phonon energy renormalizations neglecting anharmonic damping/decoherence. The latter is a key ingredient that is needed to properly describe the effect of pressure on phonon-mediated Cooper pairing, as will be shown in our work. Thus a mechanistic picture of high pressure effects on the superconducting state which exploits the synergy between anharmonic phonon decoherence and phonon energy renormalization is missing in most materials including elemental superconductors.
In this paper, we develop a minimal version of such a theory by working with a gap equation in the weak coupling BCS limit. Crucially, to mediate Cooper pairing, we implement optical phonon propagators which contain the effect of an external applied pressure and the resulting anharmonic decoherence via the optical phonon damping Klemens (1966); Setty et al. (2020a). The analytical theory is able to provide predictions that allow one to disentangle the complex interplay between pressure-induced changes of optical phonon energy and anharmonic decoherence, and their effects on the . The results of our theory are presented in the specific context of a recent high pressure study on the superconductor TlInTe2. Different physical regimes are predicted, which include (i) monotonic decrease of with as observed in many systems; (ii) non-monotonic trend with a minimum, in conjunction with optical phonon softening, which qualitatively explains recent experiments in TlInTe2 from Ref.Yesudhas et al. (2020); (iii) non-monotonic trend with a maximum in a regime of incoherent phonons where the quasiparticle picture breaks down.
We emphasize that our goal is to approach this question from a phenomenological viewpoint with key inputs from experiments. We do not wish to provide accurate predictions of as a function of pressure – an endeavor elusive to even state-of-art numerical methods. Rather, we take the perspective that the coordination between decoherence and frequency renormalization induced by phonon anharmonicity can play a role dominant enough to provide a reasonable qualitative understanding of experimental data. From such a proof-of-principle demonstration, our expectation is that this synergy between energy scales must necessarily constitute a key ingredient of any serious future numerical first principle study that aims to understand superconducting properties of materials such as TlInTe2.
II Experimental standpoint
Recent high pressure Raman spectroscopy, X-ray diffraction and transport measurements in TlInTe2 along with first-principles band structure calculations uncovered a change in Fermi surface topology due to a Lifshitz transition between 6.5-9 GPa, leading to the formation of enlarged electron pockets at the Fermi level. This feature is preceded by a superconducting transition at 5.7 GPa with . With increasing pressure, the decreases steadily and rises again with a minimum located around 10 GPa. Concurrent to this V shaped “anomaly”, there is a further softening of the phonon mode. It is natural to attribute such a V-shaped behavior to changes in electronic density of states or the softening of the phonon mode as was concluded by the authors of Ref. Yesudhas et al. (2020). After all, both these quantities play key roles in controlling superconducting properties especially in phonon mediated superconductors.
But on closer examination, these arguments are debatable at best. First, the theoretically calculated electronic density of states (DOS) from the electron pocket becomes larger in the regime between 6GPa and 9GPa due to the Lifshitz transition. However, this is exactly the regime where decreases, thus eliminating the electronic DOS as the key driver for the observed trend in . Second, the softening of the phonon mode occurs around GPa greater than the pressure where is minimum. But any argument justifying a decrease in with increasing phonon frequency implicitly invokes the Bergmann-Rainer criterion. While this criterion works well for , the same argument fails when since a softening phonon mode would imply a second dip in approximately symmetric with respect to . This however seems to contradict experimental observations.
Having ruled out a dominant role of (purely) phonon frequency shifts or electronic DOS in explaining observed experimental behavior, we turn to the possibility that the phonon linewidth could be a key player in determining superconducting properties in TlInTe2. Raman data as a function of pressure indicates that anharmonicity in this material is strong enough to significantly increase the phonon linewidth () with respect to the peak frequency , the latter controlled by the key parameter , but weak enough so that the phonons remain coherent (). As we will see below, this is precisely the regime where correlates with the ratio . The delicate balance in hierarchy of scales and the possibility of disentangling other effects such as electronic DOS and phonon frequency shifts, makes TlInTe2 an ideal playground to test the hypothesis presented in this paper. We note that the experimental situation in TlInTe2 is evolving. For example, it is still not clear whether the normal state yielding the superconductor exhibits all conventional Fermi liquid properties. To date, there are no attempts to determine the pairing symmetry of the superconducting state either. Even the nature and full symmetry characterization of phonons responsible for pairing, the strength of individual electron-phonon couplings etc, is undetermined. Furthermore, there exist uncertainties between experiment and theory in the measurement of the bulk modulus and its derivative, which could in principle change the finer details of the relationship between pressure and frequency. So far, we know of no improved equation of state that accounts for all the experimental measurable quantities precisely, so we use the best candidate available in literature, i.e. the well-known Birch-Murnaghan equation of state for deriving the relationship between pressure and frequency (used also in the experimental study of Ref. Yesudhas et al. (2020)). Hence we keep our formalism simple but general enough to accommodate these uncertainties until future experiments paint a more complete picture of the material’s phenomenology.
III Theoretical framework
III.1 Optical phonon energy under pressure
We start by analyzing the effect of external pressure on the optical phonons of a crystal lattice. The main effect of pressure is to induce a negative volume change of the material. The change of volume, in turn, is related to a change of phonon frequency, through the Grüneisen parameter, , via Kunc et al. (2003):
| (1) |
where refers to optical phonon energy at zero ambient pressure. The above relations apply to individual phonon modes with frequency .
The volume change is related to the change of pressure as described by the Birch-Murnaghan equation of state Birch (1947), which is derived based on nonlinear elasticity theory, and provides an expression for . Upon replacing with in (1), one obtains the following relation between the optical phonon frequency and the applied pressure Birch (1947):
| (2) |
with . Upon inverting the above Eq.(2) to obtain as a function of , it is clear that is a monotonically increasing function of in the regime of interest here, with the increase being modulated by anharmonicity through . Also, is the bulk modulus, while with .
In the above relations, the frequency refers to the real part of the phonon dispersion relation (which already contains the renormalization shift due to anharmonicity Xu et al. (2008)), whereas the imaginary part of the dispersion relation is related to the phonon damping coefficient (the inverse of the phonon lifetime), as follows (e.g. Eqs. (23)-(27)in Ref. Xu et al. (2008))
| (3) | |||||
| (4) | |||||
| (5) |
Quantitative numerical calculation of can be done using the Self-Consistent Phonon (SCP) methodology Xu et al. (2008); Tadano and Tsuneyuki (2018), for specific systems Tadano and Tsuneyuki (2015), but this is not the goal of our paper, which is rather focused on generic qualitative trends in terms of the effect of on the pairing and on . Hence, denotes the renormalized phonon energy measured e.g. in Raman scattering (i.e. the Raman shift), while represents the linewidth of the Raman peak. Let us emphasize that these expressions are at leading order in the momentum and higher order corrections are neglected at this stage.
We now introduce a key dimensionless parameter for the subsequent analysis
| (6) |
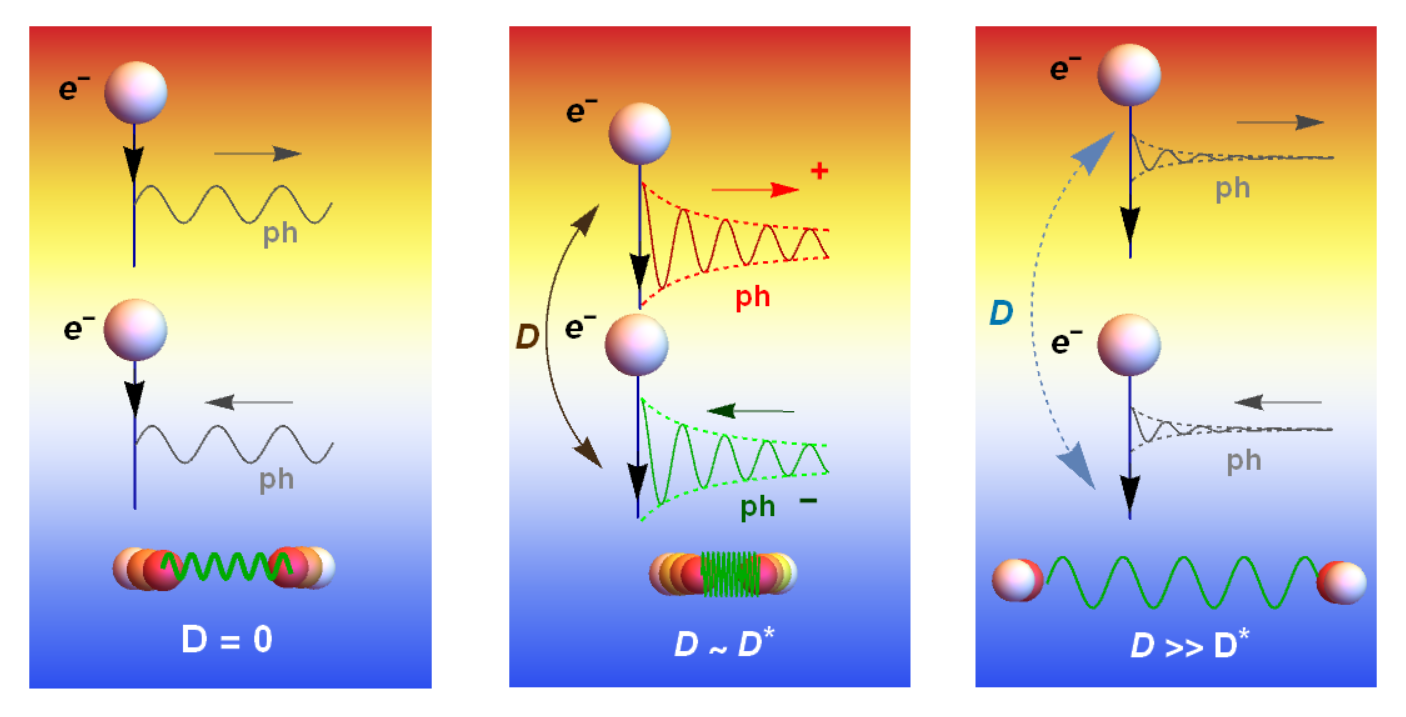
which quantifies the degree of coherence of the phonon. Low values of signify high coherence of the phonons, which can thus be treated as approximately independent quasiparticles, whereas, at the opposite end of the spectrum, very large values correspond to incoherent vibrational excitations in the diffusive regime (“diffusons” in the language introduced by Allen, Feldman and co-workers Allen et al. (1999)). The schematic picture that will emerge from the subsequent theoretical analysis is anticipated in Fig.1.
In the following section, we introduce the theoretical framework for the Cooper pairing and we will start by considering how the superconducting critical temperature varies as a function of .
III.2 Gap equation with anharmonic phonon damping
For a generic Fermionic Matsubara frequency and momentum k, we denote the gap function as . We assume throughout a quadratic dispersion relation for the electronic band. With a constant coupling , the gap equation can be derived from the Eliashberg equations in the one-loop ( weak coupling) approximation, and takes the form Marsiglio and Carbotte (2008); Kleinert (2018)
where is the inverse temperature and is the volume. In Matsubara frequency space, we choose the pairing mediator to be a damped optical phonon given by the bosonic propagator Ziman (1969)
| (8) |
where is the bosonic Matsubara frequency, is the phonon dispersion, and the damping factor, , is a constant independent of momentum for high-frequency optical phonons Klemens (1966). In accordance with the Klemens formula Klemens (1966), one can also include an additional prefactor, , in the damping term to account for a temperature dependent phonon linewidth. We find that this has a negligible effect on the results discussed below. The factor controls the strength of the damping term and may change with pressure. The leading order contribution to the square of the dispersion is where . This is the first momentum correction which was neglected in Eq.(5). Assuming an isotropic, frequency-independent gap , we can set the external frequency and momentum to zero without any loss of generality (see supplementary note Not with regards to the simplification). Converting the resulting summation into an energy integral (and assuming a quadratic dispersion relation for the fermions), the gap equation becomes
where . Here we have defined the effective coupling constant , is the density of states at the Fermi level, and is the chemical potential. We can now utilize the energy integral identity in the limit of large chemical potential to yield the gap equation
We can now perform the final Matsubara sum using methods described in Ref. Larkin and Varlamov (2005) after seeking a condition for by setting . Defining and leads to an equation for that can be numerically solved given by
| (11) |
where is the digamma function, the primed quantities are dimensionless and are defined as , , and so on.
IV Results
IV.1 Schematic dependence on optical phonon energy and anharmonicity
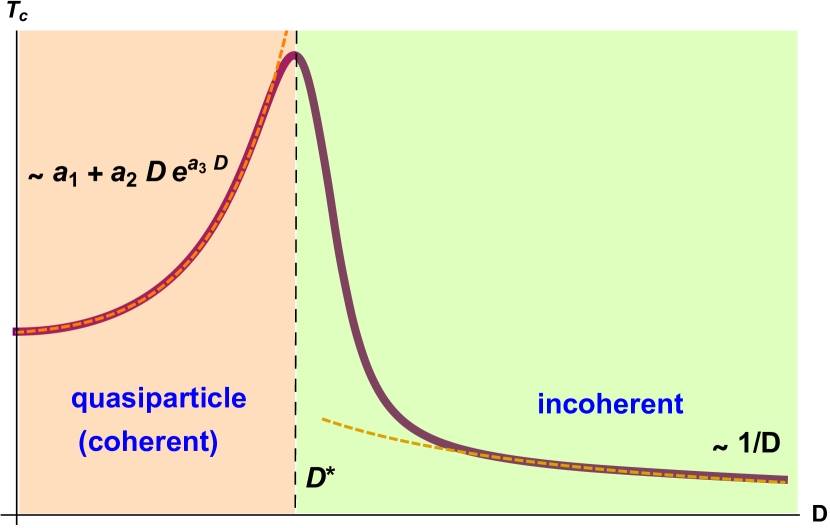
Upon numerically solving Eq.(11) for a constant damping coefficient , we can study the evolution of as a function of the dimensionless parameter . The trend is shown in Fig.2. At low values, increases with , then goes through a maximum after which it then decays sharply upon further increasing . The maximum appears around with its exact value determined by the microscopic parameter . This corresponds exactly to the scale at which the real and the imaginary part of the phonon dispersion relation become comparable () and the phonons turn into quasi-localized “diffuson-like” excitations Allen et al. (1999). In this sense, this is analogous to the Ioffe-Regel crossover scale Ioffe and Regel (1960).
The mechanistic picture shown in Fig.1 can be used to understand the non-monotonic dependence of upon the anharmonic decoherence parameter . To begin, we note that in the absence of , the gap equation in Eq. LABEL:Integral-GapEqn has even terms only in the Matsubara frequency transfer . Hence both constructive Stokes (S-) and destructive anti-Stokes (aS-) processes, which emit and absorb energy respectively, contribute to the gap equation equivalently. However, when is non-zero, Eq. LABEL:Integral-GapEqn is sensitive to the sign of the energy transfer, thereby distinguishing the two processes. From this property, it is clear that the energy integral and Matsubara summations in Eqs. LABEL:Integral-GapEqn and LABEL:MSum lead to terms that are proportional to in the numerator of the gap equation. Provided , this effectively increases the electron-phonon coupling and hence the Cooper pair binding energy. For values of much larger than , the phonons are extremely damped and S- and aS- processes again contribute approximately equally to the gap equation, thus reducing the effective electron-phonon coupling.
At low values of damping (low- regime) and , the real part of the dispersion relation dominates over the imaginary part, and the phonons behave like coherent quasiparticles with well-defined momentum . In the opposite regime of large anharmonic damping (hence large ), we have that , hence the phonons lose their coherence and the quasiparticle approximation breaks down. These two regimes correspond to two different Cooper pairing regimes. One regime we call the “coherent” regime (because here phonons behave like coherent quasiparticles), where correlates positively with anharmonic damping (hence where damping enhances ). The second regime we call “inchoerent” and here, instead, decreases with further increasing the anharmonic damping.
Notice that, in the coherent regime, increases (decreases) as the optical phonon energy decreases (increases), whereas the opposite trends apply in the incoherent regime.
This implies that the effect of pressure can either promote or depress superconductivity depending on the underlying physics of the optical phonons in a given lattice. In the Appendix, we provide additional plots for the variation of with other physical parameters and appearing in Eq. 11. For low and high , is barely affected by and whereas the peak value of is suppressed at critical with increasing values of both these parameters. On the other hand, the peak itself increases with while it is barely affected by .
We will show below that these two regimes lead to radically different scenarios in terms of the dependence of on the external pressure . This conceptual schematization will be shown in the next sections to hold a number of consequences for a deeper mechanistic understanding of the effect of pressure on superconductivity in complex materials.
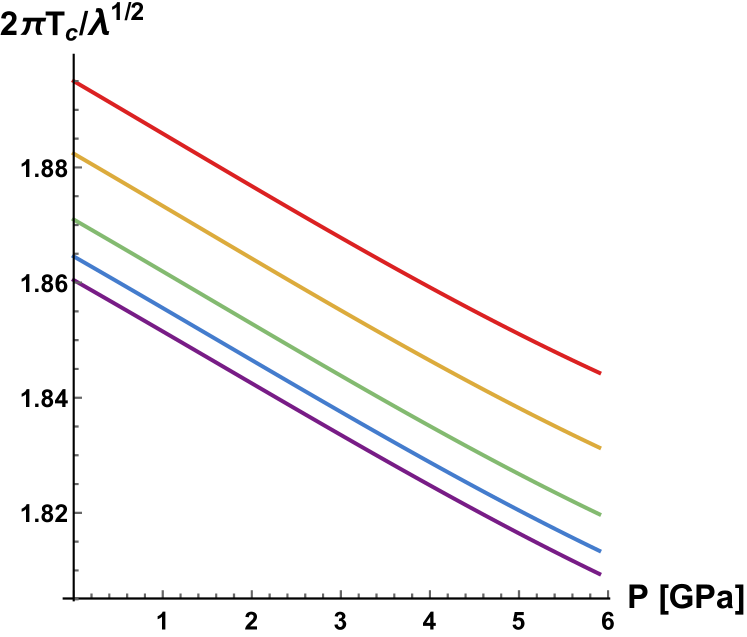
In Fig.2 we assumed that the pairing is mediated by high-frequency optical phonons near the Debye frequency for which the Klemens model gives a simplified (constant) anharmonic damping coefficient . In the more general case, the Klemens damping is given by , where is a prefactor which depends on the microscopic physics which governs the decay of the optical phonon into two acoustic phonons. Notably, , where is the lattice Grüneisen parameter introduced above. The latter is a function of the interatomic potential Krivtsov and Kuz’kin (2011), hence of the electronic orbital/bonding physics, and can be easily computed, for a given phonon mode in a given material, from first principles Cuffari and Bongiorno (2020).
Using this more general Klemens formula for a generic optical phonon that mediates the pairing, we obtain the trends shown in Fig.3. A linear decreasing trend of as a function of is predicted by our theory for the incoherent-phonon (strongly anharmonic) regime. A linearly decaying trend of with has been recently observed in the strongly anharmonic AlH3 high-pressure hydride Hou et al. (2021) as well as in the SC-I phase of CeH10 in Ref. Chen et al. (2021). In more standard systems, a linear decay of with increasing has been reported for in the literature for simple (e.g. elemental) superconductors Brandt and Ginzburg (1969); Boughton et al. (1970); Lorenz and Chu (2005).
IV.2 Theoretical analysis of superconductivity in TlInTe2 at high pressure
In this section, we explore the potential of the above framework to rationalize recent experimental data where highly non-trivial (e.g. non-monotonic) dependencies of upon have been observed, and for which a theoretical explanation is lacking. We study the paradigmatic case of TlInTe2, for which accurate experimental data are available for the phonon mode involved in the Cooper pairing. Data are available in terms of the optical phonon energy and of the anharmonic damping, as measured by Raman scattering, and also for , as a function of pressure Yesudhas et al. (2020).
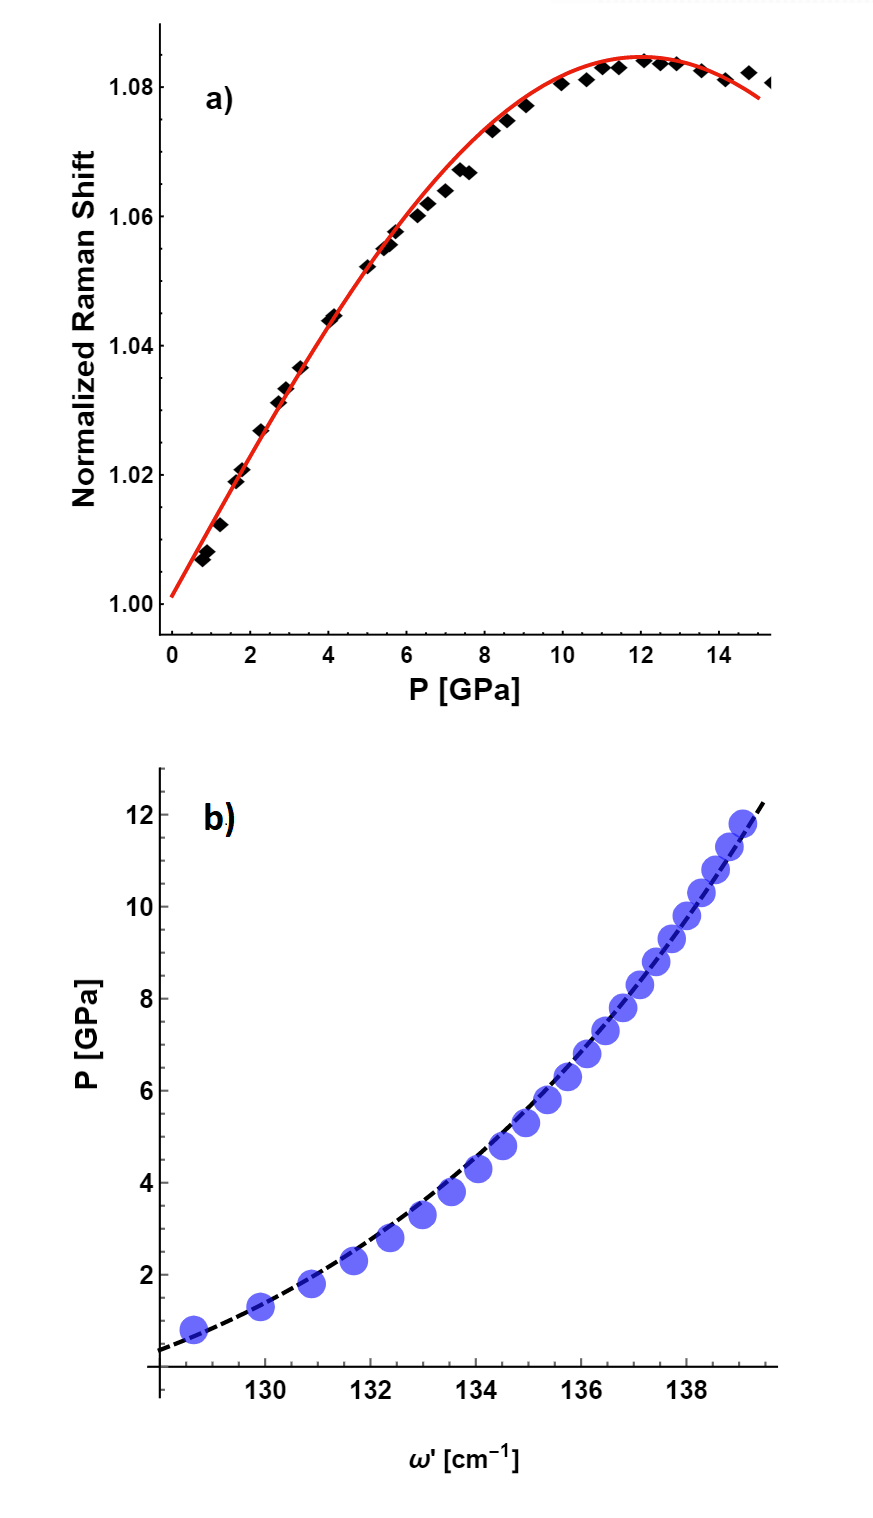
We start by fitting the experimental data for the frequency of the Raman-active optical phonon (renormalized by anharmonicity) as a function of pressure, displayed in Fig.4 (a). By using Eq.2 for the fitting, we get:
| (13) |
where we fixed as found experimentally from the P-V relation in Ref. Yesudhas et al. (2020). The value that we found for is close to value found for the mode in this material Yesudhas et al. (2020), , and larger values (up to ) were also reported in the literature Ves (1990). Also the value of the bulk modulus that we found from our fitting (15GPa) is quite close to the experimental value (19GPa) reported in Ref. Yesudhas et al. (2020).
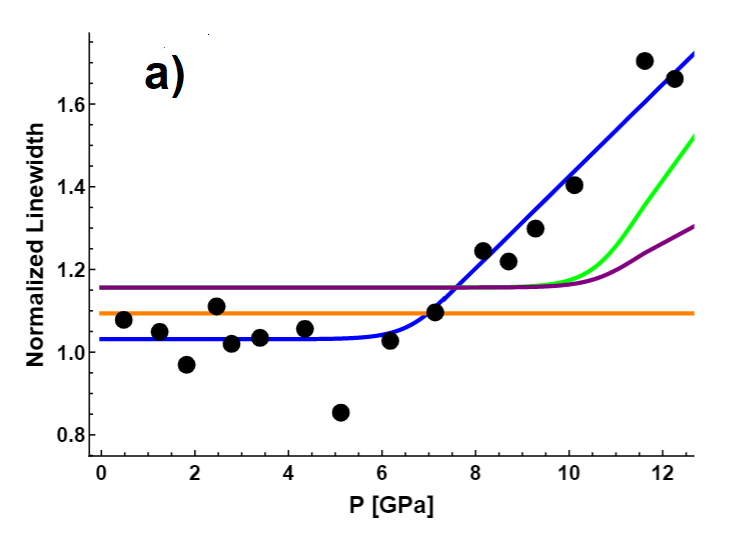
The fitting is shown in Fig.4(b), where the frequency values refer to . The latter has been obtained by using Eq.5 in combination with Eq.2. The optical mode energy increases upon increasing in a conventional way Kunc et al. (2003) up to GPa, after which phonon softening, linked to the increase of anharmonic damping is observed upon further increasing , as shown in Fig. 4(a).
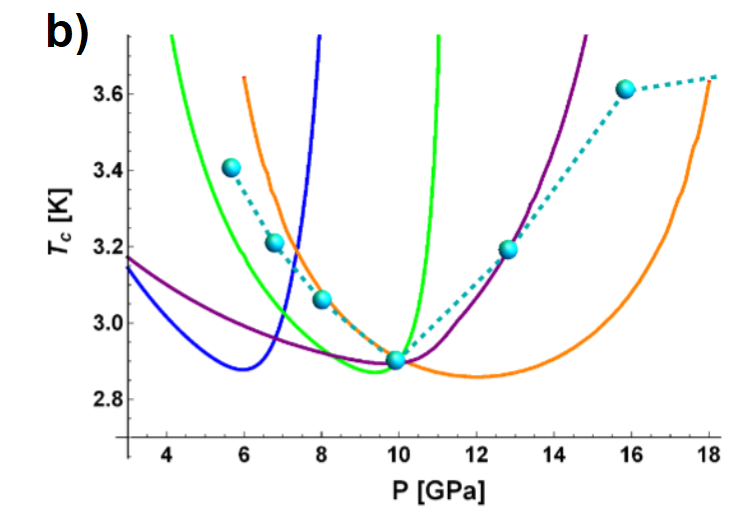
The increase of anharmonicity with pressure is clearly evidenced by the behaviour of the Raman peak linewidth , as shown in Fig.5(a). Notice that the percentile growth of the linewidth under pressure is much larger than that of the normalized Raman shift. In this sense, the material is characterized by giant anharmonicities and the damping effects are fundamental. Here, in the same panel, different empirical trends are shown, alongside the experimental data which manifest a significant scatter. In general, for this system, such that this case belongs to the “coherent” regime discussed in the previous section and in Fig.2. Indeed, we checked that and differ by only about at all values. These different trends for have been implemented, alongside the fitted optical phonon energy from Fig.4, into our theoretical gap-equation framework for the prediction of presented in the previous section of this paper. The resulting theoretical trends are shown in Fig.5 in comparison with the experimental data from Ref. Yesudhas et al. (2020), as a function of the applied pressure.
All the trends in Fig. 5 (a) clearly lead to the same qualitative dependence of on , with a minimum. The physics behind this trend is explained by our theoretical framework: at low the decreases because of the increase in , which induces an increase of the optical phonon frequency or . The subsequent phonon softening leads to the minimum and to an inversion of the trend: upon further increasing the pressure the starts to rise. This is due to the fact that lower values lead to a Stokes/anti-Stokes constructive interference (in the presence of anharmonic damping), which enhances the Cooper pairing Setty (2019); Setty et al. (2020b). This behaviour, with a minimum in is independent of the particular trend with , and in fact occurs even for constant with .
The role of the trend with is to control the position of the minimum as a function of pressure. Also, importantly, the presence of a rise in leads to a stronger rise after the minimum, which confirms that in the “coherent” regime the can be strongly enhanced by the anharmonic damping, as discussed in the context of Fig.2. This finding has deep implications for high- hydrogen-based materials, where the anharmonic damping of the optical phonons can be significant and may be tuned by the material design. Also, phonon softening could also be enhanced by the electron-phonon interaction itself as discussed in Refs. Marsiglio (2020); Esterlis and Schmalian (2019).
V Conclusion
We presented a theory of the pressure effect on Cooper pairing in superconductors where the pairing is mediated by generic bosonic excitations. Our theory is based on solving the gap equation with a bosonic propagator that is damped due to anharmonic decoherence. A specific calculation is presented for optical phonons which takes into account: (i) the anharmonicity of the phonon via the Klemens’ damping, (ii) the effect of pressure on the phonon frequency. The theory identifies two fundamental regimes as a function of the dimensionless ratio between anharmonic phonon damping and phonon frequency. At low values of this ratio, is strongly enhanced by anharmonicity and, at the same time, decreases with increasing pressure. At large values of the ratio (after a maximum), where the phonons are no longer well-defined quasiparticles, instead correlates positively with pressure and is lowered by anharmonicity (see Fig.2). Optimal pairing occurs for a critical ratio when the phonons are on the verge of decoherence (“diffuson” limit).
A linearly decreasing correlation between and P Lorenz and Chu (2005) is predicted to occur in the regime of strongly anharmonic phonons. Furthermore, the theory provides a qualitative description of recent experimental data on TlInTe2 for which phonon frequencies, anharmonic phonon damping and were all measured experimentally. It predicts that initially decreases with as a consequence of the optical phonon energy increasing with , but then goes through a minimum, as the optical phonon starts to soften and to become more anharmonic, after which it rises with . The predicted behaviour is well supported by the experimental data.
This theoretical picture provides a mechanistic rationale for the pressure effect on superconductivity in TlInTe2, by physically describing different regimes of negative/positive pressure effect on . By clarifying the deep interplay between anharmonicity of the bosonic glue and pressure effects on the pairing mechanism, the theory provides new guidelines for material design, which may prove useful for discovering and/or engineering new materials with enhanced . In future work, the presented framework could be combined with models of strain-dependent critical properties in technologically important materials such as Nb3Sn, where anharmonic phonon generation has been recently shown to play a key role Valentinis et al. (2013).
Acknowledgements M.B. acknowledges the support of the Spanish MINECOas “Centro de Excelencia Severo Ochoa” Programme under grant SEV-2012-0249. C.S. is supported by the U.S. DOE grant number DE-FG02-05ER46236. A.Z. acknowledges financial support from US Army Research Laboratory and US Army Research Office through contract nr. W911NF-19-2-0055.
Appendix
In Fig. 4, the functional form for the empirical fits of the phonon linewidth is given by the following expression:
| (14) |
This fitting function works well up to GPa. Interestingly it seems to capture also the turning of the data point between but it definitely fails in capturing the last two points of the dataset.
In Fig. 5, the Raman linewidth is normalized with respect to the experimental zero pressure value, taken as . The curves shown in the panel (a) of Fig.5 are given by:
| (15) | |||
| (19) | |||
| (23) | |||
| (27) |
Additionally, the parameters for the panel (b) are as follow:
| (28) | |||
| (29) | |||
| (30) | |||
| (31) |
where we set (the optical phonon stiffness) and . This corresponds to for a BCS superconductor with meV . We have checked that the dependence of on is predominantly controlled by the -dependence of , whereas the contribution of the -dependence of in the square root appearing in the expression for is much smaller (which is also consistent with our conclusions that the experimental data of TlInTe2 are largely in the weak-anharmonicity coherent-phonon regime).
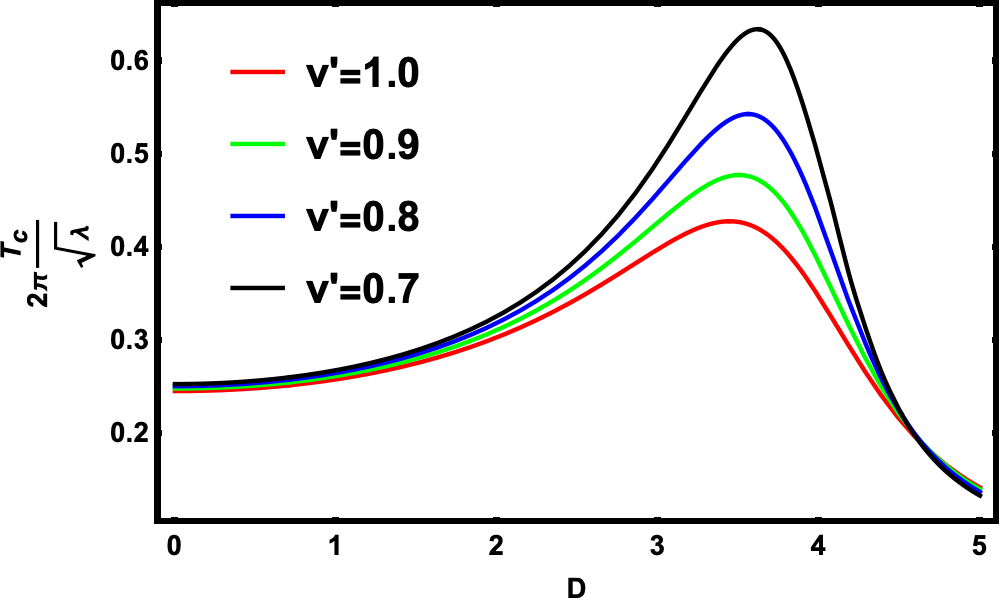
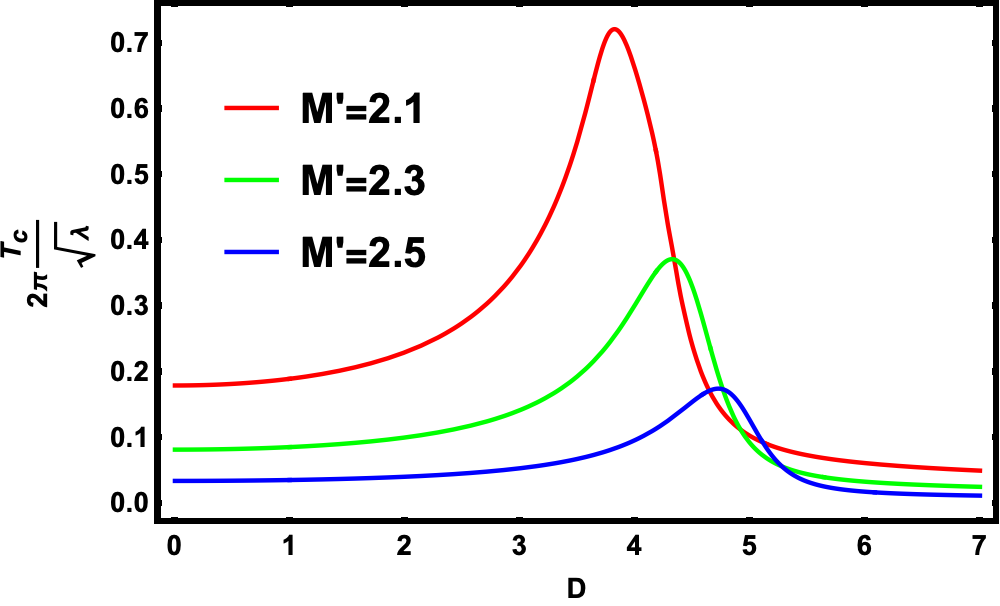
In Fig. 6, we also plot the dimensionless as a function of for various and . As stated in the main text, increasing both and reduces the peak . While barely has an effect on the critical , increasing increases .
References
- Drozdov et al. (2015) A. P. Drozdov, M. I. Eremets, I. A. Troyan, V. Ksenofontov, and S. I. Shylin, Nature 525, 73 (2015).
- Quan et al. (2019) Y. Quan, S. S. Ghosh, and W. E. Pickett, Phys. Rev. B 100, 184505 (2019).
- Drozdov et al. (2019) A. Drozdov, P. Kong, V. Minkov, S. Besedin, M. Kuzovnikov, S. Mozaffari, L. Balicas, F. Balakirev, D. Graf, V. Prakapenka, et al., Nature 569, 528 (2019).
- Pickard et al. (2020) C. J. Pickard, I. Errea, and M. I. Eremets, Annual Review of Condensed Matter Physics 11, 57 (2020), https://doi.org/10.1146/annurev-conmatphys-031218-013413 .
- Trofimenkoff and Carbotte (1969) P. Trofimenkoff and J. Carbotte, Solid State Communications 7, 661 (1969).
- Trofimenkoff and Carbotte (1970) P. N. Trofimenkoff and J. P. Carbotte, Phys. Rev. B 1, 1136 (1970).
- N.V. Zavaritskii (1971) A. V. N.V. Zavaritskii, E.S. Itskevich, Soviet Physics JETP 60, 1408 (1971).
- Hodder (1969) R. E. Hodder, Phys. Rev. 180, 530 (1969).
- Brandt and Ginzburg (1969) N. B. Brandt and N. I. Ginzburg, Soviet Physics Uspekhi 12, 344 (1969).
- Ren et al. (2017) Z. Ren, L. Gamperle, A. Fete, C. Senatore, and D. Jaccard, Phys. Rev. B 95, 184503 (2017).
- Bergmann and Rainer (1973) G. Bergmann and D. Rainer, Zeitschrift für Physik 263, 59 (1973).
- Gardner and Smith (1967) W. E. Gardner and T. F. Smith, Phys. Rev. 154, 309 (1967).
- Prakash et al. (2017) O. Prakash, A. Kumar, A. Thamizhavel, and S. Ramakrishnan, Science 355, 52 (2017), https://science.sciencemag.org/content/355/6320/52.full.pdf .
- Behnia (2017) K. Behnia, Science 355, 26 (2017).
- Wittig (1966) J. Wittig, Zeitschrift für Physik 195, 228 (1966).
- Manley et al. (2001) M. E. Manley, B. Fultz, R. J. McQueeney, C. M. Brown, W. L. Hults, J. L. Smith, D. J. Thoma, R. Osborn, and J. L. Robertson, Phys. Rev. Lett. 86, 3076 (2001).
- Baggioli and Zaccone (2019) M. Baggioli and A. Zaccone, Phys. Rev. Lett. 122, 145501 (2019).
- Lorenz and Chu (2005) B. Lorenz and C. Chu, “High pressure effects on superconductivity,” in Frontiers in Superconducting Materials, edited by A. V. Narlikar (Springer Berlin Heidelberg, Berlin, Heidelberg, 2005) pp. 459–497.
- Errea et al. (2015) I. Errea, M. Calandra, C. J. Pickard, J. Nelson, R. J. Needs, Y. Li, H. Liu, Y. Zhang, Y. Ma, and F. Mauri, Physical Review Letters 114, 157004 (2015).
- Ganguly (1976) B. N. Ganguly, Phys. Rev. B 14, 3848 (1976).
- Karakozov and Maksimov (1978) A. E. Karakozov and E. G. Maksimov, JETP 47, 358 (1978).
- Freericks et al. (1996) J. K. Freericks, M. Jarrell, and G. D. Mahan, Phys. Rev. Lett. 77, 4588 (1996).
- Rousseau and Bergara (2010) B. Rousseau and A. Bergara, Physical Review B 82, 104504 (2010).
- Errea et al. (2013) I. Errea, M. Calandra, and F. Mauri, Phys. Rev. Lett. 111, 177002 (2013).
- Errea et al. (2014) I. Errea, M. Calandra, and F. Mauri, Phys. Rev. B 89, 064302 (2014).
- Errea et al. (2016) I. Errea, M. Calandra, C. J. Pickard, J. R. Nelson, R. J. Needs, Y. Li, H. Liu, Y. Zhang, Y. Ma, and F. Mauri, Nature 532, 81 (2016).
- Sano et al. (2016) W. Sano, T. Koretsune, T. Tadano, R. Akashi, and R. Arita, Phys. Rev. B 93, 094525 (2016).
- Borinaga et al. (2016a) M. Borinaga, P. Riego, A. Leonardo, M. Calandra, F. Mauri, A. Bergara, and I. Errea, Journal of Physics: Condensed Matter 28, 494001 (2016a).
- Borinaga et al. (2016b) M. Borinaga, I. Errea, M. Calandra, F. Mauri, and A. Bergara, Phys. Rev. B 93, 174308 (2016b).
- Szcześniak and Zemła (2015) D. Szcześniak and T. Zemła, Superconductor Science and Technology 28, 085018 (2015).
- Kostrzewa et al. (2020) M. Kostrzewa, K. Szczkeśniak, A. Durajski, and R. Szczkeśniak, Scientific Reports 10, 1 (2020).
- Errea et al. (2020) I. Errea, F. Belli, L. Monacelli, A. Sanna, T. Koretsune, T. Tadano, R. Bianco, M. Calandra, R. Arita, F. Mauri, et al., Nature 578, 66 (2020).
- Camargo-MartÃnez et al. (2020) J. A. Camargo-MartÃnez, G. I. González-Pedreros, and F. Mesa, “The higher superconducting transition temperature tc and the functional derivative of tc with for electron-phonon superconductors,” (2020), arXiv:2006.15248 [cond-mat.supr-con] .
- Klemens (1966) P. Klemens, Physical Review 148, 845 (1966).
- Setty et al. (2020a) C. Setty, M. Baggioli, and A. Zaccone, Phys. Rev. B 102, 174506 (2020a).
- Yesudhas et al. (2020) S. Yesudhas, N. Yedukondalu, M. K. Jana, J. Zhang, J. Huang, B. Chen, H. Deng, R. Sereika, H. Xiao, S. Sinogeikin, et al., arXiv preprint arXiv:2003.09804 (2020).
- Kunc et al. (2003) K. Kunc, I. Loa, and K. Syassen, Phys. Rev. B 68, 094107 (2003).
- Birch (1947) F. Birch, Phys. Rev. 71, 809 (1947).
- Xu et al. (2008) Y. Xu, J.-S. Wang, W. Duan, B.-L. Gu, and B. Li, Phys. Rev. B 78, 224303 (2008).
- Tadano and Tsuneyuki (2018) T. Tadano and S. Tsuneyuki, Journal of the Physical Society of Japan 87, 041015 (2018), https://doi.org/10.7566/JPSJ.87.041015 .
- Tadano and Tsuneyuki (2015) T. Tadano and S. Tsuneyuki, Phys. Rev. B 92, 054301 (2015).
- Allen et al. (1999) P. B. Allen, J. L. Feldman, J. Fabian, and F. Wooten, Philosophical Magazine B 79, 1715 (1999), https://doi.org/10.1080/13642819908223054 .
- Marsiglio and Carbotte (2008) F. Marsiglio and J. Carbotte, in Superconductivity (Springer, 2008) pp. 73–162.
- Kleinert (2018) H. Kleinert, Collective classical and quantum fields (World Scientific, Singapore, 2018).
- Ziman (1969) J. M. Ziman, Elements of Advanced Quantum Theory (Cambridge University Press, Cambridge, 1969).
- (46) In general circumstances, the simplification of setting without accounting for the additional “1/2” would yield incorrect results and qualitatively different predictions. However, we have checked that this is not the case here. The peak enhancement is overestimated in the simplified solution but the qualitative behavior of the non-monotonicity is unaffected. This minimal cost for simplification yields a more tractable formula (there would be two unsymmetrized terms without the simplification) that can be fit to experiments more readily .
- Larkin and Varlamov (2005) A. Larkin and A. Varlamov, Theory of fluctuations in superconductors (Clarendon Press, 2005).
- Ioffe and Regel (1960) A. Ioffe and A. Regel, Prog. Semicond 4, 237 (1960).
- Krivtsov and Kuz’kin (2011) A. M. Krivtsov and V. A. Kuz’kin, Mechanics of Solids 46, 387 (2011).
- Cuffari and Bongiorno (2020) D. Cuffari and A. Bongiorno, Phys. Rev. Lett. 124, 215501 (2020).
- Hou et al. (2021) P. Hou, F. Belli, R. Bianco, and I. Errea, arXiv e-prints , arXiv:2102.00072 (2021), arXiv:2102.00072 [cond-mat.supr-con] .
- Chen et al. (2021) W. Chen, D. V. Semenok, X. Huang, H. Shu, X. Li, D. Duan, T. Cui, and A. R. Oganov, arXiv e-prints , arXiv:2101.01315 (2021), arXiv:2101.01315 [cond-mat.supr-con] .
- Boughton et al. (1970) R. Boughton, J. Olsen, and C. Palmy (Elsevier, 1970) pp. 163 – 203.
- Ves (1990) S. Ves, physica status solidi (b) 159, 699 (1990), https://onlinelibrary.wiley.com/doi/pdf/10.1002/pssb.2221590217 .
- Setty (2019) C. Setty, Phys. Rev. B 99, 144523 (2019).
- Setty et al. (2020b) C. Setty, M. Baggioli, and A. Zaccone, arXiv preprint arXiv:2003.06220 (2020b).
- Marsiglio (2020) F. Marsiglio, Annals of Physics 417, 168102 (2020), eliashberg theory at 60: Strong-coupling superconductivity and beyond.
- Esterlis and Schmalian (2019) I. Esterlis and J. Schmalian, Phys. Rev. B 100, 115132 (2019).
- Valentinis et al. (2013) D. F. Valentinis, C. Berthod, B. Bordini, and L. Rossi, Superconductor Science and Technology 27, 025008 (2013).