Multiscale cosmic web detachments, connectivity, and preprocessing
in the supercluster SCl A2142 cocoon
Abstract
Context. Superclusters of galaxies and their surrounding low-density regions (cocoons) represent dynamically evolving environments in which galaxies and their systems form and evolve. While evolutionary processes of galaxies in dense environments are extensively studied at present, galaxy evolution in low-density regions has received less attention.
Aims. We study the properties, connectivity, and galaxy content of groups and filaments in the A2142 supercluster (SCl A2142) cocoon to understand the evolution of the supercluster with its surrounding structures and the galaxies within them.
Methods. We calculated the luminosity-density field of SDSS galaxies and traced the SCl A2142 cocoon boundaries by the lowest luminosity-density regions that separate SCl A2142 from other superclusters. We determined galaxy filaments and groups in the cocoon and analysed the connectivity of groups, the high density core (HDC) of the supercluster, and the whole of the supercluster. We compared the distribution and properties of galaxies with different star-formation properties in the supercluster and in the cocoon.
Results. The supercluster A2142 and the long filament that is connected to it forms the longest straight structure in the Universe detected so far, with a length of approximately Mpc. The connectivity of the cluster A2142 and the whole supercluster is ; poor groups exhibit . Long filaments around the supercluster’s main body are detached from it at the turnaround region. Among various local and global environmental trends with regard to the properties of galaxies and groups, we find that galaxies with very old stellar populations lie in systems across a wide range of richness from the richest cluster to poorest groups and single galaxies. They lie even at local densities as low as in the cocoon and up to in the supercluster. Recently quenched galaxies lie in the cocoon mainly in one region and their properties are different in the cocoon and in the supercluster. The star-formation properties of single galaxies are similar across all environments.
Conclusions. The collapsing main body of SCl A2142 with the detached long filaments near it are evidence of an important epoch in the supercluster evolution. There is a need for further studies to explore possible reasons behind the similarities between galaxies with very old stellar populations in extremely different environments, as well as mechanisms for galaxy quenching at very low densities. The presence of long, straight structures in the cosmic web may serve as a test for cosmological models.
Key Words.:
large-scale structure of the Universe - galaxies: groups: general - galaxies: clusters: general1 Introduction
The large-scale distribution of galaxies resembles a huge network called as the cosmic web. The cosmic web consists of galaxies, galaxy groups, and clusters connected by filaments and separated by voids (Jõeveer et al. 1978; Kofman & Shandarin 1988). Tiny density perturbations in the very early Universe grew by merging and accretion of smaller structures (Einasto et al. 1980; White & Rees 1978; Bond et al. 1996). The largest systems in the cosmic web are galaxy superclusters. In the early studies of galaxy distribution, superclusters were defined as an agglomerations of galaxies and clusters, or agglomerations of clusters (’clusters of clusters’), hence the name ’superclusters’ (see Oort 1983, for a review of early studies of superclusters). Superclusters can be defined as the largest relatively isolated density enhancements in the Universe (Einasto et al. 1994; Santiago-Bautista et al. 2020). Several full-sky supercluster catalogues have been compiled using data on rich (Abell) clusters of galaxies and the so-called friend-of-friend (percolation) clustering algorithm (Zucca et al. 1993; Einasto et al. 1994; Chow-Martínez et al. 2014). This method has also been applied to determine superclusters based on simulations (Park et al. 2012).
The advent of deep galaxy surveys made possible to calculate the luminosity-density field of galaxies and to determine superclusters as high-density regions in the density field (Basilakos et al. 2001; Einasto et al. 2003a, b; Erdoǧdu et al. 2004). Luparello et al. (2011) and Chon et al. (2015) refined the definition of superclusters and proposed that superclusters could be defined as overdense regions that will eventually collapse in the future (so-called superstes-clusters). Liivamägi et al. (2012) applied the luminosity-density field to study the cosmic web and defined superclusters as the connected high-density regions in the luminosity-density field. The threshold density level for defining superclusters can be determined in a different way. For example, Liivamägi et al. (2012) used two criteria: a fixed threshold density level and an adaptive density level which was defined for each supercluster individually, depending on the galaxy distribution in the supercluster region. To determine systems which will collapse in the future, Luparello et al. (2011) applied a higher luminosity-density level than, for example, Liivamägi et al. (2012). Therefore, superclusters in Liivamägi et al. (2012) may consists of several superstes-clusters (see also Chon et al. 2013; Einasto et al. 2016, for examples of such superclusters).
Superclusters embed galaxies, galaxy groups, and clusters, connected by filaments (de Vaucouleurs 1953, 1958; Jõeveer et al. 1978; Einasto et al. 1980). As high density regions, superclusters act as great attractors, growing through the inflow of matter from surrounding low-density regions. Tully et al. (2014) analysed the cosmic velocity field in the nearby Universe and delineated the so-called basin of attraction or the region of the dynamical influence of the local (the Laniakea) supercluster as a volume in space where all galaxy flows inside it are converging. Examples of such regions from the local Universe were given in Tully et al. (2014) and Pomarède et al. (2015) for the Laniakea and the Arrowhead superclusters. These authors proposed to define superclusters on the basis of their regions of dynamical influence. According to this definition, a supercluster is defined as the structure inside its basin of attraction and different superclusters are separated by the minima in the velocity field around them. To keep the term ’supercluster’ tied to its conventional meaning as a high-density region in the cosmic web, Einasto et al. (2019) proposed calling low-density regions around conventional superclusters supercluster cocoons. Supercluster cocoons, together with embedded superclusters, correspond to the regions of the dynamical influence, as defined by Tully et al. (2014). Simulations show that supercluster cocoon boundaries follow the lowest density regions between superclusters (Einasto et al. 2019; Dupuy et al. 2019) and the whole volume of the Universe can be divided between supercluster cocoons. The cocoon boundaries meet at the centre of voids, associated with the minima of the density field. Density field minima correspond to the minima in the velocity field, where peculiar velocities of galaxies are equal to 0 (so-called linear or the Einstein-Straus scale, Nusser et al. 1991; Teerikorpi et al. 2015). Superclusters occupy only approximately 1% of the total volume, while 99% of the total volume is occupied by cocoons (Einasto et al. 2019).
In this paper, we use the term ’low global density region’ to denote the volume outside supercluster and this definition coincides with the definition of supercluster cocoons in general, without dividing it among superclusters. Low-global-density regions contain galaxy groups and filaments. Rich superclusters embed high-density cores (Einasto et al. 2007b, a). Thus, it is possible to define the hierarchy of structures which includes high-density cores of superclusters, their lower density outskirts regions, and low-global-density cocoon regions around them, which are taken altogether as basins in the definition from Tully et al. (2014).
We note that sometimes the term ’field’ is used. In cluster studies, ’field’ may denote regions outside galaxy clusters (even regions between clusters inside superclusters). In some studies, the term ’field’ have been used to denote regions outside superclusters, the same as ’low global density regions’ or ’cocoons’ in the present study. To avoid misunderstandings, we do not use the term ’field’ in our study.
The essential evolution of superclusters and their components occurs inside supercluster cocoons (Einasto et al. 2019). Simulations show that present-day rich clusters have collected their galaxies along filaments from regions with comoving radii at least Mpc at redshift (Chiang et al. 2013; Overzier 2016). The formation of clusters is accompanied by the star-formation quenching of galaxies when they fall into clusters (Haines et al. 2015; Einasto et al. 2018c; Musso et al. 2018; Kraljic et al. 2019; Maier et al. 2019; Trussler et al. 2020). One result of galaxy quenching and morphological transformations is the large-scale morphological segregation of galaxies at low and high redshifts. According to the large-scale morphological segregation galaxies in high-global-density regions (clusters and superclusters) are of early type, red, and passive. In low-global-density regions galaxies are mostly of late type, blue, and star forming (Einasto et al. 1974; Dressler 1980; Giovanelli et al. 1986; Einasto & Einasto 1987; Goto et al. 2003; Gómez et al. 2003; Kauffmann et al. 2004; Balogh et al. 2004; Cucciati et al. 2006; Braglia et al. 2007; Einasto et al. 2007b; Elbaz et al. 2007; Tempel et al. 2011; Muzzin et al. 2012; Fossati et al. 2017; Malavasi et al. 2017). However, red galaxies with old stellar populations can also be found in poor galaxy groups in low-global-density regions (Park et al. 2007; Lietzen et al. 2012).
Therefore, star formation quenching occurs also in poor groups and filaments in both high and low global density environments. If this happens before their infall to clusters, then this is called preprocessing (McGee et al. 2009; Deshev et al. 2017; Einasto et al. 2018b; Bianconi et al. 2018; Galametz et al. 2018; Sarron et al. 2019; Tomczak et al. 2019). Also, star-forming galaxies with young stellar populations have been observed in clusters and in their infalling structures, even in the high-density cores of superclusters (Einasto et al. 2010; Jaffé et al. 2016; Einasto et al. 2018b). Thus, the details of galaxy evolution and star formation quenching, as well as the physical processes which shape galaxies in various environments, are not yet clear.
The star-formation quenching processes due to removal of gas can be divided as external and internal ones. A comprehensive overview of different physical processes triggering removal of gas in galaxies and their relative importance is given by Boselli & Gavazzi (2006).
Internal processes, called also as mass quenching, depend, first of all, on galaxy dark halo mass. Such internal processes blowing out galactic gas include stellar winds, supernovae explosions, nuclear activity, and so on (Matteucci et al. 2006; Croton et al. 2006; Henriques et al. 2019). Mass quenching is more effective for massive galaxies (Contini et al. 2020) and at higher redshifts.
External processes or environmental quenching are due to stripping away galactic gas by the ram pressure from a cluster’s or group’s hot gas (Gunn & Gott 1972; McCarthy et al. 2008; Roberts et al. 2019; Yun et al. 2019), cold gas removal by viscous stripping (Nulsen 1982), starvation due to the prevention of fresh gas from reaching galaxies by removal their feeding primordial filaments (Aragon Calvo et al. 2019; Maier et al. 2019), harassment due to multiple high-speed mergers (Moore et al. 1996). External processes depend on environmental densities, on galaxy orbital properties, and also on galaxy masses. They are most effective at lower redshifts and for intermediate mass galaxies (Contini et al. 2020). Tidal interactions between galaxies are external processes and they can transform the morphology of galaxies significantly. However, in the densest parts of galaxy clusters, the relative speed of galaxies is quite high and these interactions do not affect the SF significantly (Boselli & Gavazzi 2006).
The relative importance of these mechanisms is not clear as corresponding physical processes depend on several unknown (free) parameters. Often, several mechanisms work together (Peng et al. 2015, 2010; Bluck et al. 2020); for example, Trussler et al. (2020) derived that for most of galaxies in their study, starvation, along with certain contributions from outflow, best fits the observed galactic properties. Still, even processes considered ’global’ in these studies are related to the local environment of galaxies in the context of our paper and the question of how very large scales affect the properties of galaxies is still open.
A detailed study of the distribution and properties of galaxies and their systems in superclusters and in low global density regions (cocoons) around superclusters helps us to clarify how the local and global environmental effects combine in determining the evolution and present-day dynamical state of superclusters and their components, along with the star-formation history of galaxies in these structures. Superclusters and their cocoons, together with the large variety of environments, ranging from rich clusters in high-density cores of superclusters to lowest global density regions with poor groups at cocoon boundaries, serve as good laboratories for such studies.
In this paper, we focus on the study and comparison of the supercluster SCl A2142 and the cocoon region around it. SCl A2142 is named after the richest galaxy cluster in it, which is the Abell cluster A2142. It is located at redshift (at distance Mpc). The length of the supercluster is Mpc, and its mass is (Liivamägi et al. 2012). SCl 2142 has an almost spherical main body with a radius approximately Mpc which embeds the HDC with radius of about Mpc, and a straight tail populated by galaxy groups and short, thin filaments (Einasto et al. 2015). The tail as a whole resembles the thick filament described in Cautun et al. (2013). Earlier studies have shown that the supercluster main body is already collapsing or will collapse in the future (Einasto et al. 2015; Gramann et al. 2015; Einasto et al. 2018c).
Our goal in this study is to understand the growth and possible future evolution of the supercluster SCl A2142 and its components, along with the galaxy transformations taking place within it. With this purpose in mind, we determine the boundaries of SCl A2142 cocoon and analyse the properties of galaxies and galaxy systems in it. Our study extends the previous analysis of the supercluster SCl A2142 to its environment up to the lowest global-density regions between superclusters (Einasto et al. 2015, 2018b, 2018c). We aim to connect the properties of supercluster components with the dynamical state and main evolutional epochs of the supercluster. SCl A2142, with its rather simple structure, is a good object for such studies. It is surrounded by low-global-density regions and its nearest rich supercluster is the Corona Borealis supercluster, located at a distance of approximately Mpc from SCl A2142 (Einasto et al. 2015). This is the first study with this type of analysis for a supercluster and its environment.
We determined the boundaries of the supercluster cocoon by an analysis of the luminosity-density field around the supercluster. We located filaments and groups in the cocoon and looked for their connectivity in and around the supercluster. We also studied the connectivity of the HDC of the supercluster, and its central cluster, A2142. The connectivity is a parameter defined as the number of filaments connected to a cluster (Colombi et al. 2000; Codis et al. 2018). The connectivity characterises the growth of cosmic structures and is related to the properties of the dark matter and dark energy. Connectivity can be predicted theoretically; Codis et al. (2018) showed that on average, cluster connectivity depends on cluster mass and richness. Connectivity of poor groups is lower than that of rich groups (see also Darragh Ford et al. 2019; Kraljic et al. 2020; Gouin et al. 2020).
To understand the evolution of groups and galaxies in them, we compared galaxy populations and group properties in the supercluster and in the low-global-density regions around it. To assess the evolutionary state of galaxy groups, we used the magnitude gap between the brightest galaxies in them as an indicator of their evolutionary status (Vitorelli et al. 2018, and references therein). Vitorelli et al. (2018) showed that groups with large magnitude gaps between their brightest galaxies tend to be more concentrated, supporting the possibility that they may have been formed earlier. They are also more relaxed, as has been found in simulations (Deason et al. 2013; Gozaliasl et al. 2014; Raouf et al. 2016).
Among the variety of galaxy properties we focussed on their star formation and looked for galaxies at various epochs of their star-formation history, starting from blue star-forming galaxies. Our main focus is to study galaxies in transformation, as red star forming galaxies and recently quenched galaxies. This study may provide observational evidence about the cosmic web detachments (Aragon Calvo et al. 2019). According to this phenomenon, a galaxy is quenched when accretion of gas along primordial filaments is halted. We also analysed the distribution of galaxies with very old stellar populations, which have been found in somewhat extreme high-density environments of centres of galaxy clusters. Therefore, we expect that such galaxies could be rare in poor groups in low-global-density environments.
In this paper, we use, as in Einasto et al. (2018c), data from the Sloan Digital Sky Survey data release 10 (SDSS DR10) to analyse the structure and properties of galaxies and galaxy systems in the cocoon of SCl A2142 (Aihara et al. 2011; Ahn et al. 2014). In accordance with the earlier studies of the A2142 supercluster, we use the following cosmological parameters: the Hubble parameter km s-1 Mpc-1, matter density , and dark energy density (Komatsu et al. 2011).
2 Data
2.1 Supercluster, group, and filament data
| (1) | (2) | (3) | (4) | (5) | (6) | (7) | (8) | (9) |
|---|---|---|---|---|---|---|---|---|
| ID | ||||||||
| [deg] | [deg] | [ Mpc] | [] | [] | [ Mpc] | |||
| 239+027+009 | 1038 | 239.52 | 27.32 | 264.5 | 1.6 | 4.3 | 50.3 | 21.6 |
| (1) | (2) | (3) | (4) | (5) | (6) | (7) | (8) | (9) | (10) | (11) | (12) | (13) | (14) | (15) |
|---|---|---|---|---|---|---|---|---|---|---|---|---|---|---|
| No. | ID | |||||||||||||
| 1 | 10570 | 27 | 238.53 | 27.47 | 268.6 | 4.4 | 0.53 | 51.3 | 0.6 | 245.2 | 13.7 | 0.04 | 236 | 0 |
| 2 | 3070 | 212 | 239.52 | 27.32 | 264.6 | 0.0 | 0.88 | 382.0 | 9.1 | 600.0 | 20.7 | 1.24 | 334 | 6-7 |
| 3 | 4952 | 54 | 239.78 | 26.56 | 260.1 | 3.3 | 0.70 | 111.0 | 2.1 | 418.8 | 17.1 | 0.33 | 149 | 1 |
| 4 | 32074 | 11 | 240.11 | 26.71 | 262.4 | 3.3 | 0.28 | 15.7 | 0.6 | 164.4 | 19.9 | 0.17 | 284 | 1 |
| 5 | 35107 | 10 | 240.13 | 27.01 | 258.7 | 2.4 | 0.47 | 13.9 | 0.3 | 110.8 | 14.2 | 0.18 | 387 | 1 |
| 6 | 14960 | 27 | 240.20 | 25.87 | 263.6 | 7.0 | 0.59 | 46.6 | 1.5 | 209.0 | 15.3 | 0.58 | 607 | 1 |
| 7 | 17779 | 20 | 240.38 | 26.16 | 261.1 | 6.0 | 0.40 | 35.1 | 1.0 | 279.4 | 16.4 | 0.0 | 566 | 1 |
| 9 | 21183 | 21 | 240.83 | 26.95 | 265.0 | 5.4 | 0.34 | 36.5 | 0.6 | 248.0 | 15.2 | 0.04 | 293 | 1 |
| C1 | 13822 | 10 | 239.92 | 21.03 | 261.6 | 29 | 0.27 | 16.0 | 0.1 | 171.3 | 4.4 | 1.28 | 113 | 0 |
| C2 | 20637 | 10 | 241.03 | 28.92 | 257.5 | 10 | 0.42 | 14.8 | 0.4 | 111.0 | 3.7 | 0.59 | 198 | 0 |
| C3 | 9352 | 13 | 242.87 | 29.54 | 271.4 | 18 | 0.36 | 27.0 | 0.3 | 289.5 | 3.7 | 0.85 | 198 | 1 |
| C4 | 14236 | 11 | 236.46 | 27.49 | 273.0 | 15 | 0.21 | 30.0 | 0.4 | 374.6 | 3.3 | 0.04 | 188 | 1 |
| 7481 | 8 | 239.62 | 21.58 | 263.2 | 26 | 0.27 | 16.9 | 0.2 | 220 | 3.4 | 1.45 | 113 | 1 | |
| 13360 | 7 | 246.07 | 23.57 | 271.8 | 32 | 0.25 | 19.4 | 0.2 | 205 | 1.8 | 0.80 | 90 | 1 |
We used data from supercluster, group, and filament catalogues by Liivamägi et al. (2012) and Tempel et al. (2012, 2014b, 2014a, 2016), based on the SDSS MAIN galaxy dataset. Catalogues of galaxy superclusters, groups, and filaments are available from the database of cosmology-related catalogues at http://cosmodb.to.ee/ , where the corresponding catalogues can be found. In compiling the catalogues used in this paper, we used the SDSS DR10 MAIN spectroscopic galaxy sample with the apparent Galactic extinction corrected magnitudes and redshifts of
2.2 Galaxy data
Data on galaxy properties used in this study are taken from the SDSS DR10 web page 333http://skyserver.sdss3.org/dr10/en/help/browser/browser.aspx. Absolute magnitudes of galaxies have been calculated as
| (1) |
where is the luminosity distance in units of Mpc and is the +-correction, calculated as in (Blanton & Roweis 2007) and Blanton et al. (2003) (see Tempel et al. 2014b, for details). The distance to the SCl A2142 is Mpc; at this distance the galaxy sample is complete at the absolute magnitude limit in units of . We use the full sample of galaxies in SCl A2142 environment to determine the boundaries of the supercluster cocoon and to detect galaxy groups and filaments within it. For a statistical comparison of the galaxy content of filaments and groups, we use a magnitude-limited complete sample, with the magnitude limit mag.
To calculate galaxy colours and the concentration index, we use galaxy magnitudes and Petrosian radii from the SDSS photometric data. The galaxy rest-frame colour index is defined as , where and are absolute magnitudes of galaxies in and band. The concentration index of galaxies is calculated as the ratio of the Petrosian radii and : ; Petrosian radii and are defined as radii which contain 50% and 90% of the Petrosian flux of a galaxy (Blanton et al. 2001; Yasuda et al. 2001). The concentration index is related to the galaxy structure parameters (Graham et al. 2005) and more weakly, to the galaxy morphological type.
The probability of being an early-type or late-type galaxy is taken from Huertas-Company et al. (2011). Huertas-Company et al. (2011) used a Bayesian automated morphological classification of galaxies, which assigned to each galaxy a probability of being of early or late type. They divided galaxies into four main classes (E, S0, Sab, Scd), and calculated for each galaxy, the probabilities , , , and . In our analysis, we consider the probabilities of Sab or Scd type together as a probability to be a late-type galaxy; . A galaxy can be considered of late type if .
We use data about stellar masses , star formation rates (), metallicities , and index of galaxies from the MPA-JHU spectroscopic catalogue (Tremonti et al. 2004; Brinchmann et al. 2004). In this catalogue, the properties of galaxies are calculated using the stellar population synthesis models and fitting SDSS photometry and spectra with Bruzual & Charlot (2003) models. The description of how the stellar masses of galaxies are calculated can be found in Kauffmann et al. (2003a). The index (the ratio of the average flux densities in the band and ) is defined as in Balogh et al. (1999). The index is correlated with the time passed from the most recent star formation event in a galaxy. It can be used as proxy for the age of stellar populations of galaxies, and star formation rates. We also used stellar velocity dispersions of galaxies, . They are from Portsmouth group, and calculated by fitting galaxy spectra using publicly available codes, namely the Penalized PiXel Fitting (pPXF, Cappellari & Emsellem 2004) and Gas and Absorption Line Fitting code (GANDALF, Sarzi et al. 2006).
3 Luminosity-density field and the boundaries of the SCl A2142 cocoon
As the first step to determining superclusters in the SDSS MAIN dataset, the global luminosity-density field was calculated using spline kernel with the smoothing length 8 Mpc:
| (2) |
Superclusters have been defined as the connected volumes above a threshold density of (in units of mean luminosity-density, = 1.65 , in the luminosity-density field). The use of smaller smoothing length gives high-density regions which correspond to clusters of galaxies, or to high-density cores of superclusters, depending on the smoothing length value, from to Mpc. Very large smoothing length means that the largest connected regions have much larger sizes than conventionally correspond to individual superclusters (see, for example, Einasto et al. 2018a, 2020). Also, if we change the density level used to define individual superclusters, then choosing a higher density level, has the same effect as choosing as a small smoothing length which selects high density cores of superclusters. A choice of a too low density level means that we may combine together neighbouring superclusters, as shown in the case of the Sloan Great Wall in Einasto et al. (2011b). Details about the luminosity-density field and supercluster definition can be found in Liivamägi et al. (2012).
We used the luminosity-density field to determine the supercluster SCl A2142 and to find its cocoon boundaries. The supercluster centre is at the rich galaxy cluster A2142. The supercluster is defined as a volume around the cluster A2142 with luminosity-densities of . With its redshift at the supercluster is located well within the SDSS MAIN galaxy sample. The luminosity-density drops at the borders of the supercluster and, thus, SCl A2142 defined using a fixed luminosity limit, and with an adaptive density limit coincide. We show the basic data on the supercluster SCl A2142 in Table 1, which provides the centre coordinates of the supercluster at the cluster A2142, the number of galaxies, and the luminosity, mass, size, and maximum global density in it.
Einasto et al. (2011a, 2015) and Gramann et al. (2015) studied the morphology of SCl A2142 and luminosity-density distribution within it and showed that the supercluster has a HDC where the luminosity-density is . The radius of the HDC is approximately Mpc. It is embedded in an almost spherical main body of the supercluster with the radius of about Mpc. SCl A2142 also has an almost straight tail, so that the total length of the supercluster is approximately Mpc. The outer parts of the main body and its tail with the luminosity-density of form the outskirts region of the supercluster. Below in the text we refer to the ’supercluster’ when we are analysing the whole supercluster. We refer to the HDC or to the outskirts regions when these are being analysed individually.
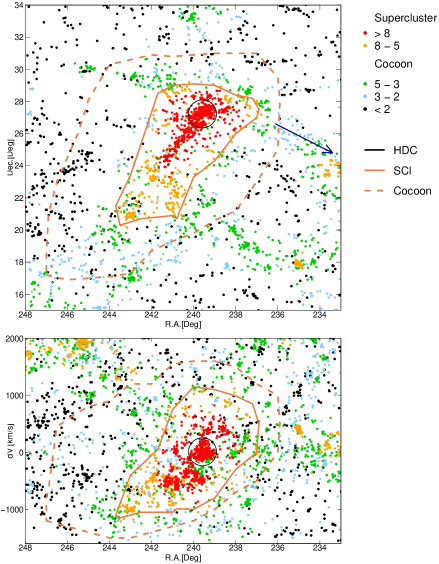
We show the distribution of galaxies in SCl A2142 and in its large-scale environment in Fig. 1. Upper panel shows the distribution of galaxies in the sky plane. In the lower panel, the -axis is the right ascension and the -axis shows the line-of-sight velocity difference between a galaxy and the supercluster centre at the cluster A2142, calculated using redshifts of galaxies. The velocities of galaxies in groups are corrected for the Fingers-of-God effect, as described in Tempel et al. (2012, 2014b).
Cocoon boundaries are defined as minima in the density field between superclusters. In Fig. 1, the location of galaxies is colour-coded according to the value of the global luminosity-density at their locations. In what follows, we refer to the region with a luminosity-density of as the supercluster SCl A2142; this density limit determines the boundary between the supercluster and cocoon. The region with lower global luminosity-density represents the cocoon. Black dots, which show the lowest global luminosity-density, with approximately delineate the outer boundary of SCl A2142 cocoon. In fact, the density threshold for cocoon borders is not fixed. It is defined as a local minimum in the density distribution and may vary in different locations. Cocoon boundaries can be followed by orange line in Fig. 1. The average distance between the supercluster and its cocoon boundaries is approximately Mpc. This limit separates the SCl A2142, the Corona Borealis supercluster (its direction is shown with arrow in Fig. 1) and other superclusters close to SCl A2142. Figure 1 shows that there are groups with outside SCl A2142 cocoon boundaries, for example, in the direction of the Corona Borealis supercluster, indicated by the arrow. These groups belong to the cocoon of the Corona Borealis supercluster.
The exact determination of SCl A2142 cocoon boundaries is not straightforward since we do not know the distribution and velocities of galaxies in low global density environment of SCl A2142 in detail. In our calculations, we use for simplicity, following sky coordinate and distance limits as SCl A2142 cocoon boundaries: right ascension degrees, declination degrees, and distance Mpc (). We note that although it is difficult to define cocoon boundaries with density field data only (as also discussed by Dupuy et al. 2019), we use this approach since there is no peculiar velocity data for SCl A2142 region yet (nor coming soon). Both supercluster and cocoon sample have galaxies.
In our analysis of the local environment of galaxies, we also use local luminosity-density values calculated with the smoothing length Mpc (). This scale corresponds to the sizes of galaxy groups and dark matter haloes of galaxies (see Einasto et al. 2018a, for references).
4 Filaments and groups in the supercluster and in the cocoon
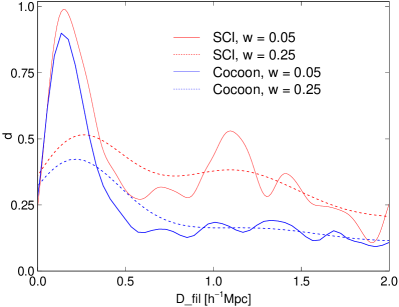
Galaxy filaments were detected by applying marked point process to the SDSS galaxy distribution (Bisous model) (Tempel et al. 2014a, 2016). For each galaxy, a distance from the nearest filament axis was calculated. In Fig. 2, we show for each galaxy in the supercluster and in the cocoon, the distribution of their distances from the nearest filament axis (). In this figure, we do not show filament distances for galaxies from the HDC and we discuss the structures in the HDC separately. Figure 2 shows that at the distance from filament axis Mpc, the number of galaxies drops rapidly in both environments. Therefore, galaxies are considered as filament members if their distance from the nearest filament axis was within Mpc (see Tempel et al. 2014a, for details). Galaxies which belong to a group may also be members of a filament.
As seen in Fig. 2, the number of galaxies with filament distances in a range of Mpc is very small, which means that of we use slightly larger limit (for example, Mpc), then only a few galaxies are added to filaments. In the supercluster, at there is a secondary maximum in the distance distribution, indicating that neighbouring filaments are located closely together. There is no such peak in the filament distance distribution in the cocoon, showing that in the low-global-density environment, mutual distances between individual systems are larger than in the supercluster, which could be expected.
Another observation based on this figure is that by using different kernel widths, to calculate distance distributions, large values of mimic the case if the filament finder is fine-tuned so that it detects wide filaments, with widths up to a few megaparsecs. In this case, all the details of distributions get lost, especially in the high-global-density environment of the supercluster where the use of wide filaments may combine most of the structures. However, in a low-global-density environment (approximately 99% of the total volume, as mentioned in Sect. 1), where most of the filaments lie, it may be even preferable method to trace individual filaments, as more galaxies become filament members.
Moreover, filaments detected using different methods or with different criteria for filament membership may have different properties. The Bisous method used to determine filaments in Tempel et al. (2014a), used in this study, tends to find thinner filaments than, for example, in the Disperse method (Sousbie 2011) or Nexus method (Cautun et al. 2013). This is shown, for example, in Fig. 16 by Bonnaire et al. (2020), and in Fig. 4 by Ganeshaiah Veena et al. (2019). Malavasi et al. (2020) showed that the properties of filaments depend on the density of a galaxy sample used to determine filaments. Also, short filaments, especially near clusters or within superclusters, as the ones in SCl A2142 described below, may be difficult to detect and are often excluded from the sample (Malavasi et al. 2020; Santiago-Bautista et al. 2020; Kuutma et al. 2020).
In addition, Fig. 2 shows that using wide filaments (large value of for filament membership) may result in merging close thin filaments together in high-global-density environments, decreasing the connectivity of a group or cluster. An example of this are structures with small mutual distances connected to the cluster A2142 in the HDC of SCl A2142 (Fig. 4). An extreme example of the use of wide filaments with values Mpc is that in this case all thin filaments along SCl A2142 axis may become members of one thick filament. This would lead to a loss of all the information about the structure of this part of the supercluster. Moreover, increasing values may also connect groups to filaments, increasing the number of connected groups, or increasing the connectivity of already connected groups. In contrast, in low-global-density environments, using thick filaments may not increase the connectivity of individual groups but it may increase the number of groups connected to filaments. These examples show that the comprehensive analysis of various possibilities deserves a special study, which is beyond the scope of the present paper.
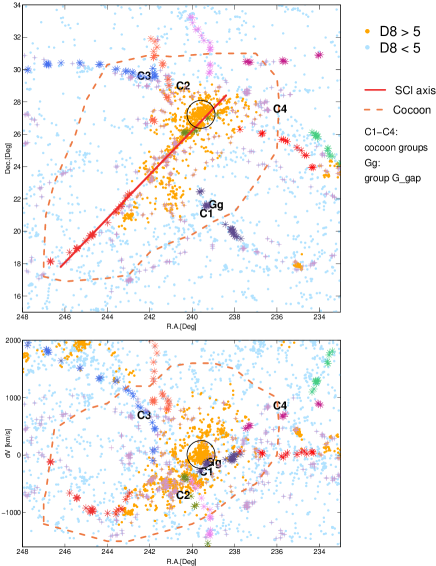
Most filaments detected in the cocoon of SCl A2142 have a length of less than Mpc. We detected 70 such filaments in the cocoon, and 23 filaments with length between and Mpc. There are also seven long filaments with lengths over Mpc in the cocoon. One of them, F1033, starts in the supercluster tail. For comparison, Einasto et al. (2015) detected 31 filaments in SCl A2142. Of these filaments, 27 were shorter than Mpc, and 4 were of a length between and Mpc. In Fig. 3 we show the distribution of galaxies in the sky plane and in the sky-velocity difference plane. In this figure we mark galaxies which belong to filaments of different lengths. The most interesting among long filaments which surround the supercluster is a filament with ID number F1033 and length of Mpc in the catalogue. This filament has an almost straight shape in the sky plane (except the farthest galaxy at the end of the filament, at ; the velocity of this galaxy is also different from velocities of other galaxies in this filament). It is located along the supercluster axis and begins in the supercluster tail. Supercluster axis with F1033 is shown with a dark red line in Fig. 3. The total length of SCl A2142 together with this filament is approximately Mpc, which makes it the longest straight structure in the Universe described so far.
To analyse the group content of the supercluster environment, we use the catalogue of galaxy groups by Tempel et al. (2014b). This catalogue was used to find groups in the supercluster also by (Einasto et al. 2018c). Tempel et al. (2014b) applied a friends-of-friends (FoF) cluster analysis method to determine groups in the galaxy distribution. According to FoF, a galaxy belongs to a group if this galaxy has at least one group member galaxy closer than a linking length. A description of the data reduction and the choice of the linking length are given in Tempel et al. (2014b).
In the A2142 cocoon, there are 280 galaxy groups, 4 of them having 10 - 13 member galaxies. In contrast, in the supercluster 14 groups have at least 10 member galaxies, and 10 of them have more than 13 galaxies. Nine such groups lie in the HDC of the supercluster, and 12 lie at the supercluster axis along an almost straight line. These groups in the supercluster, their galaxy content, and dynamical state were analysed in Einasto et al. (2018c). We highlight groups with at least ten galaxies in the cocoon to compare the properties of groups in both environments. We give the data about groups in the HDC in Table LABEL:tab:gr10 together with data about groups in the cocoon, denoted as C1–C4. The location of these groups in the sky plane is shown in Fig. 3.
In Table LABEL:tab:gr10, we also provide data on groups denoted as and . Group has the largest magnitude gap between its two brightest galaxies among cocoon groups, . This group is also interesting because of the environment; we discuss the group in Sect. 7.2. The group is an example of a poor group in which six out of seven group member galaxies have very old stellar populations (we define galaxy populations used in our analysis below in Sect. 6.1).
To analyse the evolutionary state of groups, several methods can be used, substructure analysis among them. However, groups C1–C4 have less than 20 galaxies, and it is not straightforward to analyse their substructure (as shown, for example, by Ribeiro et al. 2013). They lie away from each other and do not form possibly merging group pairs, as do some groups in the supercluster along the supercluster tail (Einasto et al. 2018c). Thus, we use magnitude gap between group’s two brightest galaxies, as an indicator of their evolutionary state (Dariush et al. 2010; Kanagusuku et al. 2016). As found in these studies, simulations show a trend that the magnitude gap is larger in groups which have been formed earlier than groups with smaller magnitude gaps. In addition, they found that the magnitude gap between the brightest, and third or fourth brightest galaxy, and can also be used as an indicator of early formed groups. A good example of such case from observations is the cluster A2142. Several X-ray and optical studies have shown that in the cluster A2142 the second brightest galaxy is a member of recently infallen group, and to characterise the cluster, is a better indicator (see Table LABEL:tab:gr10 and discussion in Markevitch et al. 2000; Einasto et al. 2018b). In X-ray studies the magnitude gap is used to define possible fossil groups as X-ray groups with (Ponman et al. 1994). Table LABEL:tab:gr10 shows that the value of for groups is larger than for one group. There are no groups with in our sample but for . As already mentioned, we discuss this group in Sect. 7.2.
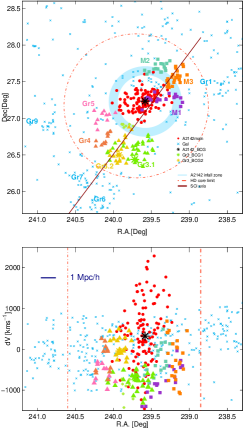
Next we briefly present data on the structure of the HDC of SCl A2142. We use this information to determine its connectivity. The HDC is seen in Fig. 3 as the innermost region of the supercluster main body. HDC has radius of about Mpc, centred at °and °. In the luminosity-density distribution of SCl A2142, it is seen as the region of the highest luminosity-density in the supercluster, with (Einasto et al. 2015; Gramann et al. 2015). HDC embeds eight galaxy groups with at least ten member galaxies; we list them in Table LABEL:tab:gr10. Here, we use the same numbering of groups as in Einasto et al. (2018c). In addition to groups which surround the cluster A2142 in the HDC, Einasto et al. (2018b) showed that the cluster A2142 has three substructures, which they denoted as M1–M3 (where M comes from merging). In the group catalogue by Tempel et al. (2014b) galaxies in M1–M3 are members of the cluster A2142. The analysis of the substructure and dynamical state of the cluster revealed that these structures are probably the remnants of infalling groups and filaments, which are already connected to the cluster and therefore the cluster finding algorithm joined the galaxies in them with the main cluster. For details of this analysis, we refer to Einasto et al. (2018b). The HDC is elongated along the supercluster axis (Figs 1 and 4).
We plot the sky distribution of galaxies in different structures of the HDC in the upper panel of Fig. 4. In the lower panel of Fig. 4, high velocities of galaxies in the main cluster is a signature of the Finger-of-God effect in the cluster. Galaxies in infalling groups (Gr 3, 4, and 5 in Table LABEL:tab:gr10) are shown with different colours. The group Gr3 probably consists of two close groups combined together by group finding algorithm. In Fig. 4, these components are denoted with green and yellow triangles. We also show galaxies in substructures M1–M3 in different colours. In Figs. 4 zone at which substructures fall into A2142 cluster is shown in blue (see Einasto et al. 2018b, for details). The infall zone extends approximately up to Mpc from the cluster centre. This agrees with the clustercentric distance limit for the cluster members in the caustic diagram by Liu et al. (2018). In this region, the stellar ages and star-formation rates of galaxies change rapidly (Einasto et al. 2018b). Moreover, simulations suggest that some galaxies in the infall zone of galaxy clusters may actually be backsplash galaxies, meaning galaxies which entered the cluster a long time ago and are now moving out of the cluster (Haines et al. 2015; Rhee et al. 2017). The blue area with a radius approximately in the range of Mpc in Fig. 4 is the most likely region for backsplash galaxies in A2142.
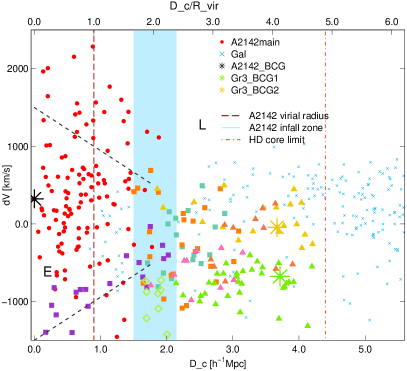
To characterise the dynamical state of the HDC, we present its projected phase space (PPS) diagram (Fig. 5). In this figure, we mark the virial radius of the cluster with the dark red dashed line, an infall zone of A2142 with the blue rectangle, and the border of the HDC with the light red dash-dotted line. In PPS diagram line-of-sight velocities of galaxies with respect to the cluster mean velocity are plotted against the projected clustercentric distance (distance from the centre of A2142 in our case). Simulations show that in the PPS diagram galaxies at small clustercentric radii form an early infall (virialised) population with infall times Gyr, and galaxies at large clustercentric radii form late or ongoing infall populations with Gyr (Oman et al. 2013; Muzzin et al. 2014; Haines et al. 2015; Rhee et al. 2017; Pasquali et al. 2019; Smith et al. 2019). The early infall zone E in A2142 corresponds approximately to the region between blue dashed lines in Fig. 5. The late infall zone is indicated with L (from late).
Figure 5 shows that member galaxies of substructures and groups near the cluster A2142 populate the late infall zone of the PPS diagram up to clustercentric distances Mpc (Einasto et al. 2018b, c). This distance set as the distance limit for cluster members is seen also in Geller et al. (2013). At the projected distance from the centre of the A2142 cluster of about Mpc, the distribution of galaxies has a break (Fig. 4 and 5). This minimum corresponds to the luminosity-density limit and outlines the HDC of SCl A2142.
5 Connectivity in the supercluster and in the cocoon
The connectivity of a cluster or group is defined as the number of filaments connected to it. Next we study the connectivity of the HDC of the superluster, of the whole supercluster, and of groups with at least ten member galaxies in the cocoon. To find the connectivity of galaxy groups, we study filament membership of their galaxies.
The cluster A2142 has six-seven structures connected to it. Figure 4 shows that infalling structures around the cluster A2142 extend up to clustercentric radius of about Mpc. At this location, there is a minimum in the luminosity-density distribution in the supercluster (this was shown in Fig. 5 in Einasto et al. 2015). We can suppose that the HDC of the supercluster is detached from the surrounding supercluster core due to the dynamical processes during collapse which also might have destroyed filament possibly associated with Gr9 (see below).
Figure 3 shows that filaments in the outskirts region of the supercluster main body and around it are short, and they do not reach the HDC of the supercluster. Six long filaments with length over Mpc begin near the supercluster main body in the cocoon but they do not have common member galaxies with the supercluster. One long filament lies at the extension of the supercluster tail. Therefore, the connectivity of the supercluster main body is , and for the whole supercluster, it is .
Table LABEL:tab:gr10 shows that groups in the cocoon which lie on filaments have a connectivity . In the HDC two groups (Gr3 and Gr4), lie on the supercluster axis. Groups Gr5 and Gr9 may belong to a small filaments, therefore, we consider their connectivity to also be (see Einasto et al. 2018c, for details).
It is interesting to compare these results with other studies of the connectivity of groups. However, a word of caution is needed at the start. If a group lies in a filament, then we considered in this study that its connectivity is , if filaments going out of the group from different sides belong to the same filament in the filament catalogue. We consider , if they are different filaments. In some studies in both cases (Codis et al. 2018). Also, as discussed above, different filament finding methods and criteria for filament membership may give different results about the filament membership.
Altogether, this means that exact comparison of group connectivities from different studies may not be straightforward. Thus, we only note that we found trends in group connectivities similar to those found, for example, by Darragh Ford et al. (2019) for poor groups at high redshifts. For low-mass groups from COSMOS data at high redshifts Darragh Ford et al. (2019) found that, on average, their connectivity , higher than the connectivity of groups in SCl A2142 cocoon. They showed that the connectivity of most massive X-Ray detected groups in COSMOS field is, on average, up to 4, which is slightly lower than for A2142. The difference may be related to group mass (and richness), as the connectivity is higher for high mass (and richer) groups (Darragh Ford et al. 2019; Gouin et al. 2020).
6 Galaxy populations in the supercluster cocoon
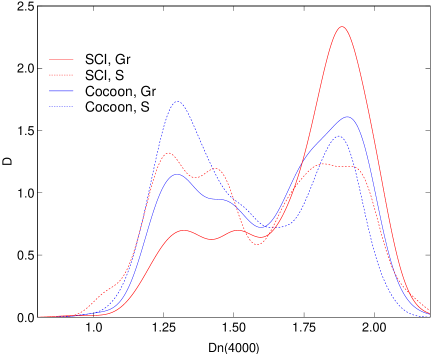
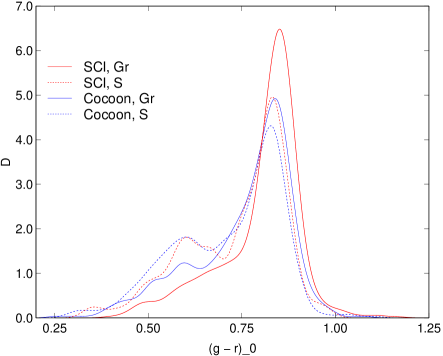
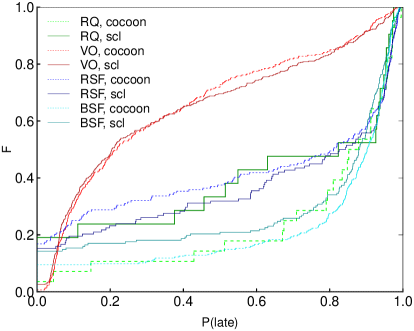
Now we analyse the spatial distribution of galaxies with different star formation histories and focus on blue star forming (BSF) galaxies, on recently quenched (RQ) galaxies, on red star forming (RSF) galaxies, and on galaxies with very old stellar populations (VO). These populations are obtained using galaxy data which were described in Sect. 6. To explain how studied galaxy populations are defined, we show in Fig. 6 the distributions of index values and colour index values for galaxies in the supercluster and in the cocoon, and separately for galaxies in groups and for single galaxies. Figure 6 also provides the first comparison between galaxy content of the supercluster and the cocoon,
The left panel of Fig. 6 shows that the distribution of the index values have a minimum at . Kauffmann et al. (2003a) showed that the value corresponds to the mean age of about Gyr. As in Kauffmann et al. (2003b); Haines et al. (2017); Einasto et al. (2018c), we use this limit to separate galaxies with old and young stellar populations. Galaxies with young stellar populations have .
VO galaxies are defined as having . At this value, there is a drop in the star-formation rate of galaxies (see Fig. 27 in Brinchmann et al. 2004). According to Kauffmann et al. (2003a) the value corresponds to the mean age of about Gyr (for Solar metallicity) or older (for lower metallicities). The centre of the cluster A2142 is populated by such galaxies (Einasto et al. 2018b). We could expect that such galaxies are typical for very dense environments. We searched for VO galaxies in the supercluster cocoon, with the expectation that such galaxies are (nearly) absent in poor groups in the low global density environments. Six galaxies with have a star-formation rate ; they were excluded from this sample to maintain a sample of galaxies without ongoing star formation.
In the right panel of Fig. 6, red and blue galaxies are approximately separated by the colour index value ; red galaxies have . This limit depends on the luminosity of galaxies, but since we do not have very faint galaxies in our sample, we may use such a simple approach.
The BSF, RSF, and RQ galaxies are defined using a combination of parameters. The BSF galaxies are defined as having blue colours () and a star formation rate . The RSF galaxies are defined as red galaxies with colour index , and star formation rate . The RQ galaxies are defined as galaxies with low SFRs and low values of index: and . For details about these limits, we refer to Einasto et al. (2018b, c). Data on galaxy populations are summarised in Table LABEL:tab:galpopdef.
| (1) | (2) | (3) | (4) |
|---|---|---|---|
| Population | Abbr. | Definition | |
| Blue star forming galaxies | BSF | , | 295 |
| Red star forming galaxies | RSF | , | 184 |
| Recently quenched galaxies | RQ | , | 30 |
| Galaxies with very old stellar populations | VO | 331 |
Next we analyse the distribution of galaxies from these populations. At first, we compare overall galaxy content of the supercluster and cocoon. Figure 6 shows that galaxy groups in the supercluster contain relatively more galaxies with high values of index than those in low global density region around it, and also relatively more red galaxies with . Groups in the supercluster contain relatively more passive galaxies than groups in the cocoon (74% and 60%, accordingly). In the supercluster, VO galaxies make up 60% of galaxies in groups, and in the cocoon, 40% of group members. These galaxies form 1/3 of single galaxy population in both environments.
The Kolmogorov-Smirnov (KS) test showed that differences in galaxy content of groups between supercluster and cocoon groups are significant at very high level, with -values (the estimated probability of rejecting the hypothesis that distributions are statistically similar) . The difference between index values and colour index values for single galaxies in both environments are not statistically significant. This shows the importance of the group environment in which galaxies are transformed from BSF galaxies to VO galaxies. Figure 6 suggests that transformations of galaxies are more efficient in high-global-density environment.
Figure 6 also shows that index is a much more sensitive proxy for the age of the stellar populations in galaxies than broad band colours. This is because the definition of the index used in this paper is designed to be much less sensitive to reddening. Extinction by dust, that is, reddening, has the effect of reducing the broad-band colour variation since the star-forming galaxies, which are naturally bluer, suffer stronger extinction, which reddens their integral light.
6.1 Distribution and local density of galaxies from various populations
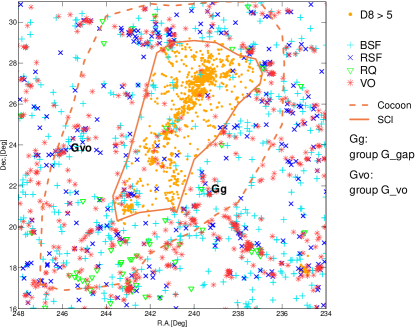
We show the sky distribution of galaxies from populations being studied in the cocoon in Fig. 7. Star-forming galaxies (both BSF and RSF) in Fig. 7 follow evenly the structures in the cocoon. Most RQ galaxies lie at low declinations with degrees, and , and they are absent elsewhere. The VO galaxies in Fig. 7 can be seen almost in all structures of the low-global-density environment, even among single galaxies. In some very poor groups in the cocoon almost all galaxies have very old stellar populations. Group denoted as in Table LABEL:tab:gr10 is an example of a poor group in which six (out of seven) member galaxies are VO galaxies.
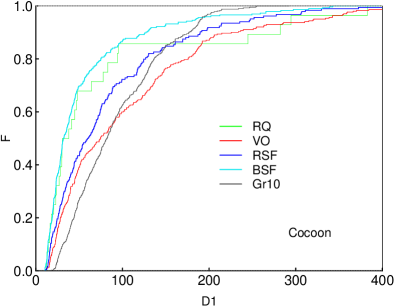
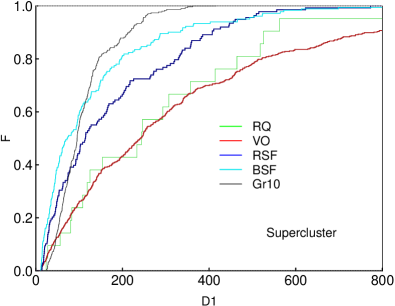
To quantify the differences in the distribution of galaxies from populations in this study, we calculated the local luminosity-density values around galaxies, The distributions of are presented in Fig. 8 (in the left panel for galaxies in the cocoon and in the right panel for supercluster galaxies). The median values of the local luminosity-density around BSF, RSF, RQ, and VO galaxies (in mean luminosity-density units; see Sect. 3), along with the -value from the KS test, in which we compared from a given populations in the supercluster and in the cocoon, are given in Table LABEL:tab:galpopc. As seen from Fig. 8 and Table LABEL:tab:galpopc, in the supercluster median D1 values of BSF, RSF, RQ, and VO galaxies follow the respective sequence of star-formation activity – in denser environments, the current star-formation activity is lower. However, the situation is somewhat different in the cocoon. In the cocoon, on average, RSF galaxies lie in denser environments than do RQ galaxies ( versus ). Thus, star-formation quenching in RQ galaxies in the cocoon may exhibit a different mechanism when compared with the supercluster. We return to this issue in Sect. 7.
Low values of local densities at locations of BSF and galaxies in the cocoon suggest that both populations lie in outer parts of systems (groups and filaments). In the supercluster, local densities for BSF galaxies are the lowest among galaxy populations in the supercluster. Einasto et al. (2018c) found that in SCl A2142, star-forming galaxies lie on the outskirts of groups and in poor groups (or they are single galaxies) in the outskirts of the supercluster main body, which explains their low local densities. RSF galaxies lie at intermediate local densities, often in infall regions of groups and clusters, or along filaments (Skibba et al. 2009; Einasto et al. 2018c). However, in the supercluster, local densities for galaxies are almost as high as for VO galaxies, which is in agreement with findings in Einasto et al. (2018c) stating that these galaxies lie on the outskirts of groups and of the cluster A2142 where local densities are high. Some of them lie also in the outskirts of the supercluster main body.
The local density around VO galaxies in the cocoon is the highest among cocoon populations. They occupy inner parts of groups and filaments. High local densities at the location of VO galaxies in the supercluster come from the fact that these galaxies lie in the central part of the cluster A2142 or in the centres of other rich groups, as well as from the higher local densities around poor groups in the supercluster in comparison with those in the cocoon (Fig. 8).
6.2 Properties of galaxies from various populations
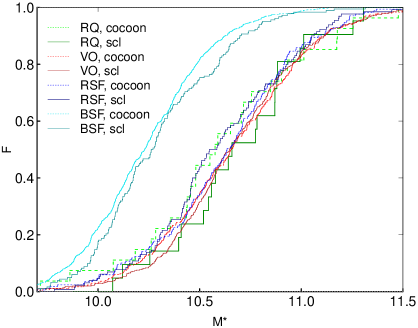
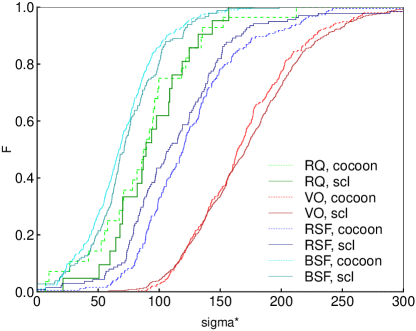
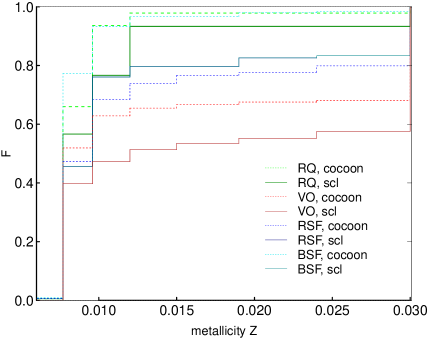
Next we compared other properties of galaxies from these populations, namely the stellar masses, , concentration indexes, , the probabilities of late type, , stellar velocity dispersions, , and metallicities, . The corresponding distributions are shown in Figs. 9 and 10. Their median values and the -value of the KS test are given in Table LABEL:tab:galpopc.
The distribution of stellar masses of galaxies in Fig. 9 shows that BSF galaxies both in the cocoon and in the supercluster have significantly lower stellar masses than galaxies from other populations. This is what could be expected from galaxies which are still forming their stellar content and increasing their stellar mass. Small differences in stellar masses of galaxies from other populations are not statistically significant and we can conclude that galaxies from these populations in our sample have statistically similar stellar masses, in a range of .
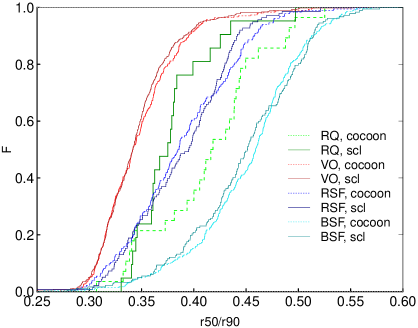
Figure 10 (upper left panel) shows that BSF galaxies have the highest values of the concentration index, , and VO galaxies have the lowest values among our galaxy populations, as they are similar in the supercluster and in the cocoon. In this respect, RQ galaxies differ from others. In the supercluster they have lower values of than in the cocoon, these differences are statistically significant at a very high level, with a -value of (Table LABEL:tab:galpopc).
The distribution of probabilities for galaxies to be of late-type, , are plotted in Fig. 10 (upper right panel). This probability is the highest for BSF galaxies and for RQ galaxies in the cocoon, and the lowest for VO galaxies (in both environments). However, KS test shows that these differences are not statistically significant (Table LABEL:tab:galpopc).
BSF galaxies also have the lowest values of stellar velocity dispersions and VO galaxies have the highest (Fig. 10, lower left panel). This agrees with earlier results which have shown that galaxies with young stellar populations have lower stellar velocity dispersions than galaxies with old stellar populations (Shankar et al. 2009; Bezanson et al. 2012; Einasto et al. 2018b). The stellar velocity dispersions of RQ galaxies are similar in the supercluster and in the cocoon, indicating, in accordance with the results for , that the overall morphological type of RQ and RSF galaxies is the same in both environments. As the stellar mass distribution for VO, RQ, and RSF samples are similar, this suggests that VO galaxies are mainly non-rotating early-type galaxies, but RQ and RSF galaxies (and BSF galaxies) may have also a significant rotation component corresponding to the dynamics of disky galaxies.
The metallicities of BSF, RQ, and RSF galaxies (Fig. 10, lower right panel) are statistically similar in both environments, BSF and RQ galaxies having the lowest metallicity values. VO galaxies in the supercluster have higher metallicities than galaxies from other populations in our study. In the cocoon, they are similar to the metallicities for galaxies from other populations.
| (1) | (2) | (3) | (4) | (5) | (6) | (7) | (8) | (9) | (10) | (11) | (12) |
|---|---|---|---|---|---|---|---|---|---|---|---|
| 182 | 73 | 0.46 | 0.28 | 71 | 0.28 | 0.88 | 0.05 | 0.0077 | 1.0 | ||
| 295 | 32 | 0.46 | 67 | 0.90 | 0.0077 | ||||||
| 138 | 114 | 0.40 | 0.48 | 108 | 0.03 | 0.83 | 0.51 | 0.0096 | 0.76 | ||
| 184 | 60 | 0.39 | 120 | 0.81 | 0.0096 | ||||||
| 47 | 244 | 0.38 | 0.004 | 89 | 0.79 | 0.82 | 0.23 | 0.0077 | 0.67 | ||
| 30 | 34 | 0.42 | 88 | 0.88 | 0.0077 | ||||||
| 516 | 242 | 0.34 | 0.41 | 171 | 0.09 | 0.21 | 0.69 | 0.0077 | |||
| 331 | 75 | 0.34 | 164 | 0.20 | 0.0120 |
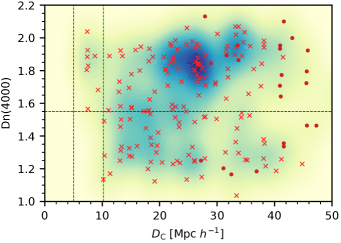
We additionally checked whether the galaxy content of long filaments with length Mpc depends on the distance of filament member galaxies from the supercluster centre, . The values of index versus for galaxies in long filaments are plotted in Fig. 11. In this figure, background colours show the density of points at corresponding values of index and . The density of points (and therefore the number of galaxies) is the largest at clustercentric distances Mpc. Galaxies from these distances lie in groups outside cocoon borders.
We can see in Fig. 11 that galaxies in long filaments, which are the closest to the supercluster centre, lie at Mpc. In other words, long filaments do not reach the HDC of the supercluster, as we show in Sect. 5. Galaxies which are the closest to the supercluster centre are all with old stellar populations. The nearest galaxies with young stellar populations in long filaments lie on the outskirts of the supercluster at Mpc, marked in the figure. Distances Mpc correspond to the cocoon borders around the supercluster main body, at larger distances, galaxies belong to groups on long filaments outside the SCl A2142 cocoon, except those which lie in the straight filament at the extension of the supercluster tail (filled red dots in the figure). Figure 11 shows that there are no trends in star-formation properties along filaments which cannot be explained by the changes in global or local density (membership of groups) seen in Fig. 6. This is similar to what Einasto et al. (2018c) found for SCl A2142. In the supercluster, galaxy content of groups which lie on the supercluster axis is statistically similar in the HDC and in the tail of the supercluster, and it does not change significantly with the distance from the supercluster centre.
7 Discussion
Together with our earlier studies of the supercluster SCl A2142 we find that the nearly spherical main body of the SCl A2142 has an extension in the form of a quite long, about Mpc straight tail. The supercluster tail forms an axis of the supercluster along which groups merge and fall into the main cluster (Einasto et al. 2018c, and references therein). Also, cluster X-ray and radio haloes are elongated along the supercluster axis. Thereafter, we found that this tail is further extended by a long filament of galaxies oriented nearly precisely along the axis of the supercluster. With a total length of Mpc, they form the longest straight structure in the Universe found so far. Global luminosity-densities, change systematically along the structures in and around the supercluster from within the HDC of the supercluster to near the cocoon edge, and local luminosity-densities, span in the range of within the HDC to around the endpoint of the filament. Such a large density contrast between different ends of this structure makes it very useful to compare galaxy properties along it.
In our study, we find (somewhat surprisingly) that while, in general, there are relatively more star-forming galaxies in the cocoon in comparison with the supercluster, there are no strong global trends in galaxy populations (BSF, RSF, RQ, and VO, in order of decreasing of their current star-formation activity) along the straight structure with respect to supercluster centre. Instead, we find various environmental trends in the star-formation properties of galaxies, which show that these properties depend both on the local luminosity-density, and global luminosity-density, . We discuss them below.
7.1 Galaxy evolution in the supercluster and in the cocoon
The first studies of the morphology-density relation of galaxies already demonstrated that this relation extends over a very wide range of densities from high-density cores of rich clusters to isolated galaxies in low-global-density environments (Einasto et al. 1974; Dressler 1980; Postman & Geller 1984; Einasto & Einasto 1987). More recently, this was shown, for example, by Park et al. (2007); Lietzen et al. (2012); Einasto et al. (2014); Alpaslan et al. (2015, 2016).
We find that the star-formation properties of galaxies depend both on their local (group versus single galaxies, and rich groups versus poor groups) and global (high versus low) density environment. Single galaxies in our sample may be the brightest galaxies of faint groups in which other members of the groups are outside of SDSS spectroscopic sample limits (Tempel et al. 2009). In such poor, faint groups, or for single galaxies, galaxy transformations are less effective than in richer groups. This agrees with earlier results showing that the poorer the group, the higher is the fraction of star forming galaxies in it (Einasto et al. 2014). This shows the importance of the group environment in which galaxies are transformed from BSF galaxies to VO galaxies.
The star-formation activity and other properties of BSF, RSF, and VO galaxies correlate quite well with their local luminosity densities. In denser environment the current SF activity of galaxies is lower, galaxies are more concentrated and have higher stellar velocity distributions. The properties of BSF, RSF, and VO galaxies (except the metallicities of VO galaxies, see Table LABEL:tab:galpopc) are statistically similar in both global environments. The similarity of galaxy properties in the supercluster and in the cocoon is somewhat unexpected. Figure 6 suggests that transformations of galaxies are more efficient in the high global density environment. Also, earlier studies have shown that galaxies in poor groups in the low global density environment need more time to evolve from star-forming galaxies to quenched galaxies (Lietzen et al. 2012). Owing to this, we could expect that within a given galaxy population galaxies in high and low global density environments could be somewhat different, but we find this for RQ galaxies only.
In our sample, BSF galaxies lie in the lowest local density environments both in the supercluster and in the cocoon. They also have the lowest stellar masses, as they are, according to their properties, young late-type galaxies that are still growing their stellar mass. In the cocoon, BSF galaxies can be found in outer parts of filaments. In the supercluster, they lie mainly in the outer parts of the supercluster main body. In both global environments. these galaxies may enter galaxy systems for the first time, as described in Aragon Calvo et al. (2019). This may be the reason why they are similar in both environments.
In the cocoon, in the similar, very low local density environment, some late-type galaxies (BSF) are in active star formation stage, but other late-type galaxies are in already quenched stage (RQ). Both BSF and RQ galaxies in the cocoon lie in the periphery of structures (Fig. 7). Figure 9 shows that the stellar masses for BSF galaxies with are lower than those of RQ galaxies, which have . According to models by Contini et al. (2020), environmental quenching efficiencies for these masses are and , respectively. This means that the mass quenching efficiency is similarly low for both. The difference in the star-formation properties of these galaxies can only be partly attributed to their different masses and there should be also other factors which determine the star formation stage of galaxies. One possibility is that star formation in the present-day RQ galaxies started early and they have had more time than BSF galaxies to form their stars and increase their stellar mass.
Interestingly, we found RQ galaxies in the cocoon, but not everywhere in the low local density outskirts of filaments and groups; that is, only in regions with a declination below 22 degrees. The number of RQ galaxies is small and this may simply be due to this. It is also possible that the properties of filaments, including their gas content, which could fuel the star formation in galaxies, vary from filament to filament. Earlier studies found a variety of star forming properties of galaxies in the infall zones of rich galaxy clusters, where some infalling structures are populated mostly by passive, red galaxies, and others by blue, star-forming galaxies (Einasto et al. 2010; Verdugo et al. 2012; Jaffé et al. 2016; Deshev et al. 2017; Einasto et al. 2018b; Deshev et al. 2020). The variety of galaxy populations near rich clusters may be attributed to the different history of these galaxies (Bahé et al. 2013). This needs further study, together with the analysis of the galaxy and gas content of filaments from simulations, in order to clarify how large the variations of the properties are for individual filaments.
In the supercluster, RQ galaxies typically lie in the infall zones of substructures of the cluster and groups, in the merging zone of merging groups, and in the turnaround region of the supercluster main body (Einasto et al. 2018b, c). The concentration indexes of RQ galaxies in the supercluster are significantly lower than in the cocoon. This hints that RQ galaxies in the cocoon and in the supercluster may represent galaxies at different epochs of the evolution, and processes responsible for star formation quenching in RQ galaxies in the cocoon may be somewhat different and more diverse from those in the supercluster. One possibility is that the quenching of star formation of RQ galaxies in the cocoon was due to their infall into primordial groups and detachment of small scale primordial filaments feeding a galaxy with fresh gas (Aragon Calvo et al. 2019). In the supercluster, in the infall zones of groups and clusters RQ galaxies may have several star formation events in the past, which is analogous to what was suggested for galaxies with young stellar populations in the nearby Universe by Mamon et al. (2020). Thus, they actually represent galaxy population, which is different from RQ galaxies in the cocoon. However, this explanation ignores the finding that the stellar masses of RQ galaxies are statistically similar in the supercluster and in the cocoon.
RSF galaxies represent galaxies in transformation between BSF and VO galaxies. The local densities around RSF galaxies are between BSF and VO galaxies both in the supercluster and in the cocoon. The distribution of RSF galaxies follows the distribution of groups and filaments, but they seem to avoid central parts of these systems (for RSF galaxies in the supercluster, this was shown in Einasto et al. 2018c). RSF galaxies are typically of late type with stellar masses clearly higher than stellar masses of BSF galaxies, being comparable to those of RQ and VO galaxies. Their origin may be related to an accretion into a filament or into a group or cluster without experiencing major merger. This process is described as a cosmic web detachment without morphological change in Aragon Calvo et al. (2019). We may suppose that the timescales of star formation quenching and the change in morphology are different (Kelkar et al. 2019; Hamabata et al. 2019). This is in agreement with studies which showed that the changes in colours of galaxies and in their morphology have different timescales (Masters et al. 2010; Einasto et al. 2011b) A number of physical processes have been related to galaxy transformations in groups (the so-called preprocessing), like starvation, overconsumption and others (see, e.q. McGee et al. 2009, 2014; Aragon Calvo et al. 2019; Džudžar et al. 2019, and references therein).
Alpaslan et al. (2016) found that among spiral galaxies in GAMA fields galaxies which lie closer to the filament axes have higher stellar masses and higher star-formation rates than spiral galaxies in the outer parts of filaments. These results partly agree with our findings about BSF and RSF galaxies, and disagree with our results about RQ galaxies. One possibility that would lessen this disagreement is that the time to be a RQ galaxy is very short and we happen to evidence a snapshot of their life in some filaments only (see also Deshev et al. 2017, for discussion and references).
We found also that in the cocoon there are surprisingly many VO galaxies, even among single galaxies. VO galaxies lie in a wide range of local and global environments, with from in the cocoon to in the supercluster and values also from (cocoon) to (supercluster). The richness of their host groups vary from single galaxies to the richest cluster in our study, A2142, with several orders of host group mass range, (see Table LABEL:tab:gr10). Their properties are nearly independent of the global environmental density and, thus, the overall conditions for these galaxies to form and evolve had to be similar (or leading to similar galaxies) both in high- and low-global-density environments. This seems to be somewhat unexpected owing to the very different conditions in rich and poor groups.
For rich systems, both observations and simulations show that galaxy quenching starts in protogroups and protoclusters at early epochs of group formation (Zavala et al. 2019; Pasquali et al. 2019). When a galaxy falls into a cluster, during the first Gyrs, star-formation quenching is slow. Thereafter, when a galaxy reaches to dense regions of the cluster, quenching proceeds more rapidly (Maier et al. 2019; Roberts et al. 2019; Łokas 2020; Rhee et al. 2020). Galaxies in poor groups in the low-global-density environment need more time to evolve from star-forming galaxies into quenched galaxies (Lietzen et al. 2012). Single galaxies in both environments are least affected by the environment, and their evolution should be the slowest. This means that large number of old and quenched galaxies in poor groups in the low-global-density environment may be at odds with theoretical predictions (Merlin et al. 2019).
7.2 Connectivity of the supercluster and the evolution of SCl A2142 in the cosmic web
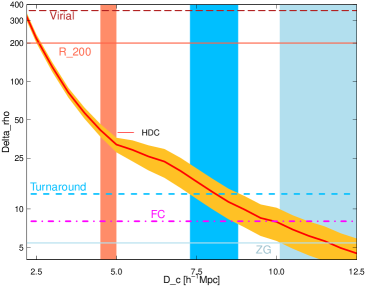
We begin the discussion about the connectivity and possible evolution of SCl A2142 in the cosmic web with a short analysis of the possible evolution and dynamical state of the supercluster according to the spherical collapse model. The spherical collapse model describes the evolution and dynamical state of a spherical perturbation in an expanding universe. The details of the model with references are given in Appendix A.
In the spherical collapse model, the evolution of a spherical perturbation is determined by its density contrast (Appendix A). In the process of evolution. perturbations have several important epochs. For each of them, there is a corresponding characteristic density contrast. The first epoch is called the ’turnaround’, with a density contrast of . Turnaround is defined as the epoch at which a spherical overdensity region decouples from expansion and its collapse begins. Overdensity regions in which density contrast is not sufficient to collapse at present may eventually experience turnaround and collapse in the future, if their current overdensity is (where FC stands for future collapse). The density contrast corresponds to a so-called zero gravity radius (ZG) where gravitation equals expansion and which borders the region which may stay gravitationally bound (Teerikorpi et al. 2015; Gramann et al. 2015).
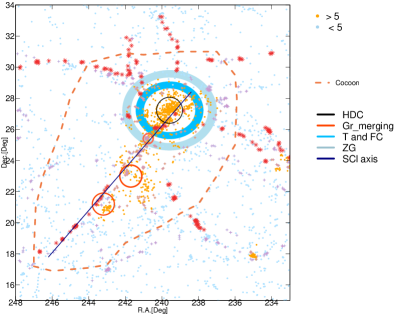
In Fig. 12, we plot the density contrast with respect to the distance (the distance from the supercluster centre at the cluster A2142) for the supercluster SCl A2142. Density contrast is calculated using mass estimates as explained in Appendix A. We mark in Fig. 12 characteristic density contrasts (and their characteristic radii) listed above, namely. the turnaround region of the supercluster, the future collapse region (FC), and the zero gravity (ZG) region. We additionally indicate the border of the HDC of the supercluster with density contrast . We show these regions also in Fig. 13 where we plot the sky distribution of galaxies and filaments in SCl A2142 and in its cocoon.
To start the analysis of a possible dynamical state and evolution of the supercluster from inside out, the first region highlighted in Figs. 12 and 13 is the HDC of the supercluster with the density contrast at its borders , and radius of Mpc. The high density contrast suggest that the HDC has passed turnaround with the density contrast , and continues contracting. This is supported by the analysis of the structure and dynamical state of the HDC in Sect. 4 which suggested that groups in the HDC are falling into the cluster A2142.
The connectivity of the cluster A2142 . The connectivity within HDC may have changed during the evolution. For example, groups Gr5 and M1 (see Fig. 4 and Table LABEL:tab:gr10 may be remnants of a small filament near the cluster A2142 destroyed by the infall (Einasto et al. 2018c). They may be related to the radio ridge detected by Venturi et al. (2017). Short filaments and substructures which surround the cluster A2142 in the HDC are infalling into the cluster. They are detached from the main body of the supercluster by a minimum in the galaxy distribution (this is seen also in Fig. 5 in Einasto et al. 2015, as a minimum in the density distribution). We suggest that this is a signature of a collapse of the HDC. Einasto et al. (2018b) proposed that the collapse may have started at least Gyrs ago, approximately at redshift . Simulations show that this redshift correspond to half-mass period in the evolution of rich clusters (Kim et al. 2015).
Figures 12 and 13 show that the radius of the turnaround region of the supercluster (shown in dark blue), Mpc. This region is populated mostly by poor groups and single galaxies in short filaments. In Sect. 7.2, we showed that at clustercentric distances of six long filaments begin, which extend out of the supercluster. This is the same distance at which galaxies with young stellar populations appear in long filaments (Sect. 6.2). At these clustercentric distances, Einasto et al. (2018c) detected an excess of star-forming and recently quenched galaxies. We propose that long filaments do not reach the inner regions of the supercluster because of the collapse of the supercluster main body, which have destroyed the structures in this region and may affect the star–formation properties of galaxies.
According to the predictions of the spherical collapse model. the outer parts of the supercluster main body with radius Mpc will collapse in the future. Zero gravity region with a radius of Mpc approximately surrounds the supercluster main body. This means that regions at larger distances from the supercluster centre will not become gravitationally bound. This agrees with an earlier analysis which showed that groups in the supercluster tail will probably separate from the supercluster in the future (Einasto et al. 2015, 2018c). The radius of a region which corresponds to the linear mass scale is Mpc (see Gramann et al. 2015). This region approximately follows the cocoon borders where the densities are the lowest. We do not have galaxy velocity data for the SCl A2142 region but simulations show that the lowest densities correspond to the lowest values of the peculiar velocities of galaxies.
We emphasise that the characteristic radii in Fig. 12 were found using mass estimates of groups as described in Appendix A. These radii are in a good accordance with those seen from filament distribution. This coincidence supports our interpretation of the disconnection of long filaments. Also, as noted in Einasto et al. (2015), the mass estimates of SCl A2142 agree well with those found for supercluster masses from simulations (Chon et al. 2014) which means that our estimates of characteristic radii are not strongly affected by mass errors.
As discussed in Sect. 5, the results about the connectivity depend on how filaments are defined, and on the parameters chosen for filament membership (in our case, the distance of a galaxy to the nearest filament axis, ). Figure 2 shows that in our study the choice of value for filament membership, Mpc is justified. This choice enables to study fine details in the distribution of groups and filaments inside the supercluster, and especially in its HDC. The situation may be different in studies which focus on the overall properties of the cosmic web, where detection of wider filaments may be preferred (see, for example, Malavasi et al. 2020).
We also found that galaxy content along the longest filaments does not change significantly with the distance from the supercluster centre. This is somewhat incompatible with the theoretical calculations by Bahé et al. (2013) who showed that galaxy infall into a cluster occurs along filaments and there should be a significant dependence of the fraction of gas rich galaxies with a distance from the cluster. The fraction should decrease times when the distance changes from or from Mpc to Mpc. This also disagrees with the recent observational findings about galaxy properties in filaments (Kraljic et al. 2020). The reason of this discrepancy may be related to the dynamical evolution of the supercluster, and the detachment of filaments. Inside the HDC, red, passive galaxies are closer to the cluster A2142 than blue, star-forming galaxies (Einasto et al. 2018c), in agreement with Porter et al. (2008); Bahé et al. (2013); Kraljic et al. (2020). At the borders of the collapsing region of the supercluster, long filaments are detached, and this also affects galaxy properties. There is an excess of star-forming at the turnaround region. Outside of the supercluster, the dependence of galaxy properties along filaments with regard to the distance from the supercluster is weak.
The minimum in the galaxy distribution around the HDC is similar to the minimum which have been noted around some other rich galaxy clusters, for example, around the cluster A1436 in the Ursa Major supercluster (Kopylova & Kopylov 2007; Einasto et al. 2012). It is possible that galaxies near cluster have already merged with the cluster. Interestingly, we found similar ’distance gap’ around one poor galaxy group in the cocoon. We denote this as group (Gr7481 in the catalogue). has also the largest magnitude gap between its two brightest galaxies among cocoon groups, . This group lies near the endpoint of filament. We show the distribution of galaxies in this group and its PPS diagram in Fig. 14.
Figure 14 shows that galaxies in the centre of the group are all with old stellar populations. Star-forming galaxies, including one RSF galaxy, lie in the outskirts of the group. This may be a signature of enhanced star formation due to the infall into the group. The nearest galaxies to the group are also RSF galaxies. There are no galaxies in the close environment of this group in the interval of groupcentric distances of approximately Mpc. It may be possible that galaxies formerly near have already become the members of the group, and the accretion occurred along the filament where lies. The brightest galaxy in this group may have merged some group members, and this may be the origin of its large magnitude gap. We note that for this group, and it might be considered as fossil group candidate. However, there are no available X-ray observations in and around this group to confirm it as an X-ray source. Also, we do not expect to see the X-ray emission of fossil groups at z=0.1 in RASS. These examples show one epoch in the evolution of galaxy groups and clusters and their connectivity, and deserves a special study which should include a larger sample of groups and clusters.
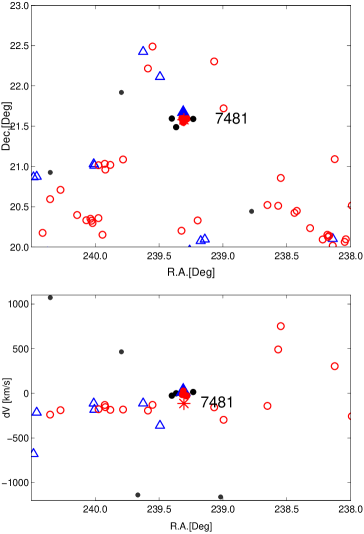
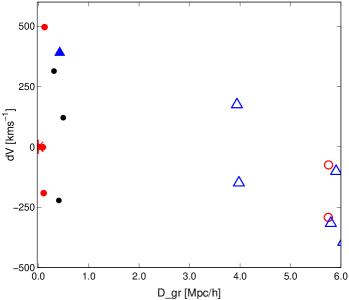
The presence of merging groups in the supercluster tail is another evidence of dynamical activity in the supercluster (Einasto et al. 2018c). It is also likely that merging groups in the supercluster tail will separate from the supercluster during future evolution (Einasto et al. 2015; Gramann et al. 2015). This suggests that the growth of the whole supercluster has stopped and the split to several systems has started. Therefore, the borders of the SCl A2142 cocoon also will change in the future and there will be at least three cocoons where now there is one.
Our study shows that the supercluster SCl A2142 together with galaxy filament at the extension of the supercluster forms the longest straight structure found from observations so far. Such systems can be used as a cosmological probe to test whether such straight structures in the cosmic web are consistent with the model. This problem has not yet been studied implicitly. Park et al. (2012) analysed the sizes of the most massive structures identified in the mock catalogues based on Horizon II simulations of a structures formation in the Universe. This study showed that the largest systems from simulations have similar sizes as the largest systems of galaxy clusters from SDSS DR7 catalogue. Interestingly, in Fig. 2 by Park et al. (2012), one of the largest systems from mock catalogues is visually very similar to SCl A2142, having spherical body with long tail, although this system is three times larger than SCl A2142. This cannot be taken as direct comparison between SCl A2142 and mock catalogues since the systems were chosen differently. However, it might be possible that straight systems can be found in very large simulations. This shows that when comparing observations and simulations, morphological and topological measures of the cosmic web elements should be used in addition to other statistics (Einasto et al. 2011a; Hong et al. 2020, and references therein).
8 Summary
We determined the boundaries of the supercluster SCl A2142 cocoon using the luminosity-density field and studied the galaxy, group, and filament content therein. Our study showed that the connectivity of the supercluster and the galaxy content of groups and filaments are related to the evolution of the supercluster and its cocoon. Our results can be summarised as follows.
-
1)
The supercluster A2142, together with the long filament connected to it, form the longest straight structure in the Universe detected so far, with a length of approximately Mpc.
-
2)
The radius of SCl A2142 cocoon, determined as the minimum in the luminosity-density field around the supercluster, is approximately equal to the linear expansion scale, Mpc. The cocoon is elongated, with the length of approximately Mpc.
-
3)
The connectivity of the cluster A2142 is . The supercluster main body with six long surrounding filaments has . The connectivity of poor groups in the cocoon and supercluster is . These numbers are compatible with theoretical calculations by Codis et al. (2018) for the standard CDM model for corresponding group and cluster masses.
-
4)
The supercluster main body is collapsing and the long filaments are detached from it at the turnaround region of the supercluster main body. These results suggest that the supercluster may split into several systems in the future. Also, its cocoon will change in their future evolution.
-
5)
We found various trends with the local (group and cluster) and global (supercluster and cocoon) environment in the properties of galaxies and groups.
5.1) While groups in a supercluster contain higher percentage of red galaxies and galaxies with high values of than in the cocoon, the star-formation properties of single galaxies are similar in all environments.
5.2) Local luminosity-density at the location of poor groups in the cocoon is lower than that at poor groups in the supercluster. Local luminosity-density is the lowest around blue star-forming galaxies, and the highest around galaxies with old stellar populations (those with ).
5.3) Galaxies with the oldest stellar populations occupy groups with masses in a wide interval of . They have local and global densities in a range from and in the cocoon to () in the supercluster. There are VO galaxies also among single galaxies in both environments.
5.4) Recently quenched galaxies lie in the low-density outskirts of some galaxy systems, but not everywhere, and their properties in the cocoon and in the supercluster are different.
5.5) There is no systematic change in galaxy properties along long filaments with the distance from the supercluster centre, which cannot be explained with the changes in local densities (presence of groups) or global densities.
The study of the supercluster SCl A2142, galaxies and galaxy groups in it and in its environment, together with the earlier study of SCl A2142 (Einasto et al. 2018c), shows how the supercluster and structures around it evolve. We detected large differences between the galaxy content of individual groups and filaments. Together with earlier findings about large variations in the galaxy content of infalling structures around galaxy clusters this deserves future analysis. Our study suggests that the reasons why galaxies are recently quenched are different in the supercluster and in the cocoon. Unexpectedly, VO galaxies, which lie in a wide range of systems from single galaxies in the cocoon to the richest cluster of the supercluster, have a similar concentration index, stellar velocity dispersion, and morphology in all these rather extreme environments. Since local conditions, which affect galaxies in the centre of rich cluster, are very different from those in poor groups or for single galaxies, we might expect differences in their properties. Further studies are needed to clarify the details of galaxy evolution in various environments.
The supercluster has a long, straight filament as the extension of the supercluster, forming the longest straight structure detected so far. The presence of such structures may be a challenge for the theories of the structure formation in the Universe. We plan to address this question in a future studies.
Acknowledgements.
We thank the referee for a very detailed report which helped us to improve the paper. We thank Enn Saar, Dmitri Pogosyan, Miguel Aragon-Calvo, Rien van de Weygaert, Rain Kipper, and Teet Kuutma for useful discussions. We are pleased to thank the SDSS Team for the publicly available data releases. Funding for the Sloan Digital Sky Survey (SDSS) and SDSS-II has been provided by the Alfred P. Sloan Foundation, the Participating Institutions, the National Science Foundation, the U.S. Department of Energy, the National Aeronautics and Space Administration, the Japanese Monbukagakusho, and the Max Planck Society, and the Higher Education Funding Council for England. The SDSS website is http://www.sdss.org/. The SDSS is managed by the Astrophysical Research Consortium (ARC) for the Participating Institutions. The Participating Institutions are the American Museum of Natural History, Astrophysical Institute Potsdam, University of Basel, University of Cambridge, Case Western Reserve University, The University of Chicago, Drexel University, Fermilab, the Institute for Advanced Study, the Japan Participation Group, The Johns Hopkins University, the Joint Institute for Nuclear Astrophysics, the Kavli Institute for Particle Astrophysics and Cosmology, the Korean Scientist Group, the Chinese Academy of Sciences (LAMOST), Los Alamos National Laboratory, the Max-Planck-Institute for Astronomy (MPIA), the Max-Planck-Institute for Astrophysics (MPA), New Mexico State University, Ohio State University, University of Pittsburgh, University of Portsmouth, Princeton University, the United States Naval Observatory, and the University of Washington. The present study was supported by the ETAG projects IUT26-2, IUT40-2, PUT1627, by the European Structural Funds grant for the Centre of Excellence ”Dark Matter in (Astro)particle Physics and Cosmology” (TK133), and by MOBTP86. GC acknowledges support by the Deutsches Zentrum für Luft- und Raumfahrt under grant No. 50 OR 1905, and BD acknowledges the support of the Czech Science Foundation grant 19-18647S and the institutional project RVO 67985815. This work has also been supported by ICRAnet through a professorship for Jaan Einasto. We applied in this study, the R statistical environment (Ihaka & Gentleman 1996).References
- Ahn et al. (2014) Ahn, C. P., Alexandroff, R., Allende Prieto, C., et al. 2014, ApJS, 211, 17
- Aihara et al. (2011) Aihara, H., Allende Prieto, C., An, D., et al. 2011, ApJS, 193, 29
- Alpaslan et al. (2015) Alpaslan, M., Driver, S., Robotham, A. S. G., et al. 2015, MNRAS, 451, 3249
- Alpaslan et al. (2016) Alpaslan, M., Grootes, M., Marcum, P. M., et al. 2016, MNRAS, 457, 2287
- Aragon Calvo et al. (2019) Aragon Calvo, M. A., Neyrinck, M. C., & Silk, J. 2019, The Open Journal of Astrophysics, 2, 7
- Bahé et al. (2013) Bahé, Y. M., McCarthy, I. G., Balogh, M. L., & Font, A. S. 2013, MNRAS, 430, 3017
- Balogh et al. (2004) Balogh, M. L., Baldry, I. K., Nichol, R., et al. 2004, ApJL, 615, L101
- Balogh et al. (1999) Balogh, M. L., Morris, S. L., Yee, H. K. C., Carlberg, R. G., & Ellingson, E. 1999, ApJ, 527, 54
- Basilakos et al. (2001) Basilakos, S., Plionis, M., & Rowan-Robinson, M. 2001, MNRAS, 323, 47
- Bezanson et al. (2012) Bezanson, R., van Dokkum, P., & Franx, M. 2012, ApJ, 760, 62
- Bianconi et al. (2018) Bianconi, M., Smith, G. P., Haines, C. P., et al. 2018, MNRAS, 473, L79
- Blanton et al. (2001) Blanton, M. R., Dalcanton, J., Eisenstein, D., et al. 2001, AJ, 121, 2358
- Blanton et al. (2003) Blanton, M. R., Hogg, D. W., Bahcall, N. A., et al. 2003, ApJ, 592, 819
- Blanton & Roweis (2007) Blanton, M. R. & Roweis, S. 2007, AJ, 133, 734
- Bluck et al. (2020) Bluck, A. F. L., Maiolino, R., Sánchez, S. F., et al. 2020, MNRAS, 492, 96
- Bond et al. (1996) Bond, J. R., Kofman, L., & Pogosyan, D. 1996, Nature, 380, 603
- Bonnaire et al. (2020) Bonnaire, T., Aghanim, N., Decelle, A., & Douspis, M. 2020, A&A, 637, A18
- Boselli & Gavazzi (2006) Boselli, A. & Gavazzi, G. 2006, PASP, 118, 517
- Braglia et al. (2007) Braglia, F., Pierini, D., & Böhringer, H. 2007, A&A, 470, 425
- Brinchmann et al. (2004) Brinchmann, J., Charlot, S., White, S. D. M., et al. 2004, MNRAS, 351, 1151
- Bruzual & Charlot (2003) Bruzual, G. & Charlot, S. 2003, MNRAS, 344, 1000
- Cappellari & Emsellem (2004) Cappellari, M. & Emsellem, E. 2004, PASP, 116, 138
- Cautun et al. (2013) Cautun, M., van de Weygaert, R., & Jones, B. J. T. 2013, MNRAS, 429, 1286
- Chiang et al. (2013) Chiang, Y.-K., Overzier, R., & Gebhardt, K. 2013, ApJ, 779, 127
- Chon et al. (2014) Chon, G., Böhringer, H., Collins, C. A., & Krause, M. 2014, A&A, 567, A144
- Chon et al. (2013) Chon, G., Böhringer, H., & Nowak, N. 2013, MNRAS, 429, 3272
- Chon et al. (2015) Chon, G., Böhringer, H., & Zaroubi, S. 2015, A&A, 575, L14
- Chow-Martínez et al. (2014) Chow-Martínez, M., Andernach, H., Caretta, C. A., & Trejo-Alonso, J. J. 2014, MNRAS, 445, 4073
- Codis et al. (2018) Codis, S., Pogosyan, D., & Pichon, C. 2018, MNRAS, 479, 973
- Colombi et al. (2000) Colombi, S., Pogosyan, D., & Souradeep, T. 2000, Phys. Rev. Lett., 85, 5515
- Contini et al. (2020) Contini, E., Gu, Q., Ge, X., et al. 2020, ApJ, 889, 156
- Croton et al. (2006) Croton, D. J., Springel, V., White, S. D. M., et al. 2006, MNRAS, 365, 11
- Cucciati et al. (2006) Cucciati, O., Iovino, A., Marinoni, C., et al. 2006, A&A, 458, 39
- Dariush et al. (2010) Dariush, A. A., Raychaudhury, S., Ponman, T. J., et al. 2010, MNRAS, 405, 1873
- Darragh Ford et al. (2019) Darragh Ford, E., Laigle, C., Gozaliasl, G., et al. 2019, MNRAS, 489, 5695
- de Vaucouleurs (1953) de Vaucouleurs, G. 1953, AJ, 58, 30
- de Vaucouleurs (1958) de Vaucouleurs, G. 1958, Nature, 182, 1478
- Deason et al. (2013) Deason, A. J., Conroy, C., Wetzel, A. R., & Tinker, J. L. 2013, ApJ, 777, 154
- Deshev et al. (2017) Deshev, B., Finoguenov, A., Verdugo, M., et al. 2017, A&A, 607, A131
- Deshev et al. (2020) Deshev, B., Haines, C., Hwang, H. S., et al. 2020, A&A, 638, A126
- Dressler (1980) Dressler, A. 1980, ApJ, 236, 351
- Dupuy et al. (2019) Dupuy, A., Courtois, H. M., Dupont, F., et al. 2019, MNRAS, 489, L1
- Džudžar et al. (2019) Džudžar, R., Kilborn, V., Murugeshan, C., et al. 2019, MNRAS, 490, L6
- Einasto et al. (2003a) Einasto, J., Einasto, M., Hütsi, G., et al. 2003a, A&A, 410, 425
- Einasto et al. (2007a) Einasto, J., Einasto, M., Saar, E., et al. 2007a, A&A, 462, 397
- Einasto et al. (2003b) Einasto, J., Hütsi, G., Einasto, M., et al. 2003b, A&A, 405, 425
- Einasto et al. (2020) Einasto, J., Hütsi, G., Suhhonenko, I., Liivamägi, L. J., & Einasto, M. 2020, arXiv e-prints, arXiv:2005.03480
- Einasto et al. (1980) Einasto, J., Jôeveer, M., & Saar, E. 1980, Nature, 283, 47
- Einasto et al. (1974) Einasto, J., Saar, E., Kaasik, A., & Chernin, A. D. 1974, Nature, 252, 111
- Einasto et al. (2018a) Einasto, J., Suhhonenko, I., Liivamägi, L. J., & Einasto, M. 2018a, A&A, 616, A141
- Einasto et al. (2019) Einasto, J., Suhhonenko, I., Liivamägi, L. J., & Einasto, M. 2019, A&A, 623, A97
- Einasto et al. (2018b) Einasto, M., Deshev, B., Lietzen, H., et al. 2018b, A&A, 610, A82
- Einasto & Einasto (1987) Einasto, M. & Einasto, J. 1987, MNRAS, 226, 543
- Einasto et al. (1994) Einasto, M., Einasto, J., Tago, E., Dalton, G. B., & Andernach, H. 1994, MNRAS, 269, 301
- Einasto et al. (2007b) Einasto, M., Einasto, J., Tago, E., et al. 2007b, A&A, 464, 815
- Einasto et al. (2018c) Einasto, M., Gramann, M., Park, C., et al. 2018c, A&A, 620, A149
- Einasto et al. (2015) Einasto, M., Gramann, M., Saar, E., et al. 2015, A&A, 580, A69
- Einasto et al. (2016) Einasto, M., Lietzen, H., Gramann, M., et al. 2016, A&A, 595, A70
- Einasto et al. (2014) Einasto, M., Lietzen, H., Tempel, E., et al. 2014, A&A, 562, A87
- Einasto et al. (2011a) Einasto, M., Liivamägi, L. J., Tago, E., et al. 2011a, A&A, 532, A5
- Einasto et al. (2011b) Einasto, M., Liivamägi, L. J., Tempel, E., et al. 2011b, ApJ, 736, 51
- Einasto et al. (2012) Einasto, M., Liivamägi, L. J., Tempel, E., et al. 2012, A&A, 542, A36
- Einasto et al. (2010) Einasto, M., Tago, E., Saar, E., et al. 2010, A&A, 522, A92
- Elbaz et al. (2007) Elbaz, D., Daddi, E., Le Borgne, D., et al. 2007, A&A, 468, 33
- Erdoǧdu et al. (2004) Erdoǧdu, P., Lahav, O., Zaroubi, S., et al. 2004, MNRAS, 352, 939
- Fossati et al. (2017) Fossati, M., Wilman, D. J., Mendel, J. T., et al. 2017, ApJ, 835, 153
- Galametz et al. (2018) Galametz, A., Pentericci, L., Castellano, M., et al. 2018, MNRAS, 475, 4148
- Ganeshaiah Veena et al. (2019) Ganeshaiah Veena, P., Cautun, M., Tempel, E., van de Weygaert, R., & Frenk, C. S. 2019, MNRAS, 487, 1607
- Geller et al. (2013) Geller, M. J., Diaferio, A., Rines, K. J., & Serra, A. L. 2013, ApJ, 764, 58
- Giovanelli et al. (1986) Giovanelli, R., Haynes, M. P., & Chincarini, G. L. 1986, ApJ, 300, 77
- Gómez et al. (2003) Gómez, P. L., Nichol, R. C., Miller, C. J., et al. 2003, ApJ, 584, 210
- Goto et al. (2003) Goto, T., Yamauchi, C., Fujita, Y., et al. 2003, MNRAS, 346, 601
- Gouin et al. (2020) Gouin, C., Aghanim, N., Bonjean, V., & Douspis, M. 2020, A&A, 635, A195
- Gozaliasl et al. (2014) Gozaliasl, G., Finoguenov, A., Khosroshahi, H. G., et al. 2014, A&A, 566, A140
- Graham et al. (2005) Graham, A. W., Driver, S. P., Petrosian, V., et al. 2005, AJ, 130, 1535
- Gramann et al. (2015) Gramann, M., Einasto, M., Heinämäki, P., et al. 2015, A&A, 581, A135
- Gunn & Gott (1972) Gunn, J. E. & Gott, J. Richard, I. 1972, ApJ, 176, 1
- Haines et al. (2017) Haines, C. P., Iovino, A., Krywult, J., et al. 2017, A&A, 605, A4
- Haines et al. (2015) Haines, C. P., Pereira, M. J., Smith, G. P., et al. 2015, ApJ, 806, 101
- Hamabata et al. (2019) Hamabata, A., Oogi, T., Oguri, M., Nishimichi, T., & Nagashima, M. 2019, MNRAS, 488, 4117
- Henriques et al. (2019) Henriques, B. M. B., White, S. D. M., Lilly, S. J., et al. 2019, MNRAS, 485, 3446
- Hong et al. (2020) Hong, S., Jeong, D., Hwang, H. S., et al. 2020, MNRAS, 493, 5972
- Huertas-Company et al. (2011) Huertas-Company, M., Aguerri, J. A. L., Bernardi, M., Mei, S., & Sánchez Almeida, J. 2011, A&A, 525, A157
- Ihaka & Gentleman (1996) Ihaka, R. & Gentleman, R. 1996, Journal of Computational and Graphical Statistics, 5, 299
- Jõeveer et al. (1978) Jõeveer, M., Einasto, J., & Tago, E. 1978, MNRAS, 185, 357
- Jaffé et al. (2016) Jaffé, Y. L., Verheijen, M. A. W., Haines, C. P., et al. 2016, MNRAS, 461, 1202
- Kanagusuku et al. (2016) Kanagusuku, M. J., Díaz-Giménez, E., & Zandivarez, A. 2016, A&A, 586, A40
- Kauffmann et al. (2003a) Kauffmann, G., Heckman, T. M., White, S. D. M., et al. 2003a, MNRAS, 341, 33
- Kauffmann et al. (2003b) Kauffmann, G., Heckman, T. M., White, S. D. M., et al. 2003b, MNRAS, 341, 54
- Kauffmann et al. (2004) Kauffmann, G., White, S. D. M., Heckman, T. M., et al. 2004, MNRAS, 353, 713
- Kelkar et al. (2019) Kelkar, K., Gray, M. E., Aragón-Salamanca, A., et al. 2019, MNRAS, 486, 868
- Kim et al. (2015) Kim, J., Park, C., L’Huillier, B., & Hong, S. E. 2015, Journal of Korean Astronomical Society, 48, 213
- Kofman & Shandarin (1988) Kofman, L. A. & Shandarin, S. F. 1988, Nature, 334, 129
- Komatsu et al. (2011) Komatsu, E., Smith, K. M., Dunkley, J., et al. 2011, ApJS, 192, 18
- Kopylova & Kopylov (2007) Kopylova, F. G. & Kopylov, A. I. 2007, Astronomy Letters, 33, 211
- Kraljic et al. (2020) Kraljic, K., Pichon, C., Codis, S., et al. 2020, MNRAS, 491, 4294
- Kraljic et al. (2019) Kraljic, K., Pichon, C., Dubois, Y., et al. 2019, MNRAS, 483, 3227
- Kuutma et al. (2020) Kuutma, T., Poudel, A., Einasto, M., et al. 2020, arXiv e-prints, arXiv:2006.04463
- Lietzen et al. (2012) Lietzen, H., Tempel, E., Heinämäki, P., et al. 2012, A&A, 545, A104
- Liivamägi et al. (2012) Liivamägi, L. J., Tempel, E., & Saar, E. 2012, A&A, 539, A80
- Liu et al. (2018) Liu, A., Yu, H., Diaferio, A., et al. 2018, ApJ, 863, 102
- Łokas (2020) Łokas, E. L. 2020, A&A, 638, A133
- Luparello et al. (2011) Luparello, H., Lares, M., Lambas, D. G., & Padilla, N. 2011, MNRAS, 415, 964
- Maier et al. (2019) Maier, C., Ziegler, B. L., Haines, C. P., & Smith, G. P. 2019, A&A, 621, A131
- Malavasi et al. (2020) Malavasi, N., Aghanim, N., Douspis, M., Tanimura, H., & Bonjean, V. 2020, arXiv e-prints, arXiv:2002.01486
- Malavasi et al. (2017) Malavasi, N., Arnouts, S., Vibert, D., et al. 2017, MNRAS, 465, 3817
- Mamon et al. (2020) Mamon, G. A., Trevisan, M., Thuan, T. X., Gallazzi, A., & Davé, R. 2020, MNRAS, 492, 1791
- Markevitch et al. (2000) Markevitch, M., Ponman, T. J., Nulsen, P. E. J., et al. 2000, ApJ, 541, 542
- Martínez & Saar (2002) Martínez, V. J. & Saar, E. 2002, Statistics of the Galaxy Distribution (Chapman & Hall/CRC, Boca Raton)
- Masters et al. (2010) Masters, K. L., Mosleh, M., Romer, A. K., et al. 2010, MNRAS, 405, 783
- Matteucci et al. (2006) Matteucci, F., Panagia, N., Pipino, A., et al. 2006, MNRAS, 372, 265
- McCarthy et al. (2008) McCarthy, I. G., Frenk, C. S., Font, A. S., et al. 2008, MNRAS, 383, 593
- McGee et al. (2009) McGee, S. L., Balogh, M. L., Bower, R. G., Font, A. S., & McCarthy, I. G. 2009, MNRAS, 400, 937
- McGee et al. (2014) McGee, S. L., Bower, R. G., & Balogh, M. L. 2014, MNRAS, 442, L105
- Merlin et al. (2019) Merlin, E., Fortuni, F., Torelli, M., et al. 2019, MNRAS, 490, 3309
- Moore et al. (1996) Moore, B., Katz, N., Lake, G., Dressler, A., & Oemler, A. 1996, Nature, 379, 613
- Musso et al. (2018) Musso, M., Cadiou, C., Pichon, C., et al. 2018, MNRAS, 476, 4877
- Muzzin et al. (2014) Muzzin, A., van der Burg, R. F. J., McGee, S. L., et al. 2014, ApJ, 796, 65
- Muzzin et al. (2012) Muzzin, A., Wilson, G., Yee, H. K. C., et al. 2012, ApJ, 746, 188
- Nulsen (1982) Nulsen, P. E. J. 1982, MNRAS, 198, 1007
- Nusser et al. (1991) Nusser, A., Dekel, A., Bertschinger, E., & Blumenthal, G. R. 1991, ApJ, 379, 6
- Oman et al. (2013) Oman, K. A., Hudson, M. J., & Behroozi, P. S. 2013, MNRAS, 431, 2307
- Oort (1983) Oort, J. H. 1983, ARA&A, 21, 373
- Overzier (2016) Overzier, R. A. 2016, A&A Rev., 24, 14
- Park et al. (2012) Park, C., Choi, Y.-Y., Kim, J., et al. 2012, ApJL, 759, L7
- Park et al. (2007) Park, C., Choi, Y.-Y., Vogeley, M. S., et al. 2007, ApJ, 658, 898
- Pasquali et al. (2019) Pasquali, A., Smith, R., Gallazzi, A., et al. 2019, MNRAS, 484, 1702
- Peebles (1980) Peebles, P. J. E. 1980, The large-scale structure of the universe (Princeton University Press)
- Peng et al. (2015) Peng, Y., Maiolino, R., & Cochrane, R. 2015, Nature, 521, 192
- Peng et al. (2010) Peng, Y.-j., Lilly, S. J., Kovač, K., et al. 2010, ApJ, 721, 193
- Pomarède et al. (2015) Pomarède, D., Tully, R. B., Hoffman, Y., & Courtois, H. M. 2015, ApJ, 812, 17
- Ponman et al. (1994) Ponman, T. J., Allan, D. J., Jones, L. R., et al. 1994, Nature, 369, 462
- Porter et al. (2008) Porter, S. C., Raychaudhury, S., Pimbblet, K. A., & Drinkwater, M. J. 2008, MNRAS, 388, 1152
- Postman & Geller (1984) Postman, M. & Geller, M. J. 1984, ApJ, 281, 95
- Raouf et al. (2016) Raouf, M., Khosroshahi, H. G., & Dariush, A. 2016, ApJ, 824, 140
- Rhee et al. (2020) Rhee, J., Smith, R., Choi, H., et al. 2020, ApJS, 247, 45
- Rhee et al. (2017) Rhee, J., Smith, R., Choi, H., et al. 2017, ApJ, 843, 128
- Ribeiro et al. (2013) Ribeiro, A. L. B., de Carvalho, R. R., Trevisan, M., et al. 2013, MNRAS, 434, 784
- Roberts et al. (2019) Roberts, I. D., Parker, L. C., Brown, T., et al. 2019, ApJ, 873, 42
- Santiago-Bautista et al. (2020) Santiago-Bautista, I., Caretta, C. A., Bravo-Alfaro, H., Pointecouteau, E., & Andernach, H. 2020, A&A, 637, A31
- Sarron et al. (2019) Sarron, F., Adami, C., Durret, F., & Laigle, C. 2019, A&A, 632, A49
- Sarzi et al. (2006) Sarzi, M., Falcón-Barroso, J., Davies, R. L., et al. 2006, MNRAS, 366, 1151
- Shankar et al. (2009) Shankar, F., Bernardi, M., & Haiman, Z. 2009, ApJ, 694, 867
- Skibba et al. (2009) Skibba, R. A., Bamford, S. P., Nichol, R. C., et al. 2009, MNRAS, 399, 966
- Smith et al. (2019) Smith, R., Pacifici, C., Pasquali, A., & Calderón-Castillo, P. 2019, ApJ, 876, 145
- Sousbie (2011) Sousbie, T. 2011, MNRAS, 414, 350
- Teerikorpi et al. (2015) Teerikorpi, P., Heinämäki, P., Nurmi, P., et al. 2015, A&A, 577, A144
- Tempel et al. (2009) Tempel, E., Einasto, J., Einasto, M., Saar, E., & Tago, E. 2009, A&A, 495, 37
- Tempel et al. (2011) Tempel, E., Saar, E., Liivamägi, L. J., et al. 2011, A&A, 529, A53
- Tempel et al. (2016) Tempel, E., Stoica, R. S., Kipper, R., & Saar, E. 2016, Astronomy and Computing, 16, 17
- Tempel et al. (2014a) Tempel, E., Stoica, R. S., Martínez, V. J., et al. 2014a, MNRAS, 438, 3465
- Tempel et al. (2012) Tempel, E., Tago, E., & Liivamägi, L. J. 2012, A&A, 540, A106
- Tempel et al. (2014b) Tempel, E., Tamm, A., Gramann, M., et al. 2014b, A&A, 566, A1
- Tomczak et al. (2019) Tomczak, A. R., Lemaux, B. C., Lubin, L. M., et al. 2019, MNRAS, 484, 4695
- Tremonti et al. (2004) Tremonti, C. A., Heckman, T. M., Kauffmann, G., et al. 2004, ApJ, 613, 898
- Trussler et al. (2020) Trussler, J., Maiolino, R., Maraston, C., et al. 2020, MNRAS, 491, 5406
- Tully et al. (2014) Tully, R. B., Courtois, H., Hoffman, Y., & Pomarède, D. 2014, Nature, 513, 71
- Venturi et al. (2017) Venturi, T., Rossetti, M., Brunetti, G., et al. 2017, A&A, 603, A125
- Verdugo et al. (2012) Verdugo, M., Lerchster, M., Böhringer, H., et al. 2012, MNRAS, 421, 1949
- Vitorelli et al. (2018) Vitorelli, A. Z., Cypriano, E. S., Makler, M., et al. 2018, MNRAS, 474, 866
- Voit (2005) Voit, G. M. 2005, Reviews of Modern Physics, 77, 207
- White & Rees (1978) White, S. D. M. & Rees, M. J. 1978, MNRAS, 183, 341
- Yasuda et al. (2001) Yasuda, N., Fukugita, M., Narayanan, V. K., et al. 2001, AJ, 122, 1104
- Yun et al. (2019) Yun, K., Pillepich, A., Zinger, E., et al. 2019, MNRAS, 483, 1042
- Zavala et al. (2019) Zavala, J. A., Casey, C. M., Scoville, N., et al. 2019, ApJ, 887, 183
- Zucca et al. (1993) Zucca, E., Zamorani, G., Scaramella, R., & Vettolani, G. 1993, ApJ, 407, 470
Appendix A Spherical collapse model and characteristic density contrasts
The standard cosmological model states that the formation and evolution of the structure in the Universe is governed by the gravitational attraction of dark matter and the repulsion of dark energy. The evolution and dynamical state of a spherically symmetric perturbation can be described with a spherical collapse model. We use this model to find characteristic scales for SCl A2142 that are related to its evolution. According to this model, the dynamical state of a perturbation is determined by the mass in its interior (Gunn & Gott 1972; Peebles 1980), usually described using the density contrast. The density contrast of spherical perturbation is defined as
| (3) |
where denotes the matter density in the volume with mass . is the mean matter density in the local universe (see Gramann et al. 2015; Chon et al. 2015, for details and references). Density contrast for a spherical volume is
| (4) |
The mass of a structure inside a sphere can be found using Eq. (4):
| (5) |
The spherical collapse model defines several epochs in the evolution of a perturbation, each of which has a characteristic density contrast. Corresponding density contrasts are marked in Fig. 12. The turnaround (T) corresponds to the epoch at which a spherical overdensity region reaches its maximum expansion and the collapse begins. The density contrast at turnaround (for the cosmological parameters used in this paper, see, for example, Gramann et al. 2015). In cosmology without dark energy the density contrast at turnaround (Martínez & Saar 2002). Overdensity regions which turnaround and collapse in the future (FC) have present overdensity (Chon et al. 2015). The density contrast corresponds to so-called zero gravity (ZG), at which the radial peculiar velocity component of test particle velocity equals the Hubble expansion and the gravitational attraction of the system and its expansion are equal. The density contrast corresponds to linear mass scale or the Einstein-Straus radius at which the radial velocity around a system reaches the Hubble velocity, and peculiar velocities (Teerikorpi et al. 2015; Gramann et al. 2015). This scale approximately corresponds to the cocoon boundaries.
Additionally, we show in Fig. 12 the density contrast . In galaxy group and cluster studies the density contrast is often used to determine group or cluster radius, called as . In cosmology without dark energy, the density contrast which corresponds to the virial radius of the cluster has a value close to this, (Martínez & Saar 2002; Voit 2005), However, often is used without specifying how it is defined (see short discussion in Voit 2005). In the standard CDM model, the virial density contrast is (Gramann et al. 2015). This is also marked in Fig. 12. In units of critical density, the density contrast at virial radius of a cluster is (Gramann et al. 2015).
To calculate the mass and to estimate mass errors for the supercluster in Fig. 12, we followed the procedure from Einasto et al. (2018c). In this study the dynamical mass of groups with at least four member galaxies was taken from Tempel et al. (2014b). Mass estimates of very poor groups with less than four galaxies have very large scatter. For this reason we used their median mass. To obtain the total mass of very poor groups, this median mass was multiplied by the number of groups. To calculate errors, 50% mass errors were used.