\ul
Thermal dissipation as both the strength and weakness of matter.
A material failure prediction by monitoring creep
———————————————————————–
Electronic Supplementary Information (ESI)
I Analytical approximation
of the avalanche threshold
Let us start this additional material with the analytical approximations of the temperature at a running crack tip. Assuming a quasi-constant velocity and energy release rate, some simplified expressions can indeed be derived 1 for . At low velocity, the typical diffusion skin depth is large compared to the radius of the heat production zone () and the heat diffusion is hence the ruling process:
| (1) |
At high velocity, however, the rise in temperature is limited by the scale over which heat is produced and:
| (2) |
Between these two cases, and typically for , an intermediate regime holds:
| (3) |
We invite the reader to a more in-depth derivation of these equations in Toussaint et al. 1 or Vincent-Dospital et al. 2.
Now that some straightforward expressions for are known, we can move on to infer . Our model, the Arrhenius law as considered in the main manuscript, defines a function such that :
| (4) |
To lighten the equations that will follow, we have here denoted the ratio . We have discussed, in the main manuscript, how this relation might have one to three solutions depending on (see Fig. 1). Two particular energy release rates mark the passages from a singular to multiple solutions: the avalanche threshold , of interest in this study, and another threshold, , which is the load at which an avalanche has to stop.
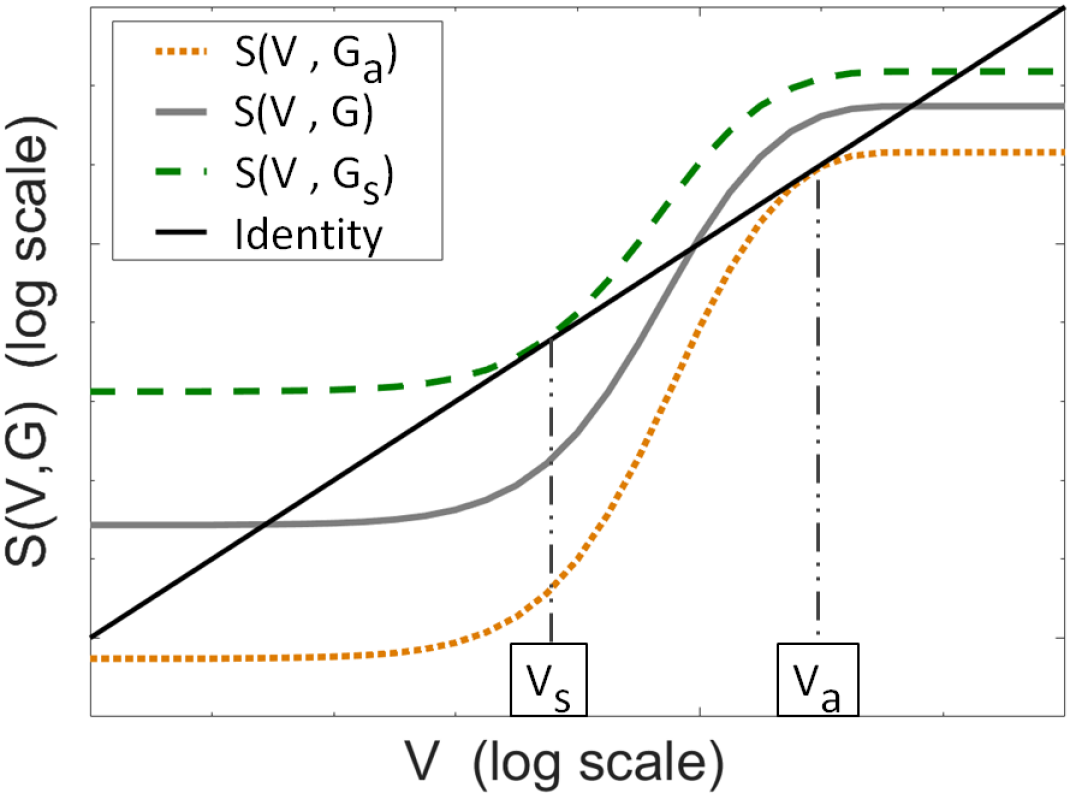
All functions being continuously smooth, the switch from one solution to three solutions implies that is tangent to the identity function for these two particular , as illustrated in Fig 1.
and the corresponding velocity must therefore verify the following system of equations:
| (5) | |||
| (6) |
To solve this system, we assume that the transition towards the fast phase happens in a regime where the temperature elevation still increases linearly with the crack velocity (i.e., (1)). Equation (6) then becomes:
| (7) |
Inserting Eq. (5) back into (7) leads to the following quadratic equation in :
| (8) |
While it might of course hold two solutions, only the lower one is of interest to derive the avalanche threshold . The upper solution would indeed correspond to the ‘arrest’ of the crack avalanche, but the initial hypothesis of would there be wrong anyway, as this ‘arrest’ occurs while on the quick (hot) propagation branch. Focusing therefore on the lower solution of (8), we have:
| (9) |
with . This equation indicates at which slow velocity a crack avalanches, given the corresponding threshold. Substituting (9) in (5), one finally derives the equality that defines the avalanche threshold:
| (10) |
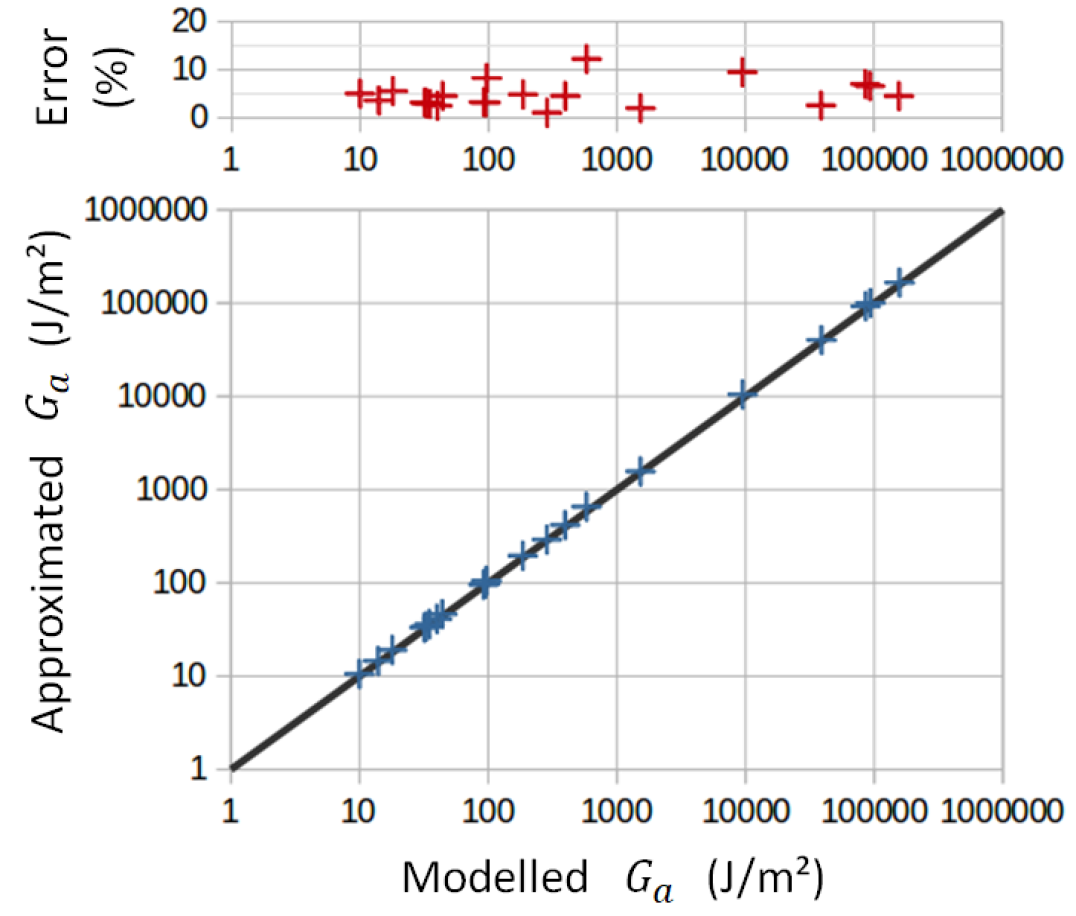
Such an expression gives a fairly good approximation of as predicted by the model. The only hypothesis was indeed the validity of Eq. (1), that is and, for the materials that we have studied in our manuscript, this ratio ranges from to . While Eq. (10) is easy to solve for with any numerical method, it can however be further simplified by grossly assuming that and by developing the term . We thus obtain the equation presented in the manuscript:
| (11) |
Figure 2 shows the quality of the approximation for , off by a few percents as, as shown in Tab. 1, the hypothesis is not strictly valid.
II The arrest threshold
(for completeness)
Similarly, one can solve (5) and (6) at the ‘arrest’ point: the transition from a quick regime back to the low velocity phase, occurring at the particular load . While is vastly reported for a lot of materials, making it the topic of this manuscript, is more rarely reported, so that the following computation is given for completeness. We here assume that the transition arises when the crack cools down from the plateau temperature (2), along the intermediate slope defined by (3). We thus turn the system into a quadratic equation of :
| (12) |
the upper solution of which, together with Eq. (5), leads to:
| (13) |
where . When inserting (13) back into (5), one gets:
| (14) |
Assuming that and , Eq. (14) further simplifies to:
| (15) |
which gives a relatively simple expression to invert for .
III Sensitivity of the parameter
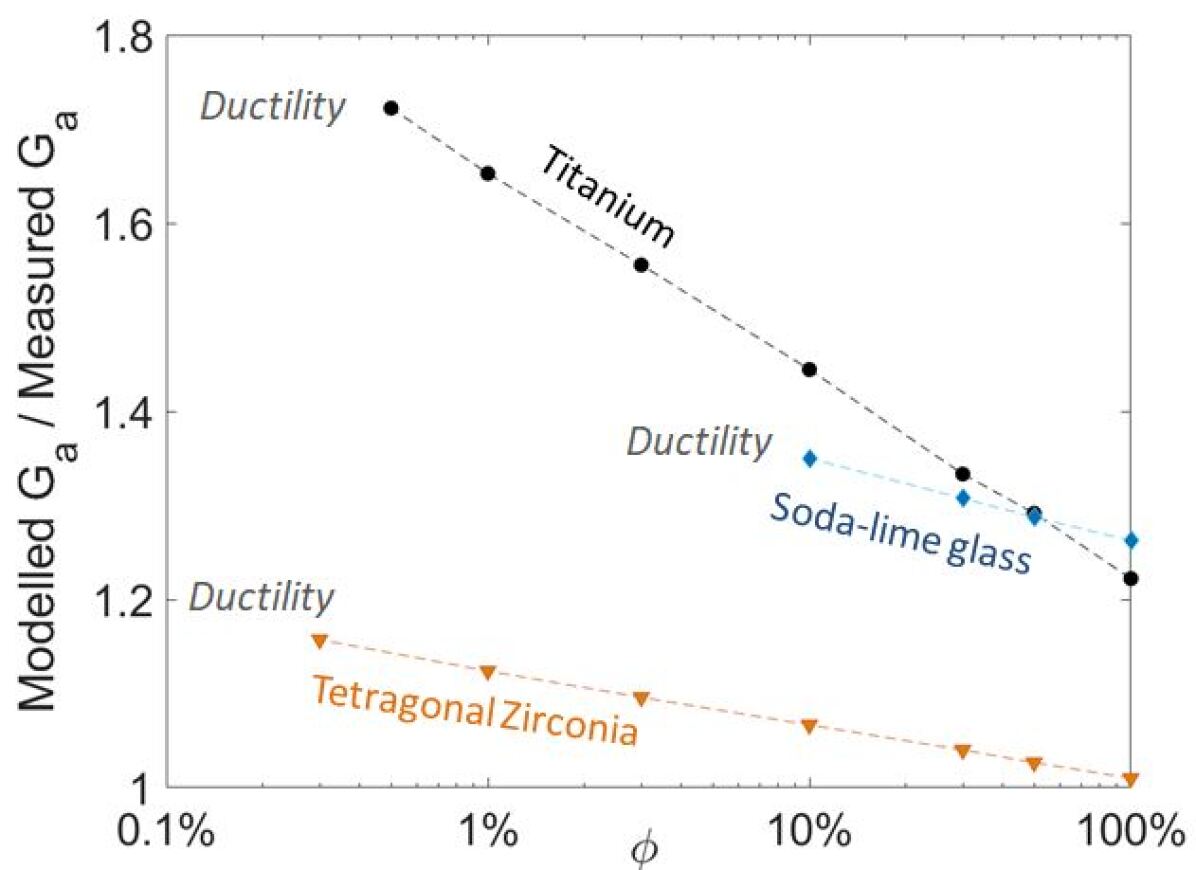
The percentage of energy that is converted into heat in the heat zone of radius is a parameter that we have broadly assumed to be . In practice, this parameter is unknown, and shall likely be material dependent. In Fig. 3, we show the variation in our model prediction of the failure threshold when varying , for three materials spanning the whole range of considered toughnesses. The higher , the less is (e.g., see Eq.(11)), as it makes the crack tip hotter at a lower load. As shown in the figure, when considering small values of this heat efficiency, one can also obtain an all ductile behavior 2, as the crack becomes too cold to hold an instability in its dynamics. In this case, the modelled crack velocity only increases exponentially to , as a function of the energy release rate , and no velocity jump (defining ) is obtained.
IV Materials creep crossplots
and parameters table
| (SI) | (-) | (m/s) | (Å) | (K) | (J/m2) | real (J/m2) | model (J/m2) | Ra (-) | |
|---|---|---|---|---|---|---|---|---|---|
| Acrylic adhesive | 0.4 | 1 | 30 | 10 | 296 | 150 | 90 | 97 | 5.7 |
| Paper | 0.035 | 0.12 | 1300 | 1000 | 296 | 25000 | 14000 | 9500 | 15.6 |
| Bulk PMMA | 0.18 | 0.2 | 880 | 80 | 296 | 1300 | 700 | 580 | 10.9 |
| Interfacial PMMA | 0.18 | 0.2 | 880 | 8 | 298 | 275 | 140 | 190 | 13.5 |
| HD Polyethylene | 0.4 | 0.5 | 900 | 8500 | 293 | 200000 | 70000 | 87000 | 16.6 |
| Soda lime glass | 1 | 0.5 | 3400 | 0.3 | 296 | 12 | 8 | 10 | 8.3 |
| Sapphire | 24 | 0.5 | 6000 | 0.8 | 296 | 36 | 20 | 32 | 6 |
| Quartz | 8 | 0.5 | 3400 | 0.6 | 293 | 21 | 13 | 18 | 5.7 |
| Westerly Granite (ambient) | 2 | 0.5 | 3000 | 4 | 293 | 120 | 68 | 92 | 8.5 |
| Westerly Granite (hot) | 2 | 0.5 | 3000 | 0.7 | 573 | 43 | 24 | 35 | 6.8 |
| Kumamoto Andesite | 1 | 0.5 | 2200 | 3 | 330 | 120 | 80 | 97 | 8.8 |
| Scioto Sandstone | 2 | 0.5 | 2000 | 2 | 296 | 55 | 37 | 44 | 7.3 |
| Cement paste | 1 | 0.5 | 2200 | 3 | 298 | 310 | 250 | 280 | 10.7 |
| HSULP Concrete | 0.8 | 0.5 | 3000 | 1 | 293 | 44 | 38 | 40 | 9.9 |
| Vitreous carbon | 5 | 0.5 | 2600 | 0.2 | 296 | 15 | 13 | 14 | 7.2 |
| Lead Zirconate Titanate (PZT) | 1 | 0.5 | 2000 | 1 | 296 | 40 | 24 | 33 | 11.3 |
| Tetragonal zirconia (TZP) | 2 | 0.5 | 1600 | 40 | 298 | 1900 | 1500 | 1530 | 10.9 |
| Silicon nitride | 30 | 0.5 | 5500 | 45 | 1573 | 510 | 260 | 400 | 8.9 |
| 2650 T6 Aluminium alloy | 150 | 0.5 | 3100 | 1000 | 448 | 54500 | 27000 | 39000 | 10.1 |
| AISI 310S Stainless Steel alloy | 14 | 0.5 | 3000 | 9000 | 298 | 265000 | 102000 | 158000 | 13.4 |
| Ti-6A1-6V-2Sn Titanium | 7 | 0.5 | 3100 | 8000 | 298 | 190000 | 72000 | 93000 | 14.9 |
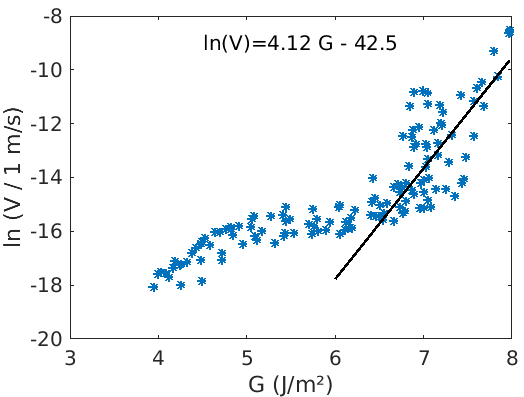
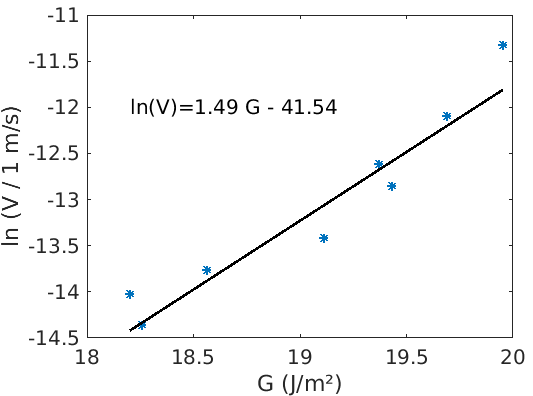
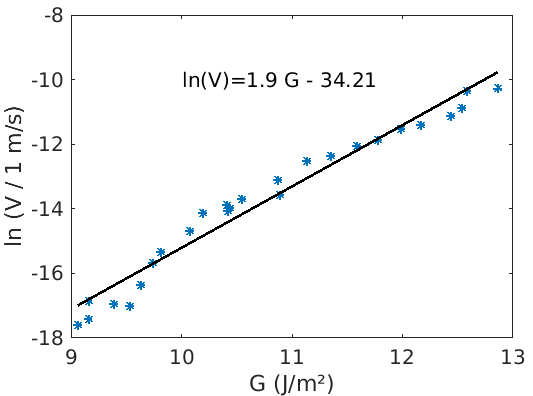
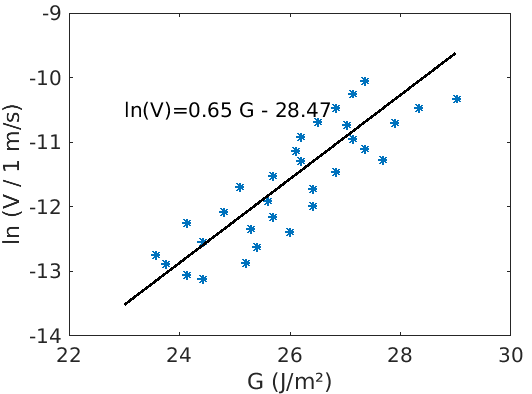
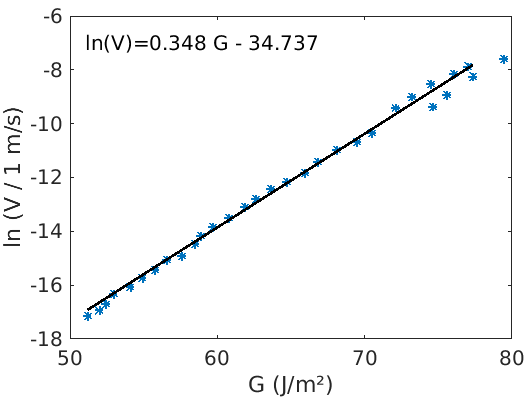
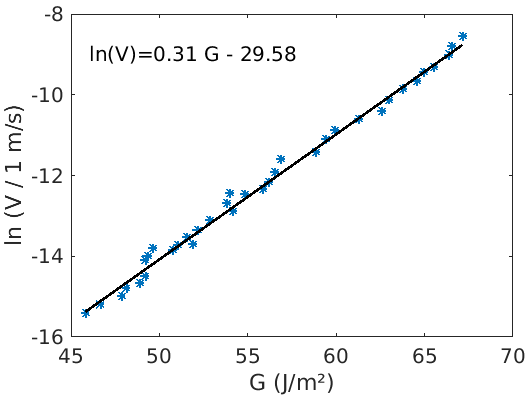
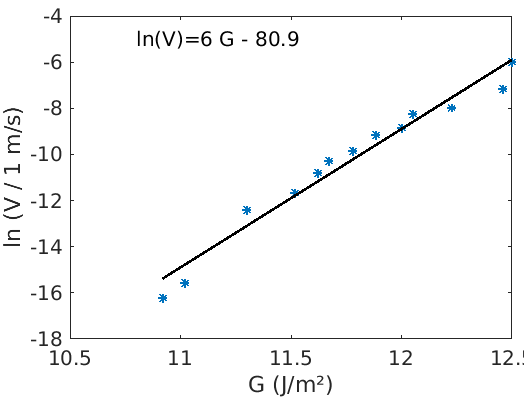
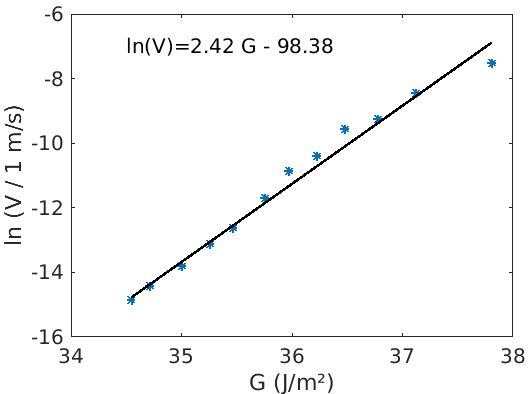
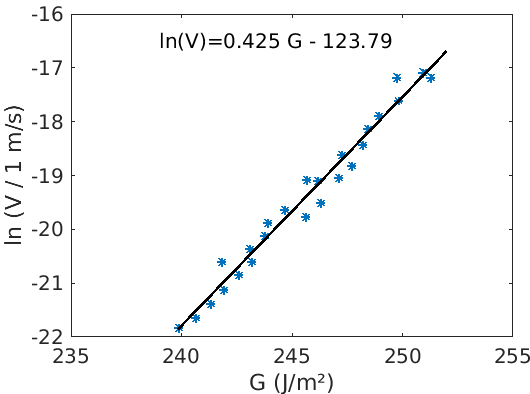
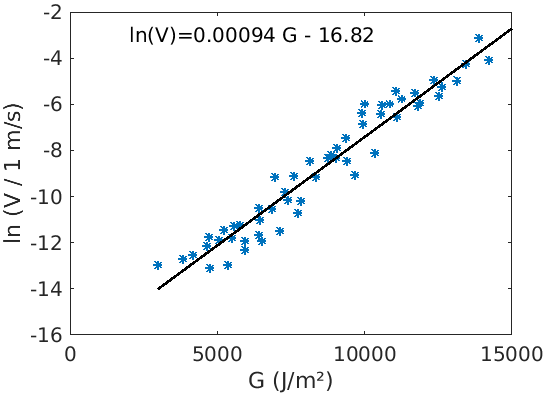
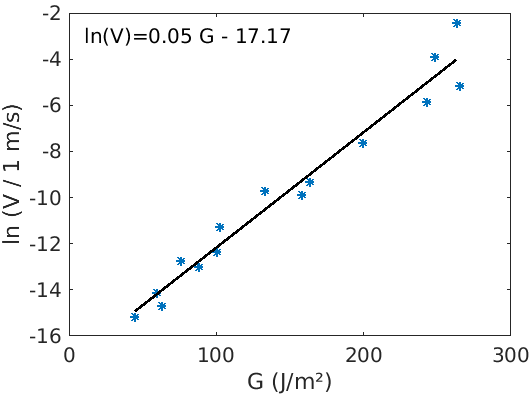
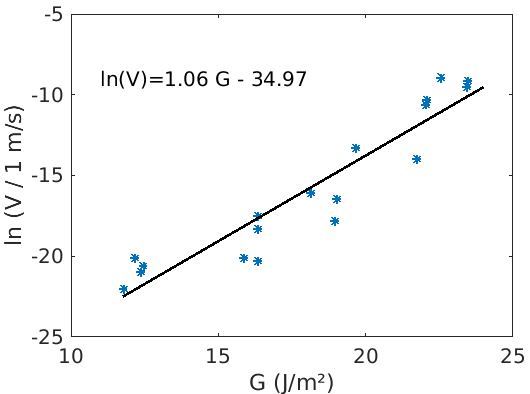
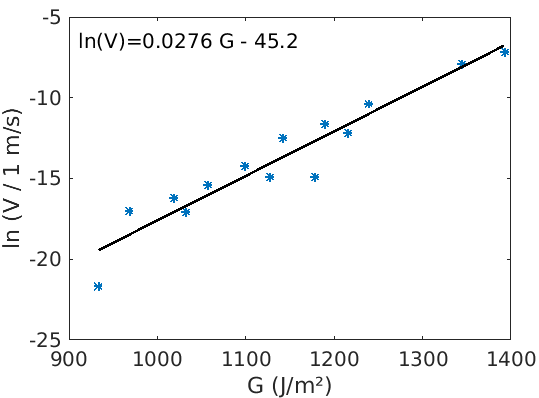
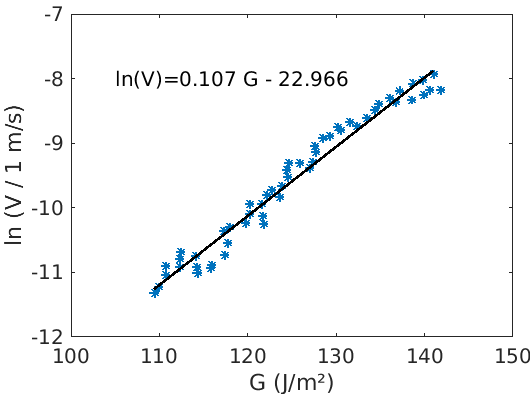
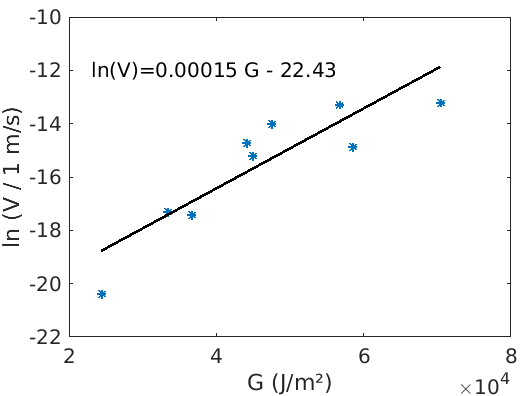
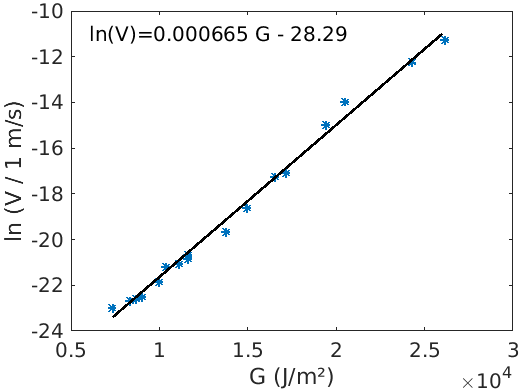
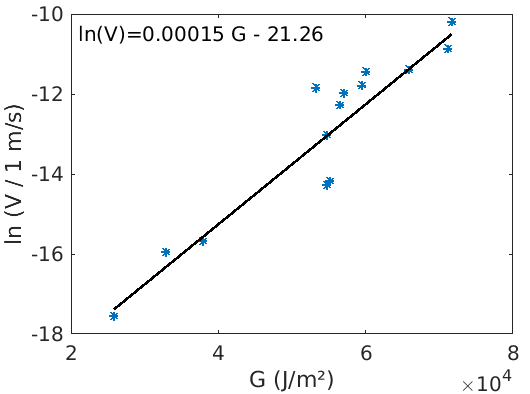
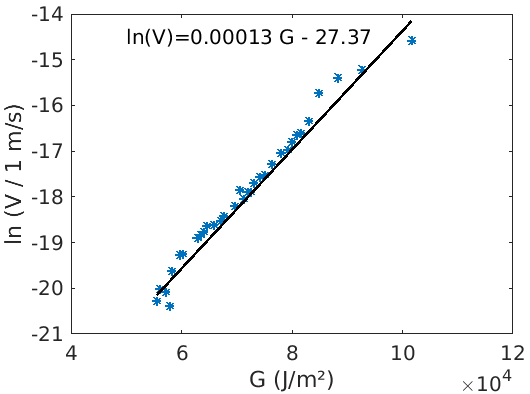
A summary of the model parameters considered for each media is also provided in Tab. 1. These parameters are deduced, as explained in the main manuscript, from the to creep data of these materials, shown in Fig 4 to Fig 21. One can notably notice the variability in fit quality for these datasets, that of course impacts our inversion work, but also how it is not always straightforward to know to which subcritical phase the data correspond (i.e., phase I to III, from environmental induced corrosion to void-like conditions).
References
- Toussaint et al. [2016] R. Toussaint, O. Lengliné, S. Santucci, T. Vincent-Dospital, M. Naert-Guillot, and K. J. Måløy. How cracks are hot and cool: a burning issue for paper. Soft Matter, 12:5563–5571, 2016. doi: 10.1039/C6SM00615A.
- Vincent-Dospital et al. [2020] T. Vincent-Dospital, R. Toussaint, A. Cochard, K. J. Måløy, and E. G. Flekkøy. Thermal weakening of cracks and brittle-ductile transition of matter: A phase model. Physical Review Materials, 02 2020. doi: 10.1103/PhysRevMaterials.4.023604.
- Wiederhorn [1967] S. M. Wiederhorn. Influence of water vapor on crack propagation in soda-lime glass. Journal of the American Ceramic Society, 50(8):407–414, 1967. doi: 10.1111/j.1151-2916.1967.tb15145.x.
- Wiederhorn and Krause [2002] S.M. Wiederhorn and R.F. Jr. Krause. Crack growth in sapphire. In Ceramic Engineering and Science Proceedings, volume 23, pages 71–82. Wiley, 2002.
- Dove [1995] P. M. Dove. Geochemical controls on the kinetics of quartz fracture at subcritical tensile stresses. Journal of Geophysical Research: Solid Earth, 100(B11):22349–22359, 1995. doi: 10.1029/95JB02155.
- Holder et al. [2001] J. Holder, J. E. Olson, and Z. Philip. Experimental determination of subcritical crack growth parameters in sedimentary rock. Geophysical Research Letters, 28(4):599–602, 2001. doi: 10.1029/2000GL011918.
- Nara and Kaneko [2005] Y. Nara and K. Kaneko. Study of subcritical crack growth in andesite using the double torsion test. International Journal of Rock Mechanics and Mining Sciences, 42(4):521 – 530, 2005. ISSN 1365-1609. doi: 10.1016/j.ijrmms.2005.02.001.
- Meredith and Atkinson [1985] P.G. Meredith and B.K. Atkinson. Fracture toughness and subcritical crack growth during high-temperature tensile deformation of westerly granite and black gabbro. Physics of the Earth and Planetary Interiors, 39(1):33 – 51, 1985. ISSN 0031-9201. doi: 10.1016/0031-9201(85)90113-X.
- Nadeau [1974] J. S. Nadeau. Subcritical crack growth in vitreous carbon at room temperature. Journal of the American Ceramic Society, 57(7):303–306, 1974. doi: 10.1111/j.1151-2916.1974.tb10906.x.
- Nara et al. [2010] Y. Nara, M. Takada, D. Mori, H. Owada, T. Yoneda, and K. Kaneko. Subcritical crack growth and long-term strength in rock and cementitious material. International Journal of Fracture, 164(1):57–71, Jul 2010. ISSN 1573-2673. doi: 10.1007/s10704-010-9455-z.
- Wang et al. [2016] W. Wang, T. Tong, and Q. Yu. Subcritical crack growth induced by stress corrosion in hardened cement paste. In 9th International Conference on Fracture Mechanics of Concrete and Concrete Structures. FraMCos, 2016. doi: 10.21012/FC9.177.
- Santucci [2004] S. Santucci. Croissance lente thermiquement activée et piégeage d’une fissure dans les matériaux structurés à une échelle mésoscopique : expériences et modèles. PhD thesis, Ecole normale supérieure de Lyon, www.theses.fr/2004ENSL0288, 2004.
- Evans and Wiederhorn [1974] A. G. Evans and S. M. Wiederhorn. Crack propagation and failure prediction in silicon nitride at elevated temperatures. Journal of Materials Science, 9(2):270–278, Feb 1974. ISSN 1573-4803. doi: 10.1007/BF00550951.
- Oates et al. [2004] W. S. Oates, C. S. Lynch, D. C. Lupascu, A. B. K. Njiwa, E. Aulbach, and J. Rödel. Subcritical crack growth in lead zirconate titanate. Journal of the American Ceramic Society, 87(7):1362–1364, 2004. doi: 10.1111/j.1151-2916.2004.tb07736.x.
- Chevalier et al. [1999] J. Chevalier, C. Olagnon, and G. Fantozzi. Subcritical crack propagation in 3Y-TZP ceramics: Static and cyclic fatigue. Journal of the American Ceramic Society, 82(11):3129–3138, 1999. doi: 10.1111/j.1151-2916.1999.tb02213.x.
- Lengliné et al. [2011] O. Lengliné, R. Toussaint, J. Schmittbuhl, J. E. Elkhoury, J. P. Ampuero, K. T. Tallakstad, S. Santucci, and K. J. Måløy. Average crack-front velocity during subcritical fracture propagation in a heterogeneous medium. Phys. Rev. E, 84:036104, Sep 2011. doi: 10.1103/PhysRevE.84.036104.
- Yoda et al. [2001] M. Yoda, M. Nabetani, and W. Shim. Creep crack growth in polyethylene under combined mode I and mode II loading. International Journal of Fracture, 112(3):21–26, Dec 2001. ISSN 1573-2673. doi: 10.1023/A:1022681718523.
- Hénaff et al. [2011] G. Hénaff, G. Odemer, and B. Journet. Creep and creep-fatigue crack growth in aluminium alloys. In Aluminium Alloys, Theory and Applications, pages 259–282. IntechOpen, 2011. doi: 10.5772/15153.
- Sastry et al. [1981] S. M. L. Sastry, R. J. Lederich, and B. B. Rath. Subcritical crack-growth under sustained load in Ti-6AI-6V-2Sn. Metallurgical Transactions A, 12(1):83–94, Jan 1981. ISSN 1543-1940. doi: 10.1007/BF02648512.
- Huang and Altstetter [1991] J. H. Huang and C. J. Altstetter. Internal hydrogen-induced subcritical crack growth in austenitic stainless steels. Metallurgical Transactions A, 22(11):2605–2618, Nov 1991. ISSN 1543-1940. doi: 10.1007/BF02851354.