SRG/eROSITA uncovers the most X-ray luminous quasar at
Abstract
We report the discovery of X-ray emission from CFHQS J142952+544717, the most distant known radio-loud quasar at , on Dec. 10–11, 2019 with the eROSITA telescope on board the SRG satellite during its ongoing all-sky survey. The object was identified by cross-matching an intermediate SRG/eROSITA source catalog with the Pan-STARRS1 distant quasar sample at . The measured flux erg cm-2 s-1 in the 0.3–2 keV energy band corresponds to an X-ray luminosity of erg s-1 in the 2–10 keV rest-frame energy band, which renders CFHQS J142952+544717 the most X-ray luminous quasar ever observed at z . Combining our X-ray measurements with archival and new photometric measurements in other wavebands (radio to optical), we estimate the bolometric luminosity of this quasar at – erg s-1. Assuming Eddington limited accretion and isotropic emission, we infer a lower limit on the mass of the supermassive black hole of . The most salient feature of CFHQS J142952+544717 is its X-ray brightness relative to the optical/UV emission. We argue that it may be linked to its radio-loudness (although the object is not a blazar according to its radio properties), specifically to a contribution of inverse Compton scattering of cosmic microwave background photons off relativistic electrons in the jets. If so, CFHQS J142952+544717 might be the tip of the iceberg of high- quasars with enhanced X-ray emission, and SRG/eROSITA may find many more such objects during its 4 year all-sky survey.
keywords:
galaxies: active, galaxies: high-redshift, galaxies: nuclei, X-rays: general, individual: CFHQS J142952+5447171 Introduction
One of the most intriguing questions in astrophysics today is how the first supermassive black holes (SMBHs) appeared in the early Universe and how their growth was interconnected with the formation and evolution of the first galaxies. Recently, the number of known quasars at (i.e. when the Universe was younger than 950 million years) has increased dramatically to thanks to the advent of wide-area optical and IR surveys (in particular, the CFHT Legacy Survey, CFHTLS, Willott et al. 2010; Pan-STARRS, Chambers et al. 2016a; the Dark Energy Survey, DES, Yang et al. 2019; see also Bañados et al. 2016). By analogy with the much better studied active galactic nuclei (AGNs) at lower redshift, one can expect a substantial fraction of the bolometric luminosity of distant quasars to be emitted in the X-ray band. However, so far only , i.e. %, of the known quasars have been observed in X-rays (in dedicated or serendipitous observations, mostly by Chandra or XMM-Newton). As a result, quasars have been detected in X-rays and upper limits on the X-ray luminosity have been obtained for another objects (see Vito et al. 2019; Pons et al. 2020 and references therein).
All of the aforementioned quasars observed in X-rays so far are radio-quiet (RQQs), which largely reflects the paucity of known radio-loud quasars (RLQs) at high redshift. Specifically, until recently only 9 (3) RLQs were known at () (Bañados et al., 2015; Belladitta et al., 2020)111Hereafter, we use the traditional dividing line between RQQs and RLQs, where , with and being the flux densities at rest-frame 5 GHz and 4400 Å., and none of the three RLQs have been observed in X-rays so far. Recently, Belladitta et al. (2020) have discovered a 4th RLQ at , PSO J030947.49+271757.31, with , by cross-matching the catalogs of sources detected in the NVSS (radio), Pan-STARRS (optical) and WISE (mid-infrared) surveys. This object proved to be extremely interesting, as it is not just radio-loud but a blazar, and in fact the most distant blazar known. Following the discovery, Belladitta et al. (2020) carried out X-ray observations of PSO J030947.49+271757.31 with Neil Gehrels Swift/XRT and detected a signal corresponding to a luminosity of erg s-1 in the rest-frame 2–10 keV energy band, possibly (taking into account the large uncertainty in the luminosity) making this object the most X-ray luminous quasar known at .
On July 13, 2019, the SRG X-ray observatory (Sunyaev et al., 2020, in preparation) was launched from the Baikonur cosmodrome. It carries two wide-angle grazing-incidence X-ray telescopes, eROSITA (Predehl et al., 2020, in preparation) and ART-XC (Pavlinsky et al., 2020, in preparation), operating in the overlapping energy bands of 0.3–10 and 4–30 keV, respectively. On Dec. 8th, 2019, upon completion of the commissioning, calibration and performance verification phases, SRG started its all-sky X-ray survey from a halo orbit around the Sun–Earth L2 point, which will consist of 8 repeated 6 month long scans of the entire sky. Already a preliminary analysis of the data accumulated during the first months of this survey has demonstrated its enormous discovery potential.
Here we report the first detection of X-ray emission from CFHQS J142952+544717, the most distant () known RLQ, with SRG/eROSITA. This object turns out to be the most X-ray luminous quasar known at and in fact even more luminous than the blazar PSO J030947.49+271757.31 discussed above. The fact that CFHQS J142952+544717 does not appear to be a blazar according to its properties in the radio makes this discovery even more interesting. In what follows we adopt a flat CDM cosmological model with and . All quoted uncertainties correspond to 1, unless noted otherwise.
2 X-ray observations
CFHQS J142952+544717 was found by cross-matching an intermediate release of the eROSITA all-sky survey source catalog of the Eastern Galactic hemisphere (where data analysis lies within the responsibility of the Russian consortium) with the Pan-STARRS1 (PS1) distant quasar sample of 124 quasars in the redshift range of (Bañados et al., 2016).
The position of CFHQS J142952+544717 was scanned by the SRG observatory 8 times during Dec. 10–11, 2019. On Dec. 10, the scans were interrupted by an orbital correction of the spacecraft. During the correction manoeuvre and for several hours after it, eROSITA was not collecting X-ray photons. The total vignetting corrected exposure time on the source is thus about 160 s.
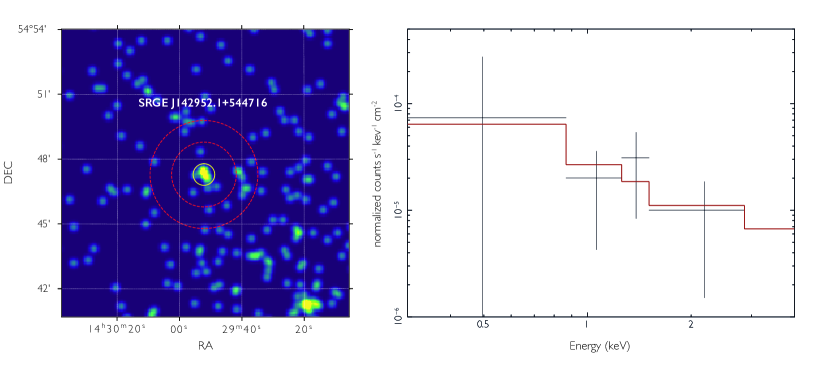
The eROSITA raw data were processed by the calibration pipeline based on the eROSITA Science Analysis Software System (eSASS) and using pre-flight calibration data. A new X-ray source SRGE J142952.1+544716 was detected at the position , with a 1 positional uncertainty of 4.5 arcsec as calculated by the ermldet task of eSASS. The detection likelihood is 20.1 in the 0.3–2.0 keV band, i.e. the detection is highly significant. The best-fit X-ray source position deviates by 1.9 arcsec from the optical position of the quasar CFHQS J142952+544717 (, ) in CFHTLS (Hudelot et al., 2012). Given the average eROSITA source density in this field of sources per deg2, the probability of finding by chance an X-ray source within 1.9 arcsec from the quasar’s optical position is . Taking into account the number of optical quasars from Bañados et al. (2016) within the footprint of the eROSITA all-sky survey at the time of this analysis, which were checked against the X-ray catalog (45 sources), the total probability of chance coincidence of an eROSITA source and at least one of these quasars is .
For further analysis, we chose an extraction region centered at the quasar’s optical position with a radius of 30 arcsec, which is approximately twice the half-energy radius of the eROSITA survey’s point spread function in the 0.3–2.0 keV energy band (Merloni et al., 2012). In this region, we detected a total of 9 counts, with the expected background contribution of counts. The X-ray image with the superimposed source and background regions is shown in Fig. 1 (left panel). The probability to register counts given the Poisson distribution with a mean of is ; is roughly consistent with the detection likelihood of quoted above. This confirms the high statistical significance of the X-ray source detection. Multiplying this number by the number of optical quasars from Bañados et al. (2016) within the footprint of the eROSITA all-sky survey, we find that the probability of a fluctuation of this magnitude is . We thus conclude that the detection of X-ray emission from CFHQS J142952+544717 is highly reliable.
Because of the small number of detected photons, only crude spectral analysis is feasible. To roughly characterise the source’s spectrum, we fit it with an absorbed power law with the neutral hydrogen column density fixed at the Galactic value in the direction of CFHQS J142952+544717 cm-2, obtained from the HI4PI map (HI4PI Collaboration et al., 2016). For the spectral fit we consider the 0.3–4 keV energy band since no counts have been detected within the extraction region at higher energies. Using the C-statistic (Cash, 1979), we obtain the best-fit photon index and the absorption corrected fluxes erg cm-2 s-1 and erg cm-2 s-1 in the 0.3–2 and 2–4 keV energy bands (observer’s frame), respectively (see Fig. 1). Fixing the photon index at (as is typical of AGNs), we obtain similar values: erg cm-2 s-1 and erg cm-2 s-1. No statistically significant variability was found over the period of observations (Dec. 10–11, 2019), although the total number of photons detected from the source is too low for a meaningful variability analysis.
Adopting the quasar’s redshift from the CO (2–1) line observations of its host galaxy (Wang et al. 2011, which is slightly different from the estimate based on the position of the Ly emission line in the quasar’s spectrum, Willott et al. 2010) and using our best-fit spectral model, we can estimate the X-ray luminosity of CFHQS J142952+544717 at erg s-1 in the rest-frame 2–10 keV energy band.
3 Multiwavelength properties
Apart from its detection in X-rays by SRG/eROSITA, CFHQS J142952+544717 is well studied in the radio, mid-infrared and optical wavebands. Below we discuss new and previously published multi-wavelength data available for CFHQS J142952+544717 (see Table 1 for a compilation of all measurements).
3.1 Optical
In the optical, with absolute magnitude (at rest-frame 1450 Å) (Willott et al. 2010; Omont et al. 2013; Bañados et al. 2016), CFHQS J142952+544717 belongs to the bright end of the quasar luminosity function at (e.g. Willott et al. 2010), but is not unique, being magnitudes fainter than the most optically luminous quasars known at these redshifts.
The object was discovered on 6 Dec 2010 during the Canada–France High- Quasar Survey (CFHQS), where its magnitudes and were measured (Willott et al., 2010). The photometry was updated in the CFHTLS-Wide survey catalog (Hudelot et al., 2012). Later, the source was also detected in the CFHQSIR survey (a Y-band extension of CFHTLS-Wide survey, 2010–2012, Pipien et al. 2018), with (Kron-like aperture), and in the PS1 survey (Chambers et al., 2016b), with .
3.1.1 Serendipitous source CFHT 1323_1754990
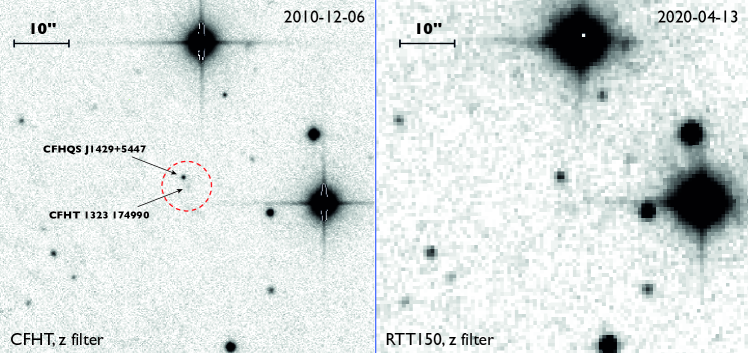
In the CFHTLS-Wide survey catalog (Hudelot et al., 2012), there is another faint optical object (hereafter source #2) within the 68% error circle of the X-ray source, at just 1.7 arcsec from the quasar CFHQS J142952+544717 (see Fig. 2). The object, designated as CFHT 1323_1754990 in the CFHTLS catalog, is located at , , and has the following magnitudes (in a Kron-like aperture): , , , and . Hence, source #2 is similar in brightness to CFHQS J142952+544717 in the band but has a much bluer optical spectral energy distribution, typical for field galaxies.
The probability of finding such an optical object in a circle of radius of (the 68% error circle of the X-ray source) by chance is . It is high because the number density of such faint objects (at least as bright as source #2) is quite high, sources deg-2, as determined from the CFHTLS catalog.
Conversely, it is also possible that the X-ray emission is actually associated with source #2, while the quasar is projected by chance. However, this is quite unlikely because bright X-ray sources like SRGE J142952.1+544716 are rarely associated with faint optical objects like source #2. To demonstrate this, we inspected the W1 field (65 deg2) of CFHTLS-Wide located inside the footprint of the intermediate eROSITA source catalog and having exposure time similar to that for SRGE J142952.1+544716. We obtained a conservative upper limit of a few per cent on the occurrence of X-ray bright, erg cm-2 s-1, sources with optical counterparts as bright or fainter than source #2, yielding an upper limit on their surface density near CFHQS J142952+544717 of 0.2 sources deg-2. Therefore, the probability that one of the 45 distant quasars from Bañados et al. (2016) is found by chance within 1.7 arcsec from an object like source #2, is .
As and , it is highly unlikely that SRGE J142952.1+544716 is associated with CFHT 1323_1754990 rather than with the quasar CFHQS J142952+544717. We thus exclude this possibility from further consideration.
We finally note that visual inspection of the CFHTLS images reveals another possible faint optical source within less than one arcsec from CFHQS J142952+544717. It is not listed in existing optical catalogs and at least one magnitude fainter than source #2. Because of its faintness, the probability that the X-ray emission detected by eROSITA is associated with this source is yet lower that for CFHT 1323_1754990.
3.1.2 RTT150 observations
Following the detection of X-ray emission from CFHQS J142952+544717 by SRG/eROSITA, we carried out photometric observations at the Russian–Turkish 1.5-m Telescope (RTT150) of the TUBITAK National Observatory, Antalya, Turkey, in order to check a possible brightening of the quasar in the optical. The observations took place on two nights: on March 8, 2020 (i.e. almost 3 months after the X-ray detection) and on April 13, 2020.
The images were obtained with the TUBITAK Faint Object Spectrograph and Camera (TFOSC) instrument equipped with an ANDOR DZ936 BR DD CCD. For the first observation run we took a series of 6600 s images in the SDSS- filter and 4600 s images in the SDSS- filter. For the second run, a series of 600 s images in the SDSS- filter were obtained. The combined images were photometrically calibrated using the magnitudes of stars in the observed field taken from the SDSS DR14 database (Abolfathi et al., 2018).
We measured the source’s brightness at on March 8 and at on April 13 (see Fig. 2). We detected no flux in the filter with an upper limit of (). We estimate the magnitude corrections associated with the differences in the band between the RTT150 observation and the surveys mentioned above to be smaller than . Therefore, the new measurements of the magnitude are in approximate agreement with previous measurements, whereas our lower limit on the magnitude is consistent with the corresponding measurement in CFHTLS-Wide.
We conclude that photometric measurements taken on a number of occasions over the past years do not reveal a substantial (by more than a factor of ) variability of CFHQS J142952+544717 in the optical band, with the caveat that SRG/eROSITA may have caught the source in an outburst in Dec. 2019 with no contemporaneous optical observations being available for that period.
3.2 Mid-infrared
CFHQS J142952+544717 has been detected by WISE (Wright et al., 2010; Cutri, 2013) in the mid-infrared, however only the -band (3.4 m) measurements are available in the AllWISE Data Release with sufficient detection significance. We took advantage of a “forced photometry” technique to estimate the and magnitudes using the NEOWISE 2019 Data Release (Mainzer et al., 2014) and the precise position of CFHQS J142952+544717 provided by PS1. We thus obtained the source’s magnitudes and (in the Vega system).
3.3 Radio
In the radio, CFHQS J142952+544717 has been detected at several frequencies between 1.4 and 32 GHz in wide-angle surveys (FIRST and NVSS, Helfand et al. 2015; Condon et al. 1998) and dedicated observational campaigns (Wang et al., 2011; Frey et al., 2011). In particular, Frey et al. (2011) performed VLBI imaging at 1.6 and 5 GHz and inferred that the radio source (i) is compact but resolved on linear scales pc, (ii) has a steep spectrum with 222Hereafter, we define so that . and (iii) relatively low rest-frame brightness temperature K. Having , CFHQS J142952+544717 is confidently classified as a steep-spectrum source (Coppejans et al., 2017). Furthermore, CFHQS J142952+544717 does not appear to be strongly variable in the radio, as suggested by similar flux densities (within a factor of 1.5) at GHz measured in different observations separated by years (see fig. 14 in Coppejans et al. 2017 and Table 1). All these properties imply that relativistic beaming does not play a significant role in the appearance of CFHQS J142952+544717, hence it is not a blazar.
Recently, CFHQS J142952+544717 was detected in the LOFAR Two-meter Sky Survey in the low-frequency band of 120–168 MHz, with a flux density mJy (Shimwell et al., 2019). Comparing this measurement with the aforementioned measurements at higher frequencies, we infer that the spectrum flattens below GHz from to (see Table 1). This most likely indicates that the spectrum eventually turns over at MHz (i.e. at GHz in the quasar’s rest frame), as is expected to occur due to synchrotron self-absorption (see e.g. Coppejans et al. 2017).
3.4 Microwave (the host galaxy)
CFHQS J142952+544717 has also been investigated at 250 Ghz (Omont et al., 2013), which corresponds to the far-infrared (FIR) band ( m) in the object’s rest frame, and in the CO (2–1) line (Wang et al., 2011). These observations of the dust and molecular gas revealed that massive star formation (a few hundred per year) takes place in this object. In addition, it exhibits a two-component structure in the CO (2–1) image. The position of one component coincides with the optical position of the quasar, while the other component is at a distance of 1.2″ (6.9 kpc), with both being at the same redshift () within the uncertainties. It is thus possible that we are witnessing the merger of two galaxies. As discussed by Wang et al. (2011), similar pairs have also been observed in other distant quasars.
All these observational facts clearly draw a picture of violent star formation and rapid SMBH growth taking place hand in hand in CFHQS J142952+544717.
4 Spectral energy distribution
| Telescope/Survey | Band | Flux or magnitude | Ref. | Rest-frame (Hz) | , erg s-1 |
| Radio: | |||||
| LOFAR | 120–168 MHz | mJy | 1 | ||
| NVSS | 1.4 GHz | mJy | 2 | ||
| FIRST | 1.4 GHz | mJy | 3 | ||
| VLBI | 1.6 GHz | mJy | 4 | ||
| 5 GHz | mJy | ||||
| EVLA | 32 GHz | mJy | 5 | ||
| IRAM/MAMBO | 250 GHz | mJy | 6 | ||
| Mid-infrared: | |||||
| WISE (ALLWISE) | 7 | ||||
| WISE/PS1 | 8 | ||||
| Optical: | |||||
| PS1 | 9 | ||||
| CFHQSIR | , Kron-like aperture | 10 | |||
| CFHTLS | , Kron-like aperture | 11 | |||
| , Kron-like aperture | |||||
| , Kron-like aperture | |||||
| , Kron-like aperture | |||||
| , 3-aperture | |||||
| RTT150 | 8 | ||||
| > | |||||
| X-ray: | |||||
| SRG/eROSITA | 0.3–2 keV (, unabsorbed) | erg cm-2 s-1 | 8 | ||
| 2–4 keV (, unabsorbed) | erg cm-2 s-1 | ||||
| Deduced quantities | |||||
| (140 MHz–1.4 GHz, observed) | |||||
| (1.6–5 GHz, observed) | |||||
| (5–32 GHz, observed) | |||||
| (2500 Å–2 keV) | |||||
| (2500 Å–10 keV) | |||||
| (2500 Å) | erg s-1 | ||||
| (< 2 keV) | erg s-1 | ||||
| (2 keV) | erg s-1 | ||||
| (10 keV) | erg s-1 | ||||
| (2–10 keV) | erg s-1 | ||||
| (2–30 keV) | erg s-1 | ||||
| (bolometric) | erg s-1 | ||||
Notes. Luminosities are given in the rest frame and are corrected for the Galactic extinction. The errors correspond to a 1 confidence level, while the upper limits correspond to 5 .
References. (1) Shimwell
et al. (2019), (2) Condon et al. (1998), (3) Helfand
et al. (2015), (4) Frey et al. (2011), (5) Wang et al. (2011), (6) Omont et al. (2013), (7) Cutri (2013), (8) this work, (9) Chambers
et al. (2016b), (10) Pipien
et al. (2018), (11) Hudelot
et al. (2012).
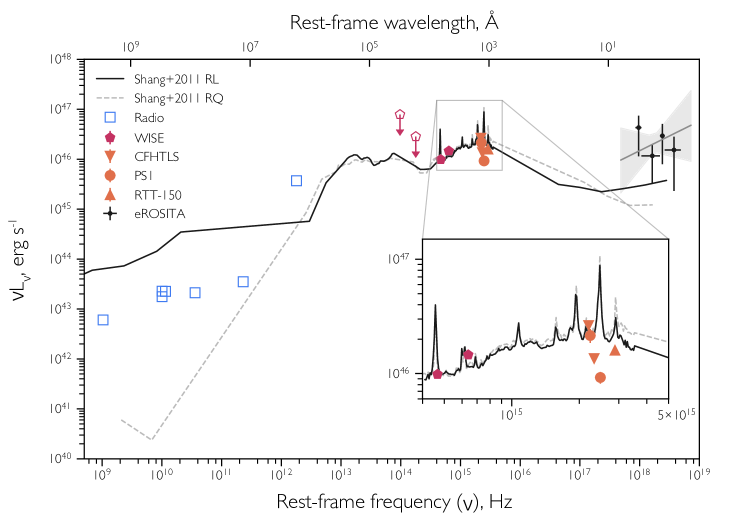
Based on the multiwavelength (radio to X-ray) photometric measurements reported in Table 1, we have constructed the spectral energy distribution (SED) of CFHQS J142952+544717 (Fig. 3). In computing luminosities from the measured magnitudes in the optical band, we made a (small) correction for the Galactic extinction in the direction of the quasar, (Schlegel et al., 1998), assuming an extinction to reddening ratio .
CFHQS J142952+544717 is known to be radio-loud, with (Bañados et al. 2015, see the definition of in §1). A comparison of the SED of CFHQS J142952+544717 with the median composite SEDs of radio-quiet and radio-loud (non-blazar) quasars from Shang et al. (2011) confirms (see Fig. 3) that it belongs to the radio-loud category, taking into account an order-of-magnitude scatter of the SEDs of individual RLQs in the radio and X-ray bands around the median SED (see Shang et al. 2011). Note that the sample used by Shang et al. (2011) is composed of quasars at , i.e. "nearby" objects compared to CFHQS J142952+544717.
4.1 X-ray–to–optical luminosity ratio
What is revealed here for the first time is that apart from being radio-loud, CFHQS J142952+544717 is also X-ray bright in comparison to the majority of quasars. Indeed, its inferred X-ray luminosity is comparable to its luminosity at the expected peak (see e.g. Sazonov et al. 2004) of the SED near Å, with both being erg s-1 (see Fig. 3 and Table 1).
Quantitatively, X-ray brightness can be expressed in terms of the effective spectral slope between 2500 Å and 2 keV (Tananbaum et al., 1979),
| (1) |
or the corresponding slope between 2500 Å and 10 keV (Ighina et al., 2019),
| (2) |
where , and are the luminosity densities (measured in units of erg s-1 Hz-1) at rest-frame 2500 Å, 2 keV and 10 keV, respectively. The is somewhat more convenient in application to quasars than , since for such distant objects, 10 keV in the source’s rest frame corresponds to keV in the observer’s frame, an energy at which X-ray telescopes are most sensitive and the correction for line-of-sight absorption is relatively unimportant.
At the redshift of CFHQS J142952+544717, rest-frame 2500 Å, 2 keV and 10 keV correspond to observed 1.8 m, 0.3 keV and 1.4 keV, respectively. We estimated using the median composite SED of radio-loud quasars from Shang et al. (2011), normalized to the PS1 -band flux density of CFHQS J142952+544717 (see Fig. 3), while and were determined from the best-fit spectral model describing the eROSITA data in the 0.3–4 keV band (see §2). Substituting the so derived values (see the bottom segment of Table 1) into equation (2), we find and .
The X-ray–to–optical luminosity ratio for quasars has a long history of exploration, with most studies focused on RQQs. These usually find that increases with increasing optical/UV luminosity (i.e. , e.g. Strateva et al. 2005). In particular, such a trend was reported by Lusso et al. (2010) based on a large X-ray selected sample of RQQs (see also Nanni et al. 2017 for a confirmation of the same dependence at ), although the same authors inferred a nearly flat dependence (i.e. when the X-ray luminosity, rather than the optical one, was treated as an independent variable), with and a dispersion of 0.18. Note that the RQQs studied by Lusso et al. (2010) have X-ray luminosities ranging between and erg s-1, while CFHQS J142952+544717 is much more X-ray luminous, having erg s-1.
In discussing the case of CFHQS J142952+544717, it is more relevant to look at those studies that focus on RLQs. It is widely accepted that RLQs have relativistic jets, which are much weaker or absent in RQQs. The jets manifest themselves mainly in the radio but may also produce a significant amount of X-ray radiation in excess of the Comptonized emission from the hot corona of the accretion disk. This X-ray enhancement is expected to depend on the jet’s orientation with respect to the observer and correlate with radio-loudness. Miller et al. (2011), using a large sample of optically selected quasars, mostly at , demonstrated that the slope is indeed systematically flatter for RLQs compared to RQQs, although this effect was only noticeable at very high values of radio-loudness (). For comparison, CFHQS J142952+544717 is only moderately radio-loud () and the absolute majority of quasars of similar radio-loudness are less X-ray bright (with typical values ranging between 1.6 and 1.2, see fig. 15 in Miller et al. 2011). In extension of that work, Wu et al. (2013) and Zhu et al. (2019) investigated the X-ray–to–optical luminosity ratio for quasars, concentrating on highly radio-loud objects (). They confirmed that X-ray emission is enhanced in RLQs compared to RQQs and found evidence that the jet-linked X-ray excess is more significant in high- objects. This can at least partially be explained by the increased contribution of inverse Compton scattering of cosmic microwave background (CMB) photons in the jets, since the CMB energy density increases with redshift as . Compared to RQQs of matched luminosity, the optical–to–X-ray slope typically flattens by (0.2–0.3) for 2.5–3 (see fig. 5 in Zhu et al. 2019). Taking into account that CFHQS J142952+544717 is less radio-loud () but is more distant () compared to the objects in the Zhu et al. (2019) sample (4–5), it seems plausible that its extreme X-ray brightness (, or equivalently ) is associated with inverse Compton scattering of CMB photons in the jets.
Interestingly, the X-ray–to–optical luminosity ratio for CFHQS J142952+544717, as e.g. expressed in terms of , appears to be similar to typical ratios for blazars (Ighina et al., 2019), although according to its radio properties CFHQS J142952+544717 is definitely not a blazar (see §3.3). In particular, in the – diagram (Belladitta et al. 2020, fig. 5), CFHQS J142952+544717 shares the same region with other presumably unbeamed high- RLQs, which is clearly separated from the region occupied by distant blazars (which all have and typically have ) including the most distant one, PSO J030947.49+271757.31, discussed in §1.
4.2 Bolometric luminosity and SMBH mass
We now wish to estimate the bolometric luminosity, , of CFHQS J142952+544717 from its SED presented in Fig. 3. The biggest uncertainty is posed by our ignorance of the intrinsic shape of the SED on the blue side of the Ly transition (which approximately corresponds to the observed band) up to keV. Specifically, it is not clear how the optical–UV component of the SED, presumably associated with the emission from the accretion disk, connects to the X-ray component, which is likely the combined emission from the disk’s corona and relativistic jets.
We can first estimate the integrated luminosity of CFHQS J142952+544717 at energies below 2 keV. To this end, we can use the composite SED of RLQs from Shang et al. (2011) normalized to the PS1 -band flux density of CFHQS J142952+544717 (see Fig. 3). This yields erg s-1 with an uncertainty of (see Table 1). However, although the Shang et al. (2011) template fits well the optical-UV part of the SED of CFHQS J142952+544717, it probably underestimates the extreme-UV–soft-X-ray part of the SED. Therefore, the above estimate is likely a lower limit on . We also note that the discrepancy between the adopted template and the SED of CFHQS J142952+544717 in the radio band is not important here, since the radio emission contributes % of the bolometric luminosity.
We can next estimate the luminosity at energies between 2 and 30 keV directly from the SRG/eROSITA data: erg s-1. However, as expected for AGNs (see e.g. Sazonov et al. 2004; Malizia et al. 2014; Lohfink et al. 2017), the X-ray spectrum of CFHQS J142952+544717 probably continues without a significant cutoff at least up to keV. A rough estimate of its total X-ray luminosity can thus be obtained by extrapolating our best-fit power-law model to 100 keV, which yields erg s-1. The corresponding uncertainty is very large, since this estimate is currently based on a low-quality X-ray spectrum. If we fix the photon index at (a value typical for RQQs but not necessarily for RLQs), we find erg s-1.
We can finally estimate the bolometric luminosity of CFHQS J142952+544717 as – erg s-1. In reality, this may be a lower limit, since we may have underestimated the luminosity between Å and 2 keV and above 100 keV.
Assuming that the derived does not exceed the Eddington limit, we infer that the SMBH in CFHQS J142952+544717 must have a mass of least .
5 Discussion and conclusions
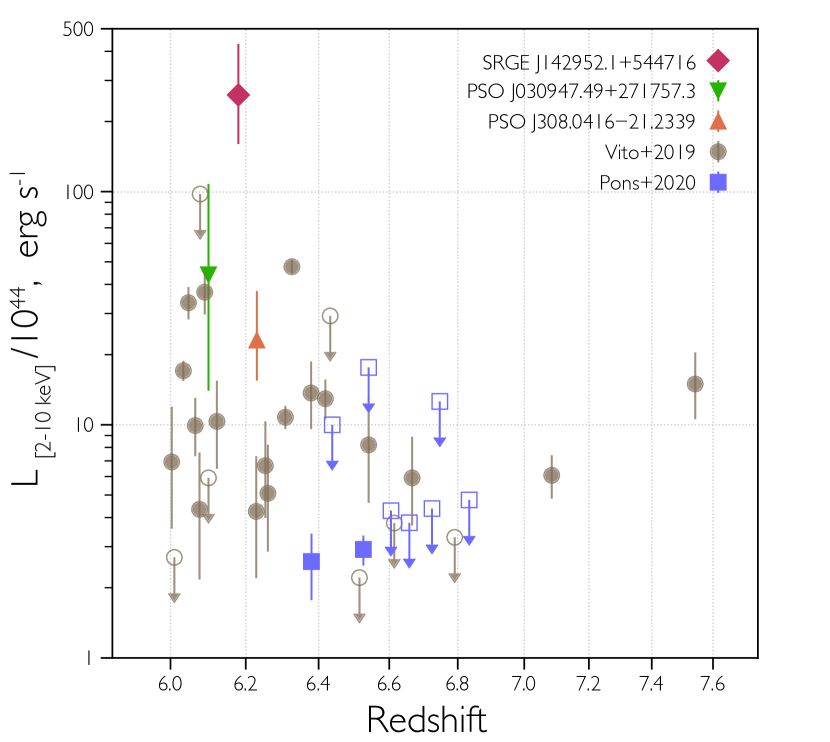
With a luminosity of erg s-1 in the 2–10 keV energy band, CFHQS J142952+544717 proves to be the most X-ray luminous quasar at known so far. This is demonstrated in Fig. 4, where we show X-ray luminosity vs. redshift for all quasars with available X-ray measurements (detections or upper limits). This compilation is mainly based on the recent studies by Vito et al. (2019) and Pons et al. (2020), and also includes the quasar PSO J308.041621.2339 (Connor et al., 2019) and the recently discovered blazar PSO J030947.49+271757.31 (Belladitta et al., 2020). We see that even PSO J030947.49+271757.31, which already appeared extreme as regards its X-ray emission, is several times less X-ray luminous than CFHQS J142952+544717, despite the fact that the latter is not a blazar according to its radio properties.
In terms of bolometric luminosity, with erg s-1 CFHQS J142952+544717 is also among the most extreme quasars known at (see Matsuoka et al. 2019 and in particular their fig. 3) but not the most luminous one. Hence, the most remarkable property of CFHQS J142952+544717 is its X-ray brightness (relative to the optical/UV emission). As we have discussed in section 4.1, it may be related to its radio-loudness, specifically to a plausible contribution of inverse Compton scattering of high-energy-density [due to the cosmological factor] CMB photons off relativistic electrons in the jets. If so, CFHQS J142952+544717 might be just the tip of the iceberg of high- RLQs with enhanced X-ray emission, and SRG/eROSITA will probably find many more such objects (typically with somewhat lower luminosity) during its 4 year all-sky X-ray survey.
On the other hand, we note that the inferred high X-ray brightness of CFHQS J142952+544717 may be partly associated with variability of the source. We recall that it was detected during its passage by SRG/eROSITA on Dec. 10–11, 2019, while all other existing multiwavelength observations are separated by at least several months from this date. In this connection, it will be interesting to check the X-ray activity of CFHQS J142952+544717 during its next passage by SRG/eROSITA, which is expected to occur in July 2020.
Acknowledgements
We are grateful to the reviewer for useful comments and suggestions. This work is based on observations with eROSITA telescope onboard SRG observatory. The SRG observatory was built by Roskosmos in the interests of the Russian Academy of Sciences represented by its Space Research Institute (IKI) in the framework of the Russian Federal Space Program, with the participation of the Deutsches Zentrum für Luft- und Raumfahrt (DLR). The SRG/eROSITA X-ray telescope was built by a consortium of German Institutes led by MPE, and supported by DLR. The SRG spacecraft was designed, built, launched and is operated by the Lavochkin Association and its subcontractors. The science data are downlinked via the Deep Space Network Antennae in Bear Lakes, Ussurijsk, and Baykonur, funded by Roskosmos. The eROSITA data used in this work were processed using the eSASS software system developed by the German eROSITA consortium and proprietary data reduction and analysis software developed by the Russian eROSITA Consortium. The authors thank TÜBITAK, IKI, KFU, and AST for partial support in using RTT150 (the Russian-Turkish 1.5-m telescope in Antalya). AM acknowledge partial support of this work by the Russian Government Program of Competitive Growth of Kazan Federal University. The work of IB and EI was partially funded by the subsidy 671-2020-0052 allocated to Kazan Federal University for the state assignment in the sphere of scientific activities. PM and SS acknowledge support from grant 19-12-00396 of the Russian Science Foundation.
Data availability
X-ray data analysed in this article were used by permission of the Russian SRG/eROSITA consortium. The data will become publicly available as a part of the corresponding SRG/eROSITA data release along with the appropriate calibration information. Optical data used in the article will be shared on reasonable request to the corresponding author.
References
- Abolfathi et al. (2018) Abolfathi B., et al., 2018, ApJS, 235, 42
- Bañados et al. (2015) Bañados E., et al., 2015, ApJ, 804, 118
- Bañados et al. (2016) Bañados E., et al., 2016, ApJS, 227, 11
- Belladitta et al. (2020) Belladitta S., et al., 2020, A&A, 635, L7
- Cash (1979) Cash W., 1979, ApJ, 228, 939
- Chambers et al. (2016a) Chambers K. C., et al., 2016a, arXiv e-prints, p. arXiv:1612.05560
- Chambers et al. (2016b) Chambers K. C., et al., 2016b, arXiv e-prints, p. arXiv:1612.05560
- Condon et al. (1998) Condon J. J., Cotton W. D., Greisen E. W., Yin Q. F., Perley R. A., Taylor G. B., Broderick J. J., 1998, AJ, 115, 1693
- Connor et al. (2019) Connor T., et al., 2019, ApJ, 887, 171
- Coppejans et al. (2017) Coppejans R., et al., 2017, MNRAS, 467, 2039
- Cutri (2013) Cutri R. M. e., 2013, VizieR Online Data Catalog, p. II/328
- Frey et al. (2011) Frey S., Paragi Z., Gurvits L. I., Gabányi K. É., Cseh D., 2011, A&A, 531, L5
- HI4PI Collaboration et al. (2016) HI4PI Collaboration et al., 2016, A&A, 594, A116
- Helfand et al. (2015) Helfand D. J., White R. L., Becker R. H., 2015, ApJ, 801, 26
- Hudelot et al. (2012) Hudelot P., et al., 2012, VizieR Online Data Catalog, p. II/317
- Ighina et al. (2019) Ighina L., Caccianiga A., Moretti A., Belladitta S., Della Ceca R., Ballo L., Dallacasa D., 2019, MNRAS, 489, 2732
- Lohfink et al. (2017) Lohfink A. M., et al., 2017, ApJ, 841, 80
- Lusso et al. (2010) Lusso E., et al., 2010, A&A, 512, A34
- Mainzer et al. (2014) Mainzer A., et al., 2014, ApJ, 792, 30
- Malizia et al. (2014) Malizia A., Molina M., Bassani L., Stephen J. B., Bazzano A., Ubertini P., Bird A. J., 2014, ApJ, 782, L25
- Matsuoka et al. (2019) Matsuoka Y., et al., 2019, ApJ, 872, L2
- Merloni et al. (2012) Merloni A., et al., 2012, arXiv e-prints, p. arXiv:1209.3114
- Miller et al. (2011) Miller B. P., Brandt W. N., Schneider D. P., Gibson R. R., Steffen A. T., Wu J., 2011, ApJ, 726, 20
- Nanni et al. (2017) Nanni R., Vignali C., Gilli R., Moretti A., Brand t W. N., 2017, A&A, 603, A128
- Omont et al. (2013) Omont A., Willott C. J., Beelen A., Bergeron J., Orellana G., Delorme P., 2013, A&A, 552, A43
- Pipien et al. (2018) Pipien S., et al., 2018, A&A, 616, A55
- Pons et al. (2020) Pons E., McMahon R. G., Banerji M., Reed S. L., 2020, MNRAS, 491, 3884
- Sazonov et al. (2004) Sazonov S. Y., Ostriker J. P., Sunyaev R. A., 2004, MNRAS, 347, 144
- Schlegel et al. (1998) Schlegel D. J., Finkbeiner D. P., Davis M., 1998, ApJ, 500, 525
- Shang et al. (2011) Shang Z., et al., 2011, ApJS, 196, 2
- Shimwell et al. (2019) Shimwell T. W., et al., 2019, A&A, 622, A1
- Strateva et al. (2005) Strateva I. V., Brandt W. N., Schneider D. P., Vanden Berk D. G., Vignali C., 2005, AJ, 130, 387
- Tananbaum et al. (1979) Tananbaum H., et al., 1979, ApJ, 234, L9
- Vito et al. (2019) Vito F., et al., 2019, A&A, 630, A118
- Wang et al. (2011) Wang R., et al., 2011, ApJ, 739, L34
- Willott et al. (2010) Willott C. J., et al., 2010, AJ, 139, 906
- Wright et al. (2010) Wright E. L., et al., 2010, AJ, 140, 1868
- Wu et al. (2013) Wu J., Brandt W. N., Miller B. P., Garmire G. P., Schneider D. P., Vignali C., 2013, ApJ, 763, 109
- Yang et al. (2019) Yang J., et al., 2019, AJ, 157, 236
- Zhu et al. (2019) Zhu S. F., Brandt W. N., Wu J., Garmire G. P., Miller B. P., 2019, MNRAS, 482, 2016