Plastic yielding and deformation bursts
in the presence of disorder from coherent precipitates
Abstract
Alloying metals with other elements is often done to improve the material strength or hardness. A key microscopic mechanism is precipitation hardening, where precipitates impede dislocation motion, but the role of such obstacles in determining the nature of collective dislocation dynamics remains to be understood. Here, three-dimensional discrete dislocation dynamics simulations of FCC single crystals are performed with fully coherent spherical precipitates from zero precipitate density upto and at various dislocation-precipitate interaction strengths. When the dislocation-precipitate interactions do not play a major role the yielding is qualitatively as for pure crystals, i.e., dominated by ”dislocation jamming”, resulting in glassy dislocation dynamics exhibiting critical features at any stress value. We demonstrate that increasing the precipitate density and/or the dislocation-precipitate interaction strength creates a true yield or dislocation assembly depinning transition, with a critical yield stress. This is clearly visible in the statistics of dislocation avalanches observed when quasistatically ramping up the external stress, and is also manifested in the response of the system to constant applied stresses. The scaling of the yielding with precipitates is discussed in terms of the Bacon-Kocks-Scattergood relation.
I Introduction
Crystalline materials accumulate plastic deformation via the motion of dislocations, the line-like topological defects of the crystal lattice. Hence, controlling the stress-driven dynamics of dislocations is the key to be able to tune the mechanical properties of crystals. Alloys formed by mixing other elements to pure metals often exhibit increased strength or hardness. An important microscopic mechanism routinely exploited in metallurgy is precipitation hardening, where small particles formed by the alloying element obstruct dislocation motion Ardell (1985); Beyerlein et al. (2019).
The emergence of experimental techniques such as compression of micron-scale samples with nanoindentors Uchic et al. (2004); Dimiduk et al. (2006); Stinville et al. (2019); Dehm et al. (2018) and high-resolution acoustic emission (AE) measurements of bulk samples Miguel et al. (2001) has revealed a novel paradigm: dislocation plasticity is a spatio-temporally fluctuating and intermittent process Zaiser (2006). On micron scales, discrete strain bursts with a broad size distribution can be seen directly in the stress-strain curve Ng and Ngan (2008); Papanikolaou et al. (2017); Salmenjoki et al. (2018); Zhang et al. (2017). Macroscopic samples tend to exhibit a smooth stress-strain curve, but AE measurements show acoustic energy bursts spanning several orders of magnitude in energy Miguel et al. (2001); Weiss et al. (2015). The observed strain bursts and AE events originate from the stress-driven cooperative rearrangements within the crystal, known as dislocation avalanches Csikor et al. (2007); Zaiser (2006); Dimiduk et al. (2006); Sparks and Maaß (2018). In general, stress-strain curves and hence the global plastic response of crystals consist of a sequence of such avalanches, separated by regions of nearly linear, quasireversible deformation Szabó et al. (2015).
Recent discrete dislocation dynamics (DDD) studies of pure crystals (i.e., crystals with no other defects or impurities in addition to dislocations) have revealed a dislocation jamming Miguel et al. (2002) dominated regime characterized by “extended criticality” Ispánovity et al. (2014); Lehtinen et al. (2016a); Ovaska et al. (2017). Such ”glassy” material response was found first in 2D Ispánovity et al. (2014) and then by 3D DDD simulations Lehtinen et al. (2016a). The main quantity of interest here is the size distribution of plastic slip avalanches, which is often found to be well-described by a power-law with a cut-off as
| (1) |
where is a cut-off scaling function, typically an exponential, , is a measure of the avalanche size, is the cut-off avalanche size, the external stress, and the system size. The main signature of extended criticality is power-law like behavior of as described in Eq. (1), with a particular scaling of the cut-off avalanche size: exhibits an exponential dependence on and (when considering an ”extensive” definition of Ispánovity et al. (2014)) a power-law divergence with . Thus, there is no special, ”critical” value where would diverge, contrary to what one would expect in the context of systems exhibiting a (non-equilibrium) phase transition between ”jammed” and ”moving” phases. Instead, the divergence of with implies that the system is critical at any stress, hence the notion of extended criticality Ovaska et al. (2017); Lehtinen et al. (2016a); Ispánovity et al. (2014). It is also known that analogous phenomenology is found for creep (constant stress) simulations. The strain rate fluctuates quite some in a typical (small) sample, but regardless of follows an Andrade-like scaling Miguel et al. (2002) for a considerable range of time which increases with the system size Ispánovity et al. (2011). In contrast, for typical non-equilibrium phase transitions the order parameter (strain rate for yielding) would decay exponentially in time unless one sets the control parameter, the stress, close to the critical point value. The variation of the avalanche size distribution with applied stress or level of plastic deformation is also visible in the envelope (the averaged shape) of the intermittent stress-strain curves Szabó et al. (2015).
The extended criticality scenario described above is expected to apply also to crystals with weak but non-zero pinning due to precipitates, such that the dislocation-dislocation interactions dominate the dislocation dynamics. Stronger precipitate pinning as studied here would in principle be expected to change this picture. If the precipitate-dislocation becomes the dominating interaction over the dislocation-dislocation (jamming), one may expect in analogy to 2D DDD simulations Ovaska et al. (2015) that a well-defined critical point of a critical phase transition would ensue, with collective dislocation dynamics only in the proximity of the critical point. Hence, the main feature of avalanches in plasticity in that case would be power-law scaling of with a cut-off diverging at a critical stress only. Similarly, the response of the system to constant applied stresses might be expected to show signatures of a depinning transition: At the critical point , power-law relaxation in time of the strain rate is expected, , again in analogy to recent 2D DDD results Ovaska et al. (2015). For weak enough stresses the strain rate relaxation should be exponential in time, and for slightly above the critical value one expects a cross-over to a state of continuous flow after a relaxation transient. We also point out that the 2D DDD results of Ref. Ovaska et al. (2015) suggest that very strong disorder-induced pinning may completely quench collective dislocation dynamics. This finding may be related to the concept of mild vs wild fluctuations in crystal plasticity when the microstructure is varied among others by controlling the disorder Weiss et al. (2015); Zhang et al. (2017).
These considerations then lead us to the question of how one may by controlling the precipitate content of a 3D crystal tune its mechanical properties Zhang et al. (2017); Csikor et al. (2007); Pan et al. (2019) and how that relates to the statistical physics aspects - relaxation, burst size distributions - for a given precipitate microstructure. Previous studies Monnet et al. (2011); Xu et al. (2016); Keyhani and Roumina (2018); Santos-Güemes et al. (2018) have addressed the problem of individual dislocations interacting with precipitates. Here, we focus on understanding the collective dynamics of many dislocations interacting with a precipitate-induced pinning field. To this end, we study how small, randomly distributed spherical obstacles of different dislocation-precipitate interaction strengths and densities affect the collective dislocation dynamics in FCC aluminum single crystals. This is done by extensive 3D DDD simulations utilizing our recently developed methodology Lehtinen et al. (2016b); Lehtinen et al. (2018) to include coherent precipitates with short-range elastic interactions with the dislocations Lehtinen et al. (2016b); Lehtinen et al. (2018); Arsenlis et al. (2007). We consider dislocation networks under both quasistatically increasing stress and constant loading as illustrated in Fig. 1. With increasing pinning strength, in analogy to previous results on simplified 2D DDD models Ispánovity et al. (2014); Ovaska et al. (2015), our 3D DDD results show a cross-over between two distinct regimes of material response, arising from the competition of dislocation-dislocation and dislocation-precipitate interactions.
In the rest of this article, after explaining the methods and the choice of parameter space we turn to the results. First, we discuss the pinning strength dependent properties on the relaxation dynamics. We expect that the two phases influence the constant stress response in a fundamental way, and demonstrate this. We also analyze the dependence of the ensuing yield stress of the crystal on the precipitate density in terms of the Bacon-Kocks-Scattergood relation Bacon et al. (1973) and how that relates to the phases, jamming against precipitate-induced depinning. After that we move to quasistatic loading, by a stress ramp. We show how the precipitates influence stress-strain curves, the engineering yield stress, and the statistical properties of the strain bursts occurring during such loading. We also demonstrate that the yield stress values (”critical point value”) that we derive from the two approaches agree.
II Methods
Our simulations are performed using a modified version of the ParaDiS 3D DDD code Arsenlis et al. (2007); Lehtinen et al. (2016b, a) incorporating in addition to the dislocations also a description of spherical obstacles or precipitates. The dislocation-precipitate interaction is parametrized with , the radius of the precipitate, and , the factor scaling the precipitate strength in the radial force caused by Gaussian interaction potential
| (2) |
where is the length of the Burgers vector. Notice that the isotropic, short-range interaction force of Eq. (2) mimics fully coherent precipitates which do not induce long-range stress fields within the embedding crystal. and the density of precipitates act as control parameters; the latter sets a lengthscale that breaks the similitude principle of pure dislocation systems Zaiser and Sandfeld (2014). For a given embedding crystal containing specific types of precipitate particles, the parameter (as well as ) can be estimated by comparing DDD and molecular dynamics (MD) simulations Lehtinen et al. (2016b). In practice this is done by measuring the stress required to drive a dislocation line through the precipitate in MD simulations, after which is adjusted in DDD to reproduce the result. A high value means simply an impenetrable precipitate Santos-Güemes et al. (2020). It is also possible to use experimental input, e.g., high-resolution transmission electron microscopy measurements of the elastic fields of the precipitate, which can subsequently be used in DDD simulations Ringdalen et al. (2017). In general, the Gaussian potential allows tuning of the defect strength from weak, shearable obstacles to strong impenetrable obstacles which the dislocations have to bypass via the Orowan mechanism. In the former case, the precipitates are here for simplicity taken to remain intact even after a dislocation line has moved through them. A final note is that real precipitate-host systems have a size distribution for the precipitates, and not all of the precipitating species necessarily ends in the precipitates thus changing the dislocation mobility. These effects we neglect, though certainly it would be an interesting exercise to add such detail to the DDD simulations from experiment and multiscale simulations.
The material parameters employed here mimic FCC Al with precipitates Lehtinen et al. (2016a). The system was implemented with periodic boundaries and size which is sufficiently large to produce behaviour independent of the system size (Supplementary Fig. 1 SM ). One may notice that this size scale is close to typical micropillar experiments Sparks and Maaß (2018); Zhang et al. (2017); Pan et al. (2019); Ng and Ngan (2008), but here the use of periodic boundaries implies that we are simulating a part of a bulk system. 24 initial dislocations in the slip system imply an initial dislocation density . The edge and screw dislocation mobilities, and , are chosen as . The precipitate strength ranges from (pure dislocation systems with to) (weak) and (intermediate) to (strong precipitates). Only the strongest precipitates are able to cause dislocations to form Orowan loops Lehtinen et al. (2016b). is varied from to (i.e. at most precipitates in the system). The volume fraction () corresponds to relevant experiments Zhang et al. (2017). Other relevant simulation parameters are collected to Supplementary Table I SM .
Constant stress DDD simulations allow to observe the power-law relaxation of (or lack thereof), and to locate the yield stress by searching for a -value resulting in pure power-law behavior of . After initialization (relaxation and a second step of relaxation after adding the precipitates), a constant stress is applied in the direction. To find the approximate value of the critical stress , systems with different are loaded with 4 to 8 different values of with 19 simulations for every combination.
To obtain the avalanche statistics, a quasi-static stress ramp driving protocol is used Lehtinen et al. (2016a). Here, this amounts to imposing a stress rate in the direction in between avalanches while keeping constant during avalanches. To define avalanches, we consider the ”activity signal” defined by the extensive dislocation velocity, , where is the segment length and is the velocity perpendicular to the segment’s line direction. Then, an avalanche is defined as a continuous sequence of -values exceeding a threshold value . The avalanche size is then defined as , where denotes the duration of the avalanche. Here we fix the precipitate density to and vary the precipitate strength , and collect statistics from 100 different initial dislocation-precipitate configurations.
III Plastic flow under constant stress
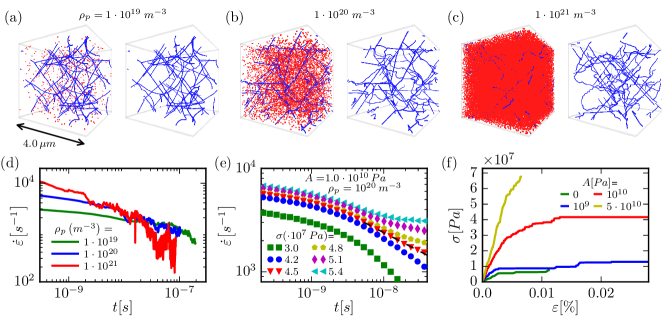
The creep-like flow under constant stress is studied next, for a relaxed configuration of initially straight dislocations (initial dislocation density m-2). Example snapshots of deforming systems for different densities of precipitates of intermediate strength are depicted in Fig. 1(a)-(c). A clear effect of increasing on the structure of the dislocation network is evident: In Fig. 1(a), displaying a system with m-3, only a few of the dislocation segments are pinned by the precipitates, but increasing to m-3 [Fig. 1(b)] and even to m-3 [Fig. 1(c)] results in a noticeable increase of pinning and hence roughening of the dislocation lines due to precipitates. In what follows, these morphological changes due to precipitates are related to the collective dynamics and plasticity.
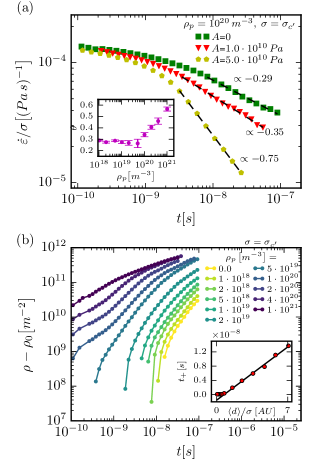
The plastic flow in response to a constant is characterized by a temporal Andrade power-law decay of the strain rate, Miguel et al. (2002). Examples of single system of the illustrated systems in Fig. 1(a)-(c) and average for different for the case with Pa m3 and m-3 corresponding to Fig. 1(b) are shown in Figs. 1(d)-(e). These illustrate that the power-law decay of is obtained for a specific critical yield stress value only; For , decays exponentially to zero, while for the system appears to approach asymptotically a steady state with a finite . We repeat the simulations for a wide range of and . The main panel of Fig. 2(a) shows three examples for different -values of the critical relaxation of at . Interestingly, the exponent is found to increase with pinning strength . The inset illustrates that upon increasing for a fixed , the plasticity exhibits two regimes: For pure and weakly disordered systems we find independent of , while for larger increases with . The main panel of Fig. 2(b) shows how the dislocation density increases with time during the critical relaxation. A noticeable increase from the initial value takes place at a time scale which depends on . The inset of Fig. 2(b) shows that is linearly dependent on , where ( and ) is the characteristic defect-defect distance, considering both dislocations and precipitates. Thus, starts increasing as soon as the dislocations get pinned (by the nearest precipitate or another dislocation). In the pinning-dominated regime , is dominated by the precipitates, and increasing makes the relaxation faster, as evidenced by the -dependent . Interestingly, this is different from usual depinning transitions where the relaxation exponent is constant when varying microscopic detail Laurson et al. (2011), which seems to be the case for the other critical yielding transition exponents below. These results may explain the wide range of experimentally observed -values in for instance titanium alloys Neeraj et al. (2000).
For the yield stress we find an asymptotic power-law dependence for large (Fig. 3). To comprehend this, we apply the Bacon-Kocks-Scattergood (BKS) relation connecting the obstacle hardening to the yield stress Bacon et al. (1973); Monnet et al. (2011). The stress to overcome the obstacles is determined by the size and average distance of the randomly located obstacles along with the dislocation self-interactions. The BKS relation fits the simulation results very well [dashed line in Fig. 3] using the critical stress producing the power-law relaxation in creep as shown in Fig. 1(e). Also important is that one uses as the mean inter-precipitate distance in the glide plane (Inset of Fig. 3) Lehtinen et al. (2018) as a measure of the true interaction range. Thus
| (3) | |||
where is the critical stress of a system without any precipitates, is the Schmidt factor, the shear modulus, the magnitude of the Burgers vector, the dislocation radius and . The asymptotic square root dependence on is found [cf. Fig. 3(a)] in the depinning-dominated regime.
IV Quasi-static loading simulations
The transition from jamming to pinning is also seen in the dislocation avalanche statistics. We fix to 1020 m-3 and vary , and study the resulting avalanches seen in Fig. 1(f). Fig. 4(a) shows the mean size as a function of for different -values. The systems with weakest disorder exhibit essentially the same exponential growth of with as pure 3D DDD systems Lehtinen et al. (2016a). Weak precipitates are unable to pin the dislocations strongly enough to compete with dislocation jamming. They however make the system more susceptible to avalanches as evidenced by a decrease of the mean stress increment in between avalanches (Supplementary Fig. 2 SM ).
The evolution of with for intermediate strength disorder displays the typical behaviour of a depinning transition: First with small stress, increases slowly, and appears to diverge when approaching (Fig. 4(a)). It is harder to study the strongest precipitates due to numerical limitations in reaching high enough stresses/strains in that case to observe the expected divergence of .
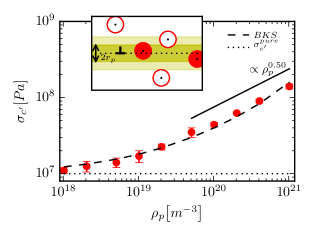
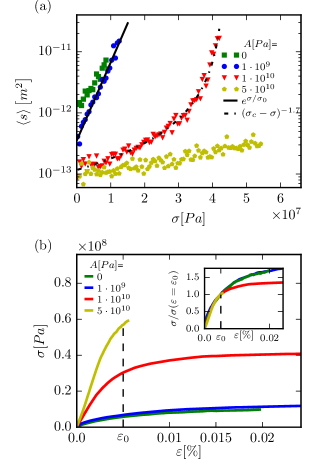
Fig. 4(b) depicts the average stress-strain curves with different disorder strengths. As is evident, the increasing strength of precipitates hardens the system, so using an engineering criterion of stress at we find an increasing yield stress with large enough . The inset of Fig. 4(b) displays the average stress-strain curves scaled by the above-defined yield stress which reveals that the shape of the curve changes drastically: with the weakest disorder or no disorder at all, the curves have the same shapes up to the maximum strain considered. Only for the intermediate disorder of , with a depinning transition, the curve approaches a plateau value as the avalanche size diverges close to . For , the shape of the curve is similar to the curve of intermediate disorder up to the reachable strain. The two kinds of average stress-strain curves is what we would expect given that the avalanche statistics along the stress-strain curves are also different Szabó et al. (2015) as we discuss next.
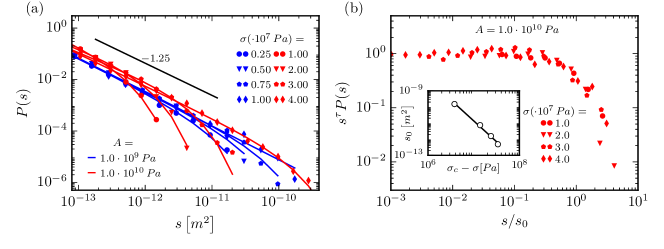
Fig. 5(a) illustrates the stress-resolved size distributions of avalanches in weak and intermediate precipitate systems. The distributions of the avalanche sizes are fitted with where is a stress-dependent cutoff, and the best fit is chosen with the maximum likelihood method Baró and Vives (2012). The power law exponent does not vary much with : for and for . The behaviour of shows a clear dependence on : With weak disorder (or without disorder), there is only weak -dependence. For intermediate , Fig. 5 shows a clear-cut divergence of the cutoff as the is approached from below. This divergence is confirmed by the data collapse of Fig. 5(b) and its inset where , with . Notably here the fitted value of agrees well with the critical values of from creep in Fig. 1(e) and in Fig. 4(a). The ”engineering” yield stress from Fig. 4(b) is approximately for this case. As a side note such a value is roughly four times larger than the in the limit of negligible precipitate strengthening.
For this depinning phase transition the exponent values and differ from those predicted by mean-field depinning (MFD; 3/2 and 2,
respectively Fisher (1998)). The same applies to the stress-integrated size distribution ( rather than
2 for MFD, Supplementary Fig. 3 SM ), the exponent of the stress-resolved avalanche
duration distribution (, while MFD predicts 2,
Supplementary Fig. 4 SM ), and the exponent characterizing the scaling of the
average avalanche size with the avalanche duration,
, with rather than
2 for MFD (Supplementary Fig. 5 SM ).
Interestingly, similar exponent values for and have been recently found for amorphous plasticity Budrikis et al. (2017). It is also interesting to note that we recover the depinning of a single dislocation/elastic interface
Zapperi and Zaiser (2001); Bakó et al. (2008) by reducing
the number of initial dislocations (Supplementary Fig. 6 SM .) The important point here is that depinning of a single dislocation is different from the collective depinning of several dislocations we have focused on in the present study.
V Conclusions
The yielding of precipitation-hardened FCC alloys demonstrate the role of collective phenomena in the nature of deformation bursts and in the averaged material response. The competition between the interactions among dislocations and those between dislocations and precipitates dictates the statistics of collective yielding and controls the increase in yield strength by precipitates. Only when dislocation pinning due to disorder is the dominant mechanism the samples exhibit under loading a true critical point in the sense of a non-equilibrium phase transition. A large increase in the flow stress follows when the disorder is relevant. The BKS relation for the yield stress might indeed be said to really work only for large precipitate densities when a yielding transition exists. We have here studied the case of fully coherent precipitates with isotropic interactions with the dislocations. However, the main point of competing mechanisms should persist so that similar disorder-dependent classes of critical behaviour are expected with other crystal orientations and structures and precipitate/metal systems.
One should pay attention to how the concept of yield stress is used in this work. For quasi-static loading simulations we use a typical way of defining it in DDD simulations, as the stress corresponding to a small amount of plastic strain. However, we also use ”true measures” of the yield stress which means that if there is a critical point, defined by the divergence of the avalanche size distribution, power-law relaxation of strain rate at constant stress, and continuous flow above the critical point, then independent measurements of critical stress value should agree. The latter value is of course way higher and Figures 3 and 4 allow to compare such values.
The yielding or depinning critical point is characterized by non-trivial exponents different from those of MFD, as perhaps expected because of the anisotropic dislocation interactions Budrikis et al. (2017); Sparks and Maaß (2018). An open question is whether in this ”strong disorder regime” one may find other universality classes, with different scaling properties for the avalanches. Finally, in micron-scale plasticity the strong dependence of the deformation fluctuations on details of the quenched pinning field becomes important for applications.
Acknowledgements.
The authors acknowledge support from the Academy of Finland Center of Excellence program, 278367. LL acknowledges the support of the Academy of Finland via the Academy Project COPLAST (project no. 322405), and AL that by the Academy Project SIRDAME (project no. 260053). HS acknowledges the support from Finnish Foundation for Technology Promotion. MA acknowledges support from the European Union Horizon 2020 research and innovation programme under grant agreement No 857470 and from European Regional Development Fund via Foundation for Polish Science International Research Agenda PLUS programme grant No MAB PLUS/2018/8. The authors acknowledge the computational resources provided by the Aalto University School of Science “Science-IT” project, as well as those provided by CSC (Finland).References
- Ardell (1985) A. Ardell, Metallurgical Transactions A 16, 2131 (1985).
- Beyerlein et al. (2019) I. J. Beyerlein, S. Xu, J. Llorca, J. A. El-Awady, J. R. Mianroodi, and B. Svendsen, MRS Bulletin 44, 257 (2019).
- Uchic et al. (2004) M. D. Uchic, D. M. Dimiduk, J. N. Florando, and W. D. Nix, Science 305, 986 (2004).
- Dimiduk et al. (2006) D. M. Dimiduk, C. Woodward, R. LeSar, and M. D. Uchic, Science 312, 1188 (2006).
- Stinville et al. (2019) J. Stinville, E. R. Yao, P. G. Callahan, J. Shin, F. Wang, M. P. Echlin, T. M. Pollock, and D. S. Gianola, Acta Materialia 168, 152 (2019).
- Dehm et al. (2018) G. Dehm, B. N. Jaya, R. Raghavan, and C. Kirchlechner, Acta Materialia 142, 248 (2018).
- Miguel et al. (2001) M.-C. Miguel, A. Vespignani, S. Zapperi, J. Weiss, and J.-R. Grasso, Nature 410, 667 (2001).
- Zaiser (2006) M. Zaiser, Advances in Physics 55, 185 (2006).
- Ng and Ngan (2008) K. Ng and A. Ngan, Acta Materialia 56, 1712 (2008).
- Papanikolaou et al. (2017) S. Papanikolaou, Y. Cui, and N. Ghoniem, Modelling and Simulation in Materials Science and Engineering 26, 013001 (2017).
- Salmenjoki et al. (2018) H. Salmenjoki, M. J. Alava, and L. Laurson, Nature Communications 9, 5307 (2018).
- Zhang et al. (2017) P. Zhang, O. U. Salman, J.-Y. Zhang, G. Liu, J. Weiss, L. Truskinovsky, and J. Sun, Acta Materialia 128, 351 (2017).
- Weiss et al. (2015) J. Weiss, W. B. Rhouma, T. Richeton, S. Dechanel, F. Louchet, and L. Truskinovsky, Physical Review Letters 114, 105504 (2015).
- Csikor et al. (2007) F. F. Csikor, C. Motz, D. Weygand, M. Zaiser, and S. Zapperi, Science 318, 251 (2007).
- Sparks and Maaß (2018) G. Sparks and R. Maaß, Physical Review Materials 2, 120601 (2018).
- Szabó et al. (2015) P. Szabó, P. D. Ispánovity, and I. Groma, Physical Review B 91, 054106 (2015).
- Miguel et al. (2002) M.-C. Miguel, A. Vespignani, M. Zaiser, and S. Zapperi, Physical Review Letters 89, 165501 (2002).
- Ispánovity et al. (2014) P. D. Ispánovity, L. Laurson, M. Zaiser, I. Groma, S. Zapperi, and M. J. Alava, Physical Review Letters 112, 235501 (2014).
- Lehtinen et al. (2016a) A. Lehtinen, G. Costantini, M. J. Alava, S. Zapperi, and L. Laurson, Physical Review B 94, 064101 (2016a).
- Ovaska et al. (2017) M. Ovaska, A. Lehtinen, M. J. Alava, L. Laurson, and S. Zapperi, Physical Review Letters 119, 265501 (2017).
- Ispánovity et al. (2011) P. D. Ispánovity, I. Groma, G. Györgyi, P. Szabó, and W. Hoffelner, Physical review letters 107, 085506 (2011).
- Ovaska et al. (2015) M. Ovaska, L. Laurson, and M. J. Alava, Scientific Reports 5, 10580 (2015).
- Pan et al. (2019) Y. Pan, H. Wu, X. Wang, Q. Sun, L. Xiao, X. Ding, J. Sun, and E. K. Salje, Scientific Reports 9, 3778 (2019).
- Monnet et al. (2011) G. Monnet, S. Naamane, and B. Devincre, Acta Materialia 59, 451 (2011).
- Xu et al. (2016) S. Xu, L. Xiong, Y. Chen, and D. L. McDowell, Scripta Materialia 123, 135 (2016).
- Keyhani and Roumina (2018) A. Keyhani and R. Roumina, Computational Materials Science 141, 153 (2018).
- Santos-Güemes et al. (2018) R. Santos-Güemes, G. Esteban-Manzanares, I. Papadimitriou, J. Segurado, L. Capolungo, and J. LLorca, Journal of the Mechanics and Physics of Solids 118, 228 (2018).
- Lehtinen et al. (2016b) A. Lehtinen, F. Granberg, L. Laurson, K. Nordlund, and M. J. Alava, Physical Review E 93, 013309 (2016b).
- Lehtinen et al. (2018) A. Lehtinen, L. Laurson, F. Granberg, K. Nordlund, and M. J. Alava, Scientific Reports 8, 6914 (2018).
- Arsenlis et al. (2007) A. Arsenlis, W. Cai, M. Tang, M. Rhee, T. Oppelstrup, G. Hommes, T. G. Pierce, and V. V. Bulatov, Modelling and Simulation in Materials Science and Engineering 15, 553 (2007).
- Bacon et al. (1973) D. Bacon, U. Kocks, and R. Scattergood, Philosophical Magazine 28, 1241 (1973).
- Zaiser and Sandfeld (2014) M. Zaiser and S. Sandfeld, Modelling and Simulation in Materials Science and Engineering 22, 065012 (2014).
- Santos-Güemes et al. (2020) R. Santos-Güemes, B. Bellón, G. Esteban-Manzanares, J. Segurado, L. Capolungo, and J. LLorca, Acta Materialia 188, 475 (2020).
- Ringdalen et al. (2017) I. Ringdalen, S. Wenner, J. Friis, and J. Marian, MRS Communications 7, 626 (2017).
- (35) See Supplemental Material at [URL will be inserted by the publisher] for additional details of our study.
- Laurson et al. (2011) L. Laurson, J. Rosti, J. Koivisto, A. Miksic, and M. J. Alava, Journal of Statistical Mechanics: Theory and Experiment 2011, P07002 (2011).
- Neeraj et al. (2000) T. Neeraj, D.-H. Hou, G. Daehn, and M. Mills, Acta Materialia 48, 1225 (2000).
- Baró and Vives (2012) J. Baró and E. Vives, Physical Review E 85, 066121 (2012).
- Fisher (1998) D. S. Fisher, Physics Reports 301, 113 (1998).
- Budrikis et al. (2017) Z. Budrikis, D. F. Castellanos, S. Sandfeld, M. Zaiser, and S. Zapperi, Nature Communications 8, 15928 (2017).
- Zapperi and Zaiser (2001) S. Zapperi and M. Zaiser, Materials Science and Engineering: A 309, 348 (2001).
- Bakó et al. (2008) B. Bakó, D. Weygand, M. Samaras, W. Hoffelner, and M. Zaiser, Physical Review B 78, 144104 (2008).