Lopsided Satellite Distributions around Isolated Host Galaxies
Abstract
We investigate the spatial distribution of the satellites of bright, isolated host galaxies. In agreement with previous studies, we find that, on average, the satellites of red hosts are found preferentially close to their hosts’ major axes, while the satellites of blue hosts are distributed isotropically. We compute the pairwise clustering of the satellites and find a strong tendency for pairs of satellites to be located on the same side of their host, resulting in lopsided spatial distributions. The signal is most pronounced for the satellites of blue hosts, where the number of pairs on the same side of their host exceeds the number of pairs on opposite sides of their host by a factor of . For the satellites of red hosts, the number of pairs on the same side of their host exceeds the number of pairs on opposite sides of their host by a factor of . Satellites that are far from their hosts ( kpc) show a strong preference for being located on the same side of their hosts; satellites that are near to their hosts ( kpc) show a weak preference for being located on opposite sides of their hosts. While lopsided distributions have been found previously for the satellites of bright pairs of galaxies, ours is the first study to find lopsided distributions for the satellites of isolated bright galaxies.
1 Introduction
Studies of the spatial distributions of the satellites of isolated host galaxies have a considerable history (e.g., Sales & Lambas 2004, 2009; Brainerd 2005; Azzaro et al. 2007; Bailin et al. 2008; Ágústsson & Brainerd 2010, hereafter AB10; Ágústsson & Brainerd 2011). The primary motivation of these studies is a desire to use the satellites as probes of their hosts’ dark matter halos. In particular, the spatial distributions of the satellites might provide insight into the shapes and assembly histories of the hosts’ dark matter halos. Constraints on the orientations of the host galaxies within their halos might also be obtained from the locations of satellite galaxies (AB10). Generally, only one or two satellites are found for each host when host-satellite samples are selected using redshift space criteria (i.e., proximity to each other in both line-of-sight velocity and projected distance on the sky). This is often attributed to the bright limiting magnitudes of the redshift surveys used to obtain the samples; e.g., the Sloan Digital Sky Survey (SDSS; Fukugita et al. 1996; Hogg et al. 2001; Smith et al. 2002; Strauss et al. 2002; York et al. 2000) and the Two Degree Field Galaxy Redshift Survey (2dFGRS; Colless et al. 2001, 2003). When each host has only one or two satellites, this necessarily limits the degree to which statistics can be performed.
Previous studies have shown that the satellites of pairs of host galaxies (i.e., large, similarly-bright galaxies that are found relatively close to each other) are distributed asymmetrically with respect to the individual hosts. For example, Conn et al. (2013) found that % of M31’s satellites are located between M31 and the Milky Way. Additionally, Libeskind et al. (2016) studied pairs of bright SDSS galaxies and their satellites, finding that the satellites were, on average, located between the hosts, rather than in symmetric distributions centered on each host. Such “lopsided” satellite distributions for pairs of bright galaxies have also been found in Cold Dark Matter simulations (Pawlowski et al. 2017; Gong et al. 2019), and they have been attributed to satellites that are on their first approaches to their hosts (Gong et al. 2019). In the case of isolated host galaxies, systematic lopsidedness of the satellite locations has not been previously studied.
Here we present results from a new analysis of the spatial locations of the satellites of isolated host galaxies, selected using typical redshift space criteria. Each of our host-satellite systems is required to have at least two satellites, and this is a key difference between our sample and previous samples that were selected using similar criteria. The requirement of at least two satellites per system allows us to quantify the locations of the satellites with respect to each other via a pairwise clustering statistic. The properties of the host-satellite sample, and the criteria used to select it, are discussed in §2. The locations of the satellite galaxies, measured relative to the major axes of their hosts, and the clustering of the satellites with each other, are presented in §3. The main results are summarized and discussed in §4. Throughout, we adopt values for the fundamental cosmological parameters of km s-1 Mpc-1, , and . Below we quote 1 error bars, obtained from 1,000 bootstrap resamplings of the dataset. Error bars are omitted from figures when they are comparable to or smaller than the points in the figures.
2 Host-Satellite Sample
Isolated host galaxies and their satellites were selected from the NASA-Sloan Atlas (NSA) catalog v1_0_1. The NSA catalog is publicly available via the nsatlas Table in the SDSS database. The NSA contains virtually all galaxies with spectroscopic redshifts within the footprint of the 11th data release of the SDSS, and it incorporates a background subtraction method that yields significantly improved photometry for galaxies that subtend large angles on the sky (see Blanton et al. 2011). Throughout, we restrict our analysis to galaxies with extinction corrected magnitudes , consistent with the SDSS spectroscopic completeness limit. Candidate host galaxies were required to have line-of-sight velocities km s-1 and to be at least 1 magnitude brighter than all other galaxies within a projected distance kpc and line-of-sight velocity difference km s-1. Further, candidate host galaxies were required to have apparent magnitudes in the range , insuring that the vast majority of the hosts (91.5%) have luminosities brighter than (i.e., ; Blanton et al. 2001).
Candidate satellite galaxies were required to be within a projected distance kpc of their hosts, and the host-satellite line-of-sight velocity difference was required to be km s-1. Because we are interested in studying the pairwise clustering of the satellites, we further restricted the sample to only those systems for which two or more satellites were found. We eliminated 344 candidate systems due to various issues that were revealed upon visual inspection. These issues included stars that were incorrectly listed as galaxies in the NSA, galaxies that were listed twice in the NSA, and systems in which a given candidate satellite was matched with more than one candidate host. Our final, primary sample consists of 3,575 host-satellite systems with a total of 13,090 satellites. Below we refer to this as “sample 1”. Various properties of sample 1 are summarized in Fig. 1.
The total number of satellites per system ranges from 2 to 26, the mean number of satellites per system is 3.7, and the median number of satellites per system is 3. The median host redshift is , the median host absolute magnitude (extinction- and k-corrected) is , the median satellite absolute magnitude is , and the mean host-to-satellite luminosity ratio is 19.9 (i.e., on average the satellites are 2.7 magnitudes fainter than their hosts). Below, we subdivide the sample by color (extinction- and k-corrected), where we take galaxies with to be “blue” and galaxies with to be “red” (e.g., Blanton et al. 2003). The hosts are predominately red (2,719 hosts) and approximately half of the satellites are red (6,873 satellites). Fig. 1e) shows the expected strong color-color correlation of the host galaxies with their satellites; i.e., on average, the satellites of blue hosts are typically blue and the satellites of red hosts are typically red. We also note that the mean satellite color is essentially independent of host-satellite separation, with for the satellites of blue hosts and for the satellites of red hosts.
To explore the degree to which the hosts in sample 1 can be considered to be truly isolated, we computed the distance between each host and the nearest NSA galaxy for which the line-of-sight velocity difference was km s-1, and for which the host was not at least 1 magnitude brighter. These are objects that would cause any candidate host to fail the above isolation criteria if they were within 700 kpc of the host. The distribution of the distances, , between these objects and the host galaxies is shown in Fig. 1f). From this, it is clear that the nearest, similarly-bright NSA neighbor galaxies are typically more than 1 Mpc from the hosts, with a mean distance of 2.7 Mpc. In addition, only 179 hosts in sample 1 would have passed the Libeskind et al. (2016) selection criteria for bright galaxy pairs, so we conclude that sample 1 is not significantly contaminated by galaxy pairs. Below, we will identify systems that are even more isolated than sample 1 by imposing additional restrictions, and we will explore the effects of these additional restrictions on our results for satellite galaxy locations.
3 Locations of Satellite Galaxies
To compare results for the locations of the satellites in sample 1 to results from previous, similar samples, we compute their locations, , measured with respect to their hosts’ major axes. Here, is a polar angle defined such that satellites with are located along the direction of the host’s major axis and satellites with are located along the direction of the host’s minor axis. Averaged over the entire sample, the locations of the satellites are anisotropic, with a preference for being found near the major axes of their hosts: . On average, the satellites of red hosts are distributed anisotropically with , and the satellites of blue hosts are consistent with an isotropic distribution: . On average, red satellites are distributed anisotropically with , and blue satellites are distributed approximately isotropically: . These results are in excellent agreement with previous studies of the locations of the satellites of isolated host galaxies (see, e.g., AB10).
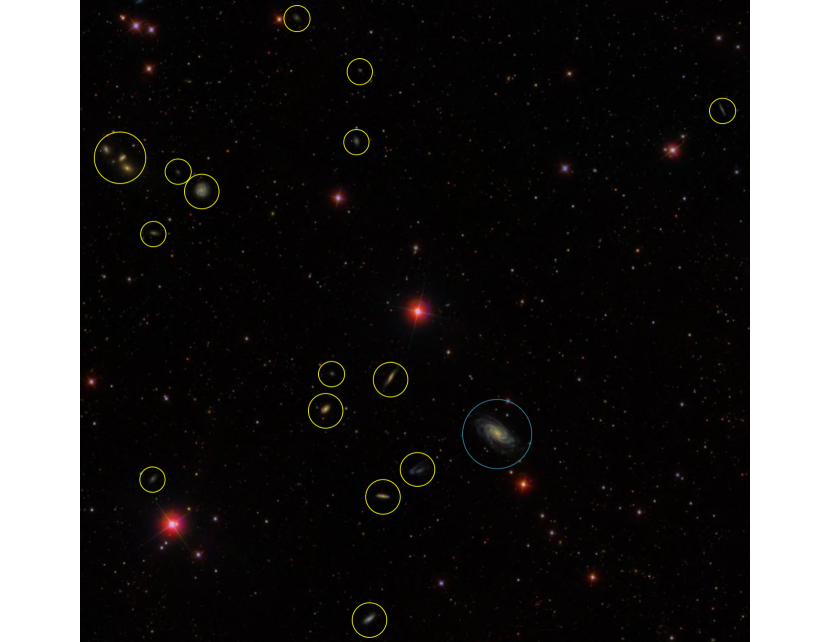
During the process of visually inspecting all host-satellite systems, it became clear that many systems had satellite distributions that were obviously lopsided with respect to the host. Fig. 2 shows an example of one such system. The host, NGC 2998 (UGC 5250), is a spiral galaxy at redshift . NGC 2998 has 17 satellites, 16 of which are located to the east of NGC2998 and 12 which are located in the quadrant of the sky to the northeast of NGC2998. To determine whether such lopsidedness in the satellite locations was present throughout our sample, we constructed a probability distribution for the polar angle differences between pairs of satellites, ). We define such that pairs of satellites with are located on the same side of their host, and pairs of satellites with are located on opposite sides of their host. The top panel of Fig. 3 shows an illustration of our definition of . The bottom panel of Fig. 3 shows the probability distribution, , that would result if the satellite locations were drawn from a uniform elliptical distribution. Uniform elliptical distributions yield functions for that are symmetric about . The more elliptical the distribution (i.e., the smaller the axis ratio, ), the greater is the value of for both and . In the case of a uniform circular distribution, all values of are equally probable.
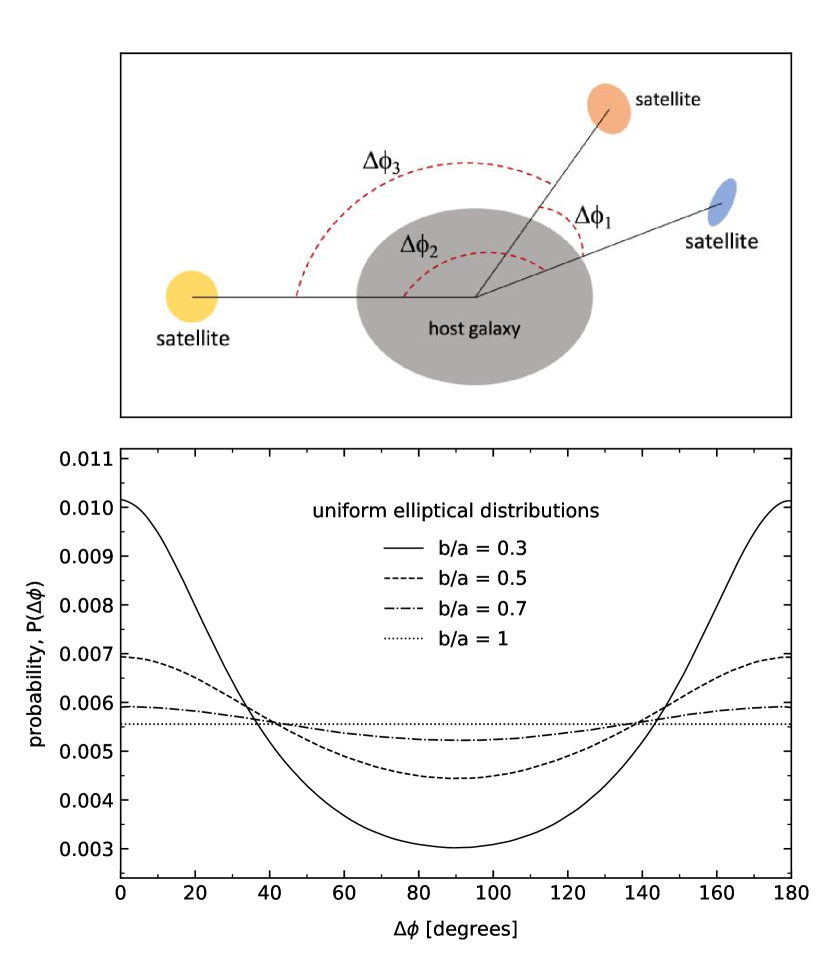
Fig. 4 shows for several subdivisions of sample 1, from which it is clear that there are many more pairs of satellites on the same side of their host than there are on opposite sides. The effect is most pronounced for the satellites of blue hosts and for systems that have only 2 or 3 satellites. We quantify this by computing the ratio, , of the number of pairs of satellites with and the number of pairs of satellites with . For the satellites of blue hosts, , while for the satellites of red hosts . For the systems with 2 or 3 satellites, , while for the systems with 7 to 26 satellites .
We use tests to compare for the satellites to for a random distribution. To do this, we generate 1,000 independent random realizations of the satellite polar angles and we use these to compute the corresponding . Results for from the randomized satellite polar angles are shown in Fig. 4 (circles). Values of the reduced (i.e., the per degree of freedom, ) are shown in each panel of Fig. 4. The tests reject the null hypothesis (i.e., that for the satellites is drawn from the randomized distribution) with a confidence level in all cases. To further compare the clustering of the satellites to that of the randomized distribution, we perform Kolmogorov-Smirnov (KS) tests for , the cumulative probability distributions for . The KS tests reject the null hypothesis with a confidence level % in all cases. We therefore conclude that the satellites are considerably more clustered in polar angle than would be expected in a randomized distribution, with pairs of satellites having a preference for being located on the same side of their host.
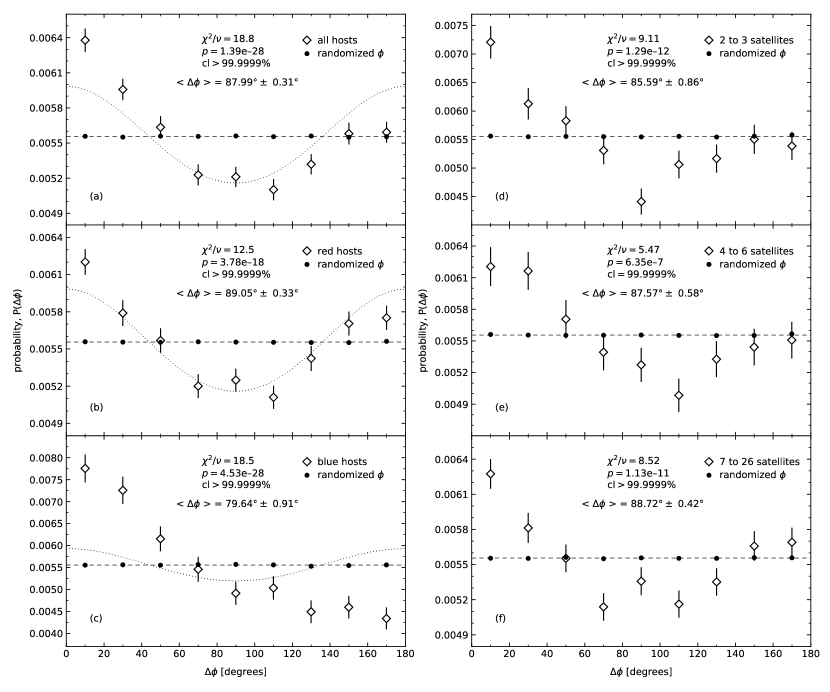
The functional form of in panels a) and b) of Fig. 4 is similar to that of uniform elliptical distributions (i.e., the bottom panel of Fig. 3). Motivated by this, we compare for the satellites of all hosts, red hosts, and blue hosts to for uniform elliptical distributions. Dotted lines in Fig. 4 show best-fit elliptical distributions in panels a), b), and c). For the satellites of all hosts and red hosts, the best-fit elliptical distribution has an axis ratio . For the satellites of blue hosts, the best-fit elliptical distribution has an axis ratio . Due to the asymmetric shape of the observed , the best-fit elliptical distributions are not good fits ( for the satellites of all hosts, for the satellites of red hosts, and for the satellites of blue hosts). They are, however, better fits to the observed than are uniform circular distributions.
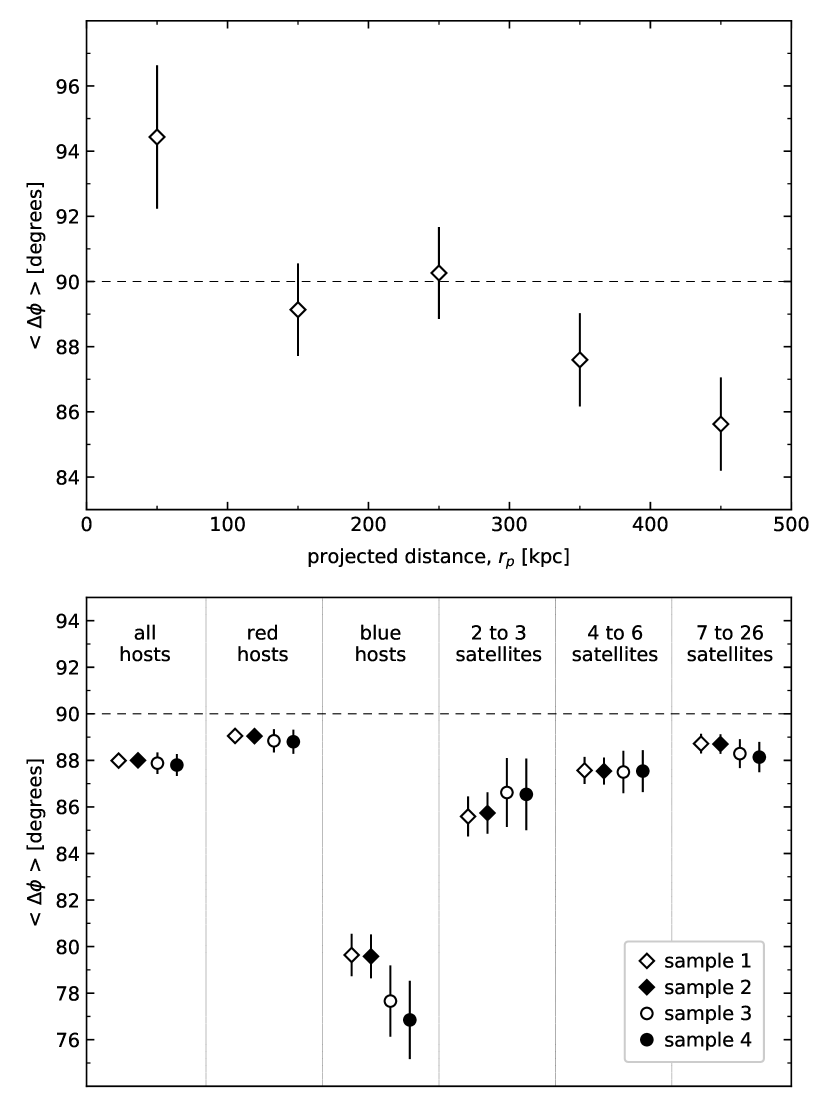
Lastly, we investigate the degree to which the lopsidedness of the satellite locations depends on host-satellite separation and on the isolation criteria adopted in sample 1. To do this, we quantify the lopsidedness of the satellite distributions by the mean polar angle difference between pairs of satellites, . The top panel of Fig. 5 shows the dependence of on host-satellite separation in sample 1. From this, it is clear that the most distant satellites ( kpc) are the ones that are responsible for the overall (i.e., average) tendency for the satellites to be found on the same side of their hosts. Interestingly, there is a weak () tendency for satellites with kpc to be found on opposite sides of their hosts.
To investigate the degree to which the lopsidedness of the satellite locations depends on the isolation criteria, we constructed three additional samples with increasingly strict isolation criteria. Sample 2 is the same as sample 1, except that in sample 2 we reject all host-satellite systems for which a photometric near neighbor galaxy exists. These photometric near neighbors lack spectroscopic redshifts, but if they happened to be at the same redshift as the host, they would likely cause the host to fail the sample 1 isolation criteria. These photometric near neighbors are in the SDSS but not in the NSA, so their photometry is not identical to that of the hosts. For the same galaxy, SDSS magnitudes can be as much as 0.5 mag fainter than the NSA magnitudes. Therefore, we constructed sample 2 by rejecting any host from sample 1 that was not at least 1.5 magnitudes brighter than any other galaxy that lacked a spectroscopic redshift and was also located inside the 700 kpc isolation radius. Sample 3 was constructed in the same way as sample 1, except the isolation radius was increased to 2 Mpc. Sample 4 was obtained from sample 3 in the same way that sample 2 was obtained from sample 1, except a 2 Mpc isolation radius was used for sample 4. The bottom panel of Fig. 5 shows a compilation of values of for the various subsamples that we analyzed in Fig. 4. From the bottom panel of Fig. 5, it is clear that there is no statistically-significant difference between our results for the satellite locations in sample 1 and any of the other samples.
4 Summary & Discussion
We investigated the spatial distribution of the satellites of bright, isolated galaxies, obtained using typical redshift space criteria. Our sample differs from previous samples, selected using similar criteria, in that each of our host-satellite systems is required to have at least two satellites. When averaged over all satellites, the mean satellite location in our sample, measured with respect to the hosts’ major axes, agrees well with previous, similar studies.
Since each host-satellite system contains multiple satellites, we were able to compute their pairwise clustering. The probability distribution for the polar angle differences between pairs of satellites, , differs significantly from for a randomized distribution (confidence level %). Pairs of satellites show a strong tendency for being located on the same side of their host, resulting in lopsided spatial distributions. The effect is most pronounced for the satellites of blue hosts and for systems that have only 2 or 3 satellites. The lopsidedness of the satellite distributions is robust to substantial changes in the host isolation criteria, including restricting the sample to host galaxies that have no other, similarly-bright galaxy within a radial distance of 2 Mpc and a line-of-sight velocity difference km s-1.
Studies of the satellites of bright galaxy pairs (i.e., two similarly bright galaxies that are relatively close to each other) have concluded that the spatial distribution of the satellites is lopsided with respect to the individual host galaxies. Ours is the first investigation to reveal the existence of lopsided distributions for the satellites of isolated bright galaxies. The overall tendency for satellites to be located on the same side of their host is due to satellites that are found far from their hosts ( kpc). These distant satellites are likely to be recent arrivals to the vicinities of their host galaxies and are, therefore, unlikely to be a virialized population. Satellites that are found nearby their hosts ( kpc) show a weak preference for being located on opposite sides of their hosts. Given that the majority of our host galaxies have luminosities , satellites that are within 100 kpc of their hosts should be well within the virial radii of their hosts’ dark matter halos. These nearby satellites could be expected to be a virialized population that trace the shapes of their hosts’ dark matter halos, in which case we would expect to find an equal number of satellites on the same side of their host as on the opposite side. Considerably larger host-satellite samples will be needed to determine whether the tendency for nearby satellites to be found on opposite sides of their hosts is statistically-significant in our universe.
References
- Ágústsson & Brainerd (2010) Ágústsson, I. & Brainerd, T. G. 2010, ApJ, 709, 1321
- Ágústsson & Brainerd (2011) Ágústsson, I. & Brainerd, T. G. 2011, ISRN Astronomy & Astrophysics, vol. 2011, id #958973 (doi: 10.5402/2011/958973)
- Azzaro et al. (2007) Azzaro, M., Patiri, S. G., Prada, F. et al. 2007, MNRAS, 376, L43
- Bailin et al. (2008) Bailin, J., Power, C., Norberg, P. et al. 2008, MNRAS, 390, 1133
- Blanton et al. (2001) Blanton, M. R., Dalcanton, J., Eisenstein, E. et al. 2001, AJ, 121, 2358
- Blanton et al. (2003) Blanton, M. R., Hogg, D. W., Bahcall, N. A. et al. 2003, ApJ, 594, 186
- Blanton et al. (2011) Blanton, M. R., Kazin, E., Muna, D. et al. 2011, AJ, 142, 31
- Brainerd (2005) Brainerd, T. G. 2005, ApJL, 628, L101
- Colless et al. (2001) Colless, M., Dalton, G., Maddox, S. et al. 2001, MNRAS, 328, 1039
- Colless et al. (2003) Colless, M., Peterson, B. A., Jackson, C. et al. 2003, arXiv:astro-ph/0306581
- Conn et al. (2013) Conn, A. R., Lewis, G. F., Ibata, R. A. et al. 2013, ApJ, 766, 120
- Fukugita et al. (1996) Fukugita, M., Ichikawa, T., Gunn, J. E. et al. 1996, AJ, 111, 1748
- Gong et al. (2019) Gong, C. C., Libeskind, N., Tempel, E. et al. 2019, MNRAS, 488, 3100
- Hogg et al. (2001) Hogg, D. W., Finkbeiner, D. P., Schlegel, D. J. et al. 2001, AJ, 122, 2129
- Libeskind et al. (2016) Libeskind, N., Guo, Q., Tempel, E. et al. 2016, ApJ, 830, 121
- Pawlowski et al. (2017) Pawlowski, M. S., Ibata, R. A., Bullock, J. S., 2017, ApJ, 850, 132
- Sales & Lambas (2004) Sales, L. & Lambas, D. G. 2004, MNRAS, 348, 1236
- Sales & Lambas (2009) Sales, L. & Lambas, D. G. 2009, MNRAS, 395, 1184
- Smith et al. (2002) Smith, J. A., Tucker, D. L., Kent, S. et al. 2002, AJ, 123, 2121
- Strauss et al. (2002) Strauss, M. A., Weinberg, D. H., Lupton, R. H. et al. 2002, AJ, 122, 1810
- York et al. (2000) York, D. G., Adelman, J., Anderson, J., E. et al. 2000, AJ, 120, 1579