Cosmicflows-3: The South Pole Wall
Abstract
Velocity and density field reconstructions of the volume of the universe within derived from the Cosmicflows-3 catalog of galaxy distances has revealed the presence of a filamentary structure extending across . The structure, at a characteristic redshift of 12,000 km s-1, has a density peak coincident with the celestial South Pole. This structure, the largest contiguous feature in the local volume and comparable to the Sloan Great Wall at half the distance, is given the name the South Pole Wall.
Key words: large scale structure of universe — galaxies: distances and redshifts
1 Introduction
The South Pole Wall rivals the Sloan Great Wall in extent, at a distance a factor two closer. The iconic structures that have transformed our understanding of large scale structure have come from the observed distribution of galaxies assembled from redshift surveys: the PerseusPisces filament (Giovanelli & Haynes, 1982), the CfA Great Wall (de Lapparent et al., 1986), the Sloan Great Wall (Gott et al., 2005). The Cosmicflows program provides an alternative path for cosmographic studies. The distribution of matter on large scales is inferred from the peculiar motions of galaxy test particles (Courtois et al., 2012; Tully et al., 2014, 2019).
The observed velocity of a galaxy can be separated into the component due to the expansion of the universe and the residual line-of-sight peculiar velocity with knowledge of the distance of the galaxy and the value of the Hubble constant compatible with the ensemble of measurements: to a first approximation . Although uncertainties with individual galaxies are large, the analysis benefits from the long range correlated nature of the cosmic flow, allowing the reconstruction of the 3D velocity field from noisy, finite and incomplete data (Zaroubi et al., 1999). The current study draws on the Cosmicflows-3 compilation of 17,669 distance measures (Tully et al., 2016) and the linear density reconstruction model of Graziani et al. (2019), supplemented by an alternative model by Hoffman et al. (in preparation).
Our density reconstructions contain many fascinating structures. Initial discussions highlighted voids (Courtois et al., 2017; Tully et al., 2019), chosen for study due to their proximity, relative simplicity, and because they have been given little attention. This second look at the cosmographic features revealed in Cosmicflows-3 reconstructions gives attention to a hitherto unknown dramatic filamentary structure. The highest density part lies coincident with the celestial South Pole which justifies the name we give to the structure: the South Pole Wall.
2 Density Reconstructions from Cosmicflows-3 Distances
The current discussion focuses on the model of peculiar velocities, , and densities , described by Graziani et al. (2019). In the assumed linear theory
| (1) |
where is the growth rate of structure given the CDM parameters , , and km s-1 Mpc-1. The Bayesian methodology seeks to derive the posterior probability of distances and the velocity field with nuisance parameters km s-1 Mpc-1 and a measure of nonlinear effects, , given as data the observed distance moduli, , redshifts, , and estimated errors. Sampling from the model and data constraints gives the mean and standard deviation of the linear velocity field at each location within . The Gibbs sampling method utilizes a Markov Chain Monte Carlo procedure (Lavaux, 2016). Details are described by Graziani et al. (2019). The analysis results in the specification . The model is saved on a three-dimensional grid with 6.25 Mpc spacings assuming the fiducial value of km s-1 Mpc-1.
As a check, an independent analysis based on the same Cosmicflows-3 distance information has been carried out with the Wiener Filter with Constrained Realizations methodology employed with earlier Cosmicflows-2 studies (Hoffman & Ribak, 1991; Zaroubi et al., 1999; Courtois et al., 2012; Tully et al., 2014). The results of the independent study will be summarily presented as providing confirmation of the essential claims made in this paper. A full description of the Wiener Filter/Constrained Realizations model with a new treatment of biases is in preparation (Hoffman et al. 2020).
3 The South Pole Wall
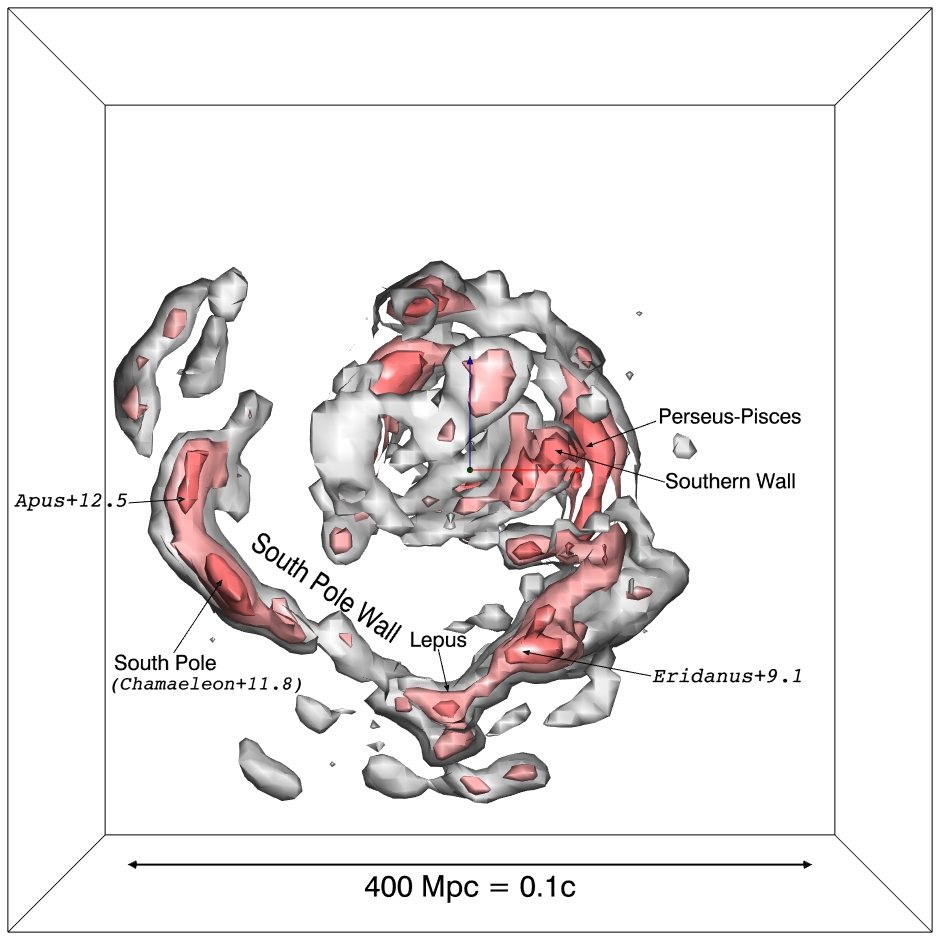
The structure to be described lies south of the plane of the Milky Way in galactic coordinates and predominantly in the celestial south. In supergalactic coordinates, the galactic south lies at negative SGY. In order to eliminate confusion from the galactic north, the overdensities in the Graziani et al. (2019) model are shown in Figure 1 restricted to SGY, with the viewer looking in from SGY. There is a secondary cut requiring SGY km s-1 to eliminate projection confusion. An obvious continuous structure runs from the feature labeled Apus+12.5111We follow a naming convention (Tully et al., 2019) based on the projected constellation of the feature and redshift in units of 1000 km s-1, positive if an overdensity and negative if an underdensity. to Lepus and from there through the Funnel (Eridanus+9.1) to PerseusPisces and the Southern Wall.
The more celestially northerly and nearby of these features are relatively well known. The PerseusPisces filament has long been established as a prominent structure (Giovanelli & Haynes, 1982; Haynes & Giovanelli, 1988). Likewise, the Southern Wall was identified early in studies of large scale structure (Pellegrini et al., 1990). The Funnel is a name given to describe the gathering of flow patterns emanating from PerseusPisces and the Southern Wall that proceed toward Lepus (Pomarède et al., 2017). This latter publication was based on a study using Cosmicflows-2 distances. In that earlier study the flow patterns upon reaching the already distant Lepus region passed through astrus incognito to reach the Shapley concentration of galaxies (Scaramella et al., 1989; Raychaudhury, 1989). It has taken the more plentiful Cosmicflows-3 compilation to edify the nature of structure beyond Lepus.
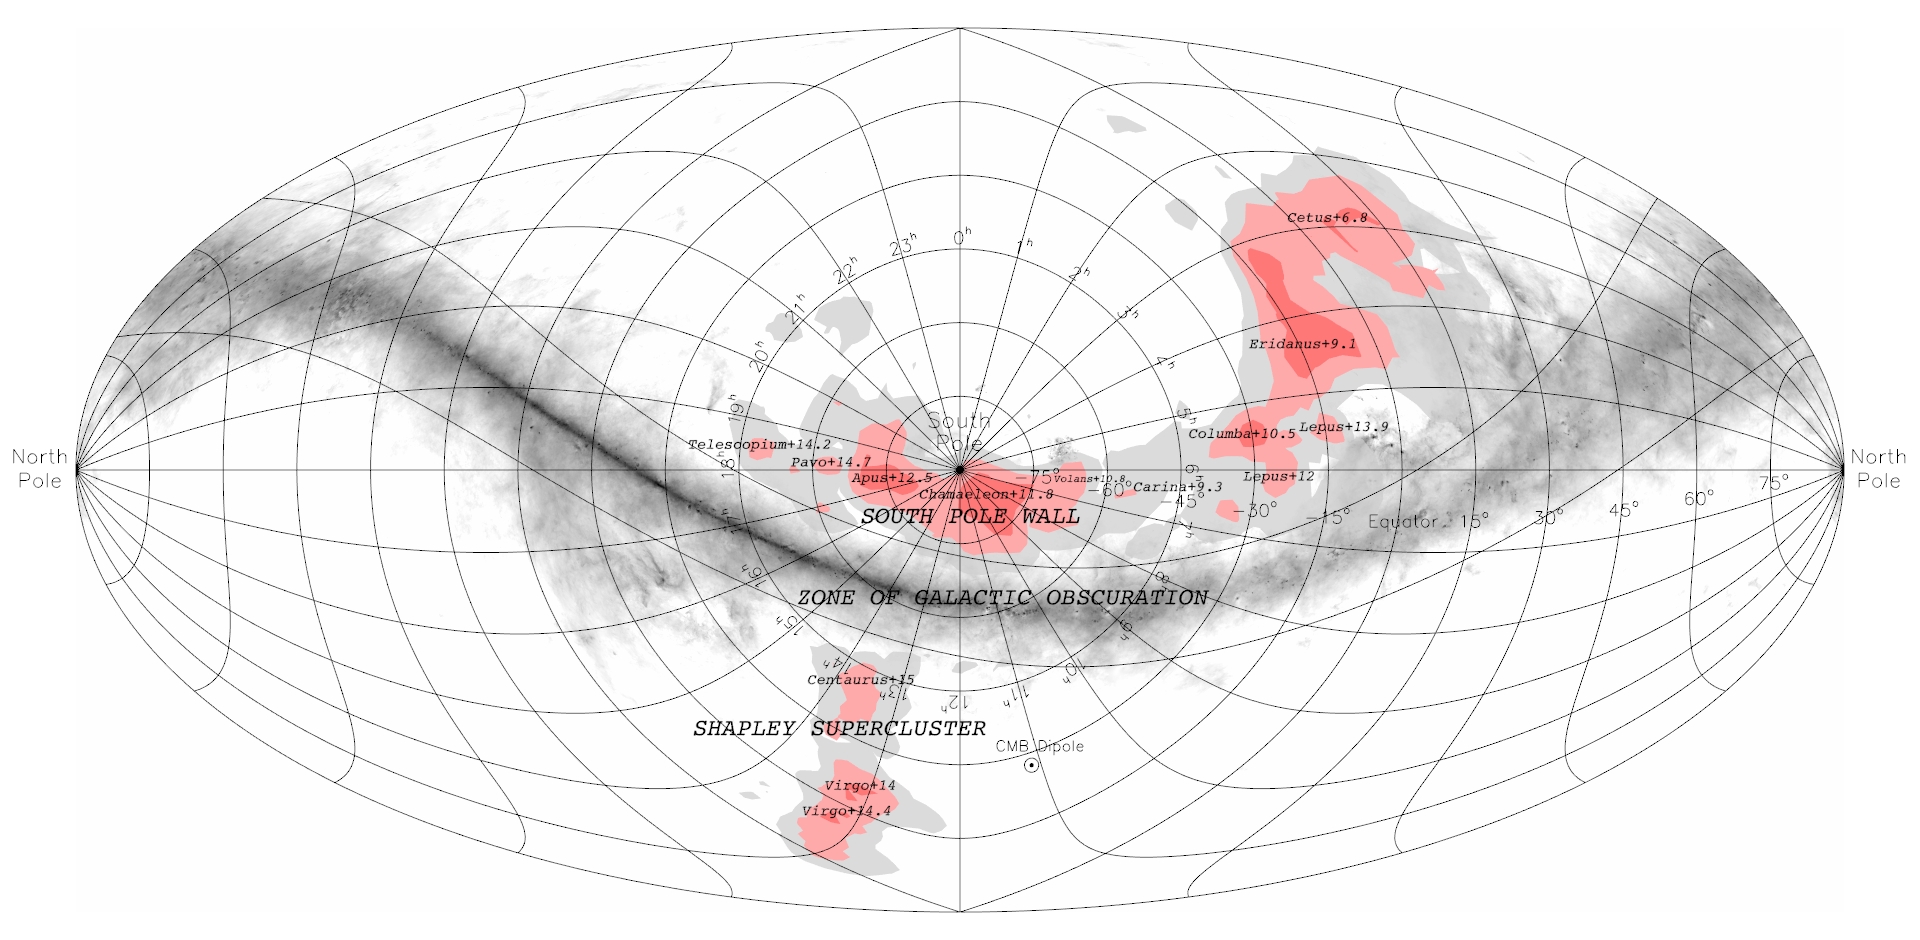
It is seen in Figure 1 that there is a pronounced continuous feature running from Lepus to a high density feature labeled Apus+12.5. Chamaeleon+11.8 is the highest density peak along this extended filament, coincident with the celestial South Pole. This coincidence is shown in Figure 2, a plot in celestial coordinates centered on the South Pole.
The regions of obscuring dust of the Milky Way are represented in this second figure. The South Pole Wall as we identify it lies entirely to the galactic south of the Milky Way, but hugs close to the galactic plane. The proximity of the populous Shapley overdensity across the zone of obscuration from the South Pole Wall is to be noted. The apex of the cosmic microwave background dipole temperature fluctuation is nearby. Our models based on peculiar velocity flows recover the density peak at the South Pole even though the direction is obscured by the Chamaeleon molecular cloud complex (Hoffmeister, 1962).
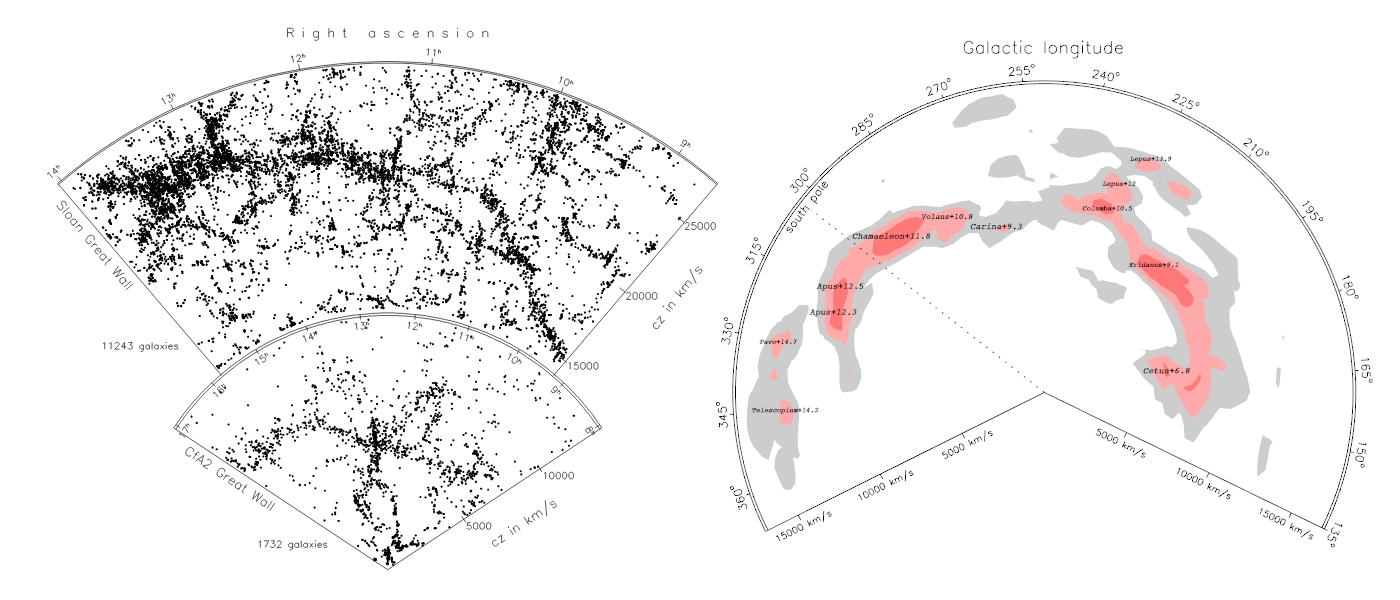
The South Pole Wall extends across a wide swath of the sky, especially if taken to continue to the region of the Funnel. Since it adheres reasonably closely to a constant latitude with respect to the galactic plane, it is conveniently mapped in galactic longitude against redshift as seen in the right panel of Figure 3. The left panel is a reproduction of a rather famous illustration of the Sloan Great Wall and CFA Great Wall (Gott et al., 2005) for comparison. The extent of the South Pole and Sloan walls are comparable. The run from Apus to Lepus over at latitude and km s-1 covers km s-1 Mpc. The bend toward us inward to km s-1 over from Lepus to the Funnel (Cetus+6.8) is of length km s-1 Mpc. End-to-end, from Apus to the Funnel is Mpc. This structure is a factor of two closer that the Sloan Great Wall, evidence that such large contiguous entities are not unusual.
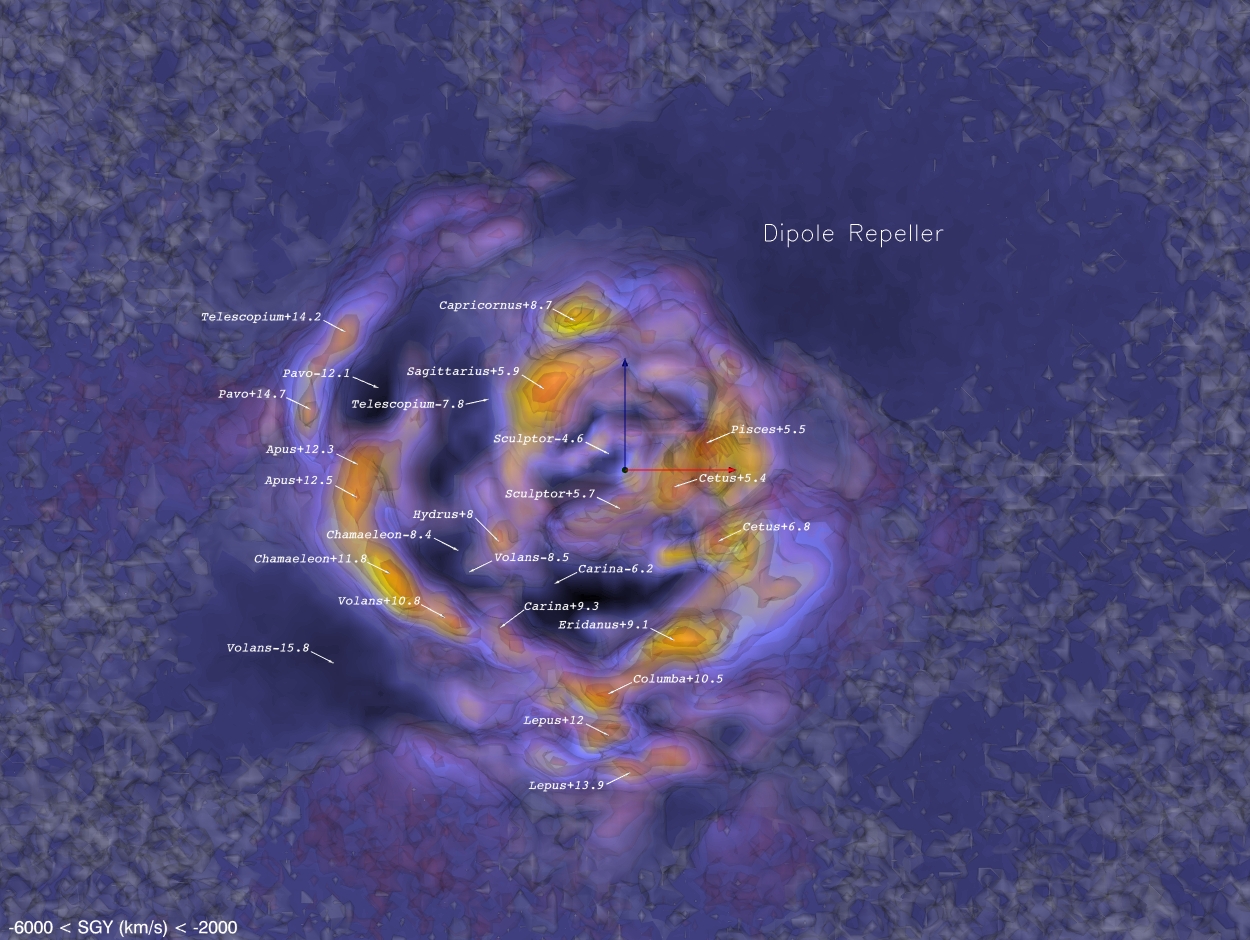
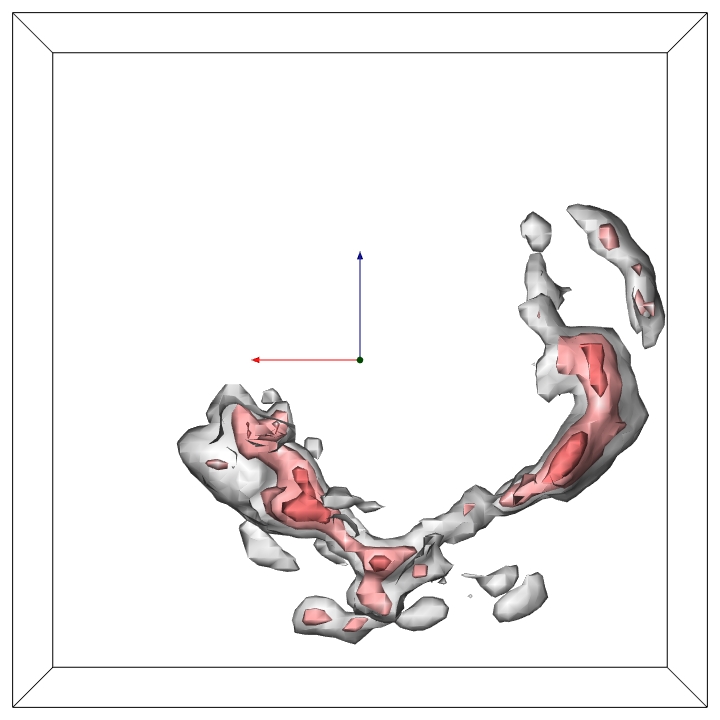
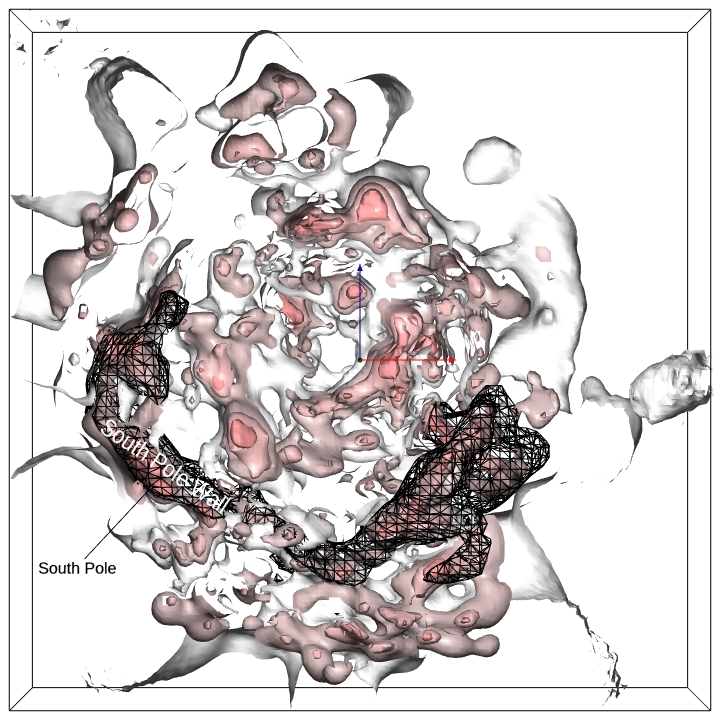
Figure 4 is another view of the Graziani et al. (2019) model with a tighter slice, only 4,000 km s-1 thick, and including negative contours, again looking in from along the negative SGY axis. This model results from a Gibbs sampling MCMC chain of 2633 constrained realizations. Chain variances in the vicinity of the South Pole Wall are . The most tenuous part of the South Pole Wall adjacent Carina+9.3 attains , a robust value. Local uncertainties in the composite are estimated to be .
Figure 5 shows the full extent of the posited South Pole Wall stripped of features that we consider unrelated. Now the view is from along the positive SGY axis, with arrows 5,000 km s-1 in length directed from the supergalactic origin toward +SGX (red) and +SGZ (blue). This figure provides an entry point into a Sketchfab viewer allowing an interactive visualization of the model.222 Sketchfab viewers allow immersive, interactive navigation within 3D models. Use mouse action for rotation, zoom, translation of the view point. Selected features are indicated by the means of numbered annotations. An Autopilot mode guides you through the corresponding predefined stations. SGY boundaries are set at zero and km s-1. The overdensity contours are again at , 1.3, and 1.8.
It has become evident that, wherever there are substantial overdensities, adjacent there are voids. The South Pole Wall conforms to this expectation. To the near side lies the Sculptor Void, appropriately the most prominent void within the Cosmicflows-3 study volume (Tully et al., 2019). At least to a partial degree on the far side lies the poorly documented Eridanus Void. In Fig. 4 the abysses Carina-6.2, Volans-8.5 and Chamaeleon-8.4 are density minima within the Sculptor Void. Tully et al. (2019) provide a video that illustrates the domain of the Sculptor Void and the proximity of the South Pole Wall as a bounding feature.
The Wiener Filter/Constrained Realization model of the Cosmicflows-3 peculiar velocity observations of Hoffman et al. (2020, in preparation) provides the map of overdensities shown in Figure 6. The slice is 3,000 km s-1 thick, looking in from SGY. The resolution is twice as high as that of Graziani et al. (2019) with grid spacings of 3.1 Mpc with fiducial km s-1 Mpc-1. The structure tends to break up into a lumpier distribution as a consequence of the higher resolution. The continuous structure from Apus to the Funnel is seen, albeit with greater confusion. A wireframe representation of the structure shown in Fig. 5 from the Graziani et al. model is superimposed. An interactive Sketchfab model can be accessed from the caption for Fig. 6 that provides better clarity than afforded by the static view. Full discussion of the complex structure found from the Hoffman et al. analysis awaits publication of this alternative model of Cosmicflows-3 peculiar velocities.
As an alternative to the relative density definition of structure following from Eq. 1, knots, filaments, sheets, and voids can be defined through the determination of velocity shear at each voxel (Hoffman et al., 2012; Pomarède et al., 2017):
| (2) |
where partial derivatives of the velocity are determined along directions and of orthogonal Cartesian axes, normalized by the average expansion given by the Hubble Constant, . Eigenvalues indicating collapse have negative values. Knots are characterized by three eigenvalues of collapse, voids by three eigenvalues of expansion, and filaments and sheets are the intermediate cases. Although not easy to follow in a static view such as the representation on a page, the South Pole Wall is easy to discern in the interactive Figure 7, which gives access to the capabilities of rotation and zoom. There is impressive continuity of the South Pole Wall as a filament as defined by the quantitative description provided by the eigenvalues of local velocity shear. The eigenvalues specify that there are knots embedded within the filament at Apus+12.9, Chamaeleon+11.8, Lepus+12, Columba+11.1, and Eridanus+10.2. The alternative Wiener filter model to be reported by Hoffman et al., with lower signal to noise at the redshift of the South Pole Wall, identifies the run of the structure as a wall or sheet from an eigenfunction analysis.
The video map introduced in the summary section, shows the V-web representation at t=4min05s. The video provides a visual comparison with individual galaxies at their redshift positions drawn from the 2MASS Extended Source Catalog (Jarrett et al., 2000). In spite of the substantial redshift of the South Pole Wall and the flirtation with the zone of obscuration, there is a substantial positive association of galaxies from the redshift catalog and the boundaries of the South Pole Wall.
In hindsight, the South Pole Wall can be recovered from the projection maps given with the final release of the 6dF Galaxy Survey (Jones et al., 2009). In the declination slices of Fig. 8 in that paper, the structure is represented in all 6 declination intervals at km s-1, rotating counter-clockwise from about 1 o’clock in the most equatorial slice, through the features labeled Columba-Lepus and Puppis-Carina at 12 0’clock, then seen in rotation all the way to 6 o’clock in the slice south of declination . Regrettably, this southernmost slice is poorly covered because of missing tiles in the 6dF survey. Nonetheless, much of the run of the wall can be seen in the top panel of Fig. 1 of Jones et al. (2009) running down from the concentration labelled Eridanus-Lepus and, better, in the lower panel of their Fig. 6, the feature in green and yellow running along latitude from to where data thins out near the south celestial pole at .

4 Flow Streamlines
Yet another way of unveiling the large scale structures is through the continuity of flow streamline patterns (Hoffman et al., 2017). The displacements of individual galaxies is tiny on the scale of large scale structures, only of order a few Mpc over the age of the universe. The expansion of the universe completely dominates over peculiar velocities on scales larger than several Mpc. Nevertheless, streamlines are useful constructs for the delineation of separate gravitational basins (Dupuy et al., 2019).
Streamlines are trajectories in space whose tangents coincide with the direction of the velocity field at any point. Starting from a seed point a streamline is defined by where is the line element of the trajectory. Streamlines can be seeded in an ordered manner or randomly. If integrated long enough they either converge at the attractors of the flow field or escape out of the computational box. (Hoffman et al., 2001). A multitude of seeds will generate a multitude of streamlines that converge on the local extrema of the velocity potential. These are the stationary knots of the V-web.
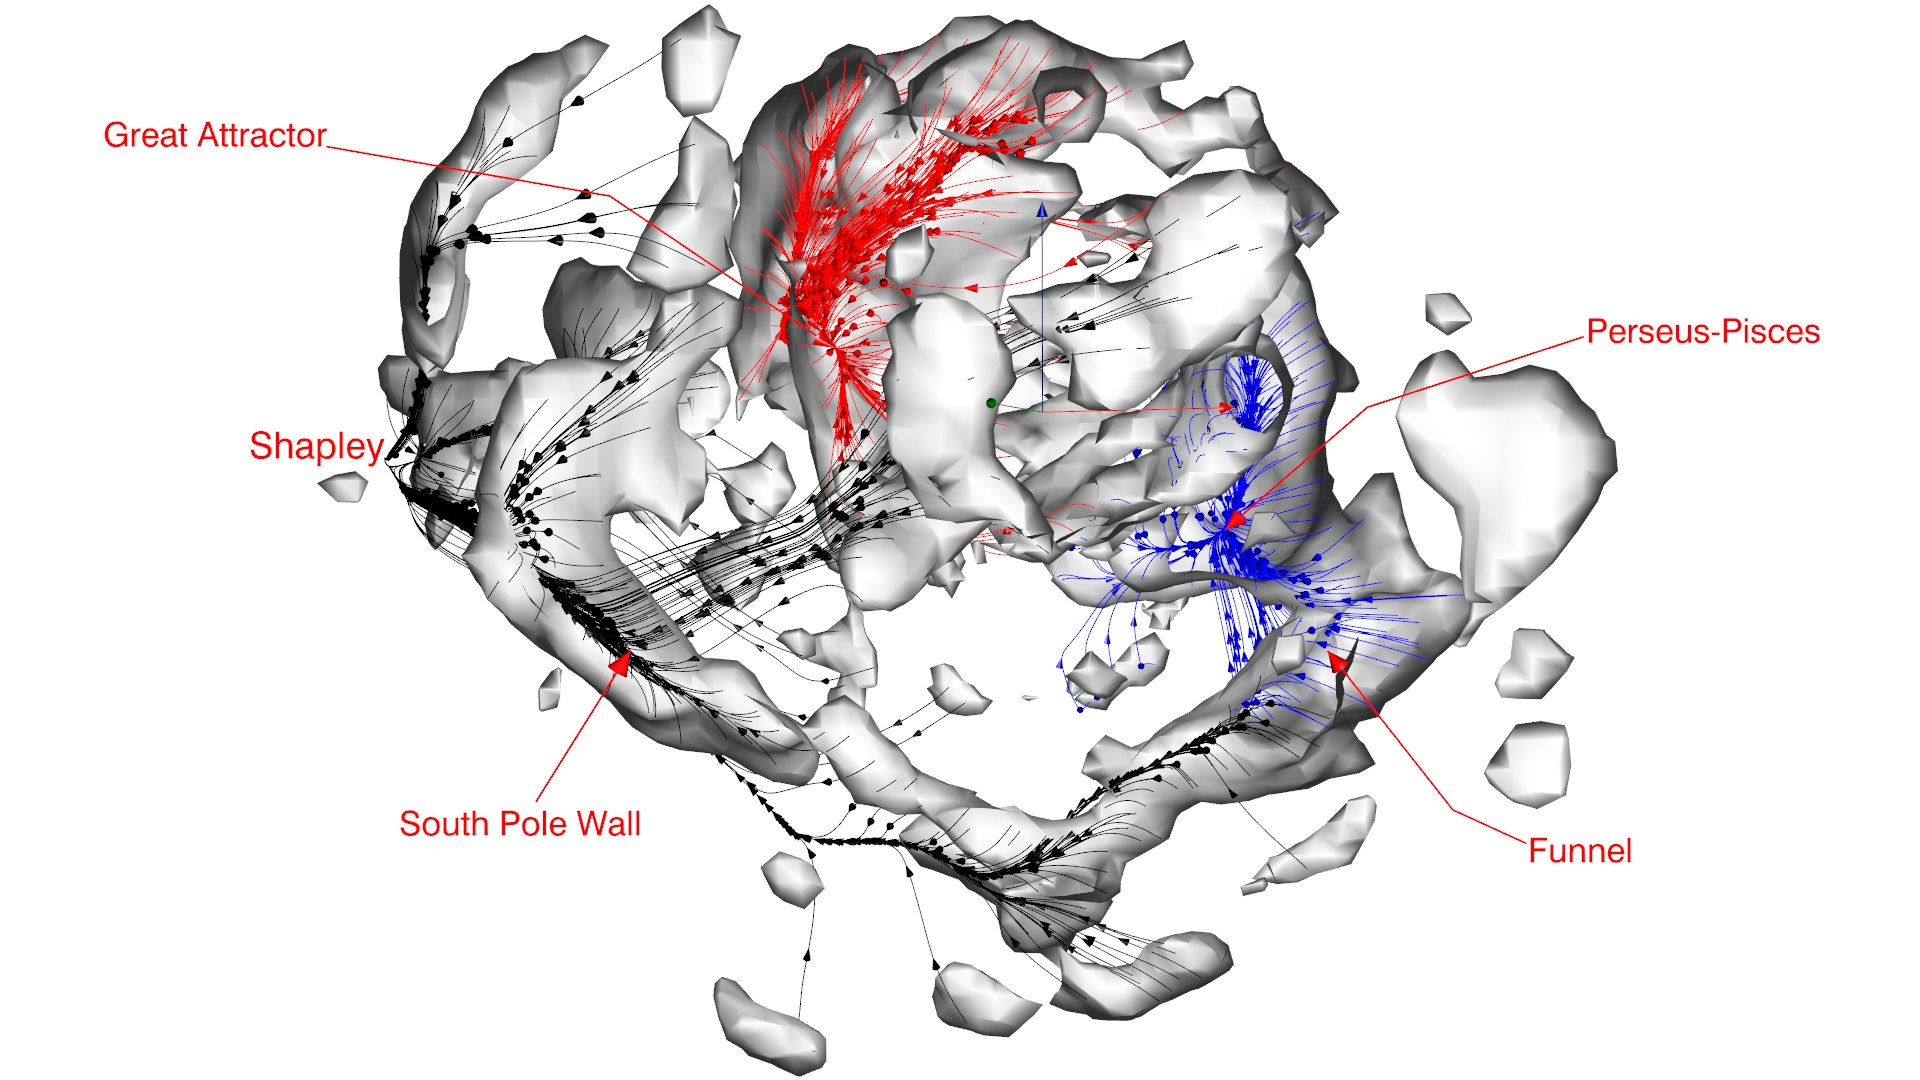
In the current application, seeds are located within regions of overdensity . The consequent flow lines are seen in Figure 8 and, even better, in the associated interactive model. It will be seen that there are three cumulation points for streamlines, identified in turn with the general region of the Great Attractor (Dressler et al., 1987) at the heart of Laniakea Supercluster (Tully et al., 2014), the PerseusPisces filament (Haynes & Giovanelli, 1988), and the Shapley concentration (Scaramella et al., 1989; Raychaudhury, 1989). Essentially all the seeds placed along the South Pole Wall terminate in the Shapley concentration. The only exceptions are those at the extreme northern end in the region being referred to as the Funnel. Here there is a discontinuity, with streamlines flowing instead to the PerseusPisces basin.
This pattern of flows along filaments with divergent points between adjacent gravitational basins is becoming familiar as mapping of velocity fields become more robust. Pomarède et al. (2017) illustrate several such cases along filaments connecting Laniakea and PerseusPisces; specifically the structures called the CentaurusPuppisPP filament and the CentaurusVirgoPP filament, so-named because of the filament end points and the routes that they take.
In the case of the South Pole Wall the structure is immensely larger but the characteristic is similar. Just as seen in simulations, filaments interconnect across the cosmic web. Velocity field information reveals how these structure shear between adjacent knots of the V-web.
5 Dynamical Influence
The location of the apex of the cosmic microwave background dipole is indicated in Fig. 2. The Shapley Supercluster lies nearby, long a suspected major player in the generation of the 630 km s-1 motion of the Local Group with respect to the cosmic rest frame (Scaramella et al., 1989; Raychaudhury, 1989). In detail, this motion has arisen out of innumerable peaks and valleys in the distribution of matter on a wide range of scales. The mass concentration from Centaurus to Norma clusters at the heart of Laniakea Supercluster must be important (Lynden-Bell et al., 1988). The significant pull and push contributions of the nearby Virgo Cluster and Local Void have received recent emphasis (Tully et al., 2019). On a very large scale, there is the push provided by the Dipole Repeller (Hoffman et al., 2017).
Given the proximity in direction of the densest part of the South Pole Wall, it is to be asked if this feature also plays a significant attractive roll in the motion reflected in the CMB dipole. The attraction at our position of the overdensity within a volume running from the peaks labeled Volans+10.8 to Telescopium+14.2 in Fig. 3 gives rise to a velocity of km s-1. By comparison, a volume enclosing the Shapley concentration is pulling at km s-1.333The alternative Wiener Filter model gives an attractive pull by Shapley of km s-1(Hoffman et al., 2017). The influences are remarkably comparable. The densities of galaxies and modelled mass are much higher in Shapley and, indeed, the pattern of galaxy motions, discussed in §4, flow through the South Pole Wall toward a terminus in Shapley, substantiating the primacy of Shapley.
6 Summary
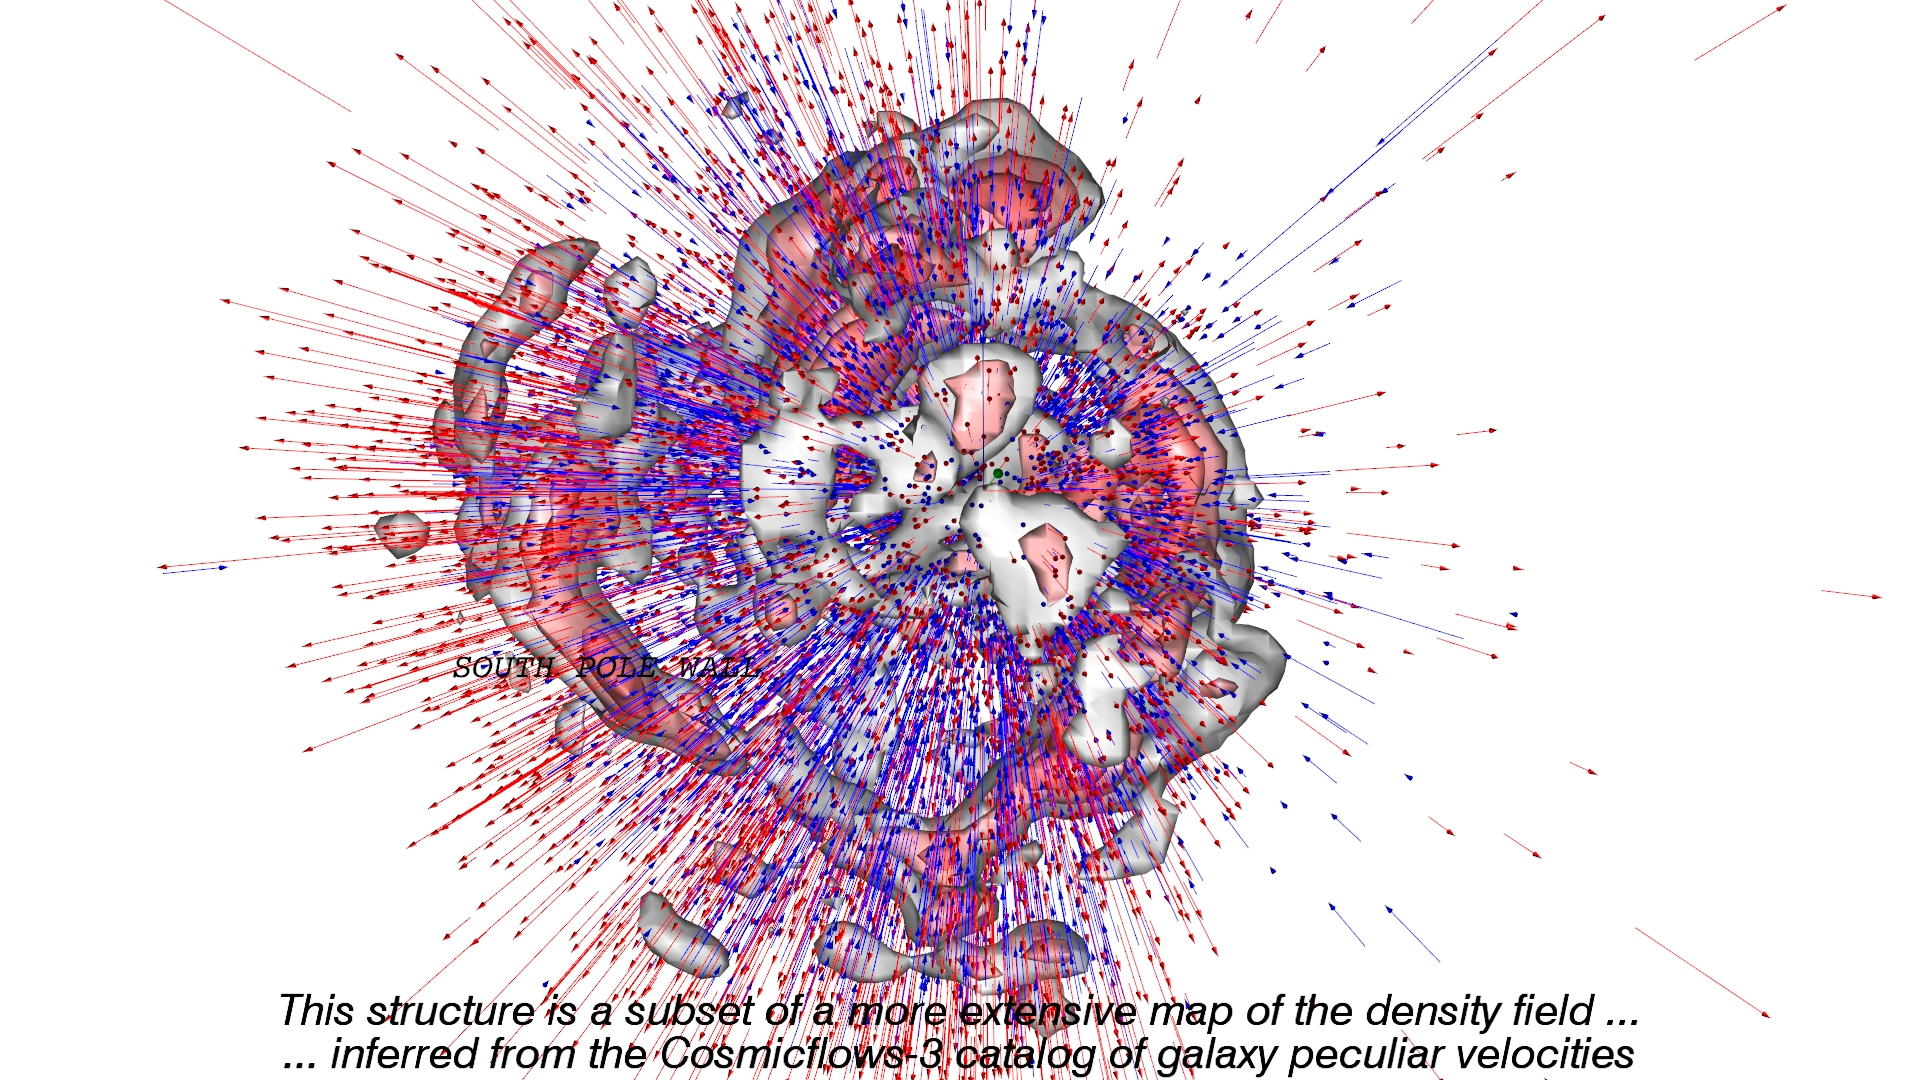
The accompanying 5 minute video (see interactive Figure 9) encapsulates the salient points of this discussion. Observational limitations must be acknowledged. Recognition of the South Pole Wall feature has only been possible because of the contribution of the Six Degree Field Galaxy Survey component of Cosmicflows-3 (Springob et al., 2014). The redshift limit of this contribution is 16,000 km s-1. The South Pole Wall as we constitute it walks a constrained line inside this limit at km s-1 and, at , the other observational impediment of the zone of obscuration of the Milky Way.
The proximity of the Shapley concentration of rich clusters with similar velocities (Scaramella et al., 1989; Raychaudhury, 1989) and the direction of our motion inferred from the cosmic microwave background dipole (Fixsen et al., 1996) both immediately to the north of the galactic plane begs the question of what we might be missing. Resolution will require numerous and accurate distance measures to significantly larger redshifts.
In addition to these redshift and obscuration edge effects, there are other ambiguities regarding the full extent of the South Pole Wall. The km s-1 run of a rather straight filament from Apus through the celestial South Pole to Lepus is most striking. Then there is the km s-1 long complex between Lepus and the Funnel after a bend in direction at Lepus. Should these structures be considered conjoint? We suggest yes. It is in the Funnel that our seeded streamlines shear between flows toward PerseusPisces and Shapley. From the Funnel, all along the posited South Pole Wall, streamlines flow along this structure before jumping across the zone of obscuration to reach the Shapley concentration. The distance between Lepus and Shapley is 19,000 km s-1 Mpc.
Given the limitations imposed by the boundaries of our study, where does the connectivity end? There is a hint of a related feature at 18,000 km s-1 in the constellation Vela in the zone of obscuration (Courtois et al., 2019). Indeed, perhaps we should be informed by simulations (Springel et al., 2005) that the cosmic network of overdensities is quasi-connected over indefinite lengths.
In any event, the reasonable case can be made that the South Pole Wall has an extent of at least Mpc. This extent is impressive given that the effective radius of the Cosmicflows-3 compilation of distances is . The South Pole Wall is the largest contiguous structure within this volume. We will not be certain of its full extent, nor whether it is unusual, until we map the universe on a significantly grander scale.
Acknowledgements
Financial support for the Cosmicflows program has been provided by the US National Science Foundation award AST09-08846, an award from the Jet Propulsion Lab for observations with Spitzer Space Telescope, and NASA award NNX12AE70G for analysis of data from the Wide-field Infrared Survey Explorer. HC acknowledges support from the Institut Universitaire de France, the CNES, and the Project IDEXLYON at the University of Lyon under the Investments for the Future Program (ANR-16-IDEX-0005). YH is supported by the Israel Science Foundation grant ISF 1358/18.
References
- Courtois et al. (2012) Courtois, H. M., Hoffman, Y., Tully, R. B., & Gottlöber, S. 2012, ApJ, 744, 43, doi: 10.1088/0004-637X/744/1/43
- Courtois et al. (2019) Courtois, H. M., Kraan-Korteweg, R. C., Dupuy, A., Graziani, R., & Libeskind, N. I. 2019, MNRAS, 490, L57, doi: 10.1093/mnrasl/slz146
- Courtois et al. (2017) Courtois, H. M., Tully, R. B., Hoffman, Y., et al. 2017, ApJ, 847, L6, doi: 10.3847/2041-8213/aa88b2
- de Lapparent et al. (1986) de Lapparent, V., Geller, M. J., & Huchra, J. P. 1986, ApJ, 302, L1, doi: 10.1086/184625
- Dressler et al. (1987) Dressler, A., Faber, S. M., Burstein, D., et al. 1987, ApJ, 313, L37, doi: 10.1086/184827
- Dupuy et al. (2019) Dupuy, A., Courtois, H. M., Dupont, F., et al. 2019, MNRAS, 489, L1, doi: 10.1093/mnrasl/slz115
- Fixsen et al. (1996) Fixsen, D. J., Cheng, E. S., Gales, J. M., et al. 1996, ApJ, 473, 576, doi: 10.1086/178173
- Giovanelli & Haynes (1982) Giovanelli, R., & Haynes, M. P. 1982, AJ, 87, 1355, doi: 10.1086/113223
- Gott et al. (2005) Gott, J. Richard, I., Jurić, M., Schlegel, D., et al. 2005, ApJ, 624, 463, doi: 10.1086/428890
- Graziani et al. (2019) Graziani, R., Courtois, H. M., Lavaux, G., et al. 2019, MNRAS, 488, 5438, doi: 10.1093/mnras/stz078
- Haynes & Giovanelli (1988) Haynes, M. P., & Giovanelli, R. 1988, Large-scale structure in the local universe: the Pisces-Perseus supercluster., ed. V. C. Rubin & G. V. Coyne, 31–70
- Hoffman et al. (2001) Hoffman, Y., Eldar, A., Zaroubi, S., & Dekel, A. 2001, astro-ph/0102190
- Hoffman et al. (2012) Hoffman, Y., Metuki, O., Yepes, G., et al. 2012, MNRAS, 425, 2049, doi: 10.1111/j.1365-2966.2012.21553.x
- Hoffman et al. (2017) Hoffman, Y., Pomarède, D., Tully, R. B., & Courtois, H. M. 2017, Nature Astronomy, 1, 0036, doi: 10.1038/s41550-016-0036
- Hoffman & Ribak (1991) Hoffman, Y., & Ribak, E. 1991, ApJ, 380, L5, doi: 10.1086/186160
- Hoffmeister (1962) Hoffmeister, C. 1962, ZAp, 55, 290
- Jarrett et al. (2000) Jarrett, T. H., Chester, T., Cutri, R., et al. 2000, AJ, 119, 2498, doi: 10.1086/301330
- Jones et al. (2009) Jones, D. H., Read, M. A., Saunders, W., et al. 2009, MNRAS, 399, 683, doi: 10.1111/j.1365-2966.2009.15338.x
- Lavaux (2016) Lavaux, G. 2016, MNRAS, 457, 172, doi: 10.1093/mnras/stv2915
- Lynden-Bell et al. (1988) Lynden-Bell, D., Faber, S. M., Burstein, D., et al. 1988, ApJ, 326, 19, doi: 10.1086/166066
- Pellegrini et al. (1990) Pellegrini, P. S., da Costa, L. N., Huchra, J. P., Latham, D. W., & Willmer, C. N. A. 1990, AJ, 99, 751, doi: 10.1086/115371
- Pomarède et al. (2017) Pomarède, D., Hoffman, Y., Courtois, H. M., & Tully, R. B. 2017, ApJ, 845, 55, doi: 10.3847/1538-4357/aa7f78
- Raychaudhury (1989) Raychaudhury, S. 1989, Nature, 342, 251, doi: 10.1038/342251a0
- Scaramella et al. (1989) Scaramella, R., Baiesi-Pillastrini, G., Chincarini, G., Vettolani, G., & Zamorani, G. 1989, Nature, 338, 562, doi: 10.1038/338562a0
- Springel et al. (2005) Springel, V., White, S. D. M., Jenkins, A., et al. 2005, Nature, 435, 629, doi: 10.1038/nature03597
- Springob et al. (2014) Springob, C. M., Magoulas, C., Colless, M., et al. 2014, MNRAS, 445, 2677, doi: 10.1093/mnras/stu1743
- Tully et al. (2014) Tully, R. B., Courtois, H., Hoffman, Y., & Pomarède, D. 2014, Nature, 513, 71, doi: 10.1038/nature13674
- Tully et al. (2016) Tully, R. B., Courtois, H. M., & Sorce, J. G. 2016, AJ, 152, 50, doi: 10.3847/0004-6256/152/2/50
- Tully et al. (2019) Tully, R. B., Pomarède, D., Graziani, R., et al. 2019, ApJ, 880, 24, doi: 10.3847/1538-4357/ab2597
- Zaroubi et al. (1999) Zaroubi, S., Hoffman, Y., & Dekel, A. 1999, ApJ, 520, 413, doi: 10.1086/307473