Pion interferometry at 200 GeV using anisotropic hydrodynamics
Abstract
In this paper, we continue our phenomenological studies of heavy-ion collisions using 3+1d anisotropic hydrodynamics (aHydro). In previous works, we compared quasiparticle aHydro (aHydroQP) with ALICE 2.76 TeV Pb-Pb and RHIC 200 GeV Au-Au collision results. At both energies, the agreement was quite good between aHydroQP and the experimental data for many observables. In this work, we present comparisons of the Hanbury Brown–Twiss (HBT) radii and their ratios determined using pairs produced in 200 GeV Au-Au collisions. We first present comparisons with STAR results for the HBT radii and their ratios. We then present comparisons with PHENIX results for the HBT radii and their ratios. In both cases, we find reasonable agreement between aHydroQP predictions and available experimental results for the ratios of HBT radii. At the level of the radii themselves, in some cases quantitative differences on the order of 10-20% remain, which deserve further study.
I Introduction
Heavy-ion collision experiments at the Relativistic Heavy Ion Collider (RHIC) and Large Hadron Collider (LHC) create and study the quark-gluon plasma (QGP) under very extreme conditions. Relativistic dissipative hydrodynamics has been quite successfully used to describe the collective behavior seen in these experiments Huovinen et al. (2001); Romatschke and Romatschke (2007); Ryu et al. (2015); Niemi et al. (2011); Averbeck et al. (2015); Jeon and Heinz (2016); Romatschke and Romatschke (2019). A decade ago, anisotropic hydrodynamics was introduced as a new approach which takes into account the fact that the QGP is a highly momentum-space anisotropic plasma at early times and near its longitudinal/transverse edges Florkowski and Ryblewski (2011); Martinez and Strickland (2010); Martinez et al. (2012); Ryblewski and Florkowski (2012); Alqahtani et al. (2018). It was only recently that anisotropic hydrodynamics was extended to include both shear and bulk viscous effects and a 3+1d code was developed which enabled practioners to perform phenomenological comparisons Alqahtani et al. (2017a, b); Almaalol et al. (2019a).
In recent years, using our quasiparticle anisotropic hydrodynamics code (aHydroQP), we presented phenomenological comparisons with data available at different collision energies. We first showed comparisons with 2.76 TeV Pb-Pb collision data from the ALICE collaboration Alqahtani et al. (2017a, b). We presented comparisons of charged-hadron multiplicity, identified-particle spectra, identified-particle average transverse momentum, charged-particle elliptic flow, identified-particle elliptic flow, the integrated elliptic flow vs pseudorapidity, and the HBT radii. These comparisons showed that the agreement is quite good between our model and the experimental data. Subsequently, we presented comparisons with 200 GeV Au-Au collision data from the RHIC experiments Almaalol et al. (2019a). In this prior work, we presented comparisons of the identified particle spectra, charged particle multiplicity versus pseudorapidity, identified particle multiplicity versus centrality, identified particle elliptic flow versus transverse momentum, and charged particle elliptic flow as a function of transverse momentum and rapidity.
In this paper, we will present aHydroQP predictions for Hanbury Brown-Twiss (HBT) radii in 200 GeV Au-Au collisions. HBT interferometry studies the correlations of pairs of particles obeying Bose-Einstein statistics and is based on quantum statistical interference. The understanding of these correlations is crucial to study the system’s dynamics and the space-time structure of the emitting sources formed at freeze-out Wiedemann and Heinz (1999); Heinz and Jacak (1999); Lisa et al. (2005). We present comparisons of the HBT radii and their ratios for pairs in different centrality classes as a function of (pair mean transverse momentum). The dependence of the HBT radii on provides information about the size of the regions over which the system emits particles with similar momentum (region of homogeneity). We first present comparisons with STAR results for the HBT radii and their ratios. We then show comparisons with PHENIX results from 2015 for the HBT radii and their ratios. In both cases, we find reasonable agreement between our model and the experimental results, however, quantitative differences remain. One should note that there are prior works which were able to describe results from pion interferometry at 200 GeV Au-Au collisions Broniowski et al. (2008); Kisiel et al. (2009); Pratt and Vredevoogd (2008); Pratt (2009); Bozek (2011); Karpenko et al. (2013); Bozek (2014); Moreland and Soltz (2016). In this paper, we want to investigate the effect of the aHydro anisotropic distribution function on the HBT radii using our previously obtained parameter set, since the HBT correlations are sensitive to the freeze-out conditions.
The structure of the paper is as follows. In Sec. II, we review the basics of anisotropic hydrodynamics and the 3+1d dynamical equations. In Sec. III, we summarize the main components of the 3+1d aHydroQP model, which was used previously and will be used in this work. In Sec. IV, for Au-Au collisions at 200 GeV, we show comparisons of the HBT radii and their ratios obtained using the 3+1d aHydroQP model with experimental data. Sec. V contains our conclusions and an outlook for the future.
II Quasiparticle Anisotropic Hydrodynamics
The evolution of massive relativistic quasiparticle systems is governed by the Boltzmann equation Alqahtani et al. (2015)
| (1) |
where the mass () is a function of temperature obtained from lattice QCD calculations and is the collisional kernel which is taken to be in relaxation-time approximation (RTA) Alqahtani et al. (2015).
In anisotropic hydrodynamics, the distribution function in the local rest frame is given by
| (2) |
where the parameters encode the momentum-space anisotropy of the medium. This form reduces back to the equilibrium distribution function with temperature when and the temperature like parameter, , is taken to be = T. Once the form of the distribution function is specified, the dynamical equations can be obtained using the first and second moments of the Boltzmann equation. Detailed derivation of the dynamical equations for aHydroQP can be found in Refs. Nopoush et al. (2014); Alqahtani et al. (2015, 2017c, 2018).
III 3+1d aHydroQP model
In this section, we highlight the main ingredients and assumptions used in the 3+1d aHydroQP code used herein. First, we used smooth Glauber initial conditions, neglecting the effects of fluctuations. We also used momentum-space isotropic initial conditions and assumed that Almaalol et al. (2019a). For modeling the primordial hadron production and subsequent hadronic decays, we use a customized version of THERMINATOR 2 which allows for momentum-space anisotropies at freeze-out Chojnacki et al. (2012). To determine the free parameters ( and ), we fit the pion, kaon, and proton spectra in the 0-5% and 30-40% centrality classes. Once the parameters were determined Almaalol et al. (2019a), they can be used to compute other observables such as the elliptic flow and the HBT radii. We note that our code is publicly available and can be obtained using Ref. Strickland (2017).
IV Phenomenological comparisons
In this section, we present comparisons of the HBT radii predicted by aHydroQP with = 200 GeV Au-Au collision data. In this work, we continue our previous work Almaalol et al. (2019a) and use exactly the same model parameters determined therein. It is worth mentioning that the parameters obtained from Almaalol et al. (2019a) are fm/c, MeV, , and MeV. For more details about the aHydroQP model and comparisons to RHIC hadron spectra, , etc., we refer the reader to Ref. Almaalol et al. (2019a).
The correlation function used to obtain the HBT radii is parametrized in terms of three Gaussians (the 3-D Bertsch-Pratt parameterization) Pratt (1986); Bertsch (1989)
| (3) |
where is the incoherence parameter. The longitudinal component () is parallel to the beam axis (the z-axis), the out component () is chosen parallel to the mean transverse momentum of the pair (the x-axis), and the side component () is perpendicular to both and (the y-axis). In a similar way, the relative momentum (=-) is decomposed into three components (, , ) Florkowski (2010); Chaudhuri (2014). We have ignored final state interactions such as the Coulomb repulsion between the similar charged pion pairs.
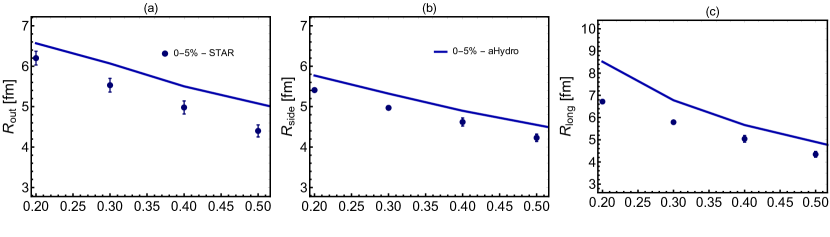
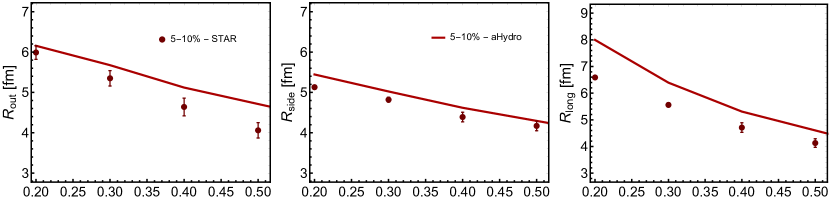
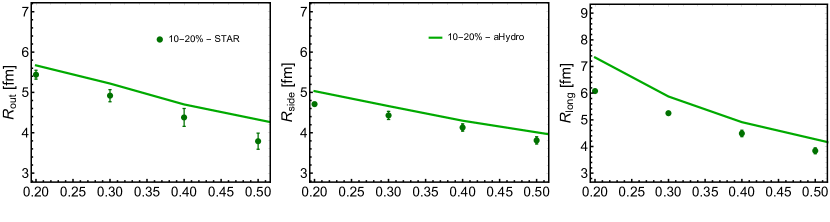
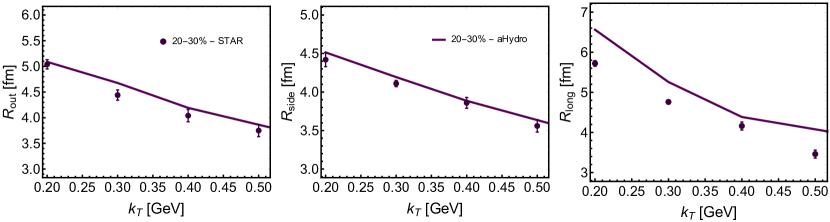
Now, let us turn to the comparisons between our model and the experimental results. In Figs. 1-4, we show the dependence of the HBT radii and their ratios. As can be seen in Figs. 1 and 3, the HBT radii tend to decrease with increasing due to the change in the size of the homogeneity regions. In Figs. 1-2, we show comparisons with STAR experimental results in four bins Adams et al. (2005). In Fig. 1, we show the predicted HBT radii by aHydroQP (solid lines) and the experimental results in four different centrality classes, 0-5%, 5-10%, 10-20%, and 20-30%. In the left, middle, and right columns we show , , and as a function of the mean transverse momentum of the pair . In the left column, we see that our model overestimates the experimental data, particularly at 0.5 GeV. This is most likely due to the smooth initial conditions used herein. Turning next to the middle column, we see that the agreement between our model and the STAR data is reasonable, however, quantitative differences remain. Lastly, in the right column, which shows , we see that the agreement is clearly not as good as the other two columns especially at low .
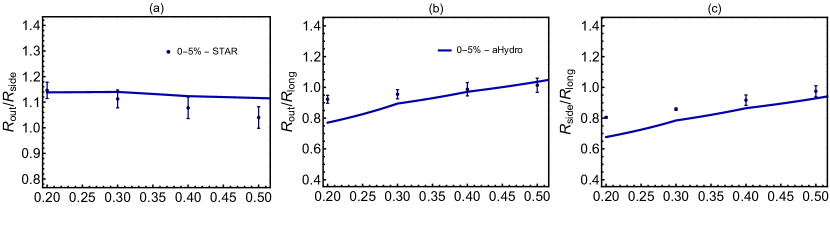
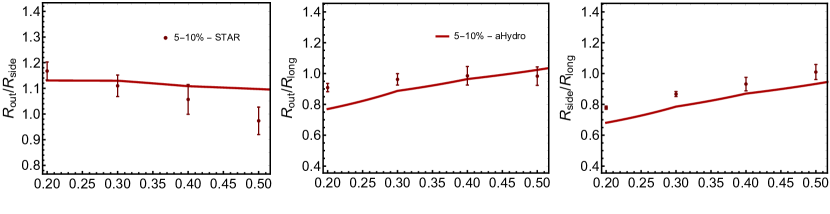
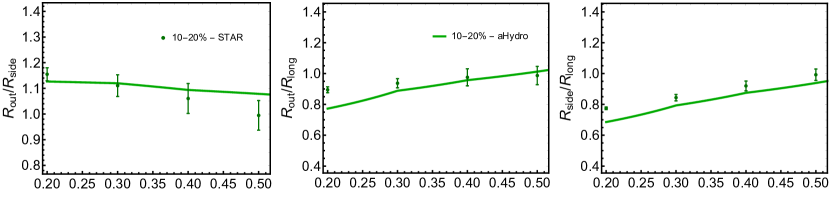
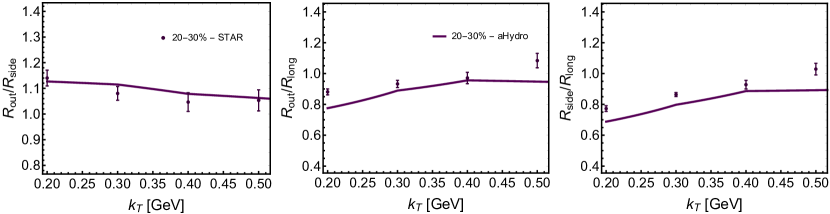
Next, in Figs. 2 we compare the ratios of the HBT radii. In this set of figures, in the left, middle, and right columns we show , , and , respectively, as a function of . As can be seen from this Figure, we find quite good agreement between our model and the experimental results for HBT radii ratios. This is true for all ratios shown and in all centrality classes. We note that our model slightly underestimates the ratio due to overestimating in Fig. 1. The agreement with data found herein is similar to what was found in previous works using dissipative hydrodynamics, however, in this work we present comparisons in a larger range of centrality classes and compare with both STAR and PHENIX data Broniowski et al. (2008); Kisiel et al. (2009); Pratt and Vredevoogd (2008); Pratt (2009); Bozek (2011); Karpenko et al. (2013); Bozek (2014).
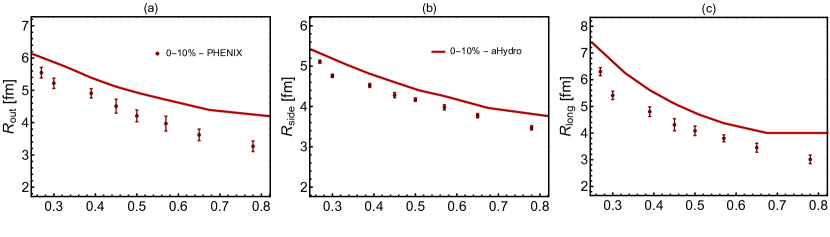
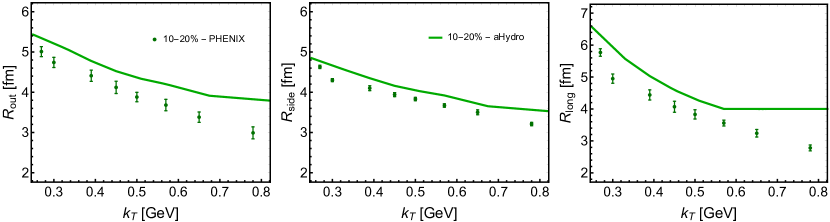
Next, we show comparisons with PHENIX experimental results obtained from Adare et al. (2015) where more bins are presented. In Fig. 3, we show the comparisons of the HBT radii predicted by aHydroQP and the experimental results in 0-10% and 10-20% centrality classes. As in Fig. 1, the left, middle, and right columns show , , and as a function of the mean transverse momentum of the pair . In a similar way to what we have seen in the comparisons with STAR results, we see that our model overestimates the data especially at large . As an example, in column (a), we see that there is an approximately 30% difference between our model prediction and the experimental results at large 0.8 GeV, while at at low 0.3 GeV there is an approximately 20% difference. Similar discrepancies can also be seen in column (c) for the and in the bottom row for and . However, as can be seen from column (b), in both centrality classes, we see that better agreement between our model prediction and the experimental results for .
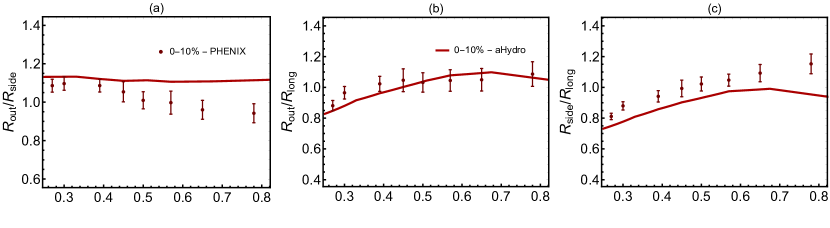
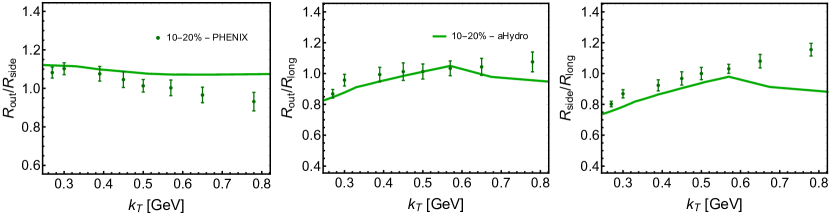
In Fig. 4, we show the HBT radii ratios reported by PHENIX as a function of the pair mean transverse momentum for in the 0-10 and 10-20 centrality classes. As can be seen from these panels, the agreement is quite good up to 0.5-0.6 GeV. In the left column, which shows , one sees that after 0.5 GeV, our model predictions do not decrease enough to fully explain the experimental results. In the middle column, which shows , one sees that the agreement in the 0-10 centrality class is quite good, while in the 10-20 centrality class one sees that our model underestimates the data at large . Finally, in the right column, which shows (), one can see the model underestimates the data at large . Despite these quantitative differences, we note that overall the model does a good job in reproducing the systematic trends seen in the data.
From our comparisons with both STAR and PHENIX data, we see that our model overestimates by on the order of 10-20%. This means that the longitudinal expansion of the QGP in aHydro is stronger than what is seen experimentally. This is most likely due to the fact that aHydro was taken to have a strong initial boost-invariant Bjorken flow. It would be interesting to study the impact of having a slightly weaker initial longitudinal flow profile. We note here that the agreement between model and data presented here is quite similar to our prior comparisons between aHydroQP and ALICE results for 2.76 TeV Pb-Pb collisions Alqahtani et al. (2017b), however, in the case of the PHENIX data, in particular, the experimental error bars are quite small which presents a challenge for the model.
V Conclusions and Outlook
In previous works we have presented comparisons of 3+1d aHydroQP and relativistic heavy-ion collision experimental data obtained at different collision energies. These past studies allowed us to fix a set of model parameters such as initial central temperature, shear viscosity, etc. for use in predicting additional observables. In this paper, using those previously determined parameters, we presented predictions of the aHydroQP model for the femtoscopic HBT radii and their ratios at RHIC energies. We showed comparisons of model predictions with data from both the STAR and PHENIX collaborations obtained using charged pion correlations. We found reasonable agreement overall with experimental results in several centrality classes and as a function of the pair mean transverse momentum, in particular with respect to trends seen in the data. There were, however, quantitative differences which were evident, for example, in . These quantitative differences deserve further study. In particular, it would be interesting to see how sensitive this observable is to the assumed initial longitudinal flow of the QGP. Herein, for continuity with prior work, we assumed the initial longitudinal flow profile to be Bjorken flow, which is extremal. Perhaps a modest reduction in the initial longitudinal flow would improve agreement with the experimental data beyond what has already been achieved. Additionally, we have used smooth (non-fluctuating) Glauber initial conditions which is definitely too simplistic. By including fluctuating initial conditions, one can expect to see reductions in the size regions of homogeneity, which may help to bring model predictions into better agreement with experimental data. Looking to the future, we are working on comparisons with experimental data from 5.02 TeV Pb-Pb collisions, including HBT radii. We also are working on including off-diagonal terms in the anisotropy tensor Nopoush and Strickland (2019), using more realistic (fluctuating) initial conditions, and using collisional kernels that go beyond the relaxation-time approximation Almaalol and Strickland (2018); Almaalol et al. (2019b).
Acknowledgements.
M. A. is supported by the Deanship of Scientific Research at the Imam Abdulrahman Bin Faisal University under grant number 2020-080-CED. M. Strickland was supported by the U.S. Department of Energy, Office of Science, Office of Nuclear Physics under Award No. DE-SC0013470. This research utilized Imam Abdulrahman Bin Faisal (IAU)’s Bridge HPC facility, supported by IAU Scientific and High Performance Computing Center Al-Amri et al. (2018).References
- Huovinen et al. (2001) P. Huovinen, P. F. Kolb, U. W. Heinz, P. V. Ruuskanen, and S. A. Voloshin, Phys. Lett. B503, 58 (2001), arXiv:hep-ph/0101136 .
- Romatschke and Romatschke (2007) P. Romatschke and U. Romatschke, Phys. Rev. Lett. 99, 172301 (2007), arXiv:0706.1522 [nucl-th] .
- Ryu et al. (2015) S. Ryu, J. F. Paquet, C. Shen, G. S. Denicol, B. Schenke, S. Jeon, and C. Gale, Phys. Rev. Lett. 115, 132301 (2015), arXiv:1502.01675 [nucl-th] .
- Niemi et al. (2011) H. Niemi, G. S. Denicol, P. Huovinen, E. Molnár, and D. H. Rischke, Phys.Rev.Lett. 106, 212302 (2011), arXiv:1101.2442 [nucl-th] .
- Averbeck et al. (2015) R. Averbeck, J. W. Harris, and B. Schenke, “Heavy-Ion Physics at the LHC,” in The Large Hadron Collider: Harvest of Run 1 (2015) pp. 355–420.
- Jeon and Heinz (2016) S. Jeon and U. Heinz, in Quark-Gluon Plasma 5, edited by X.-N. Wang (2016) pp. 131–187.
- Romatschke and Romatschke (2019) P. Romatschke and U. Romatschke, Relativistic Fluid Dynamics In and Out of Equilibrium, Cambridge Monographs on Mathematical Physics (Cambridge University Press, 2019) arXiv:1712.05815 [nucl-th] .
- Florkowski and Ryblewski (2011) W. Florkowski and R. Ryblewski, Phys.Rev. C83, 034907 (2011), arXiv:1007.0130 [nucl-th] .
- Martinez and Strickland (2010) M. Martinez and M. Strickland, Nucl. Phys. A848, 183 (2010), arXiv:1007.0889 [nucl-th] .
- Martinez et al. (2012) M. Martinez, R. Ryblewski, and M. Strickland, Phys.Rev. C85, 064913 (2012), arXiv:1204.1473 [nucl-th] .
- Ryblewski and Florkowski (2012) R. Ryblewski and W. Florkowski, Phys. Rev. C85, 064901 (2012), arXiv:1204.2624 [nucl-th] .
- Alqahtani et al. (2018) M. Alqahtani, M. Nopoush, and M. Strickland, Prog. Part. Nucl. Phys. 101, 204 (2018), arXiv:1712.03282 [nucl-th] .
- Alqahtani et al. (2017a) M. Alqahtani, M. Nopoush, R. Ryblewski, and M. Strickland, Phys. Rev. Lett. 119, 042301 (2017a), arXiv:1703.05808 [nucl-th] .
- Alqahtani et al. (2017b) M. Alqahtani, M. Nopoush, R. Ryblewski, and M. Strickland, Phys. Rev. C96, 044910 (2017b), arXiv:1705.10191 [nucl-th] .
- Almaalol et al. (2019a) D. Almaalol, M. Alqahtani, and M. Strickland, Phys. Rev. C99, 044902 (2019a), arXiv:1807.04337 [nucl-th] .
- Wiedemann and Heinz (1999) U. A. Wiedemann and U. W. Heinz, Phys. Rept. 319, 145 (1999), arXiv:nucl-th/9901094 [nucl-th] .
- Heinz and Jacak (1999) U. W. Heinz and B. V. Jacak, Ann. Rev. Nucl. Part. Sci. 49, 529 (1999), arXiv:nucl-th/9902020 [nucl-th] .
- Lisa et al. (2005) M. A. Lisa, S. Pratt, R. Soltz, and U. Wiedemann, Ann. Rev. Nucl. Part. Sci. 55, 357 (2005), arXiv:nucl-ex/0505014 [nucl-ex] .
- Broniowski et al. (2008) W. Broniowski, M. Chojnacki, W. Florkowski, and A. Kisiel, Phys. Rev. Lett. 101, 022301 (2008), arXiv:0801.4361 [nucl-th] .
- Kisiel et al. (2009) A. Kisiel, W. Broniowski, M. Chojnacki, and W. Florkowski, Phys. Rev. C79, 014902 (2009), arXiv:0808.3363 [nucl-th] .
- Pratt and Vredevoogd (2008) S. Pratt and J. Vredevoogd, Phys. Rev. C78, 054906 (2008), [Erratum: Phys. Rev.C79,069901(2009)], arXiv:0809.0516 [nucl-th] .
- Pratt (2009) S. Pratt, Phys. Rev. Lett. 102, 232301 (2009), arXiv:0811.3363 [nucl-th] .
- Bozek (2011) P. Bozek, Phys. Rev. C83, 044910 (2011), arXiv:1012.5927 [nucl-th] .
- Karpenko et al. (2013) I. A. Karpenko, Yu. M. Sinyukov, and K. Werner, Phys. Rev. C87, 024914 (2013), arXiv:1204.5351 [nucl-th] .
- Bozek (2014) P. Bozek, Phys. Rev. C89, 044904 (2014), arXiv:1401.4894 [nucl-th] .
- Moreland and Soltz (2016) J. S. Moreland and R. A. Soltz, Phys. Rev. C 93, 044913 (2016), arXiv:1512.02189 [nucl-th] .
- Alqahtani et al. (2015) M. Alqahtani, M. Nopoush, and M. Strickland, Phys. Rev. C92, 054910 (2015), arXiv:1509.02913 [hep-ph] .
- Nopoush et al. (2014) M. Nopoush, R. Ryblewski, and M. Strickland, Phys.Rev. C90, 014908 (2014), arXiv:1405.1355 [hep-ph] .
- Alqahtani et al. (2017c) M. Alqahtani, M. Nopoush, and M. Strickland, Phys. Rev. C95, 034906 (2017c), arXiv:1605.02101 [nucl-th] .
- Adams et al. (2005) J. Adams et al. (STAR), Phys. Rev. C71, 044906 (2005), arXiv:nucl-ex/0411036 [nucl-ex] .
- Chojnacki et al. (2012) M. Chojnacki, A. Kisiel, W. Florkowski, and W. Broniowski, Comput. Phys. Commun. 183, 746 (2012), arXiv:1102.0273 [nucl-th] .
- Strickland (2017) M. Strickland, http://personal.kent.edu/~mstrick6/code/ (2017).
- Pratt (1986) S. Pratt, Phys. Rev. D33, 1314 (1986).
- Bertsch (1989) G. F. Bertsch, Bose-Einstein correlations in particle and nuclear physics: A collection of reprints, Nucl. Phys. A498, 173C (1989), [,254(1989)].
- Florkowski (2010) W. Florkowski, Phenomenology of Ultra-Relativistic Heavy-Ion Collisions (2010).
- Chaudhuri (2014) A. Chaudhuri, A short course on Relativistic Heavy Ion Collisions (IOPP, 2014) arXiv:1207.7028 [nucl-th] .
- Adare et al. (2015) A. Adare et al. (PHENIX), Phys. Rev. C92, 034914 (2015), arXiv:1504.05168 [nucl-ex] .
- Adler et al. (2004) S. S. Adler et al. (PHENIX), Phys. Rev. Lett. 93, 152302 (2004), arXiv:nucl-ex/0401003 [nucl-ex] .
- Nopoush and Strickland (2019) M. Nopoush and M. Strickland, Phys. Rev. C100, 014904 (2019), arXiv:1902.03303 [nucl-th] .
- Almaalol and Strickland (2018) D. Almaalol and M. Strickland, Phys. Rev. C 97, 044911 (2018), arXiv:1801.10173 [hep-ph] .
- Almaalol et al. (2019b) D. Almaalol, M. Alqahtani, and M. Strickland, Phys. Rev. C 99, 014903 (2019b), arXiv:1808.07038 [nucl-th] .
- Al-Amri et al. (2018) S. S. Al-Amri et al., https://doi.org/10.5281/zenodo.1117442 (2018).