Pressure-induced suppression of ferromagnetism in CePd2P2
Abstract
The correlated electron material CePd2P2 crystallizes in the ThCr2Si2 structure and orders ferromagnetically at . Lai et al. Lai et al. (2018) found evidence for a ferromagnetic quantum critical point induced by chemical compression via substitution of Ni for Pd. However, disorder effects due to the chemical substitution interfere with a simple analysis of the possible critical behavior. In the present work, we examine the temperature - pressure - magnetic field phase diagram of single crystalline CePd2P2 to using a combination of resistivity, magnetic susceptibility, and x-ray diffraction measurements. We find that the ferromagnetism appears to be destroyed near , without any change in the crystal structure.
I Introduction
When a ferromagnetic transition is suppressed by a clean control parameter such as pressure, typically, the second-order phase transition changes to first-order at a critical value of the control parameter Pfleiderer et al. (1997) and the transition abruptly drops towards Brando et al. (2016); Kirkpatrick and Belitz (2012); Belitz et al. (1999, 2005); Kirkpatrick and Belitz (2015). As the system approaches the critical point in a second order phase transition, fluctuations in the order parameter extend to larger and larger length scales, while the order parameter varies smoothly between the ordered and disordered phases. However, in a first order phase transition, this correlation length does not diverge, and the order parameter changes discontinuously Belitz et al. (1999); Janoschek et al. (2013). In certain compounds, such as UGe2 and ZrZn2, the shift from a second- to first-order transition is accompanied by the appearance of metamagnetic “wings” in the phase diagram, in which the ordered phase reappears when a magnetic field is applied Kaluarachchi et al. (2018); Uhlarz et al. (2004); Kimura et al. (2004). As pressure increases, the metamagnetic transition is smoothly pushed to higher fields and lower temperatures until it can terminate at a quantum wing critical point (QWCP) at Belitz et al. (1999); Belitz and Kirkpatrick (2017); Kaluarachchi et al. (2017). More complicated scenarios are also possible, where both ferromagnetic and antiferromagnetic or modulated phases are present Belitz and Kirkpatrick (2017) as observed in LaCrGe3 Kaluarachchi et al. (2017); Taufour et al. (2018) and CeTiGe3 Kaluarachchi et al. (2018). The complex phase diagrams of such materials represent a critical test of our understanding of quantum phase transitions.
The possibility of these sorts of features make CePd2P2 an interesting compound for study. The crystal structure of CePd2P2 was first reported in Ref. Jeitschko and Hofmann (1983). No further characterization was performed until the work of Shang et al. Shang et al. (2014), which reported resistivity, DC magnetization and DC magnetic susceptibility of polycrystalline CePd2As2-xPx for different levels of substitution, and demonstrated a ferromagnetic transition in CePd2P2 at approximately . In the same year, Tran and Bukowski Tran and Bukowski (2014) reported on DC magnetic susceptibility, magnetization, specific heat, resistivity, and magnetoresistance measurements on polycrystalline CePd2P2, and Tran et al. Tran et al. (2014) reported AC susceptibility and DC magnetization, also for polycrystalline CePd2P2. These papers also confirmed ferromagnetic order in CePd2P2 below about . Neutron diffraction and DC magnetization measurements were performed by Ikeda et al. Ikeda et al. (2015) on a polycrystalline sample, including a magnetically aligned polycrystalline sample, which revealed the magnetic anisotropy of CePd2P2, with the -axis as the magnetic easy axis. This is confirmed by single crystal work Drachuck et al. (2016). The compound CeNi2P2 shares the ThCr2Si2 crystal structure with CePd2P2, but exhibits a non-magnetic ground state Nambudripad et al. (1986), suggesting Pd-to-Ni substitution can drive a transition from magnetic to non-magnetic. Lai et al. Lai et al. (2018) examined this possibility by substituting Ni to replace Pd, revealing a possible ferromagnetic quantum critical point in the temperature-concentration phase diagram. Here, according to Belitz-Kirkpatrick-Vojta (BKV) theory Belitz et al. (1997, 1999), the quenched disorder inherent to the chemical substitution allows the transition to be driven continuously to zero.
Because Ni is isoelectronic with Pd and smaller in size, one can think of Pd Ni substitution as inducing chemical pressure. Lai et al. Lai et al. (2018) compared this chemical pressure effect to the effects of applied mechanical pressure on CePd2P2 up to about 2 GPa. A small suppression of the Curie temperature with applied pressure was observed indicating a critical pressure for full suppression of the transition well beyond the maximum pressure of that experiment. Therefore, we undertook to explore the phase diagram of this material at substantially higher pressures. In particular, we wished to look for the point at which the magnetic transition became first order, as well as any signs of a modulated magnetic phase or metamagnetic wings. We find that magnetic order appears to be destroyed near 12 GPa. We find no evidence of a modulated magnetic phase or metamagnetic wings in resistivity measurements between 12 and 20 GPa in fields up to 9 T.
II Methods
Single crystals of CePd2P2 were grown in a molten metal flux according to the process outlined in Ref. Lai et al. (2018). The single crystals had a tendency to break into flat platelets perpendicular to the -axis and were therefore easily aligned with the -axis parallel to applied field.
Alternating current (AC) susceptibility measurements were performed in a Quantum Design PPMS using an Almax-EasyLab Chicago Diamond Anvil Cell (ChicagoDAC). The magnetic coil system and measurement electronics have been described elsewhere VanGennep et al. (2017). In AC susceptibility measurements, diamonds with culets were used, and Berylco-25 gaskets were pre-indented to from a starting thickness of . The gasket hole diameter was approximately , and these gaskets were sealed in a quartz tube under argon atmosphere and hardened in a furnace at . A solution of 50% n-pentane to 50% isoamyl alcohol was used as a pressure transmitting medium Klotz et al. (2009).
When analyzing the AC susceptibility data, a background subtraction was performed for each run, since the signal from the sample is much smaller than the background. Background subtraction was performed by subtracting one run from another, always choosing runs which had distant values of . The value of was defined as the inflection point of the curve, as determined from second derivative data.
For the resistivity measurements, samples with typical dimensions of were cut from larger crystals and loaded into either an Almax-EasyLab OmniDAC or the ChicagoDAC mentioned above. While the ChicagoDAC was used in a Quantum Design PPMS, the OmniDAC measurements were carried out in a custom-made continuous flow cryostat built by Oxford Instruments. One of the diamonds used was a so-called designer diamond anvil, which is composed of eight symmetrically arranged tungsten microprobes that are encapsulated in high purity homoepitaxial diamond Weir et al. (2000). The designer diamond anvil had a culet diameter of , while the opposing anvil had a culet diameter of . Gaskets were made of 316 SS and were preindented to an initial thickness of . Quasihydrostatic, soft, solid steatite was used as a pressure medium. Resistance was measured in the crystalline -plane using the Van der Pauw geometry with currents of . Electrical resistivity measurements performed in the OmniDAC are referred to as “run A,” and ChicagoDAC resistivity measurements are designated “run B.” In both the ChicagoDAC and OmniDAC, pressure was determined in-situ via ruby flourescence Chijioke et al. (2005) so that the reported pressures were measured at the corresponding temperatures.
X-ray diffraction measurements were carried out in beamline 16 ID-B of the Advanced Photon Source at Argonne National Lab using a beam with dimensions of approximately and wavelength . Samples were powdered in a mortar and pestle before being loaded into a Symmetric Diamond Anvil Cell (Symmetric DAC) alongside a ruby fragment and small piece of Pt foil for pressure determination. The Pt equation of state of Holmes et al. Holmes et al. (1989) was used for pressure calibration. The diamonds had a culet diameter of . The gasket was made from 316 SS and was preindented to an initial thickness of about . The gasket hole diameter was approximately , and was filled with a pressure medium of 1:1 n-pentane isoamyl alcohol before the sample, ruby and Pt were loaded. The cell was pressurized in situ via a computer-controlled pressure membrane.
III Experimental Results
Figure 1 shows a plot of the real part of the AC magnetic susceptibility of CePd2P2 vs temperature in the vicinity of the transition. Increasing pressure causes the transition to be suppressed to lower temperatures - from at , to at . As the transition is suppressed, the magnitude of the anomaly at is also reduced. At the anomaly is still barely visible, but by it is no longer detectable. The arrows in the figure indicate the criterion used to determine and are based on the inflection point, as determined from second derivative data.
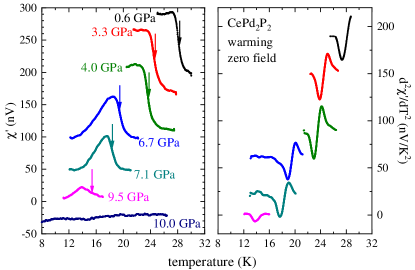
The decreasing size of the susceptibility anomaly is consistent with the Rhodes-Wolfarth picture Rhodes et al. (1963) of itinerant ferromagnetism, which suggests that a decrease in will correspond to a decrease in the ordered moment. There does appear to be a subtle change in the shape of the anomaly in vs . However, the necessity of background subtraction limits the temperature range of the data that can be compared between the high and low pressure data, which makes it difficult to disentangle changes in the background from changes in the shape of the anomaly. While it is possible that the nature of the magnetic order changes with pressure, the resistivity measurements (presented below) also do not allow us to make a definite conclusion regarding the possibility of a change in the nature of the magnetic order.
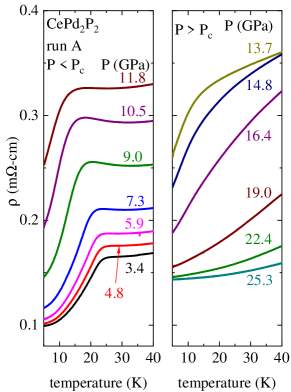
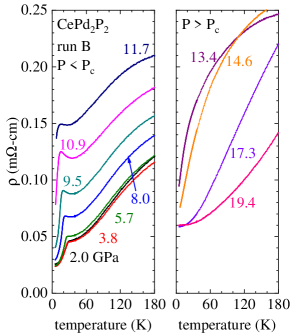
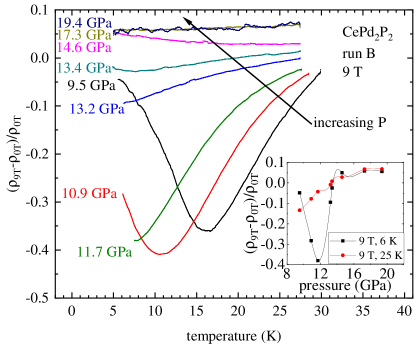
Figures 2 and 3 present electrical resistivity versus temperature data for two different experimental runs, referred to as run A and run B. In run A, resistivity measurements were performed between and , while run B collected data between and , demonstrating resistivity behaviour to higher temperature. The left panels show resistivity curves below , where the transition is easily discernible, and decreases in temperature as pressure increases. The plots on the right show data above , where can no longer be unambiguously determined. In the right-most plot of Fig. 2, the transition is initially still visible (), but the broadening prevents accurate and reliable determination of . As pressure increases further, the transition disappears entirely and the curvature changes from negative to positive. We attempted to fit the low temperature electrical resistivity with a power law of the form , but found that the data could not be described in this way over a significant range of temperatures.
The low temperature resistivity versus pressure curve shows a peak near , as demonstrated by the data in Fig. 4. Data points in the loading curves are synthesized from resistivity versus temperature sweeps at each pressure, while the unloading curve was taken while continuously sweeping pressure at constant temperature. The location of the peak displays a hysteresis of about between loading and unloading, and shifts to higher pressures at higher temperatures (at the peak occurs near ). The peak appears to coincide roughly with the pressure where the magnetic transition becomes undetectable in and .
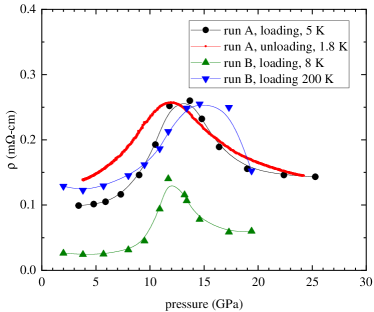
Figure 5 presents the magnetoresistance behavior of CePd2P2 as a function of temperature. Below , as temperature decreases, magnetoresistance becomes large and negative near . The temperature at which the magnetoresistance obtains the largest magnitude decreases with increasing pressure, which is consistent with a suppression of the transition to lower temperatures. As pressure increases above , the temperature dependence of the magnetoresistance becomes increasingly flat. The minimum follows similar behavior to , disappearing near the critical pressure of . This behavior, in which the magnetoresistance extremum follows the transition temperature, is explained by Yamada and Takada Yamada and Takada (1972) as resulting from fluctuations of localized spins. The inset of Figure 5 presents the magnetoresistance as a function of pressure at for temperatures of and . The magnetoresistance reaches a minimum at , close to the value of critical pressure as determined by zero field resistivity. At higher pressures, the magnetoresistance then rises to be nearly identical to the curve. The magnetoresistance starts negative and asymptotically approaches zero as pressure increases. This behavior is consistent with a supression of the magnetic transition near .
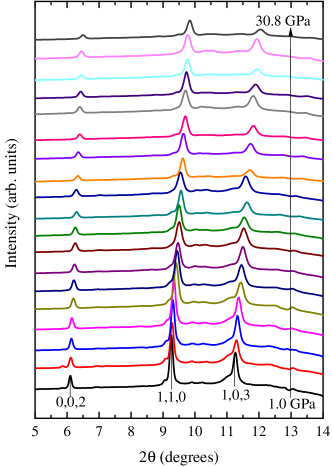
An important question is whether the disappearance of the magnetic transition in and as well as the peak in resistivity as a function of pressure near occur within the ambient pressure crystal stucture, as a result of the physics predicted by BKV theory Belitz et al. (1999), or are instead merely related to a pressure-induced structural transition. In order to test this, the crystal structure of CePd2P2 was examined via angle-dispersive x-ray diffraction. X-ray data from an area detector were processed into usable XRD patterns using Dioptas Prescher and Prakapenka (2015) and then analyzed via GSAS-II Toby and Dreele (2013). Figure 6 shows a portion of the results from x-ray diffraction measurements between and . The data show no evidence for any change in the crystal structure to the highest pressures measured.
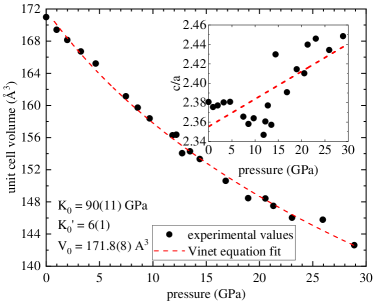
Data were fit to the ThCr2Si2 structure using LeBail analysis. Figure 7, presents the unit cell volume vs pressure for \chCePd2P2, as determined from these fits. The Vinet equation Vinet et al. (1987) was fit to the equation of state data to obtain a value for the bulk modulus and its derivative with respect to pressure. Based on the extracted lattice constants a plot of the ratio is shown in the inset. The ratio increases with increasing pressure, demonstrating that CePd2P2 exhibits a substantial degree of three dimensional bonding. In a “layered” compound, one would expect to decrease under pressure. The scatter in the ratio increases substantially above , likely due to the freezing of the pressure medium near this pressure. There does appear to be a minimum in the ratio near the critical pressure of , however it is unclear if this is a consequence of the destruction of the magnetic phase or merely a result of the non-hydrostatic pressure.
IV Discussion
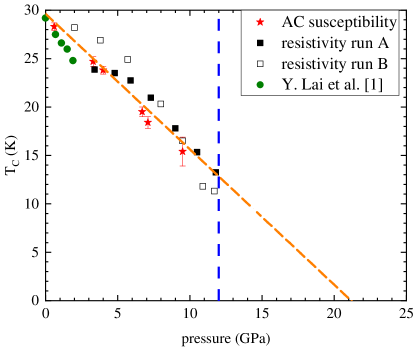
The CePd2P2 phase diagram displayed in Fig. 8 contains vs pressure data from Ref. Lai et al. (2018) (up to ) alongside the data described in this work. The decrease in is observed to be nearly linear with increasing pressure. The scatter in is likely due to the quasi-hydrostaticity of the pressure media at high pressure and the different media used in different measurements. The dashed orange line is a linear fit to all of our data shown in Fig. 8. The fit gives a slope of , a y-intercept of , and an x-intercept of . The vertical dashed blue line in Fig. 8 indicates the approximate pressure at which the transition disappears in and and where a peak in the resistivity versus pressure plot was observed. The general shape of the phase diagram, with a transition that abruptly drops to zero temperature as an order parameter increases (in this case, pressure), is in line with the predictions of BKV theory Belitz et al. (1999). However, a central prediction of BKV theory is that this transition is generically of first order, and therefore the second order transition at higher temperature should become first order beyond the tricritical point. Our data is unable to distinguish whether the transition becomes first order before vanishing.
From the X-ray diffraction data, we can also determine the Ce-Ce nearest neighbor distance; at ambient pressure it sits at approximately , while at the highest measured pressure of , it is compressed to . This is above the cerium Hill limit of . Moore and van der Laan (2009); Miner (1971) On its own, this would suggest that CePd2P2 is a local moment compound, but this is contradicted by the shape of the phase diagram, which, as noted above, fits the predictions of BKV theory, suggesting that CePd2P2 is an itinerant electron compound at high pressure. The reduction of the signal in the AC susceptibility data at high pressure also suggests that CePd2P2 may be near to an itinerant-to-local transition Rhodes et al. (1963).
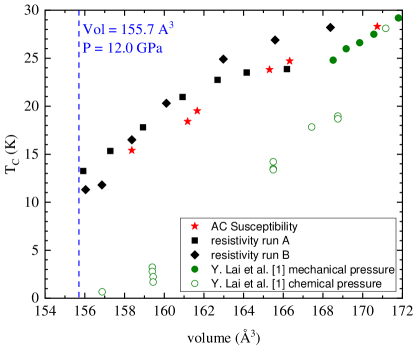
Figure 9 compares the effects on physical pressure on \chCePd2P2 and chemical pressure in \chCe(Pd,Ni)2P2 by plotting the ordering temperature vs unit cell volume. The change in volume from mechanical compression is derived from LeBail analysis of x-ray diffraction data shown in Fig. 6. This is compared to unit cell volume data for different levels of Ni substitution reported by Y. Lai et al. Lai et al. (2018). In both cases, the critical temperature varies roughly linearly with volume, though chemical compression and mechanical compression suppress the transition at different rates. As the volume decreases, there is a large difference in between applied chemical and mechanical pressure. However, remarkably, in both cases, the transition becomes undetectable at roughly the same critical volume. It thus appears that \chCe(Ni,Pd)2P2 and \chCePd2P2 may offer an ideal pair of systems to compare ferromagnetic quantum phase transitions driven by compression with or without disorder.
There are a number of compounds to which one can compare CePd2P2. CeTiGe3 is a ferromagnet at ambient pressure, but, as pressure increases, the ferromagnetic transition is suppressed until , at which point it becomes (possibly) antiferromagnetic Kaluarachchi et al. (2018). LaCrGe3 provides yet another example of the possible phase diagram that can result from suppressing a ferromagnetic transition. LaCrGe3 appears to simultaneously exhibit both metamagnetic wings accompanying a shift to a first order transition, as predicted by BKV Belitz et al. (1999), as well as a modulated magnetic phase Kaluarachchi et al. (2017); Taufour et al. (2018). Like these compounds, CePd2P2 has a ferromagnetic transition suppressed by pressure until it reaches a critical pressure at which the transition abruptly vanishes. However, there are no signs of other features such as metamagnetic wings or other magnetic phases in the CePd2P2 phase diagram. On the other hand, we can not rule out the possibility of a different type of magnetic order in the region between about , where the anomaly in disappears, and , where the resistivity peaks and the anomaly disappears in .
V Conclusion
CePd2P2 is a ferromagnet with at ambient pressure. This transition temperature decreases roughly linearly with pressure at a rate of . The second-order transition is expected to shift to first order and then rapidly vanish, as observed in other clean ferromagnets; the vanishing of appears to occur in CePd2P2 near a critical pressure of . This is evidenced by a gradual suppression and then disappearance of the anomaly at in magnetic susceptibility and then a broadening and disappearance of the anomaly in the electrical resistivity. In addition, the apparent disappearance of magnetic order is accompanied by a peak in resistivity and in the magnitude of the magnetoresistance at the critical pressure. However, the shift to a first order transition could not be directly verified through the present measurements. High pressure x-ray diffraction shows that these features are not connected to a structural transition and that the ambient pressure crystal structure is maintained to at least . At pressure above the critical pressure we find no clear evidence for metamagnetic wings (as observed in e.g., UGe2 Taufour et al. (2010); Kotegawa et al. (2011), ZrZn2 Uhlarz et al. (2004); Kabeya et al. (2012), and LaCrGe3 Kaluarachchi et al. (2017); Taufour et al. (2018)), or alternative magnetic structures (as observed in e.g., CeRuPO Kotegawa et al. (2013); Lengyel et al. (2015), CeTiGe3 Kaluarachchi et al. (2018) and LaCrGe3 Kaluarachchi et al. (2017); Taufour et al. (2018)). High pressure neutron scattering measurements could help to definitively determine the microscopic nature of the magnetic order in the vicinity of the critical pressure and whether magnetic order persists in the region beyond the critical pressure.
VI Acknowledgments
This work was supported by National Science Foundation (NSF) CAREER award DMR-1453752. High pressure technique development was partially supported by a National High Magnetic Field Laboratory User Collaboration Grant. The National High Magnetic Field Laboratory is supported by the NSF via Cooperative agreement No. DMR-1157490, the State of Florida, and the U.S. Department of Energy. Designer diamond anvils were supported by DOE-NNSA Grant No. DE-NA-0002928 and under the auspices of the U.S. Department of Energy by Lawrence Livermore National Laboratory under Contract DE-AC52-07NA27344. Portions of this work were performed at HPCAT (Sector 16), Advanced Photon Source (APS), Argonne National Laboratory. HPCAT operations are supported by DOE-NNSA’s Office of Experimental Sciences. The Advanced Photon Source is a U.S. Department of Energy (DOE) Office of Science User Facility operated for the DOE Office of Science by Argonne National Laboratory under Contract No. DE-AC02-06CH11357. TAE, DV, and JJH thank Yue Meng for her aid in measurements performed at Argonne National Laboratory. Dioptas and GSAS-II programs were used for analysis of x-ray diffraction data. RB and YL acknowledge support from Department of Energy through the Center for Actinide Science and Technology (an EFRC funded under Award DE-SC-0016568). Designer diamond anvils were supported by DOE-NNSA Grant No. DE-NA-0003916.
References
- Lai et al. (2018) Y. Lai, S. E. Bone, S. Minasian, M. G. Ferrier, J. Lezama-Pacheco, V. Mocko, A. S. Ditter, S. A. Kozimor, G. T. Seidler, W. L. Nelson, Y.-C. Chiu, K. Huang, W. Potter, D. Graf, T. E. Albrecht-Schmitt, and R. E. Baumbach, Physical Review B 97 (2018), 10.1103/physrevb.97.224406.
- Pfleiderer et al. (1997) C. Pfleiderer, G. J. McMullan, S. R. Julian, and G. G. Lonzarich, Physical Review B 55, 8330 (1997).
- Brando et al. (2016) M. Brando, D. Belitz, F. Grosche, and T. Kirkpatrick, Reviews of Modern Physics 88, 025006 (2016).
- Kirkpatrick and Belitz (2012) T. R. Kirkpatrick and D. Belitz, Physical Review B 85, 134451 (2012).
- Belitz et al. (1999) D. Belitz, T. R. Kirkpatrick, and T. Vojta, Physical Review Letters 82, 4707 (1999).
- Belitz et al. (2005) D. Belitz, T. R. Kirkpatrick, and J. Rollbühler, Physical Review Letters 94, 247205 (2005).
- Kirkpatrick and Belitz (2015) T. R. Kirkpatrick and D. Belitz, Physical Review B 91, 214407 (2015).
- Janoschek et al. (2013) M. Janoschek, M. Garst, A. Bauer, P. Krautscheid, R. Georgii, P. Böni, and C. Pfleiderer, Physical Review B 87, 134407 (2013).
- Kaluarachchi et al. (2018) U. S. Kaluarachchi, V. Taufour, S. L. Bud’ko, and P. C. Canfield, Physical Review B 97 (2018), 10.1103/physrevb.97.045139.
- Uhlarz et al. (2004) M. Uhlarz, C. Pfleiderer, and S. M. Hayden, Physical Review Letters 93, 256404 (2004).
- Kimura et al. (2004) N. Kimura, M. Endo, T. Isshiki, S. Minagawa, A. Ochiai, H. Aoki, T. Terashima, S. Uji, T. Matsumoto, and G. G. Lonzarich, Physical Review Letters 92, 197002 (2004).
- Belitz and Kirkpatrick (2017) D. Belitz and T. Kirkpatrick, Physical Review Letters 119, 267202 (2017).
- Kaluarachchi et al. (2017) U. S. Kaluarachchi, S. L. Bud’ko, P. C. Canfield, and V. Taufour, Nature Communications 8 (2017), 10.1038/s41467-017-00699-x.
- Taufour et al. (2018) V. Taufour, U. S. Kaluarachchi, S. L. Bud’ko, and P. C. Canfield, Physica B: Condensed Matter 536, 483 (2018).
- Jeitschko and Hofmann (1983) W. Jeitschko and W. K. Hofmann, Journal of the Less Common Metals 95, 317 (1983).
- Shang et al. (2014) T. Shang, Y. H. Chen, W. B. Jiang, Y. Chen, L. Jiao, J. L. Zhang, Z. F. Weng, X. Lu, and H. Q. Yuan, Journal of Physics: Condensed Matter 26, 045601 (2014).
- Tran and Bukowski (2014) V. H. Tran and Z. Bukowski, Journal of Physics: Condensed Matter 26, 255602 (2014).
- Tran et al. (2014) V. Tran, Z. Bukowski, L. Tran, and A. Zaleski, Acta Physica Polonica A 126, 334 (2014).
- Ikeda et al. (2015) Y. Ikeda, H. Yoshizawa, S. Konishi, S. Araki, T. C. Kobayashi, T. Yokoo, and S. Ito, Journal of Physics: Conference Series 592, 012013 (2015).
- Drachuck et al. (2016) G. Drachuck, A. E. Böhmer, S. L. Bud’ko, and P. C. Canfield, Journal of Magnetism and Magnetic Materials 417, 420 (2016).
- Nambudripad et al. (1986) N. Nambudripad, E. V. Sampathkumaran, R. Vijayaraghavan, I. Stang, and K. Lüders, Solid State Communications 60, 625 (1986).
- Belitz et al. (1997) D. Belitz, T. R. Kirkpatrick, and T. Vojta, Physical Review B 55, 9452 (1997).
- VanGennep et al. (2017) D. VanGennep, A. Linscheid, D. E. Jackson, S. T. Weir, Y. K. Vohra, H. Berger, G. R. Stewart, R. G. Hennig, P. J. Hirschfeld, and J. J. Hamlin, Journal of Physics: Condensed Matter 29, 09LT02 (2017).
- Klotz et al. (2009) S. Klotz, J.-C. Chervin, P. Munsch, and G. L. Marchand, Journal of Physics D: Applied Physics 42, 075413 (2009), publisher: IOP Publishing.
- Weir et al. (2000) S. T. Weir, J. Akella, C. Aracne-Ruddle, Y. K. Vohra, and S. A. Catledge, Applied Physics Letters 77, 3400 (2000), publisher: American Institute of Physics.
- Chijioke et al. (2005) A. D. Chijioke, W. J. Nellis, A. Soldatov, and I. F. Silvera, Journal of Applied Physics 98, 114905 (2005).
- Holmes et al. (1989) N. C. Holmes, J. A. Moriarty, G. R. Gathers, and W. J. Nellis, Journal of Applied Physics 66, 2962 (1989).
- Rhodes et al. (1963) P. Rhodes, E. P. Wohlfarth, and H. Jones, Proceedings of the Royal Society of London. Series A. Mathematical and Physical Sciences 273, 247 (1963).
- Yamada and Takada (1972) H. Yamada and S. Takada, Progress of Theoretical Physics 48, 1828 (1972).
- Prescher and Prakapenka (2015) C. Prescher and V. B. Prakapenka, High Pressure Research 35, 223 (2015).
- Toby and Dreele (2013) B. H. Toby and R. B. V. Dreele, Journal of Applied Crystallography 46, 544 (2013).
- Vinet et al. (1987) P. Vinet, J. R. Smith, J. Ferrante, and J. H. Rose, Physical Review B 35, 1945 (1987).
- Moore and van der Laan (2009) K. T. Moore and G. van der Laan, Reviews of Modern Physics 81, 235 (2009).
- Miner (1971) W. N. Miner, PLUTONIUM 1970 AND OTHER ACTINIDES. NUCLEAR METALLURGY, VOLUME 17. Proceedings of the 4th International Conference, Sante Fe, New Mexico, October 5–9, 1970., Tech. Rep. CONF-701001-(Pt.1); EUR-4633 (Los Alamos Scientific Lab., N. Mex., 1971).
- Taufour et al. (2010) V. Taufour, D. Aoki, G. Knebel, and J. Flouquet, Physical Review Letters 105, 217201 (2010).
- Kotegawa et al. (2011) H. Kotegawa, V. Taufour, D. Aoki, G. Knebel, and J. Flouquet, Journal of the Physical Society of Japan 80, 083703 (2011).
- Kabeya et al. (2012) N. Kabeya, H. Maekawa, K. Deguchi, N. Kimura, H. Aoki, and N. K. Sato, Journal of the Physical Society of Japan 81, 073706 (2012).
- Kotegawa et al. (2013) H. Kotegawa, T. Toyama, S. Kitagawa, H. Tou, R. Yamauchi, E. Matsuoka, and H. Sugawara, Journal of the Physical Society of Japan 82, 123711 (2013).
- Lengyel et al. (2015) E. Lengyel, M. E. Macovei, A. Jesche, C. Krellner, C. Geibel, and M. Nicklas, Physical Review B 91, 035130 (2015).