Ab initio investigation of lattice distortions in response to van der Waals interactions in FeSe
Abstract
The electronic structure in unconventional superconductors holds a key to understand the momentum-dependent pairing interactions and the resulting superconducting gap function. In superconducting Fe-based chalcogenides, there have been controversial results regarding the importance of the dependence of the electronic dispersion, the gap structure and the pairing mechanisms of iron-based superconductivity. Here, we present a detailed investigation of the van der Waals interaction in FeSe and its interplay with magnetic disorder and real space structural properties. Using density functional theory we show that they need to be taken into account upon investigation of the 3-dimensional effects, including non-trivial topology, of FeSe1-xTex and FeSe1-xSx systems. In addition, the impact of paramagnetic (PM) disorder is considered within the spin-space average approach. Our calculations show that the PM relaxed structure supports the picture of different competing ordered magnetic states in the nematic regime, yielding magnetic frustration.
I Introduction
Among the several types of Fe-based superconductors (FeSC) discovered so far, FeSe has the simplest crystal structure consisting only of superconducting layers. This system turns out to be unique not only due to its structural properties but also due to the lack of any magnetic transition at ambient pressure Böhmer and Kreisel (2018). The tetragonal to orthorhombic structural transition at K McQueen et al. (2009a); Margadonna et al. (2008), where the orthorhombic structure is called nematic phase analogue to liquid crystals Fernandes and Schmalian (2012), occurs in FeSe without the presence of any ordered magnetic state McQueen et al. (2009a); Bendele et al. (2010). In addition, the interplay of physical pressure and chemical substitution causes dramatic changes in the phase diagram Medvedev et al. (2009); Bendele et al. (2012); Sun et al. (2016); Kothapalli et al. (2016). This underlines the delicate interplay between real space crystal structure and the electronic properties including magnetism in this compound.
Although electronic correlations are relatively strong in Fe-based superconductors, the application of density functional theory (DFT) has proven to reliably provide insights into their physical properties. The band structure calculations correctly predict the main electronic properties for most of the Fe-based superconductors including their Fermi surface topology, structural and magnetic transitions and the possible strength of electron-phonon interactions Guterding et al. (2017a). In combination with a projection onto Wannier functions, based on symmetry considerations, it further yields low-energy models that are then used to describe the broken symmetries in these systems Eschrig and Koepernik (2009); Lochner et al. (2017).
In most of the Fe-based superconductors the magnetic ground state is in DFT and experiment given by the -type anti-ferromagnetic order (often dubbed as stripe-type anti-ferromagnetic (sAFM) order) Johnston (2010); Hosono et al. (2018); Dai (2015). For FeSe DFT also predicts the sAFM state to be the ground state Li et al. (2009). However, in experiment this magnetic phase appears only at finite pressure, while at ambient pressure the so-called nematic (structural) transition without any long range magnetic order is observed Khasanov et al. (2008); Hsu et al. (2008); Margadonna et al. (2008); McQueen et al. (2009a). Several ab initio calculations explained the absence of the long-range magnetic order by the presence of competing magnetic phases with different ordering vectors Liu et al. (2016). The resulting magnetic frustration prevents the formation of the long-range magnetic order, but allows the nematic transition, which is breaking symmetry Glasbrenner et al. (2015); Christensen et al. (2019); Ruiz et al. (2019); Busemeyer et al. (2016). This mechanism is supported by recent experiments indicating two different types of magnetic fluctuations in FeSe Baum et al. (2019).
Especially the complex pressure dependent phase diagram of FeSe is highly debated Böhmer et al. (2019). Moreover, a clear impact of the nematic transition on the magnetism in the material indicates a strong coupling between the structure and spin fluctuations Wang et al. (2016a, b). To get a deeper understanding of the structural properties in the absence of magnetic order at low temperatures, as it is seen for the nematic state, we avoid long-range magnetism by employing a paramagnetic (PM) approach based on the spin space averaging technique Walle and Ceder (2002).
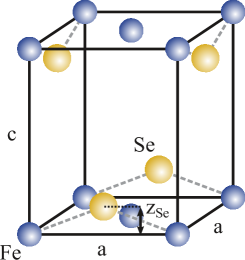
As we know from previous works, superconductivity in FeSe is quite sensitive to structural changes, in particular to the height of the Se-atoms above the iron layer, Guterding et al. (2017b) (see Fig. 1). More generally, the three dimensional superconductivity and the physics explaining the deviation of calculated lattice parameters from experimental results are of high interest. In particular there are indications that dynamic dipole-dipole (van der Waals (vdW)) interactions might be important, as they drive interlayer attraction Guterding et al. (2017b); Ricci and Profeta (2013). The nature of these interactions can only be resolved, if different models for the vdW interactions are compared. Those implementations allow us to investigate the nature of the interactions between atom species in detail Grimme (2006); Tkatchenko and Scheffler (2009). Moreover, the interplay of vdW and PM allows us to access charge based interactions without breaking the translational symmetry.
The paper is organized as follows. In section II we describe the PM and vdW extensions to standard DFT calculations. In section III the implementation of paramagnetic DFT is discussed. In section IV we compare two different vdW-correction schemes in application to FeSe for the sAFM and the PM state. Finally, we summarize our results in Section V.
II Methods
II.1 Paramagnetism
In contrast to experiment, standard DFT predicts the sAFM state to be stable in FeSe and is commonly used although other magnetic stats are close in energy. Due to this degeneracy the competition of several magnetic configurations may yield frustration and prevent the stability of long-rang magnetic order in FeSe. It is well known that the presence of magnetic order and disorder has a strong effect on the structural properties of Fe-based materials Bleskov et al. (2016). This calls for a systematic study within the PM state to investigate the structural behavior of the system in the nematic phase without long-range magnetic order and with higher precision. In particular, we construct different special quasi-random structures (SQS’s) to maximize the magnetic disorder in a finite simulation box. This approach is based on geometrical considerations and determines for a given real space structure the best possible spin configuration to mimic the PM state. For FeSe we distinguish three species (Se-atoms, Fe-up-atoms, Fe-down-atoms), where the SQS is performed for the Fe-atoms. Hereby, we used the ATAT package Walle and Ceder (2002) to create three different setups of the magnetic moments. The difference of those SQS’s is the real space cutoff radii for the correlations considered in the construction algorithm. To make a systematically treatment of the magnetism possible, the magnetic moments of each Fe-atom has the same magnitude.
Due to convergence issues with automatized relaxation algorithms for the ionic positions and the magnetic moments, the height of Se-atoms with respect to the iron layer (), the volume and ratio were relaxed sequentially. Moreover constrained magnetic moments are used, where both direction and magnitude are constrained, to avoid non-magnetic (NM) final structures.
To calculate the local magnetic moments an integral over a sphere , which depends on a radius given by the chosen structure and the volume of the unit cell (UC) in particular, is taken. This system specific radius is chosen in such a way, that 98% of the UC is used for evaluating the magnetic moment, what also leads to an overlap of some of those spheres within the UC.
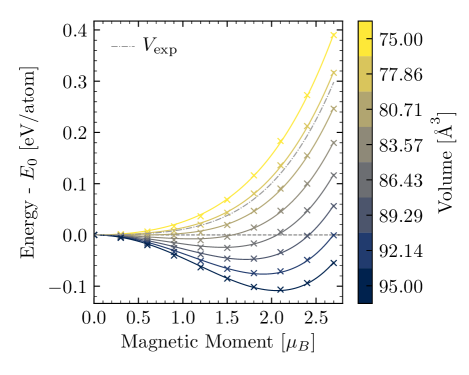
To get the magnetic moment that is energetically preferred by the system, we fit the total energy to a polynomial function
| (1) |
which is the simplest form of the Landau free energy expansion.
II.2 Selected van der Waals implementations
FeSe is a compound with strongly different polarizabilities, thus the distribution of Fe and Se atoms yields different interlayer and intralayer vdW contributions. Therefore we have carefully investigated the interdependence of vdW interactions and modifications of all lattice parameters. In order to resolve this interdependence, we have chosen two different vdW approaches. On the one hand, the DFT-D2 approach of Grimme Grimme (2006), referring to dispersion correction version 2, is a conceptually more simple approach. On the other hand, we employ DFT-TS of Tkatchenko and Scheffler Tkatchenko and Scheffler (2009), which includes the desired geometrical weighting based on the used compound. Those represent different levels of complexity. For FeSe the DFT-D2 method has already been used, a detailed comparison to the DFT-TS method, however, is so far missing Ricci and Profeta (2013). While for details about the individual approaches we refer to Refs. Grimme (2006); Tkatchenko and Scheffler (2009), we focus the upcoming discussion on the differences of the DFT-D2 method and the DFT-TS method.
In general the vdW interactions are introduced by adding a semi-phenomenological correction to the standard DFT energy given by
| (2) |
where is a global scaling factor depending on the chosen exchange-correlation functional and usually obtained by least-square fits for the total energy deviations of different test samples (see Grimme (2006) for details). describes the total number of atoms in the unit cell, and denote different atoms, where refers to the distance between these atoms. is the corresponding parameter of the polarizability and is a global damping function.
The main difference between those two approaches is the choice of the parameters. For DFT-D2 least square fits of experimentally found atomic parameters given by the dipole oscillation strength distribution method (DOSD) are taken to generate the parameters for the calculations Wu and Yang (2002). For binary contributions the geometric mean is taken, Grimme (2006). This by construction ignores the specific atomic configuration in a given system and is less suited for bulk materials and alloys. For example, in the case of FeSe the intralayer Se-Se interaction is calculated without including the underlying Fe-layer.
For the DFT-TS method the parameters are derived from the parameters for one free standing atom of the same species given by
| (3) |
where the index "at" marks properties of the free standing atom. All quantities without the index refer to the effective parameters of the full system. The are taken from Ref. Chu and Dalgarno (2004) and is an effective frequency (introduced in the London formula Tang (1969)). Here the effective volume dresses the parameter by including the local environment in the form of , where the Hirschfeld atomic partitioning weights Hirschfeld (1977) are used to obtain this ratio. is a scaling factor for the polarizability . The ratio is given by
| (4) |
with
| (5) |
where the sum over is the so called promolecule electronic density. As a combination rule for parameters DFT-TS uses the expression
| (6) |
III Paramagnetic Calculations
The calculations are performed using the Vienna Ab-Initio Simulation Package (VASP) Kresse and Hafner (1993); Kresse and Furthmüller (1996a, b) with the projector augmented wave method Blöchl (1994) and Perdew, Burke, and Ernzerhof Perdew et al. (1996) type exchange-correlation functionals. Calculations for the UC use a Monkhorst-Pack k-points mesh Monkhorst and Pack (1976). The PM calculations are performed in a supercell with a k-point mesh accordingly. The energy cut-off is set to 450 eV justified by a convergence of the bulk modulus to an accuracy of 1%. For the electronic smearing we chose first order Methfessel-Paxton smearing Methfessel and Paxton (1989) with eV. Setting up all calculations, postprocessing and analyzing is done by using the integrated development environment pyiron Janssen et al. (2019).
To investigate the disordered magnetic phase, we constrain the magnetic moments of the Fe-atoms as described in the previous section. To compare the influence of disorder to the structural properties, we also calculate the equilibrium state structural parameters for the sAFM state for comparison. As explained later in the section, the cell shape is in the PM calculations not fully converged. Since the differences in structure and energy for each calculation step are small, we took a snapshot after 9 complete minimization steps for the following analysis. The exemplary results for one used SQS spin setup are illustrated in Fig. 2, where the fits are obtained by Eq. (1). Here the transition from the NM state at Å3 to the PM state at Å3 can be clearly seen. Only by constraining the magnetic moments, the smooth phase transition can be investigated. Extracting the minimal energy values and corresponding magnetic moments, we calculate the equilibrium volume for each SQS.
Since several SQS’s are required to get sufficient statistics for the PM average, the energy-volumes curves for the mean of three SQS’s are shown for one exemplary relaxations step in Fig. 3 (b). Since there is almost no scatter between the different structures, the setup for the SQS (i. e., the size of the supercell) is sufficient to describe the PM ground state.
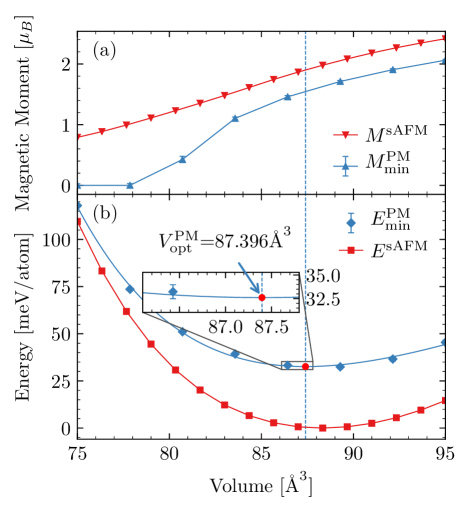
Moreover, the obtained fit to the Rose-Vinet equation of states Vinet et al. (1987) is in good agreement with the given data, confirming a smooth transition from the PM ( Å3) to the NM ( Å3) ground state. We learn from Fig. 3 (a) that the equilibrium state has a finite magnetic moment, while the NM state does not represent an equilibrium state. The larger error bar for the intermediate volumes ( Å3) between the PM and NM state reflects the competition of these phases, when both are close in energy. Those errors, however, do not show a large influence on the Rose-Vinet fit, which means PM calculations are still sufficiently reliable even in the regions of comparably small magnetic moments. Also the mean magnetic moment of the Fe-atoms at the equilibrium lattice constant () is comparable for PM and sAFM (). We see a small variation of the magnitude of the magnetic moments for the Fe-atoms in the PM state, what is in the tolerance of the used approach. This might be related to several magnetic sublattices with different absolute magnetic moments, what was discussed for the 11 compounds previously Gastiasoro and Andersen (2015). As the variation is small, we consider this effect to be less important for the structural parameter relaxation.
It should also be noticed, that the total energy per atom at the equilibrium for the PM state is about meV larger than that one for the sAFM state. It indicates that the PM state is not predicted as the ground state in the present DFT approach, but would only become stabilized by magnetic entropy. However, the PM calculations include constrained magnetic moments, thus the total energy includes a penalty which is also in the order of meV. Since a competition of several short range magnetic orders is also considered to drive the PM state in the nematic region Liu et al. (2016), it might also explain the remaining difference as ordered states are usually lower in energy.
Although the equilibrium volume changes only by less than 1% for the PM state compared to the that of the sAFM one later discussed for Fig. 5, the structural parameters show a more critical behavior due to magnetically driven changes. In Fig. 5 it can be seen that the lattice parameter in -direction is significantly reduced while the lattice parameter increases, what is in contradiction to the experimental results. This is caused by a lack of interlayer interactions also found by a previous work Ricci and Profeta (2013). The lack of interlayer attraction is presumably caused by missing vdW interactions in the DFT calculations for FeSe.
As an interim summary we see that the magnetic moment gives a smooth transition from the NM to the PM state, without any convergence issues for the magnetic moments. By introducing the PM state, the interlayer interactions are reduced compared to the sAFM state and not able to glue both FeSe-layers together, resulting in a quasi-free behavior of those layers. It also explains that the cell shape in our calculations never converges. We observe both layers drifting apart for each minimization step with no significant change in total energy, caused by missing interlayer attraction. This indicates that magnetic interactions are not able to explain the interlayer coupling in this compound for a disordered magnetic state. Since the magnetic moment of the Fe-atoms in the PM state is comparable to that of the sAFM calculations, the covalent bonds are considered to not explain the interlayer attraction, however, a minimum in the total energy is observed for the sAFM state.
IV Van der Waals Calculations
To account for the interlayer attraction mentioned in the previous section, we include vdW forces for the PM state. In order to decouple it from magnetic disorder and due to numerical efficiency, however, we start the analysis of vdW corrections for the sAFM state. For that part we investigate the structural response for the DFT-D2 and the DFT-TS approach, where we analyse the performance of these methods by analyzing the response to volume and shape changes for FeSe.
IV.1 Total Energies
The sAFM ordered magnetic configuration is known to be the magnetic ground state of many other FeSC’s Böhmer and Kreisel (2018). Moreover, most of the possible stable anti-ferromagnetic structures are energetically close and their impact on the atomic structures is similar Liu et al. (2016). This makes our anti-ferromagnetic calculations representative for Fe-based chalcogenides.
In DFT and ab initio thermodynamics it is required to analyze the energetics of materials as a function of volume. Here, we particularly use this dependence to investigate the origin of the electronic interlayer and intralayer interactions. If both interactions are of the same origin and magnitude, the ratio between the lattice constants and is expected to change only weakly after a cell-shape relaxation. Moreover, should be proportional to changes in the volume.
For the volume dependent calculations we relax the cell shape as well as the ionic positions simultaneously. Although the full relaxation may lead in special cases to slightly different positions and energy values due to changing numbers of plane waves in the calculation, we do not find any significant changes of the structure compared to relaxing one quantity after another.
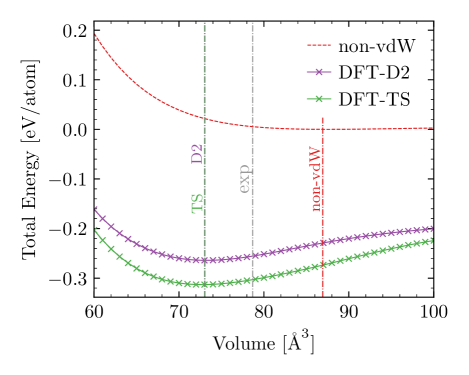
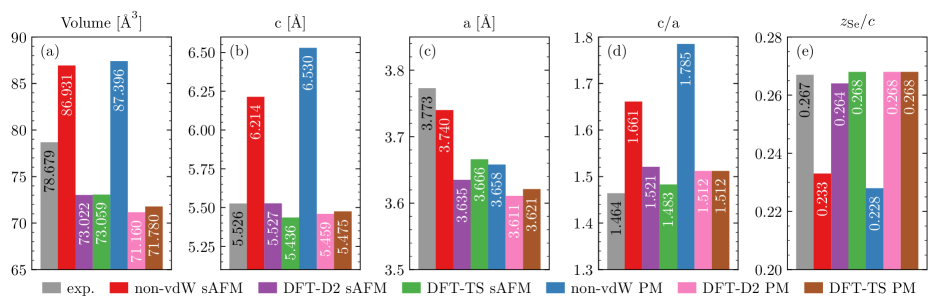
The total energy behavior in Fig. 4 shows a shallow minimum for non-vdW sAFM. The small binding energy indicates that the material could be unstable already at moderate temperatures. In contrast, both DFT-D2 and DFT-TS show a clear minimum at Å3 and Å3. The corresponding volumes are smaller than the non-vdW optimized volume at Å3 which is about Å3 larger than the experimentally measured volume McQueen et al. (2009b) (see Fig. 5 (a)). We will discuss below to what degree the nearly similar optimal volume for DFT-D2 and DFT-TS is coincidence or indicating the similarity of the implemented physical concepts. For non-vdW calculations the deviation of the lattice constant from the experimental value is only about 1%, yet the lattice parameter is too large. This indicates that the failure of the uncorrected DFT Hamiltonian primarily affects the interlayer interactions. As discussed below the smaller vdW corrected volume can be explained by an overestimation of intralayer interactions. The missing interlayer interaction for non-vdW calculations is also reflected in the bulk modulus GPa, which is approximately an order of magnitude smaller than the vdW values of GPa and GPa. The later are in the same region as the experimental values Millican et al. (2009); Margadonna et al. (2009).
A minor effect is the volume expansion due to temperature. Since the experimental values are measured at room temperature, the volume at K will be reduced. Indeed other works on 11-compounds show that the volume decreases with decreasing temperature Koz et al. (2013).
IV.2 Structural Properties
Comparing the lattice parameters for non-vdW, the DFT-D2 and DFT-TS corrections in Fig. 5 yield a significant improvement. Especially is in nearly perfect agreement with the experiment value for both vdW implementations (see Fig. 5 (e)). The origin is a reduction of the lattice parameter in -direction and the ratio (see Fig. 5 (b), (d)). This reduction is a direct consequence of the improved description of the interlayer attraction by taking the vdW interaction correctly into account.
However, the lattice parameters of the vdW corrected calculations in -direction are smaller than the experimental ones. This has also consequences for the ratio. Compared to non-vdW calculations it is reduced, due to the interlayer layer effect of vdW interactions. Since at the same time the intralayer interactins are overestimated, the ratio is still larger than the experimental value.
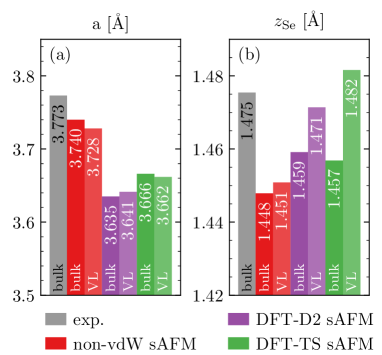
To investigate the intralayer interactions in detail, we additionally calculate an isolated FeSe layer in vacuum, i. e., a case where by construction no interlayer interactions occur. In Fig. 6 (a) it can be seen, that the relaxed lattice parameter for the bulk compound and the vacuum layer (VL) do not show a significant difference. Thus the overbinding in -direction is mostly caused by the intralayer vdW interactions. This result clearly shows that both approaches to include vdW bonding work well when other bond types such as covalent or ionic are absent, but do no consider the reduction of vdW interactions when they are present, as it is the case for intralayer interactions.
While the intralayer lattice constant is almost identical for the bulk and the isolated layer, the two systems show a pronounced difference on the internal structure parameter . Switching the interlayer interaction off, systematicall increases this parameter compared to the bulk compound (see Fig. 6 (b)). Thus, the interlayer interactions cause a compression in -direction of the FeSe layers. Since these interactions are mostly driven by the vdW attraction of the Se-atoms, we consider the ratio rather than the bare displacement to analyze structural improvement.
The investigation of the isolate layer shows that the lattice parameters in -direction (mainly driven by intralayer non-vdW interactions) and -direction (mainly driven by interlayer vdW interactions) are decoupled. Thus the non-vdW calculations provide a sufficiently accurate description of lattice parameter , whereas vdW corrected calculations are mandatory to describe the lattice parameter . To simultaneously improve both quantities a vdW implementation would be needed that takes the effect of strong covalent bonds on the vdW interaction into account. A possible approach to remove overbinding by VdW corrections is to perform the sum in Eq. (2) only over the pairs of atoms that are in different layers. Since this requires a new implementation of vdW in the DFT code, we did not test it.
Next we systematically analyze the structural impact of the volume reduction from the non-vdW optimized volume at Å3 to the corrected volume (compare Fig. 4). As can be seen in Fig. 7 the difference between DFT-D2 and DFT-TS is along this path more pronounced than the equilibrated values in Fig. 5.
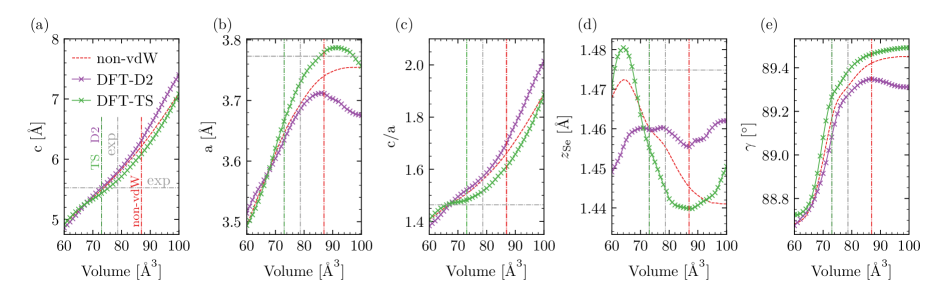
In the first place, the reduction in volume is connected with a reduction in the ratio to match the experimental values. As can be seen in Fig. 7 (c), the DFT-TS approach has a qualitatively different impact on the ratio than the DFT-D2 approach. In the latter case it is enhanced next to , what is caused by the treatment of the intralayer interactions. This causes a reduction of the lattice parameter in -direction in Fig. 7 (b) and consequently an increase of that one in -direction in Fig. 7 (a). The overestimates of the intralayer interaction is for this volume region less pronounced in the DFT-TS approach. The increase of the lattice parameter might be caused by a Poisson effect due to the decreased value. The parameter in Fig. 7 (d) shows a roughly anti-proportional trend compared to the lattice parameter , thus the bond length tries to remain constant. A similar effect is also visible for the VL in Fig. 6.
For even larger volumes, the lattice parameter and are nearly constant for the non-vdW curve, what is caused by vanishing interlayer bonds. As the lattice parameter in -direction steadily increases for increasing volume, the Fe-layers drift apart. This behavior corresponds to the well known exfoliation of graphene Allen et al. (2010), where vdW interactions also play a leading role. As is close to that region, it is most likely that the optimized lattice parameter of this approach are heavily influenced by those missing interactions.
When approaching the experimental volume at Å3 the slopes of the ratios for the vdW approaches are reduced compared to the region of higher volumes. This effect is strongest for the DFT-TS method. As the cell is compressed, the overestimation of the intralayer vdW attraction causes now a stronger decrease of the lattice parameter , whereas the value in -direction is less influenced. The same effect is also reflected in the steep slope of in Fig. 7 (d). Here, for the DFT-TS method varies a lot, while the value for the DFT-D2 approach does not show any significant changes. Moreover, for the DFT-D2 approach the values of the lattice parameter and the ratio are in this volume region nearly the same as for the non-vdW approach.
In the volume region around Å3, which is close to the vdW optimized volumes of DFT-D2 and DFT-TS, the structural parameters for the DFT-D2 and DFT-TS method and in particular the ratio are similar. Therefore, the effects of interlayer and intralayer vdW corrections are comparable for both approaches. The difference in the total energy, however, is still large (see. Fig. 4). For even smaller volumes the proximity of the second FeSe-layer causes several structural changes: At Å3 the displacement decreases for all approaches. Note that the overestimated intralayer interactions cause also a squeezing of the Se-atoms in -direction as the attraction of intralayer Se-up-atoms and Se-down-atoms is also overestimated. The kink visible for all approaches around Å3 is caused by a tetragonal in-plane distortion (, see Fig. 7 (e)) seen for most AFM like structures in FeSe.
By looking at the complete volume region, the DFT-D2 and DFT-TS approaches, i.e., their different treatment of the Hirschfeld partitioning and geometrical composition, imply significantly different behaviors. While the lattice parameters for the DFT-D2 agree for some volumes even less with experiment than the non-vdW ones, the values of the DFT-TS approach are overall closer to the experiment. The parameter is within DFT-D2 for large volumes close to the experimental value, but the largely reduced gradient of with respect to volume as compared to DFT-TS indicates a cancellation of interactions. Similar to the assessment of exchange correlation functionals in DFT Grabowski et al. (2007), the good agreement of the vdW approaches close to their equilibrium volumes increases confidence in the vdW corrections. One should, however, keep in mind that the intralayer interactions are overestimated in both approaches.
IV.3 Paramagnetic van der Waals Calculations
The PM vdW corrected calculations are similar to those from Sec. III. In contrast to the non-vdW calculations, the minimization of the total energy is resulting into a well defined equilibrium volume, due to the correct description of the interlayer binding. The converged optimal structural parameters are illustrated in Fig. 5. The lattice parameters are comparable to those of the sAFM state. The ratio is slightly enlarged, what can be related to the reduced interlayer magnetic interactions already mentioned when discussing the non-vdW PM state. By looking at Fig. 5 (e), it can be seen, that does not show any significant changes compared to the sAFM state. This underlines again the similarity of both magnetic configurations. It also shows that the interlayer attraction is solely caused by the presence of vdW interactions. It indicates that the coordinate does not depend on the magnetic structure and can only be correctly reproduced by DFT calculations with vdW corrections.
IV.4 Band Dispersion
To investigate the electronic band dispersion we take the NM calculations with structural parameters obtained by experiments McQueen et al. (2009b) (see Fig. 5) as a reference. Although, the NM state and the sAFM state differ for the structural parameters, their band dispersion is very similar except for some slight differences (see Fig. 8 (a)). For example, the -dependence of Se -orbital, which crosses the Fermi surface (FS) along , is stronger for the experimental values, and the Fe -orbitals are mostly independent. As a result we find a similar shape of electron pockets around the M-point and the A-point of the Brillouin Zone and flatter dispersions from the -point to the Z-point, what is due to - and -orbitals along direction.
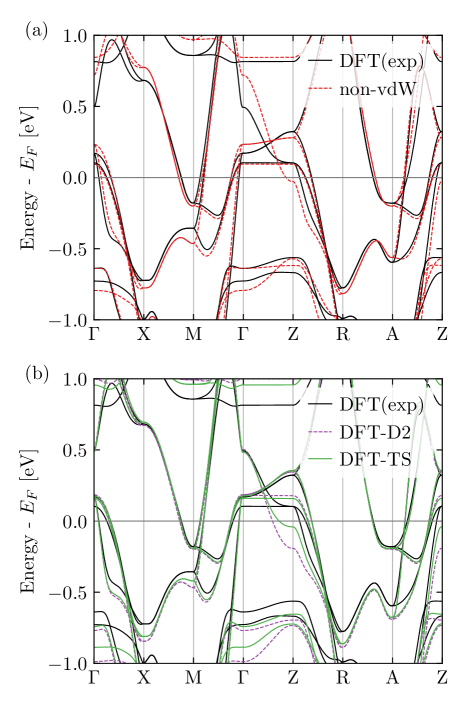
For the vdW corrected calculations the changes in the real space structure are also reflected in the electronic dispersion. Comparing the band dispersion with and without vdW corrections, the sizable -dependence of the Fe -orbitals is indeed found, consistent with previous works Ricci and Profeta (2013). Additionally, the shape of the electron pockets for is the same as for calculations with the experimental lattice parameters, a clear improvement to non-vdW sAFM calculations. Although other works propose interlayer driven effects on the band dispersion to be less important for superconductivity, a reconstruction of the FS by the Se -orbital dominated band from is found Guterding et al. (2017b). This may be related to an overestimation of interlayer Se-attraction.
Comparing both vdW approaches for FeSe (presumptive for all 11-based FeSC), the electronic band dispersion turns out to be very similar. Most important is that the enhancement of the interlayer interaction, which is in agreement with considerations of other works claiming vdW interactions to be important for FS reconstructions Guterding et al. (2017b). The DFT-TS approach includes the impact of the local environment on the vdW interaction, slightly reducing the overestimation of the intralayer interaction in DFT-D2 and improving the ratio. The only noticeable consequence in the band dispersion, however, is a modified band energy near the FS at the Z point.
V Summary
Based on a systematic DFT study, we show that the delicate interplay between the real space structure of FeSe and the resulting electronic dispersion requires the inclusion of vdW interactions and spin-disorder (PM). The introduced interlayer attraction makes FeSe a much more 3-dimensional material in ab initio calculations and agrees with recent ARPES experiments Watson et al. (2015). For the ground state the two most common vdW approaches DFT-D2 and DFT-TS yield similar lattice parameters at ambient conditions, yet for the pressure-dependent calculations DFT-TS is more appropriate, as it takes the real space local environment to estimate the vdW strength. Those investigations underline the fact that charge driven Se-Se interactions play an important role, similar to the the magnetic Fe-Fe interactions. The calculated lattice parameters using vdW and PM effects show the need for interlayer vdW corrections. For both magnetic configurations, sAFM and PM, the height of the Se-atoms are mostly identical, substantiating a lack of interlayer attraction to be responsible for the lattice mismatch of all previous ab initio approaches. We also show that the intralayer coupling do not include vdW interactions, however, the presence of them is negligible for the electronic dispersion. To further improve the lattice parameters, a vdW correction neglecting all intralayer contributions is required, as we showed that the mismatch in -direction is mostly driven by overestimated intralayer attraction. We also conclude, that the used magnetic structure will be less important for the lattice parameters, if the overall magnetic moment is close to zero. It indicates that the coordinate is actually independent of the magnetic structure and can only be correctly reproduced by DFT calculations with vdW corrections. Moreover, the fact that those magnetic structures lead to the very same structural properties substantiate the presence of competing magnetic orders in the nematic phase Martiny et al. (2019); Liu et al. (2016). Since those structural properties are essential for the superconductivity in FeSC, the improvement of the ab initio methods obtained in this work can be important for its understanding. The change of the character of the electronic dispersion from quasi two-dimensional towards more three-dimensional one with a significant contribution of the Se -orbitals is also relevant in the context of topological features, discussed previously Zhang et al. (2018) and needs to be explored further both experimentally and theoretically.
References
- Böhmer and Kreisel (2018) A. E. Böhmer and A. Kreisel, Journal of physics. Condensed matter : an Institute of Physics journal 30, 023001 (2018).
- McQueen et al. (2009a) T. M. McQueen, A. J. Williams, P. W. Stephens, J. Tao, Y. Zhu, V. Ksenofontov, F. Casper, C. Felser, and R. J. Cava, Physical Review Letters 103, 057002 (2009a).
- Margadonna et al. (2008) S. Margadonna, Y. Takabayashi, M. T. McDonald, K. Kasperkiewicz, Y. Mizuguchi, Y. Takano, A. N. Fitch, E. Suard, and K. Prassides, Chemical Communications (Cambridge, England) 0, 5607 (2008).
- Fernandes and Schmalian (2012) R. M. Fernandes and J. Schmalian, Superconductor Science and Technology 25, 084005 (2012).
- Bendele et al. (2010) M. Bendele, A. Amato, K. Conder, M. Elender, H. Keller, H.-H. Klauss, H. Luetkens, E. Pomjakushina, A. Raselli, and R. Khasanov, Physical Review Letters 104, 087003 (2010).
- Medvedev et al. (2009) S. Medvedev, T. M. McQueen, I. A. Troyan, T. Palasyuk, M. I. Eremets, R. J. Cava, S. Naghavi, F. Casper, V. Ksenofontov, G. Wortmann, and C. Felser, Nature Materials 8, 630 (2009).
- Bendele et al. (2012) M. Bendele, A. Ichsanow, Y. Pashkevich, L. Keller, T. Strässle, A. Gusev, E. Pomjakushina, K. Conder, R. Khasanov, and H. Keller, Physical Review B 85, 064517 (2012).
- Sun et al. (2016) J. P. Sun, K. Matsuura, G. Z. Ye, Y. Mizukami, M. Shimozawa, K. Matsubayashi, M. Yamashita, T. Watashige, S. Kasahara, Y. Matsuda, J.-Q. Yan, B. C. Sales, Y. Uwatoko, J.-G. Cheng, and T. Shibauchi, Nature Communications 7, 12146 (2016).
- Kothapalli et al. (2016) K. Kothapalli, A. E. Böhmer, W. T. Jayasekara, B. G. Ueland, P. Das, A. Sapkota, V. Taufour, Y. Xiao, E. Alp, S. L. Bud’ko, P. C. Canfield, A. Kreyssig, and A. I. Goldman, Nature Communications 7, 12728 (2016).
- Guterding et al. (2017a) D. Guterding, S. Backes, M. Tomić, H. O. Jeschke, and R. Valentí, physica status solidi (b) 254, 1600164 (2017a).
- Eschrig and Koepernik (2009) H. Eschrig and K. Koepernik, Physical Review B 80, 104503 (2009).
- Lochner et al. (2017) F. Lochner, F. Ahn, T. Hickel, and I. Eremin, Physical Review B 96, 094521 (2017).
- Johnston (2010) D. C. Johnston, Advances in Physics 59, 803 (2010).
- Hosono et al. (2018) H. Hosono, A. Yamamoto, H. Hiramatsu, and Y. Ma, Materials Today 21, 278 (2018).
- Dai (2015) P. Dai, Reviews of Modern Physics 87, 855 (2015).
- Li et al. (2009) Y.-F. Li, L.-F. Zhu, S.-D. Guo, Y.-C. Xu, and B.-G. Liu, Journal of physics. Condensed matter : an Institute of Physics journal 21, 115701 (2009).
- Khasanov et al. (2008) R. Khasanov, K. Conder, E. Pomjakushina, A. Amato, C. Baines, Z. Bukowski, J. Karpinski, S. Katrych, H.-H. Klauss, H. Luetkens, A. Shengelaya, and N. D. Zhigadlo, Physical Review B 78, 220510 (2008).
- Hsu et al. (2008) F.-C. Hsu, J.-Y. Luo, K.-W. Yeh, T.-K. Chen, T.-W. Huang, P. M. Wu, Y.-C. Lee, Y.-L. Huang, Y.-Y. Chu, D.-C. Yan, and M.-K. Wu, Proceedings of the National Academy of Sciences of the United States of America 105, 14262 (2008).
- Liu et al. (2016) K. Liu, Z.-Y. Lu, and T. Xiang, Physical Review B 93, 205154 (2016).
- Glasbrenner et al. (2015) J. K. Glasbrenner, I. I. Mazin, H. O. Jeschke, P. J. Hirschfeld, R. M. Fernandes, and R. Valentí, Nature Physics 11, 953 (2015).
- Christensen et al. (2019) M. H. Christensen, J. Kang, and R. M. Fernandes, Physical Review B 100, 014512 (2019).
- Ruiz et al. (2019) H. Ruiz, Y. Wang, B. Moritz, A. Baum, R. Hackl, and T. P. Devereaux, Physical Review B 99, 125130 (2019).
- Busemeyer et al. (2016) B. Busemeyer, M. Dagrada, S. Sorella, M. Casula, and L. K. Wagner, Physical Review B 94, 035108 (2016).
- Baum et al. (2019) A. Baum, H. N. Ruiz, N. Lazarević, Y. Wang, T. Böhm, R. Hosseinian Ahangharnejhad, P. Adelmann, T. Wolf, Z. V. Popović, B. Moritz, T. P. Devereaux, and R. Hackl, Communications Physics 2, 932 (2019).
- Böhmer et al. (2019) A. E. Böhmer, K. Kothapalli, W. T. Jayasekara, J. M. Wilde, B. Li, A. Sapkota, B. G. Ueland, P. Das, Y. Xiao, W. Bi, J. Zhao, E. E. Alp, S. L. Bud’ko, P. C. Canfield, A. I. Goldman, and A. Kreyssig, Physical Review B 100, 064515 (2019).
- Wang et al. (2016a) Q. Wang, Y. Shen, B. Pan, X. Zhang, K. Ikeuchi, K. Iida, A. D. Christianson, H. C. Walker, D. T. Adroja, M. Abdel-Hafiez, X. Chen, D. A. Chareev, A. N. Vasiliev, and J. Zhao, Nature communications 7, 12182 (2016a).
- Wang et al. (2016b) Q. Wang, Y. Shen, B. Pan, Y. Hao, M. Ma, F. Zhou, P. Steffens, K. Schmalzl, T. R. Forrest, M. Abdel-Hafiez, X. Chen, D. A. Chareev, A. N. Vasiliev, P. Bourges, Y. Sidis, H. Cao, and J. Zhao, Nature materials 15, 159 (2016b).
- Walle and Ceder (2002) A. Walle and G. Ceder, Journal of Phase Equilibria 23, 348 (2002).
- Guterding et al. (2017b) D. Guterding, H. O. Jeschke, and R. Valentí, Physical Review B 96, 125107 (2017b).
- Ricci and Profeta (2013) F. Ricci and G. Profeta, Physical Review B 87, 184105 (2013).
- Grimme (2006) S. Grimme, Journal of Computational Chemistry 27, 1787 (2006).
- Tkatchenko and Scheffler (2009) A. Tkatchenko and M. Scheffler, Physical Review Letters 102, 073005 (2009).
- Bleskov et al. (2016) I. Bleskov, T. Hickel, J. Neugebauer, and A. Ruban, Physical Review B 93, 214115 (2016).
- Wu and Yang (2002) Q. Wu and W. Yang, The Journal of Chemical Physics 116, 515 (2002).
- Chu and Dalgarno (2004) X. Chu and A. Dalgarno, The Journal of Chemical Physics 121, 4083 (2004).
- Tang (1969) K. T. Tang, Physical Review 177, 108 (1969).
- Hirschfeld (1977) F. L. Hirschfeld, Theoret. Claim. Acta (Berl.) 44, 129 (1977).
- Kresse and Hafner (1993) G. Kresse and J. Hafner, Physical Review B 47, 558 (1993).
- Kresse and Furthmüller (1996a) G. Kresse and J. Furthmüller, Physical Review B 54, 11169 (1996a).
- Kresse and Furthmüller (1996b) G. Kresse and J. Furthmüller, Computational Materials Science 6, 15 (1996b).
- Blöchl (1994) P. E. Blöchl, Physical Review B 50, 17953 (1994).
- Perdew et al. (1996) Perdew, Burke, and Ernzerhof, Physical Review Letters 77, 3865 (1996).
- Monkhorst and Pack (1976) H. J. Monkhorst and J. D. Pack, Physical Review B 13, 5188 (1976).
- Methfessel and Paxton (1989) Methfessel and Paxton, Physical Review B 40, 3616 (1989).
- Janssen et al. (2019) J. Janssen, S. Surendralal, Y. Lysogorskiy, M. Todorova, T. Hickel, R. Drautz, and J. Neugebauer, Computational Materials Science 163, 24 (2019).
- McQueen et al. (2009b) T. M. McQueen, Q. Huang, V. Ksenofontov, C. Felser, Q. Xu, H. Zandbergen, Y. S. Hor, J. Allred, A. J. Williams, D. Qu, J. Checkelsky, N. P. Ong, and R. J. Cava, Physical Review B 79, 014522 (2009b).
- Vinet et al. (1987) P. Vinet, J. R. Smith, J. Ferrante, and J. H. Rose, Physical Review B 35, 1945 (1987).
- Gastiasoro and Andersen (2015) M. N. Gastiasoro and B. M. Andersen, Physical Review B 92, 140506 (2015).
- Millican et al. (2009) J. N. Millican, D. Phelan, E. L. Thomas, J. B. Leão, and E. Carpenter, Solid State Communications 149, 707 (2009).
- Margadonna et al. (2009) S. Margadonna, Y. Takabayashi, Y. Ohishi, Y. Mizuguchi, Y. Takano, T. Kagayama, T. Nakagawa, M. Takata, and K. Prassides, Physical Review B 80, 064506 (2009).
- Koz et al. (2013) C. Koz, S. Rößler, A. A. Tsirlin, S. Wirth, and U. Schwarz, Physical Review B 88, 094509 (2013).
- Allen et al. (2010) M. J. Allen, V. C. Tung, and R. B. Kaner, Chemical reviews 110, 132 (2010).
- Grabowski et al. (2007) B. Grabowski, T. Hickel, and J. Neugebauer, Phys. Rev. B 76, 024309 (2007).
- Watson et al. (2015) M. D. Watson, T. K. Kim, A. A. Haghighirad, N. R. Davies, A. McCollam, A. Narayanan, S. F. Blake, Y. L. Chen, S. Ghannadzadeh, A. J. Schofield, M. Hoesch, C. Meingast, T. Wolf, and A. I. Coldea, Physical Review B 91, 524 (2015).
- Martiny et al. (2019) J. H. J. Martiny, A. Kreisel, and B. M. Andersen, Physical Review B 99, 014509 (2019).
- Zhang et al. (2018) P. Zhang, Z. Wang, X. Wu, K. Yaji, Y. Ishida, Y. Kohama, G. Dai, Y. Sun, C. Bareille, K. Kuroda, T. Kondo, K. Okazaki, K. Kindo, X. Wang, C. Jin, J. Hu, R. Thomale, K. Sumida, S. Wu, K. Miyamoto, T. Okuda, H. Ding, G. D. Gu, T. Tamegai, T. Kawakami, M. Sato, and S. Shin, Nature Physics 130, 3296 (2018).