On the selective multiphoton ionization of sodium by femtosecond laser pulses: A partial-wave analysis
Abstract
Multiphoton ionization of sodium by femtosecond laser pulses of 800 nm wavelength in the range of laser peak intensities entering over-the-barrier ionization domain is studied. Photoelectron momentum distributions and the energy spectra are determined numerically by solving the time dependent Schrödinger equation for three values of the laser intensity from this domain. The calculated spectra agree well with the spectra obtained experimentally by Hart et al (Phys. Rev. A 2016 93 063426). A partial wave analysis of the spectral peaks related to Freeman resonances has shown that each peak is a superposition of the contributions of photoelectrons produced by the resonantly enhanced multiphoton ionization via different intermediate states. It is demonstrated that at specific laser intensities the selective ionization, which occurs predominantly through a single intermediate state, is possible.
1 Introduction
Strong-field ionization of the alkali-metal atoms has been studied intensively over the past decade and earlier, both experimentally and theoretically including ab initio numerical calculations [1, 2, 3, 4, 5, 6, 7, 8, 9]. A specific feature of this group of atoms – a low ionization potential, which ranges from eV (for cesium) to 5.39 eV (for lithium), causes that a considerably smaller number of photons of a given energy is required for their photoionization than for the ionization of other atoms. For example, with the laser wavelength of around 800 nm ( eV) it takes four photons to ionize an alkali-metal atom, unlike the case of frequently used noble gases where this number is of the order of ten. Since for a dipole transition requiring photons the lowest order perturbation theory predicts that the photon absorption rate is if , where is the laser intensity and is the atomic unit value for intensity, measurable effects in experiments with multiphoton ionization (MPI) of alkali can be observed at relatively low laser intensities, available in table-top laser systems.
The perturbative treatment, however, is not applicable at higher intensities which can be achieved today. One indication of the nonperturbative regime is the so-called above threshold ionization (ATI) [10, 11, 12] in which the atom absorbs more photons than the minimum required. Under these conditions the photoelectron energy spectra (PES, electron yield versus their excess energy ) were seen to consist of several peaks, separated by the photon energy , and appearing at energies , where is the minimum number of photons needed to exceed the ionization potential and is the number of excess (”above-threshold”) photons absorbed by the atom. (For the alkali-metal atoms and the laser of 800 nm wavelength one has .) By increasing the intensity over a certain value, does not follow further the prediction of the perturbation theory.
At even larger intensities, the electric component of the laser field becomes comparable with the atomic potential, opening up another ionization mechanism – the tunnel ionization. In this case the field distorts the atomic potential forming a potential barrier through which the electron can tunnel. Multiphoton and tunneling ionization regimes are distinguished by the value of Keldysh parameter [13] which can be written as , where is the ponderomotive potential of ejected electron with mass and charge . The value of the electric field in the expression for corresponds to the peak value of laser intensity. Multiphoton and tunneling regimes are characterized by (high-intensity, long-wavelength limit) and (low-intensity, short-wavelength limit), respectively. The transition regime at for alkali-metal atoms is reached at considerably lower intensities than for other atoms, again due to the small ionization potential . The experiments accessing the strong-field regime with alkali [3, 6, 7, 9] have revealed that the commonly used strong-field ionization models in the form of a pure MPI or tunnel ionization cannot be strictly applied. The problem, however, goes beyond by using an ab-initio numerical method for solving the time-dependent Schrödinger equation (TDSE).
Finally, at a sufficiently high laser intensity, the field strength overcomes the atomic potential. This can be considered as the limiting case of tunnel ionization when the barrier is suppressed below the energy of atomic state. This regime is usually referred to as over-the-barrier ionization (OBI). Such a barrier suppression takes place independently of the value of Keldysh parameter. For neutral atoms the threshold value of field strength for OBI is estimated as (in atomic units). values for alkali, determined more accurately, are given in Ref. [14]. The corresponding laser intensities can be obtained by formula , where is expressed in atomic units and is the above introduced atomic unit for intensity. For noble gas atoms irradiated by the laser of wavelength from the visible light domain, OBI was occurring well into the tunneling regime [15]. This is, however, not a general rule. For atoms with low ionization potentials, as the alkali-metal atoms are, the OBI threshold, compared to that for hydrogen or noble gases, is shifted to significantly lower values of the field strength. For example, the laser peak intensity that corresponds to the OBI threshold for sodium is about ( a.u. [14]), whereas the value of Keldish parameter for the sodium atom interacting with the radiation of this intensity and 800 nm wavelength is . Thus, the OBI threshold in this case belongs to the MPI regime. Previous experiments and theoretical studies have already mentioned this peculiar situation for sodium and other alkali [3, 6, 7, 5, 4, 9]. In addition, it is demonstrated that at intensities above the OBI threshold the atomic target is severely ionized before the laser peak intensity is reached [5]. Thus, the ionization occurs at the leading edge of the pulse only, that is equivalent to the ionization by a shorter pulse.
A remarkable feature of the photoelectron spectra obtained using short (sub-picosecond) laser pulses is the existence of substructures in ATI peaks known as Freeman resonances. The mechanism which is responsible for occurrence of these substructures is the dynamic (or AC) Stark shift [10, 11, 16] which brings the atomic energy levels into resonance with an integer multiple of the photon energy. Freeman et al. [17, 18] have shown that when atomic states during the laser pulse transiently shift into resonance (this occurs in principle twice during the pulse, once as the laser pulse ”turns-on” and again as the pulse ”turns-off”), the resonantly enhanced multiphoton ionization (REMPI) [11, 19, 12]) takes place, increasing the photoelectron yield, and one observes peaks at the corresponding values of photoelectron energy. Thus, the peaks in the PES can be related to REMPI occurring via different intermediate states.
The resonant dynamic Stark shift of energy levels corresponding to sodium excited states (), relative to its ground state (3s) energy, is recently calculated for the laser intensities up to and wavelengths in the range from 455.6 to 1139 nm [8]. These data are used to predict the positions of REMPI peaks in the PES of sodium interacting with an 800 nm laser pulse. Freeman resonances in the PES of alkali-metal atoms have been studied in papers [1, 2, 3, 4, 5, 6, 7, 8, 9], mentioned at the beginning of Introduction, where a number of significant results have been reported.
The dynamic Stark shift also appears as an important mechanism in the strong-field quantum control of various atomic and molecular processes [20, 21, 22, 23]. Focusing on the MPI of atoms, a particular challenge would be the selective ionization of an atom through a single intermediate state which could produce a high ion yield. By increasing simply the laser intensity one increases the yield, but also spreads the electron population over multiple states [18] and, in turn, reduces the selectivity. Krug et al [2] demonstrated that chirped pulses can be an efficient tool in strong-field quantum control of multiple states of sodium at the MPI. Hart et al [7] have shown that improved selectivity and yield could be achieved by controlling the resonant dynamic Stark shift via intensity of the laser pulse of an appropriate wavelength ( nm).
In this paper we study the photoionization of sodium by the laser pulse of 800 nm wavelength and 57 fs full width at half maximum (FWHM) with the peak intensities ranging from to 8.8 TW/cm2, which belong to OBI domain in the MPI regime. These values were chosen for comparison with the experiment by Hart et. al. [7]. Using the single-active-electron approximation we calculate the corresponding photoelectron momentum distribution (PMD) and the PES by solving numerically the TDSE and perform a similar analysis as it has been done in Refs. [1, 2, 3, 4, 5, 6, 7, 8, 9]. In order to make a deeper insight into the ionization process, in addition, we perform a partial-wave analysis of the calculated PMD. In the next section we describe the model and in Sec. 3 consider the excitation scheme and ionization channels. In Sec. 4 we analyze the calculated photoelectron momentum distribution and energy spectra. A summary and conclusions are given in Sec. 5.
2 The model
Singly-excited states and the single ionization of the alkali-metal atoms are, for most purposes, described in a satisfactory manner using one-electron models. This follows from the structure of these atoms, which is that of a single valence electron moving in an orbital outside a core consisting of closed shells. In that case the valence electron is weakly bound and can be considered as moving in an effective core potential , which at large distances approaches the Coulomb potential . One of the simplest models for the effective core potential, applicable for the alkali-metal atoms, is the Hellmann pseudopotential [24] which reads (in atomic units)
| (1) |
The parameters and [14] provide the correct value for the ionization potential of sodium a.u. and reproduce approximately the energies of singly-excited states [25] (deviations are less than 1%). The associated eigenfunctions are one-electron approximations of these states and have the form . Radial functions can be determined numerically by solving the corresponding radial equation.
Here we use this single-active-electron (SAE) approximation to study the single-electron excitations and ionization of the sodium atom in a strong laser field. Assuming that the field effects on the core electrons can be neglected (the so-called frozen-core approximation [14]), the Hamiltonian describing the dynamics of valence (active) electron of the sodium atom in an alternating field, whose electric component is , reads (in atomic units)
| (2) |
We consider the linearly polarized laser pulse whose amplitude of the electric field component (field strength) has the form
| (3) |
otherwise . Here , and are the frequency of the laser field, the peak value of and the pulse duration (), respectively. Since the system is axially symmetric, the magnetic quantum number of the active electron is a good quantum number for any field strength. In the sodium ground state (when ) the orbital and magnetic quantum numbers are equal to zero and in our calculations we set .
Photoabsorption processes were simulated by solving numerically the TDSE for the active electron wave function , assuming that at the atom is in the ground state represented by the lowest eigenstate of Hamiltonian (2) with . The excitation was studied preliminary by the method of time dependent coefficients (TDC), where the wave function was expanded in a finite basis consisting of functions . In this approach the populations of atomic states are the squares of absolute values of expansion coefficients , determined by solving the corresponding set of equations numerically. This method, however, cannot be used to calculate photoionization because the basis of atomic states does not include the continuum states. An adequate alternative for this purpose is the wave-packet propagation method on a spatial grid. Here we use the second-order-difference (SOD) scheme [26] adapted to cylindrical coordinates , see Refs. [8, 27]. Due to the axial symmetry of the system, Hamiltonian (2) and the electron’s wave function do not depend on the azimuthal angle and the dynamics reduces to two degrees of freedom ( and ). The calculations were performed on a grid in the wave-packet propagation domain a.u. and the propagation time was about . The absorbing potential of form in the area a.u. was used to suppress the reflection of the wave packet from the domain boundaries.
3 Energy scheme and photoionization channels
The lowest energy levels corresponding to singly-excited states of sodium and possible multiphoton absorption pathways during the interaction of the atom with a laser radiation of 800 nm wavelength () are shown in Fig. 1(a). At this wavelength there exist three dominant REMPI channels: (i) (3+1)-photon ionization via excitation of 5p, 6p and 7p states, giving rise to photoelectrons with s and d-symmetry; (ii) (3+1)-photon ionization via excitation of 4f, 5f and 6f states, producing photoelectrons with d and g-symmetry; (iii) (2+1+1)-photon ionization via nearly resonant two-photon transition and subsequent excitation of P-states, giving rise again to photoelectrons with s and d-symmetry [2, 7].
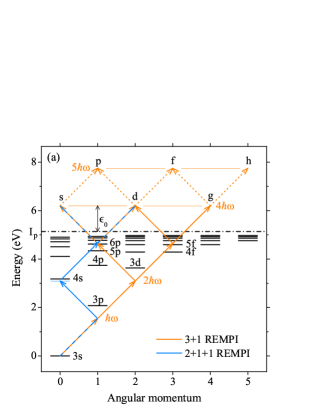
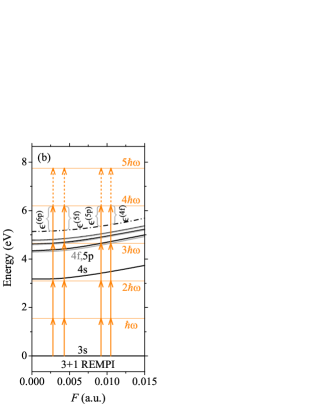
3.1 Estimation of the photoelectron excess energy. The nonresonant MPI
Theoretically, if the MPI occurs by absorbing photons, the excess energy of ejected electrons in the weak field limit is . At stronger fields, however, the dynamic Stark shift of the ground state (), as well as that of the continuum boundary (), change effectively the ionization potential to and the excess energy becomes dependent on the field strength (see Fig. 1(b))
| (4) |
This equation, using quadratic approximation , reads [8]
| (5) |
where the dynamic polarizability in the ground state and at the continuum boundary is approximated by its static value for the sodium ground state a.u. [28] and by its asymptotic value in the high frequency limit , respectively. Thus, , where is the ponderomotive potential of the active electron, whereas .
When the MPI is induced by a laser pulse, the field strength varies from 0 to and back producing photoelectrons of different energies, but with the maximum yield at (for a given ). This peak in the PES corresponds to the nonresonant -photon ionization and its position can be estimated by formula (5) width .
3.2 3+1 REMPI channels
Formula (5) is also useful for estimating the positions of REMPI peaks in the PES. Replacing the variable with the value at which the atomic state shifts in the three-photon resonance with the laser field, this formula for estimates the excess energy of photoelectrons produced in the 3+1 REMPI via this state (see Fig. 1(b)). The values for states 4p, 4f, 5p, 5f and 6p in the case of laser field of 800 nm wavelength are determined in a previous work [8]. These values, together with the corresponding values for estimated by formula (5) are given in Table 1.
Rewriting the resonance condition in the form and inserting it into Eq. (4) (with and ), one has
| (6) |
Since the dynamic Stark shift for the high lying levels takes approximately the same value as that for the continuum boundary (), the photoelectron energy at the 3+1 REMPI via considered state will be
| (7) |
where is the energy of the state for the field-free atom. The positions of REMPI maxima in the PES are, therefore, almost independent on the peak intensity of the laser pulse, in contrast to the position of the nonresonant four-photon ionization maximum . The values for obtained by Eq. (7) are shown in the last column of Table 1. Since usually (at least for P and F states, see Fig. 1(b)), the states which can be shifted into three-photon resonance are those with (for the wavelength of 800 nm these states are 4f, 5p, 5f, 6p, but not 7p and 6f, which are only near resonant at small values of ). As a consequence the REMPI maxima are in the spectrum located below the theoretical value for photoelectron energy in the weak field limit ().
-
state () (eV) (a.u.) (eV) (eV) 4p 0.0148 0.358 (0.164) 4f 0.0105 0.707 0.699 5p 0.0092 0.789 0.755 5f 0.0043 1.001 1.005 6p 0.0028 1.035 1.035 6f – – 1.172 7p – – 1.189
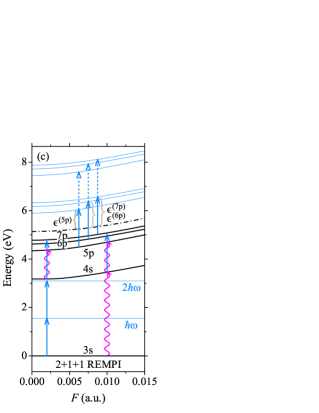
3.3 The 2+1+1 REMPI channel
Earlier experimental and theoretical studies [2, 7] have indicated that a particularly important role in the MPI of sodium using the radiation of around 800 nm wavelength has the 2+1+1 REMPI via nearly resonant two-photon transition and subsequent excitation of P states. Our previous calculations [8] have shown that this two-photon transition is close to be resonant at the values of field strength when the dynamic Stark shift is small (see Fig. 1(c)). The TDC calculations at the field strength a.u. confirm that the transfer of population from the ground (3s) to 4s state, compared to other excited states, is significant (see Fig. 2). The same calculations at the field strength a.u. show, however, that this transfer is high at stronger fields, too (see Fig. 3), which can be explained by strong Rabi oscillations between these two states. The population from 4s state flows further to state 5p (as a consequence of Rabi oscillations between these states) and to states 6p and 7p (by the near resonant one-photon absorption). Since , differences and are almost independent of , and transitions and subsequent ionization occur at all values of the field strength, producing the photoelectrons with s and d-symmetry and excess energies given by Eq. (7). Therefore, the photoelectrons produced in the 2+1+1 REMPI and in the 3+1 REMPI via the same intermediate P state are indistinguishable in both symmetry and energy.
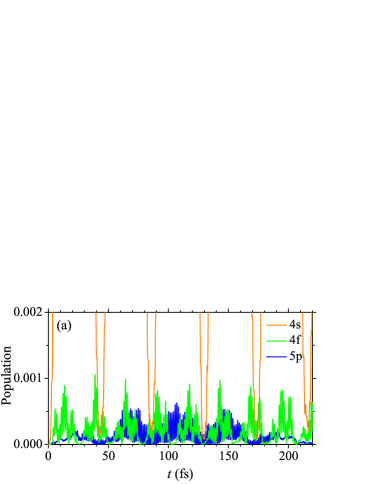
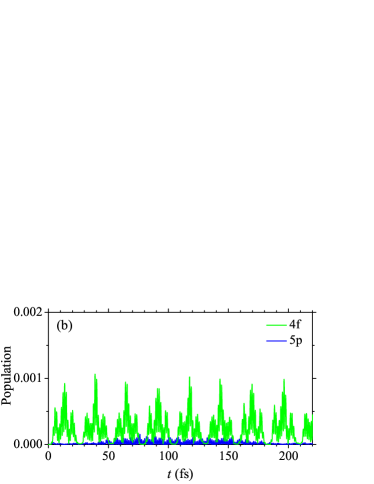
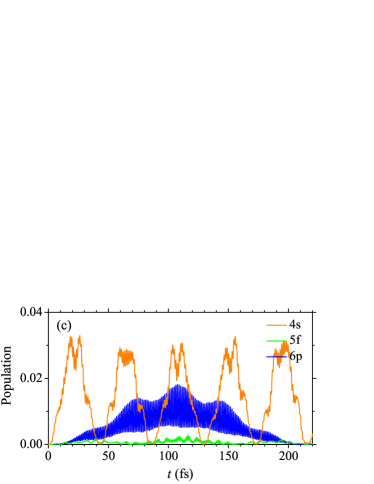
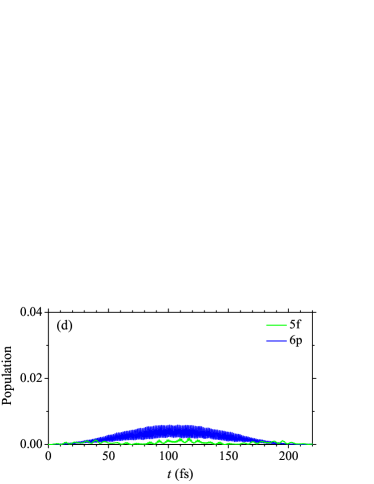
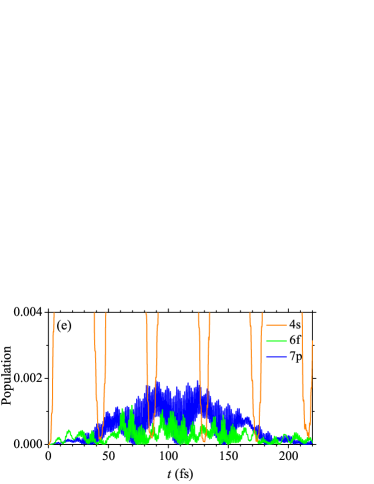
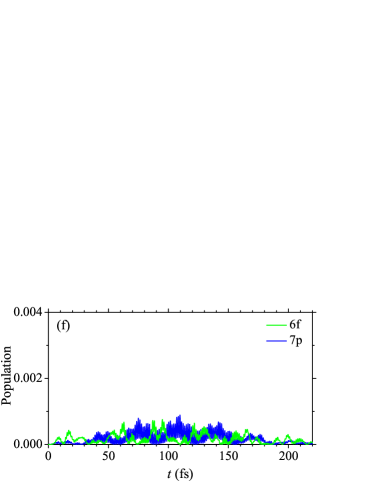
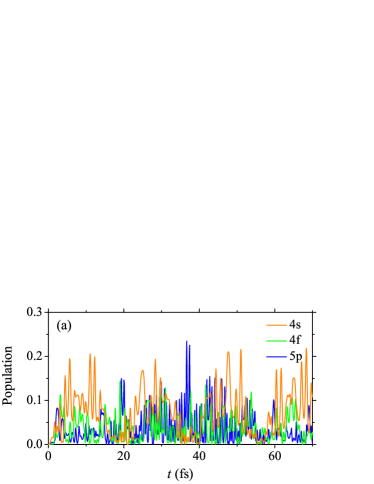
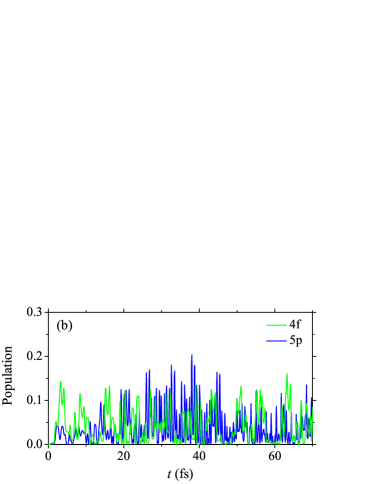
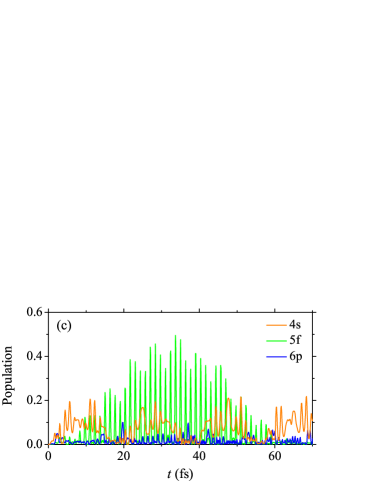
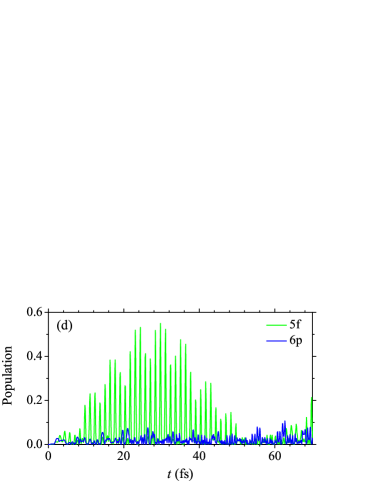
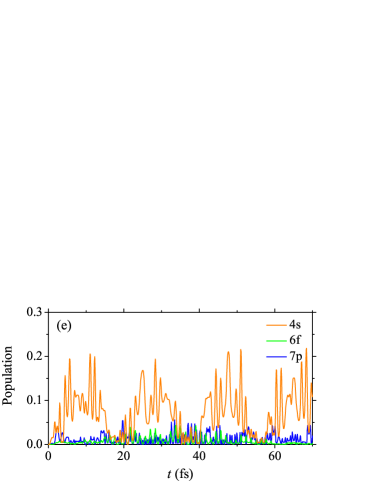

An insight into relative contributions of these two ionization channels in the total photoelectron yield can be gained by comparing the populations of sodium P states calculated using the model which takes into account the transitions between all relevant states with the populations of these states calculated using the model where the 4s state is invisible for other states (by taking the corresponding transition matrix elements to be zero). These calculations are done using the TDC method where the total wave function is expanded in the basis consisting of sodium orbitals in the SAE approximation with the principal quantum number from 3 to 7 and the orbital quantum number (17 states). The populations of states 4s, 4f, 5p, 5f, 6p, 6f and 7p as functions of time in the case of continuous radiation of 800 nm wavelength are shown in Figs. 2 and 3 for a.u. and a.u., respectively. The plots (a), (c), (e) are obtained taking into account all allowed transitions between basis states, while the plots (b), (d), (f) are determined taking into account all allowed transitions except those related to 4s state. One can see that the presence of transition , which is nearly resonant at a.u., significantly increases the population of P states at this field strength, but does not affect the F states. Contrarily, at a.u. this transition does not affect significantly the population of higher states. Based on this, we expect that at smaller values of the field strength ( a.u.) the 2+1+1 process should dominate over the 3+1 one, but at stronger fields it might be suppressed.
4 Photoionization by femtosecond pulses
4.1 Photoelectron momentum distribution
The photoelectron momentum distribution (PMD) is determined from the outgoing part of the wave function at (), which was calculated by the wave-packet propagation method (see Sec. 2). The transformation from the coordinate to momentum representation was done by the Fourier transform. In our case, due to the axial symmetry of the problem, the wave function is independent of angle and it is not necessary to calculate the full 3D Fourier transform. The PMD in the -plane is here obtained directly from the outgoing wave part of the function by transformation
| (8) |
The integral in terms of -coordinate, which is a part of this expression, was evaluated by applying the FFT algorithm. In order to get a clear PMD, before the transformation we removed the atomic (bound) part of the active electron wave function and left only the outgoing wave. It is found that for two parts of separate approximately at a.u.
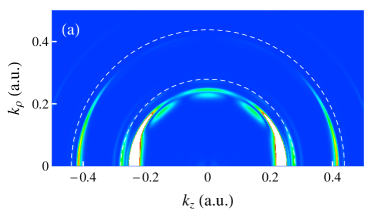
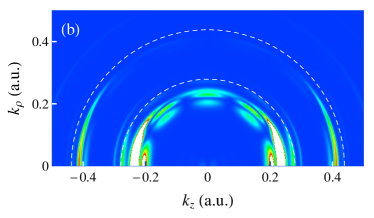
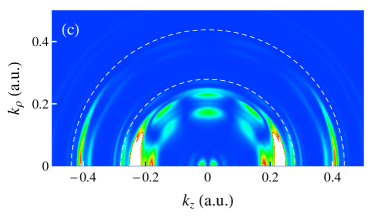
Fig. 4 shows the calculated PMD for the photoionization of sodium by 800 nm wavelength laser pulse of the form (3) with fs ( a.u., FWHM = 57 fs) for three values of the peak intensity: , and TW/cm2 (the corresponding field strength are: , and a.u.).
The radial () dependence of the PMD contains information about the photoelectron energies (). The dashed semicircles of radii a.u. ( eV) and a.u. ( eV), drawn in the PMD plots, mark the asymptotic values of momenta (energies) of the photoelectrons generated in the nonresonant MPI with four and five photons, respectively, in the weak field limit. Compared to these values, the radial maxima of PMD determined numerically are shifted toward the origin of -plane. The origin of these local maxima is twofold. Some of them are related to the nonresonant MPI for different numbers of absorbed photons, while others can be attributed to the REMPI (Freeman resonances). The shift of nonresonant maxima , referring to Eq. (7), is determined by the dynamic Stark shift of the ground state and the continuum boundary at the given laser peak intensity. The positions of Freeman resonances are, on the other hand, almost independent on the field strength, but they are also located below due to inequality discussed in Sec. 3.2.
The angular structure of the PMD, the so-called photoelectron angular distribution (PAD), carries information about the superposition of accessible emitted partial waves, which, according to selection rules for the four-photon absorption, can be s, d and g-waves (see Fig. 1(a)). Indeed, apart from the strong emission along the laser polarization direction ( and ), which can be attributed to all three partial waves, the PADs also show maxima at , which characterize d and g-waves and at and , which characterize the g-wave. Analogously, accessible emitted partial waves for the five-photon absorption can be p, f and h-waves (see Fig. 1(a)).
4.2 Partial wave expansion of the outgoing wave and photoelectron energy spectra
In order to determine the partial probability densities and the PES, the outgoing wave in momentum representation is expanded in terms of partial waves
| (9) |
where are the spherical harmonics with and are the corresponding radial functions. Using the representation of in cylindrical coordinates determined numerically by Eq. (8), the radial functions can be calculated as
| (10) |
According to partial wave expansion (9), the radial probability density of photoelectrons in momentum space is the sum , where
| (11) |
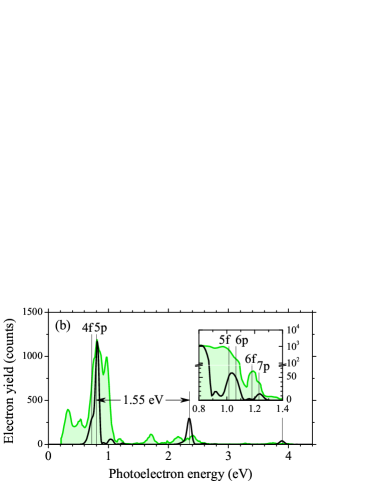
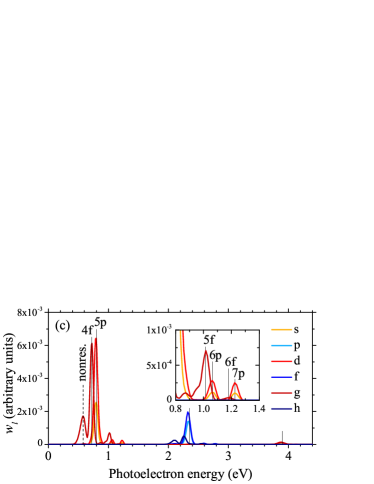
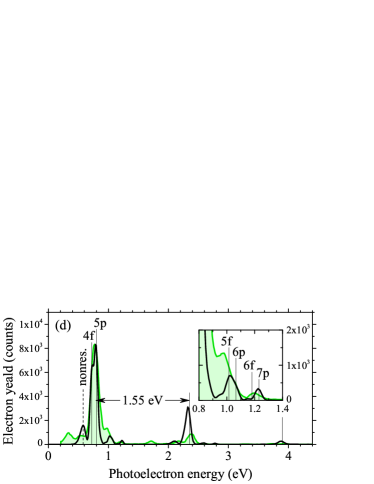
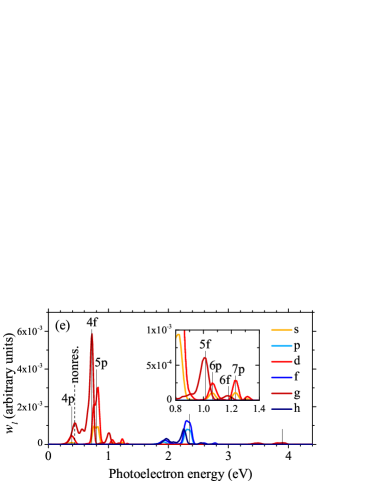
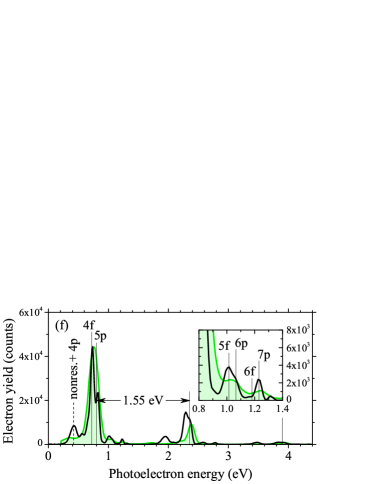
are the partial probability densities. These quantities for , as functions of the photoelectron excess energy , are shown in the left column of Fig. 5 for three values of the laser peak intensity: , and TW/cm2. The corresponding total probability densities represent the photoelectron energy spectra (PES) for these three values of laser intensity. They are shown in the right column of Fig. 5 together with the corresponding spectra obtained experimentally [7].
The spectra, both the calculated and experimental, exhibit typical ATI structure with prominent peaks separated by the photon energy . Fig. 5 (right column) shows the peaks corresponding to lowest three orders of ATI (MPI by photons, ) which are located approximately at . The partial wave analysis recovers the character of these peaks. In the left column of Fig. 5 we see that for the photoelectron energies around the threshold peak (, eV) and around the second-order ATI peak (, eV) dominant contributions in the total probability density come from the partial waves with even (s, d, g-waves). Thus, the photoelectrons with these energies are generated by absorbing an even number of photons ( and 6). Contrarily, in the vicinity of the first-order ATI peak (, eV) the partial waves with even are suppressed and those with odd (p, f, h-waves) dominate. Therefore, in this case odd number of photons is absorbed (here ). Each ATI peak, in addition, has an internal structure in the form of local (sub)peaks which can be attributed to the nonresonant MPI and to the REMPI via different excited states.

4.3 Nonresonant photoionization
The position of the nonresonant threshold peak (four-photon ionization maximum) predicted by formula (7) for laser peak intensities 3.5, 4.9 and 8.8 TW/cm2 is eV, 0.61 eV and 0.26 eV, respectively. This peak is visible in the numerically determined spectra shown in Fig. 5. Since the energy of photoelectrons produced by the nonresonant MPI does not depend on , a feature of the nonresonant peak is that the maxima of contributing partial densities have the same positions on the energy axis. At the laser peak intensity of TW/cm2, however, the nonresonant peak overlaps with the most prominent REMPI peak (see Fig. 5(a,b)) and it is difficult to estimate the position of former from the numerical data. The position of this peak at intensities TW/cm2 and TW/cm2 is 0.58 eV and 0.44 eV (numerical values), respectively (see Figs. 5(c-f)). A discrepancy between the values obtained by formula (7) and from numerical calculations (especially at TW/cm2) is attributed to the approximative character of the former. In addition, it should be mentioned that in experimental spectra the nonresonant peak is less prominent (almost invisible). This observation is reported also in an earlier work presenting a comparison between calculated and experimental data for the photoionization of lithium [5]. Nonresonant peaks of the first and of the second ATI order can be observed in Fig. 5, too, at positions which are shifted by one and two-photon energy relative to the threshold peak at a given laser intensity.
4.4 Resonantly enhanced multiphoton ionization
In contrast to nonresonant peaks the positions of REMPI peaks (Freeman resonances), as explained in Sec. 3, are almost independent of the laser peak intensity. We anticipated in that section that photoelectrons belonging to the threshold peak (four-photon ionization) reach the continuum along tree pathways which involve: (i) the 3+1 REMPI via intermediate P states, (ii) the 3+1 REMPI via intermediate F states and (iii) the 2+1+1 process via nearly resonant transition and subsequent excitation of P-states. For the most prominent peak at eV the intermediate P and F states are the states 5p and 4f, whereas for the subpeaks at eV and at eV these are the states 6p and 5f and the states 7p and 6f, respectively. Note, however, that for the radiation of 800 nm wavelength the transfer of population from the ground state to states 7p and 6f is only near resonant (, see Fig. 1(b)) and, strictly speaking, the four-photon ionization via these states is not 3+1 REMPI (see Sec. 3.2). In this case formula (5) is not applicable, but the photoelectron energy can be estimated using relation (7).
Here we focus on the main subpeak of the threshold peak (around 0.8 eV). Taking into account all three ionization pathways (see the first paragraph in Sec. 3) and the fact that photoelectrons produced in the 3+1 and 2+1+1 REMPI via P states cannot be distinguished (Sec. 3.3), the electron outgoing wave in the energy domain of this peak can be written as the superposition of two wave-packets
| (12) |
which, according to Fig. 1(a), have forms
| (13) | |||||
| (14) |
Since states 5p and 4f shift into the three-photon resonance at different field strengths (see Table 1 and Fig. 1(b)), wave packets (13) and (14) are formed in different phases of the laser pulse and characterized by different mean energies ( eV and 0.7 eV, respectively, referring to Table 1).
Expression (12) with components (13), (14) is compatible with the partial wave expansion of function . The left column of Fig. 5 demonstrates that the outgoing wave in the domain of threshold peak decomposes into s, d and g-waves
| (15) |
Radial functions and the corresponding partial probability densities are determined numerically using formulae (10) and (11), respectively. The positions of maxima of (see Table 2) confirm the existence of two electron wave-packets with different mean energies. The photoelectrons with s and d-symmetry have a higher mean energy ( eV) than those with g-symmetry (around eV). Referring to Table 1, these two energies characterize the photoelectrons produced in the REMPI via 5p and 4f states ( and ). Since the maxima of and almost coincide, we conclude that s-electrons and the majority of d-electrons belong to the same channel, i.e. they are generated in the 3+1 (or 2+1+1) REMPI via 5p state. Thus, the contribution of d-electrons in the wave packet (14) is minor (). Then, comparing expansion (15) and expressions (12), (13), (14), we get , and .
-
partial wave: s () d () g () (TW/cm2) (eV) (eV) (eV) 3.5 0.80 0.80 2.48 0.71 0.81 4.9 0.79 0.79 2.50 0.72 2.38 8.8 0.79 0.79 3.05 0.72 5.90
A similar analysis indicates that the subpeak at eV is related to 3+1 REMPI via states 5f and 6p, while that at eV is related to 3+1 (or 2+2+1) REMPI via 7p state (or sequence ) and much less to 3+1 REMPI via state 6f. Finally, note that for 8.8 TW/cm2 laser intensity an additional peak arises at eV (see Fig. 5(e)). It can be related to 3+1 REMPI via state 4p [8]. In the PES this peak overlaps with the nonresonant peak at eV (see Fig. 5(f)).
4.5 Selective enhancement of photoionization channels
Partial-wave analysis of the photoelectron wave function (outgoing wave) revealed that each subpeak of the threshold peak and succeeding ATI peaks, shown in Fig. 5(b,d,f), contains contributions of three REMPI channels, i.e. it is a superposition of three Freeman resonances. Here we examine their relative share in the electron yield and the possibility for selective ionization of atom through a single channel.
At the laser peak intensity the maximum contribution in the peak around 0.8 eV comes from the electrons of d-symmetry. At the electrons of d and g-symmetry have approximately equal contributions to this peak, while at intensity maximum contribution comes from the electrons of g-symmetry (see the ratios of maxima shown in Table 2). The contribution of s-electrons in this peak is 2.5-3 times smaller than the contribution of d-electrons. The contributions of s, d and g-electrons in the peaks at eV and eV do not change significantly with the laser intensity. The peak at eV is built predominantly by the electrons of g-symmetry, while the maximum contribution to the peak at eV comes from the electrons of d-symmetry (see the insets in Fig. 5(c,e)). These results indicate that for dominant ionization channel in the peak around 0.8 eV is the 3+1 or, more likely, 2+1+1 REMPI via 5p state, while for it is the 3+1 REMPI via 4f state. For the peaks around 1 eV and 1.2 eV, dominant channels are the 3+1 REMPI via 5f state and the 2+1+1 REMPI via 7p state, respectively.


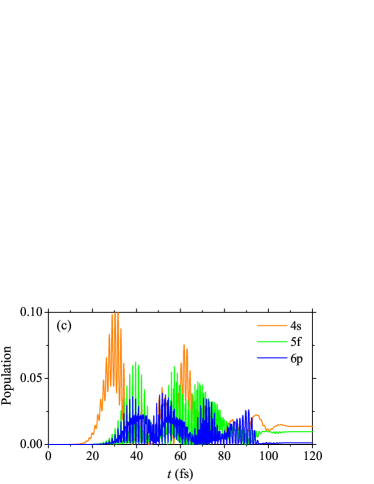
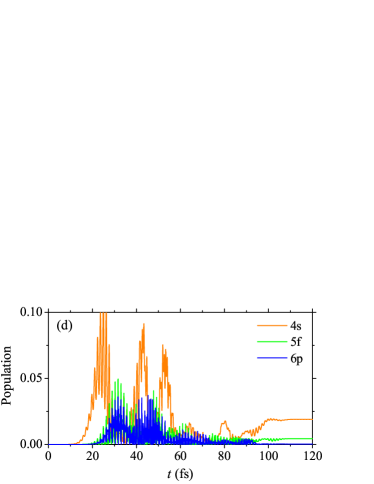
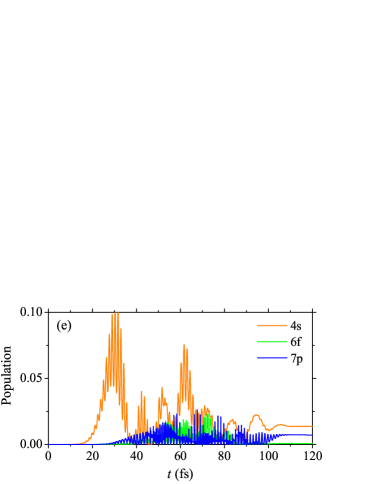
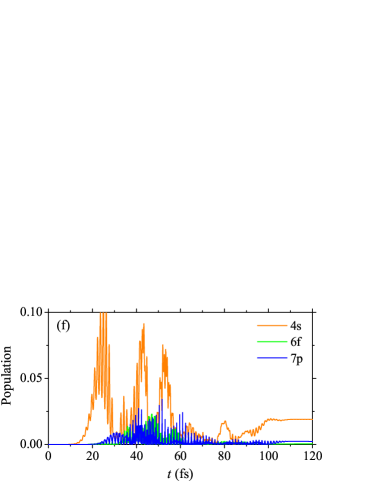
These findings are verified by calculating the populations of the unperturbed atomic states (i.e. transition probabilities ) during the pulse, while solving the TDSE. Fig. 6 shows the populations of relevant S, P and F states during the pulse of 3.5 TW/cm2 and 8.8 TW/cm2 peak intensity. Although corresponds to the OBI threshold, for this peak intensity at all phases of the pulse still there is a significant population of atoms which are not ionized (see the left side of Fig. 6). The population of states 5p and 7p is here higher than that of states 4f and 6f, respectively, but the population of state 5f is higher than the population of state 6p. Contrarily, at most atoms after the first half of the pulse are ionized (see the right side of Fig. 6). Among the atoms that were not ionized the population of states 4f and 5f in this case is higher than that of states 5p and 6p, respectively, while the population of state 7p is again higher than the population of state 6f. These observations fully agree with the findings concerning the photoionization channels.
The populations at different phases of the laser pulse can be well understood from diagrams (b) and (c) in Fig. 1. Diagram (b) predicts and Fig. 6(a,b) confirms that three-photon transitions from the ground state to states 4f and 5p are resonant with the radiation of 800 nm at the field strength a.u. (see also Table 1), which takes place in the middle of laser pulse when and at and for . States 5f and 6p, on the other hand, shift into resonance at smaller values of the field strength, which are reached at the beginning and at the end of pulse (see Fig. 6(c,d)). Contrarily, the three-photon transitions from the ground state to states 6f an 7p are not resonant with the radiation of 800 nm, but 2+1-photon transition is near resonant in the weak field limit. Since the dynamic Stark shift for P states grows with the field strength approximately as the shift for 4s state (see Fig. 1(c)), the transition remains near resonant and occurs during the whole pulse (see Fig. 6(e,f)). This is supported by the fact that populating the 4s state continues at higher field strengths due to Rabi oscillations between this and the ground state. In addition, the transitions and , which also occur due to Rabi oscillations, partially contribute to the population of 5p and 6p states.
5 Summary and conclusions
In this paper we studied the photoionization of sodium by femtosecond laser pulses of 800 nm wavelength in the range of field strengths entering over-the-barrier ionization domain and analyzed possibilities for selective resonantly enhanced multiphoton ionization through a single channel. Using the single-active-electron approximation we calculated the photoelectron momentum distributions by solving numerically the time dependent Schrödinger equation for these pulse parameters. In order to determine the contribution of different ionization channels to the total photoelectron yield, a partial wave analysis of the outgoing wave function in momentum representation is performed giving the partial probability densities as functions of the photoelectron energy . The total density, which is the sum , represents the photoelectron energy spectrum. The spectra calculated for the pulses of 800 nm wavelength, 57 fs duration (FWHM) and 3.5-8.8 TW/cm2 peak intensity agree well with the spectra obtained experimentally by Hart et al. [7]. This holds for the positions of both REMPI and ATI peaks.
A partial wave analysis of the spectral peaks related to Freeman resonances has shown that each peak is a superposition of the contributions of photoelectrons from different ionization channels. It is found that at the laser peak intensity of 3.5 TW/cm2 dominant contribution in the main peak (around 0.8 eV) comes from d-electrons, while at the intensity of 8.8TW/cm2 the electrons of g-symmetry dominate. In this way, by changing the laser intensity, it is possible to select the main ionization channel. In the first case this is combined 3+1 and 2+1+1 REMPI via 5p state, while in the second case it is the 3+1 REMPI via 4f state. In contrast to the main peak, the structure of local peaks around 1 eV and 1.2 eV is not sensitive to the laser intensity. The peak at 1 eV is related to 3+1 REMPI via the states 5f and 6p, whereas the dominant ionization channel for the peak around 1.2 eV is 2+1+1 REMPI via the near resonant 4s state and subsequently excited 7p state. These findings are justified by calculating the populations of excited states during the pulse. The selectivity might be further improved by choosing more appropriate pulse parameters which lead to a better resonance between intermediate states and the laser field.
This work was done in the Laboratory for Atomic Collision Processes, Institute of Physics Belgrade, under Project No. OI171020 of the Ministry of Education, Science, and Technological Development of the Republic of Serbia. Numerical simulations were run on the PARADOX-IV supercomputing facility at the Scientific Computing Laboratory, National Center of Excellence for the Study of Complex Systems, Institute of Physics Belgrade, supported in part by the Ministry of Education, Science, and Technological Development of the Republic of Serbia under project No. OI171017.
References
- [1] Wollenhaupt M, Krug M, Köhler J, Bayer T, Sarpe-Tudoran C and Baumert T 2009 Appl. Phys. B 95 245
- [2] Krug M, Bayer T, Wollenhaupt M, Sarpe-Tudoran C, Baumert T, Ivanov S S and Vitanov N V 2009 New J. Phys. 11 105051
- [3] Schuricke M, Zhu G, Steinmann J, Simeonidis K, Ivanov I, Kheifets A, Grum-Grzhimailo A N, Bartschat K, Dorn A, Ullrich J 2011 Phys. Rev. A 83 023413
- [4] Jheng S-D and Jiang T F 2013 J. Phys. B: At. Mol. Opt. Phys. 46 115601
- [5] Morishita T and Lin C D 2013 Phys. Rev. A 87 063405
- [6] Schuricke M, Bartschat K, Grum-Grzhimailo A N, Zhu G, Steinmann J, Moshammer R, Ullrich J and Dorn A 2013 Phys. Rev. A 88 023427
- [7] Hart N A, Strohaber J, Kolomenskii A A, Paulus G G, Bauer D and Schuessler H A 2016 Phys. Rev. A 93 063426
- [8] Bunjac A, Popović D B and Simonović N S 2017 Phys. Chem. Chem. Phys. 19 19829
- [9] Wessels P, Ruff B, Kroker T, Kazansky A K, Kabachnik N M, Sengstock K, Drescher M and Simonet J 2018 Communications Physics 1 32
- [10] Mittleman M H 1982 Introduction to the Theory of Laser-Atom Interactions (Plenum Press: New York)
- [11] Delone N B and Krainov V P 2000 Multiphoton Processes in Atoms, vol. 13 (Springer: Heidelberg)
- [12] Joachain C J, Kylstra N J, Potvliege R M 2012 Atoms in Intense Laser Fields (Cambridge University Press: Cambridge)
- [13] Keldysh L V 1964 Zh. Eksp. Teor. Fiz. 47 1945
- [14] Milošević M Z and Simonović N S 2015 Phys. Rev. A 91 023424
- [15] Mevel E, Breger P, Trainham R, Petite G, Agostini P, Migus A, Chambaret J-P and Antonetti A 1993 Phys. Rev. Lett. 70 406
- [16] Delone N B and Krainov V P 1999 Physics – Uspekhi 42 669
- [17] Freeman R R, Bucksbaum P H, Milchberg H, Darack S, Schumacher D and Geusic M E 1987 Phys. Rev. Lett. 59 1092
- [18] Gibson G N, Freeman R R and McIlrath T J 1992 Phys. Rev. Lett. 69 1904
- [19] Grossmann F 2008 Theoretical Femtosecond Physics (Springer-Verlag: Berlin)
- [20] Rabitz H, de Vivie-Riedle R, Motzkus M and Kompa K 2000 Science 288 824
- [21] Shapiro M and Brumer P 2003 Principles of the Quantum Control of Molecular Processes (Wiley: New York)
- [22] Sussman B J, Townsend D, Ivanov M Yu and Stolow 2006 Science 314 278
- [23] González-Vázquez J, Sola I R, Santamaria J and Malinovsky V S 2006 Chem. Phys. Lett. 431 231
- [24] Hellmann H 1935 J. Chem. Phys. 3 61
- [25] Sansonetti J E 2008 J. Phys. Chem. Ref. Data 37 1659
- [26] Askar A and Cakmak A S 1978 J. Chem. Phys. 68 2794
- [27] Bunjac A, Popović D B and Simonović N S 2017 Eur. Phys. J. D 71 208
- [28] Mitroy J, Safronova M S and Clark C W 2010 J. Phys. B: At. Mol. Opt. Phys. 43 202001