TESS observations of southern ultra fast rotating low mass stars
Abstract
In our previous study of low mass stars using TESS, we found a handful which show a periodic modulation on a period 1 d but also displayed no flaring activity. Here we present the results of a systematic search for Ultra Fast Rotators (UFRs) in the southern ecliptic hemisphere which were observed in 2 min cadence with TESS. Using data from Gaia DR2, we obtain a sample of over 13,000 stars close to the lower main sequence. Of these, we identify 609 stars which lie on the lower main sequence and have a periodic modulation 1 d. The fraction of stars which show flares appears to drop significantly at periods 0.2 d. If the periods are a signature of the rotation rate, this would be a surprise, since faster rotators would be expected to have a stronger magnetic field and, therefore, produce more flares. We explore possible reasons for our finding: the flare inactive stars are members of binaries, in which case the stars rotation rate could have increased as the binary orbital separation reduced due to angular momentum loss over time, or that enhanced emission occurs at blue wavelengths beyond the pass band of TESS. Follow-up spectroscopy and flare monitoring at blue/ultraviolet wavelengths of these flare inactive stars are required to resolve this question.
keywords:
stars: magnetic fields – stars: activity – stars: flare – stars: low-mass – stars: late-type – stars: rotation1 Introduction
Ultra Fast Rotators (UFRs) were first identified in the Pleiades open cluster through photometric and spectroscopic observations (see Van Leeuwen & Alpenaar, 1982). Further observations, such as outlined in Stauffer et al. (1984), indicated that these UFRs were heavily spotted stars which had only recently arrived on the main sequence. Large starspots imply the presence of a strong magnetic field, which has likely been generated through the dynamo mechanism (see Hartmann & Noyes, 1987; Maggio et al., 1987), therefore, they are expected to be active stars. Models of how low mass stars reach the main sequence indicate that UFRs can be made if the magnetic field of the star saturates at a critical rotational velocity (Barnes & Sofia, 1996).
A key element in the study of stellar magnetism is that of stellar flares, which have been observed across all wavelengths with amplitudes of up to nine magnitudes being observed in the optical (e.g. Simonian et al., 2014). Although flares have been seen from stars with earlier spectral-types, they appear more common in low mass stars, with more flares being observed from stars which are fully convective (e.g. Pettersen, 1989). We have been making a study of low mass stars using K2 (Doyle et al., 2018, Paper I) and TESS (Doyle et al., 2019, Paper II) looking in particular at whether the occurrence of flares is correlated with the stars rotation phase.
Until recently, determining the rotation period of stars was a laborious and time consuming process. Matters changed with the launch of Kepler in 2009 which, observed the same 115 square degree patch of sky just above the northern Galactic plane between Cygnus and Lyra for four years (Borucki et al., 2010). Although its prime goal was to discover planets around other stars, it provided the data to measure the rotation period of tens of thousands of stars along the main sequence (e.g. McQuillan et al., 2014). After the initial four year mission, Kepler made a series of observations of fields along the ecliptic plane each lasting several months, with the mission being re-named K2. Studies of open clusters of different ages were able to shed further light on the stellar rotation period as a function of age (e.g. Rebull et al., 2016). Towards the end of the K2 mission, TESS was launched in 2018 and is currently making a near all-sky survey with each ’sector’ being observed for approximately one month (Ricker et al., 2015).
During our studies of low mass stars made using TESS (Paper II), we identified a number of M dwarf UFRs possessing a rotation period 0.3 d. Surprisingly, some of the UFRs we identified show no or few flares in their lightcurves. Given that fast rotation is generally taken to imply a strong magnetic field (e.g. Parker, 1979), this is unexpected.
In our previous studies we have targeted stars observed with K2 and TESS which had a known spectral type. In this study, we have used data from Gaia DR2 to obtain a ‘blind’ search for low mass stars which have a rotation period 0.3 d. We then determine how many of these UFRs show flares, determining their energy and comparing their characteristics with stars with longer rotation periods.
2 The TESS sample
In our previous studies, we selected targets which had 1 min cadence K2 observations (Paper I) and 2 min cadence TESS observations (Paper II) of low mass stars which had a spectral type later than M0 in the SIMBAD catalogue111http://simbad.u-strasbg.fr/simbad/. Given the fraction of low mass stars with spectral types determined by spectroscopic observations is very far from complete, and that the luminosity class can be incorrect, here we use the Gaia DR2 catalogue (Gaia, 2018a) to identify UFRs which have been observed using TESS in 2 min cadence mode.
The TESS satellite was launched on the 18th April 2018 into an orbit with a period of 13.7 d. It has four small telescopes that cover a 24 instantaneous strip of sky (see Ricker et al., 2015, for details). In comparison to Kepler, TESS is best suited to observe stars which are bright and nearby, but has an instantaneous sky coverage of 20 times greater. In contrast to Kepler, TESS stays on a single field for 28 d, and in contrast to K2, it will survey the entire sky apart from a few degrees close to the ecliptic equator over the initial two year mission. In addition, TESS has a continuous viewing zone centered on the ecliptic poles where stars can be observed in all 13 sectors, with observations totalling approximately one year. Each full-frame image has an exposure of 30 min which is downloaded to Earth and made publicly available. However, for around 20,000 stars in each sector, photometry with a cadence of 2 min is obtained, with most targets being selected from the community via a call for proposals.
In this study we have taken the catalogues of stars in Sectors 1–13 222https://tess.mit.edu/observations which have 2 min photometry. This gives a total of 247,899 lightcurves, see Table 1 for a detailed account of how many stars were left at each stage of the selection process. There were 128,292 unique stars with 2 min cadence lightcurves. For these stars, we matched them with the Gaia DR2 catalogue (Gaia, 2018a) using a cross match of radius 4.
We take the parallax from the Gaia DR2 catalogue and infer the distance following the guidelines of Bailer-Jones (2015); Astraatmadja & Bailer-Jones (2016) and Gaia (2018b), which is based on a Bayesian approach. In practise we use a routine in the STILTS package (Taylor, 2006) and use a scale length L=1.35 kpc, which is appropriate for stellar populations in the Milky Way in general. We use this distance to determine the absolute magnitude in the Gaia band (a very broad optical filter), , using the mean Gaia magnitude. In our final sample, the ratio of the parallax to its error is typically several hundred and we are, therefore, confident that the resulting distances are robust, with 99 percent of our sample lying within 220 pc. The other key observable is the blue () and the red () filtered magnitudes, which are derived from the Gaia Prism data.
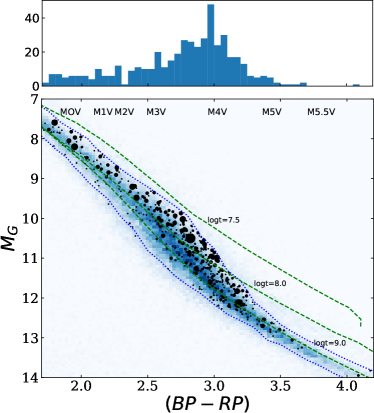
Our aim is to identify low mass stars which are close to the main sequence. We show the density of stars within 150 pc in the Gaia , plane in Figure 1 where the lower main sequence is well defined. We, therefore, select a region shown by dotted lines in Figure 1 to select stars observed using TESS in 2 min cadence mode, overall, there are 13,836 stars within this region. They have ( colours which imply they have spectral types in the range K9V to M6V, with there being an enhancement of stars near M4V. We also show three age tracks which are based on the PARSEC evolutionary tracks (Bressan et al., 2012) and obtained from the Osservatorio Astronomico di Padova portal333http://stev.oapd.inaf.it/cgi-bin/cmd_3.3 where we have assumed default input parameters. These tracks indicate all our stars are older than at least 30 Myr, with the redder stars having ages of 1 Gyr or more.
.
3 Data analysis
We downloaded the calibrated lightcurves of all 13,836 stars from Sectors 1–13 from the MAST data archive666https://archive.stsci.edu/tess/. We used the data values for PDCSAP_FLUX, which are the Simple Aperture Photometry values, SAP_FLUX, after the removal of systematic trends common to all stars in that Chip. Each photometric point is assigned a QUALITY flag which indicates if the data has been compromised to some degree by instrumental effects. We removed those points which did not have QUALITY=0 and normalised each light curve by dividing the flux of each point by the mean flux of the star. For those stars with data from more than one sector we made one lightcurve by combining the sectors.
For each lightcurve we used the Lomb Scargle (LS) Periodogram as implemented in the VARTOOLS suite of tools to determine whether a star showed significantly periodic modulation (Hartmann & Bakos, 2016). Since the lightcurves can still have systematic trends present even after a global trend has been removed, choosing the limit for identifying stars which show a significant period is not clear cut. After manual inspection of a subset of light curves and LS power spectra, we selected stars which had a False Alarm Probability (FAP) such that log10(FAP)-50. All lightcurves which were selected were then subject to manual inspection. In some cases the star was clearly an eclipsing binary; were likely contaminated by instrumental effects; or showed repeating features more like outbursts and these were put to one side. Additionally, in some cases the LS Periodogram had identified half the true period.
There were 730 stars which showed significant variability on a period 1 d. Each lightcurve was further examined by eye and some stars were removed since the significance of periodic variability was rather low, leaving 609 stars in our full sample. The shortest period identified was 1.3 hrs. This highlights the importance of having high cadence data in identifying UFRs. We also selected a magnitude limited sample with 14.0 mag which consists of 472 stars.
| Stars | |
|---|---|
| 247899 | lightcurves in Sectors 1–13 with 2 min cadence; |
| 128292 | Unique stars in Sectors 1–13; |
| 120439 | Those which have Gaia DR2 data; |
| 13836 | Stars close to lower main sequence; |
| 12257 | Brighter than =15.0 mag; |
| 9887 | Brighter than =14.0 mag; |
| 3613 | 15.0 mag and log10(FAP)-50 |
| 730 | LS Period 1 d; |
| 609 | Likely low mass stars with d; |
| 288 | Number of stars which showed at least 1 flare. |
4 Results
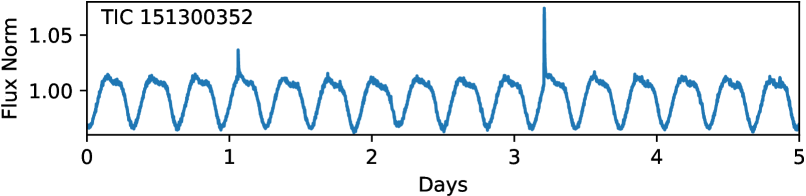
Upon a visual inspection of the lightcurves it was clear that some stars showed flares, whilst others showed none. As an example of one star which did show flares, we show the first five days of the light curve of TIC 151300352 in Figure 2 which has a period of 0.31 d and shows 10 flares in a lightcurve of duration 17.4 d (some data was lost to quality issues).
To help identify flares, we first removed the signature of the rotation period using kepflatten which is part of the PyKE suite of tools777https://pyke.keplerscience.org, on a sector-by-sector basis. To search for and characterise flares we used the Altaipony888https://altaipony.readthedocs.io/en/latest suite of python based software which is an update of the Appaloosa (Davenport, 2016) suite of software. After trial and error, we selected data points which were 2.5 brighter than the local mean (higher detection thresholds missed events which were visible by eye). However, to be classed as a flare, two or more consecutive flagged points were required. For each flare, the start time, duration and equivalent duration were determined. Our sample showed that 288 out of 609 stars showed at least one flare. For our brighter sample (14.0 mag), we found that 254 out of 472 stars showed at least one flare.
Using our full sample, we compared the brightness of stars showing at least one flare and showing no flare activity, finding the distribution of flare active stars is brighter than inactive stars. This indicates that, unsurprisingly, we are likely to miss flares from fainter stars. The distributions were similar for stars brighter than =14.0, which is why we also have a bright sample. At this point we cross matched the bright sample with SIMBAD and found five stars which showed evidence they were binaries – i.e. their spectral type showed a combination of two spectral types. This reduced the bright sample to 467 stars which we use for the remainder of our study.
| TIC | RA | DEC | Tmag | Dist | () | Duration | No. Flares | Flares/day | Mean L | |||
|---|---|---|---|---|---|---|---|---|---|---|---|---|
| (J2000) | (J2000) | (pc) | (d) | (d) | (Solar) | (erg) | ||||||
| 70775324 | 1.21206 | -30.49875 | 13.75 | 242.6 | 7.8 | 1.77 | 0.2568 | 25.44 | 1 | 0.0393 | 0.074 | 6.6E33 |
| 70788006 | 1.74063 | -30.15476 | 13.89 | 237.8 | 8.0 | 1.80 | 0.9450 | 25.44 | 0 | 0.0 | 0.072 | 0.0 |
| 70788050 | 1.90691 | -29.99631 | 13.75 | 241.8 | 7.8 | 1.79 | 0.3430 | 25.44 | 0 | 0.0 | 0.080 | 0.0 |
| 155896947 | 4.15716 | -52.69336 | 12.88 | 22.8 | 12.6 | 3.34 | 0.1786 | 25.43 | 1 | 0.0393 | 0.001 | 2.9E32 |
| 469939293 | 4.44109 | -52.36981 | 13.11 | 82.3 | 9.8 | 2.56 | 0.1919 | 25.44 | 0 | 0.0 | 0.020 | 0.0 |
| 425937008 | 5.33499 | -60.92048 | 13.57 | 45.8 | 11.7 | 3.18 | 0.4608 | 50.59 | 0 | 0.0 | 0.003 | 0.0 |
| 40047077 | 6.46240 | -9.961091 | 11.34 | 32.5 | 10.1 | 2.70 | 0.8888 | 18.68 | 9 | 0.4819 | 0.011 | 8.2E32 |
| 246855533 | 6.63975 | -24.20910 | 13.12 | 42.0 | 11.4 | 2.93 | 0.6652 | 25.44 | 2 | 0.0786 | 0.004 | 2.5E32 |
| 246891813 | 8.90377 | -24.11765 | 12.80 | 51.5 | 10.6 | 2.77 | 0.7136 | 18.68 | 6 | 0.3212 | 0.006 | 9.4E32 |
| 251879914 | 9.93474 | -31.66596 | 12.88 | 73.7 | 9.8 | 2.51 | 0.8840 | 25.43 | 1 | 0.0393 | 0.015 | 1.4E33 |
To determine the quiescent luminosity of the stars in our sample we again used the Gaia band absolute magnitude and equation 4 from Andrae et al. (2018):
| (1) |
where is the quiescent stellar luminosity in units of (3.83 erg/s); is the absolute magnitude of the star in the band; is a bolometric correction (determined using equation 7 of Andrae et al. (2018)), and mag is the Solar bolometric magnitude. Since almost all of our sample is within 220 pc we did not take into account reddening since it likely to be low.
To determine the luminosity of the flares, we take the equivalent duration of the flare, calculated using Altaipony, and multiply this by the stellar quiescent luminosity, calculated using equation 1. The mean energy of the flares was erg and the flare with the highest energy was erg, from TIC 100481123 with =0.84 d. The lowest energy flare was erg (in solar terms this would equate to an X2 class flare), whilst the mean of the lowest energy flares was 8 erg. In Table 2 we give an overview of the flare characteristics of each star while in Figure 1 we show the location in the Gaia HRD where the symbol size indicates the flare rate.
We split up the bright sample into stars which showed at least one flare per 17.38 d (representing the shortest duration of a light curve in our sample) and no flares per 17.38 d. We find no clear evidence for a difference in the distribution of stars in the Gaia HR Diagram.
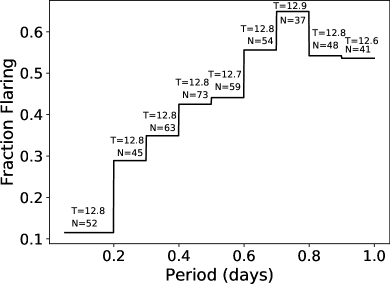
We also determined the fraction of stars in our bright sample which showed at least one flare over the median duration of the lightcurves (22.7 d), over various period ranges and show this as a histogram in Figure 3. There is a clear decline in the fraction of stars which show flaring activity as the period gets shorter, with a rapid decline at periods of 0.2 d. There is no clear difference between the energy of those flares which are detected over this period range. At periods 0.4 d, the average fraction of stars which show at least one flare per 22.7 d is 51 percent, whilst in the 0.2 d bin, the fraction is 11.5 percent. This has a probability of being due to chance of which is significant at a level of . There is no significant difference in the median duration of the lightcurves in each period bin. We also determined the fraction of stars showing flares at a rate of one per 17.38 d, the shortest duration of the lightcurves, and find the same result.
In Figure 3 we also show the mean for each bin. There is no significant difference in the mean brightness of stars over the period range and, therefore, we can exclude the possibility that the shortest period stars show fewer flares simply because they are fainter. We also determined the mean amplitude of the lightcurves in each bin and find no correlation with the period bin. A further search was made for a variation with both and the mean Galactic latitude of the samples in each bin. We find that the sample with 0.2 d is slightly bluer () than stars with d (), and that the mean Galactic latitude of the sample with 0.2 d is compared with for the 0.2 d sample. We return to these findings in §6.
5 Comparison with the Kepler field
We took all the stars observed using Kepler in short cadence mode in the original field and identified those which are likely single low mass stars using the same criteria as described in §2. As a result, we found 73 unique stars. In contrast, we have found nearly 10,000 stars brighter than =14 close to the lower main sequence in the southern ecliptic hemisphere which were observed using TESS in 2 min cadence. This is more than two orders of magnitude more than were observed using Kepler. We searched the Kepler lightcurves for a periodic signal and found three which were 1 d. One, KIC 3730067, is an eclipsing binary with a period of 0.147 d, while KIC 10063343 has a period of 0.333 d and KIC 9726699 (also known as GJ 1243) has a period of 0.593 d.
With TESS starting observations of the northern ecliptic hemisphere in July 2019, we have the opportunity to compare the lightcurves of specific stars made using Kepler and TESS. KIC 10063343 does not appear to have been observed so far using TESS. However, KIC 9726699, (TIC 273589987) has been observed so far in sectors 14 and 15. Indeed, KIC 9726699 was found to be a UFR with a rotation period of 0.593 d by Ramsay et al. (2013) which showed flares every few hours.
We were able to make a direct comparison of the lightcurve of GJ 1243 (=10.3 and =11.6) derived using Kepler and TESS using the same methods described in §2. There is a gap of seven years between the end of the Kepler observations and the start of the TESS observations. Using the lightcurves which have the signature of the rotation period removed (and using a 5 clipping) we find that the rms of the TESS lightcurves are a factor of 4.6 higher compared to the Kepler lightcurves. This is entirely expected as the collecting area of the Kepler mirror is much greater than the aperture of the TESS telescopes.
We identified all the flares in both the Kepler and TESS light curves and show a two day section from both lightcurves in Figure 4. In the Kepler lightcurve there are more short duration, low amplitude flares than the TESS lightcurve. The amplitude of the modulation is also higher in the Kepler lightcurve which is likely due to the larger pixel size of the TESS detectors (21 per pixel). This will result in the dilution of the varying signal of the target if there are other stars spatially located in or close to the pixel. This is especially true at low Galactic latitudes, for example, GJ 1243 with .
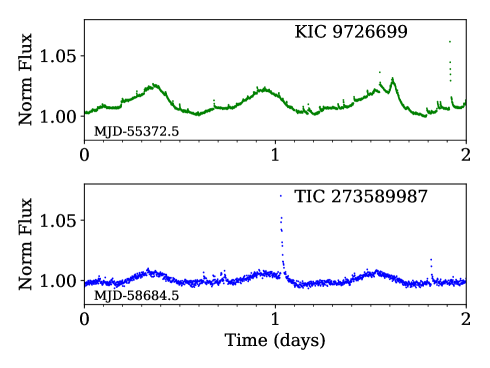
In Ramsay et al. (2013) we assumed the quiescent luminosity for GJ 1243 was typical of an M4V star ( erg/s). However, as can be seen from Figure 1 there is quite a large spread in absolute magnitude of stars M3–M4V. Applying the same methods as outlined in §2 we estimate that the quiescent luminosity of GJ 1243 is erg/s – a factor of 5 greater than assumed before. As expected from the difference in the rms of the lightcurves, we find that Kepler has a mean flare energy of 4.5 lower than that of TESS and an order of magnitude difference in the lowest energy flare detected (see Table 3). Although we cannot rule out that some of this difference is due to a change in the activity levels between the two epochs, we believe this is simply due to the Kepler lightcurves having a much lower rms because of the size of the Kepler mirror. TESS is, as expected, unable to detect the lower energy flares that were detectable using Kepler.
| Mean Energy | Lowest Energy | Highest Energy | |
|---|---|---|---|
| (ergs) | (ergs) | (ergs) | |
| TESS | |||
| Kepler |
6 Discussion
Our sample of stars covers the lower main sequence from K9 to M6 and have identified UFRs all along its length. We find that stars which are flare active are found all along the sequence. However, we also find evidence that stars with 0.2 d show significantly fewer flares than those stars with periods in the range 0.3–1.0 d. This is consistent with the finding of Gunther et al. (2020) who used 2 min cadence data taken from the first two months of the TESS mission, and found there was a ‘tentative’ decrease in the flare rate for stars with 0.3 d. Rapidly rotating low mass stars are expected to produce increased levels of activity, including flares, which is strongly related to their dynamo mechanism (Hartmann & Noyes, 1987; Maggio et al., 1987). Our finding, and that of Gunther et al. (2020), that stars with apparently the shortest rotation period show the fewer flares is therefore a surprise.
We first discuss how stable magnetic fields are on UFRs. One active UFR, V374 Peg (=0.44 d, M3.5), has received a lot of attention (e.g. Vida et al, 2016). They showed that the spot configuration was stable over about 16 years, confirming previous indications of a very stable magnetic field. Additionally, they observed frequent flaring, with the stronger flares seeming to be more concentrated around the phase where the lightcurve indicates a smaller active region. Morin et al. (2008) carried out a detailed modelling of the objects magnetic topology finding it had a large-scale magnetic topology, mostly axi-symmetric poloidal, but with the configuration sheared by very weak differential rotation. This suggests that a few low-contrast spots are present on the photosphere of V374 Peg, covering only 2 percent. On the other hand, more recently, Lanzafame et al. (2019), found evidence using multi-epoch data from Gaia DR2, that stars younger than 600 Myr, especially UFRs, can quite rapidly change their amplitude, indicating a comparable change in their spot coverage and hence activity level.
Reiners et al (2012, 2014) showed that fast rotating stars could exhibit a strong H emission line which was saturated as the stars rotation rate increased. One of the stars in our study with 0.2 d, TIC 260504446, was detected using XMM-Newton and has an observed luminosity of erg/s using the Gaia parallax. Assuming an optical luminosity of 2.6 erg/s (c.f. §4), we determine log for TIC 260504446, implying it falls into the saturated X-ray regime (Reiners et al, 2014). The work of Reiners et al (2012) indicates that could be as high as 8 erg/s, or 1/10 of the X-ray luminosity (see also Jeffries et al., 2011). We predict that this flare active star, with on average one flare per 0.08 d seen in the TESS data, will show strong H emission.
As stars age they lose angular momentum through processes such as stellar winds and, therefore, slow down (e.g. Barnes & Kim, 2010, and references therein). Determining the rotation period of stars in open clusters of known ages gives direct information on how age affects the rotation rate. For instance, using data from K2, Rebull et al. (2016, 2017) determined the period of stars in M45 (125 Myr) and M44 (630 Myr). They found that of those stars with a known period, the percentage of stars 1 d is 57.1 percent and 20.6 percent for M45 and M44 respectively, with these numbers declining to 3.2 percent and 2.1 percent respectively for d. Although there are inevitably differences in the biases between the K2 sample and our TESS sample, we find 33.1 percent and 2.9 percent have d and d respectively – i.e. between the values for M45 and M44. In Figure 1 we show age tracks which indicate that the stars in our sample are all older than 30 Myr and many appear older than 100 Myr, which is consistent with the comparison with M45 and M45. Based on their position in the Gaia HRD, we are unable to determine if age could be a dominant factor in the apparent lack of flare activity in our study.
We now consider whether the source of the short periodic signal could be another star located spatially close to the target star. This is because of the pixel scale of the TESS detectors (21 arcsec per pixel) which gives a 90 percent encircled radius of 42 arcsec (Ricker et al., 2015). Crowding is especially an issue near the Galactic plane. Indeed, of those stars with 0.2 d, 56 percent are within 15∘ of the Galactic plane, indicating crowding could be an issue. However, high cadence photometric surveys such as OmegaWhite (Macfarlane et al., 2015; Toma et al., 2016) allow us to estimate how many variable stars with 1.3 hrs are present at low Galactic latitude. Based on this 400 square degree survey, we estimate that for stars brighter than =16, we expect less than one variable star with a period greater than 1.3 hrs to be a chance alignment with our targets. We, therefore, do not think it likely that the variability seen in our targets is due to a chance alignment with a spatially nearby variable star.
Could the rotation periods we detect, in fact, not be the signature of the rotation period of the star, but rather the signature of a binary orbital period? Although we have restricted our search of stars close to the lower main sequence where we expect most stars to be late type single stars, we know that interacting binaries such as cataclysmic variables (CVs) and white dwarf - red dwarf pairs can also lie in this part of the HRD. Further, we expect that around 1/4 of early M type stars are in binaries (e.g. Cortes-Contreras et al., 2017, and references therein).
Theoretical work, such as Counselman (1973), and observations outlined and referred to by Fleming et al. (2019), indicate that for such short period binaries the stars are very likely synchronised with the orbital period. If the flare inactive UFRs are binaries, then the stars are likely to have increased their rotation rate as the orbit separation has shrunk, due to angular momentum loss over time. The stars rotation period could, therefore, be much shorter than expected for its age if it were not in a binary system. A series of medium resolution spectra would be required to test whether these flare inactive stars are in fact members of binaries.
Perhaps an obvious reason for our finding is that the flare inactive short period stars do show flares, but they are not seen in the TESS data. We showed in §5 that for observations of the same star, Kepler was sensitive to flares with an energy erg while TESS was sensitive to flares erg. A related explanation is that they do show flares but are less energetic than stars with slower rotation velocities. Dedicated observations of some of these stars using larger telescopes and high cadence multi-band photometry extending down to the band, where much of the flare energy is thought to be emitted, might be able to shed light on this.
A related solution could be, if a stars activity is saturated then the chromosphere of the M dwarfs becomes a very efficient radiator in blue continuum wavelengths. This could be the result of increased micro-flaring (see Houdebine et al, 1996). These flare inactive UFRs may, therefore, show an enhancement in the blue optical band, which would be apparent in the color index, but not in . This can be tested via spectroscopic observations and band flare monitoring.
In §4 we noted that the stars in our sample with d were slightly closer on average to the Galactic plane () compared to those stars with d (). This would dilute the target signal and reduce the apparent amplitude of any rotational modulation or flare amplitude. This is confirmed when we compare the number of stars in Gaia DR2 which are within 42 arcsec and have a mag within at least 1.5 mag of the target. There are around 10 percent more spatially nearby stars in the d sample. However, this is not large enough to explain the drop in the fraction of flare active stars in the d sample. The fact that the amplitude of the rotational modulation is not correlated with period does not support this either. We also noted in §4 that the d sample is slightly bluer () compared with stars with d (). Given they are also closer to the Galactic plane, this may indicate that they are biased towards younger stars. In which case we would expect them to be more active not less active. Could this indicate that we are seeing the enhanced emission due to increased magnetic activity at bluer wavelengths? Houdebine & Stempels (1997) reported a blue excess in active dMe stars that increased with activity level which was about three times larger than expected from calculations for a given atmospheric pressure.
7 Conclusions
We have identified a sample of low mass stars which lie close to the main sequence which show a periodic modulation with 1 d. We find that the fraction of stars which are flare active declines at shorter periods, with a significant drop at 0.2 d. Since we associate rapid rotation with strong magnetic fields which is likely to drive optical flares, this is a surprise. Therefore, we have explored several potential reasons for this. We demonstrate that it is unlikely to be due to spatially close variable stars being the source of the modulation. We find that the sample with 0.2 d is slightly bluer and closer on average to the Galactic plane than those with d. We explore the effect that spatially nearby stars may dilute the target stars rotational amplitude. This would reduce the number of detected flares but conclude it is unlikely to be the sole reason for our finding. If the flare inactive stars with 0.2 d were binary stars, then the stellar components are likely to have increased their rotation rate as their orbital separation shrinks due to angular momentum loss over time. They would be rotating faster than if they were single stars and therefore their rotation period would not reflect their age. Several medium resolution spectra are needed to search for evidence of binarity and to determine the flux of lines such as H. Another possibility is that these stars show low energy flares, perhaps at bluer wavelengths which would not be detected using TESS. High cadence photometry of stars with 0.2 d, especially in the band, is encouraged.
8 Acknowledgments
We thank the anonymous referee for a helpful report which made several very useful suggestions. This paper includes data collected by the TESS mission, for which funding is provided by the NASA Explorer Program. Armagh Observatory & Planetariun is core funded by the Northern Ireland Executive through the Dept for Communities. LD acknowledges funding from an STFC studentship.
This work presents results from the European Space Agency (ESA) space mission Gaia. Gaia data is being processed by the Gaia Data Processing and Analysis Consortium (DPAC). Funding for the DPAC is provided by national institutions, in particular the institutions participating in the Gaia MultiLateral Agreement (MLA). The Gaia mission website is https://www.cosmos.esa.int/gaia. The Gaia archive website is https://archives.esac.esa.int/gaia.
Data Availablity: The TESS data is available from the NASA MAST portal.
References
- Andrae et al. (2018) Andrae, R., et al., 2018, A&A, 616A, 8
- Astraatmadja & Bailer-Jones (2016) Astraatmadjam, T. L., & Bailer-Jones, C. A. L., 2016, ApJ, 833, 119
- Barnes & Sofia (1996) Barnes, S. A., Sofia, S., 1996, ApJ, 462, 746
- Barnes & Kim (2010) Barnes, S. A., Kim, Y.-C., 2010, ApJ, 721 675
- Bailer-Jones (2015) Bailer-Jones, C. A. L., 2015, PASP, 127, 994
- Bressan et al. (2012) Bressan, A., et al., 2012, MNRAS, 427, 127
- Borucki et al. (2010) Borucki, W. J., et al., 2010, Sci, 327, 977
- Cortes-Contreras et al. (2017) Cortés-Contreras, M., et al., 2017, A&A, 597, A47
- Counselman (1973) Counselman, Charles C., III, 1973, ApJ, 180, 307
- Davenport (2016) Davenport, J. R. A., 2016, Astrophysics Source Code Library, 1608.003
- Doyle et al. (2018) Doyle, L., Ramsay, G., Doyle, J. G., Wu, K., Scullion, E., 2018, MNRAS, 480, 2153, Paper I
- Doyle et al. (2019) Doyle, L.; Ramsay, G.; Doyle, J. G.; Wu, K., 2019, MNRAS, 489, 437, Paper II
- Fleming et al. (2019) Fleming, D. P., Barnes, R., Davenport, J. R. A., Luger, R., 2019, ApJ, 881, 88
- Gaia (2018a) Gaia Collaboration, Brown, A.G.A., Vallenari, A., et al., 2018a, A&A, 616, A1
- Gaia (2018b) Gaia Collaboration, Luri, X., Brown, A. G. A., et al., 2018b, A&A, 616, A9
- Gunther et al. (2020) Günther, M. N., et al., 2020, AJ, 159, 60
- Hartmann & Noyes (1987) Hartmann, L. W., Noyes, R. W., 1987, ARAA, 25, 271
- Hartmann & Bakos (2016) Hartman, J. D., Bakos, G. Á., 2016, A&C, 17, 1
- Houdebine et al (1996) Houdebine, E.R., Mathioudakis, M., Doyle, J.G. & Foing, B.H., 1996, A&A 305,209
- Houdebine & Stempels (1997) Houdebine, E.R. & Stempels, H.C., 1997, A&A 326, 1143
- Jeffries et al. (2011) Jeffries, R. D., Jackson, R. J., Briggs, K. R., Evans, P. A., Pye, J. P., 2011, MNRAS, 411, 2099
- Lanzafame et al. (2019) Lanzafame, A. C., Distefano, E., Barnes, S. A., Spada, F., 2019, ApJ, 877, 157
- Macfarlane et al. (2015) Macfarlane, S. A., Toma, R., Ramsay, G., et al., 2015, MNRAS, 454, 507
- Maggio et al. (1987) Maggio, A., et al, 1987, ApJ, 315, 687
- McQuillan et al. (2014) McQuillan, A., Mazeh, T., Aigrain, S., 2014, ApJS, 211, 24
- Morin et al. (2008) Morin et al. 2008, MNRAS 384, 77
- Parker (1979) Parker, E. N., 1979, International Series of Monographs on Physics, Clarendon Press, Oxford
- Pettersen (1989) Pettersen, B. R., 1989, SoPh, 121, 299
- Ramsay et al. (2013) Ramsay, G., Doyle, J. G., Hakala, P., Garcia-Alvarez, D., Brooks, A., Barclay, T., Still, M., 2013, MNRAS, 434, 2451
- Rebull et al. (2016) Rebull, L. M., et al., 2016, AJ, 152, 113
- Rebull et al. (2017) Rebull, L. M., et al., 2017, ApJ, 839, 92
- Reiners et al (2012) Reiners, A., Joshi, N., Goldman, B., 2012, AJ, 143, 93
- Reiners et al (2014) Reiners, A., Schüssler, M., Passegger, V. M., 2014, ApJ, 794, 144
- Ricker et al. (2015) Ricker G. et al., 2015, JATIS, 1a4003
- Simonian et al. (2014) Simonian, G., et al., 2014, Atel, 6771
- Stauffer et al. (1984) Stauffer, J. R., Hartmann, L., Soderblom, D. R., Burnham, N., 1984, ApJ, 280, 202
- Taylor (2006) Taylor, M. B., 2006, ASPC, 351, 666, in Astronomical Data Analysis Software and Systems XV, eds. C. Gabriel et al.
- Toma et al. (2016) Toma, R. et al., 2016, MNRAS, 463, 1099
- Van Leeuwen & Alpenaar (1982) Van Leeuwen, F., Alphenaar, 1982, Msngr, 28, 15
- Vida et al (2016) Vida, K. et al., 2016, A&A 590, 11