Identification of CaCuSi4O10 (Egyptian blue) in the ``Birch. Spring'' painting by Robert Falk (1907) using photoluminescence
Abstract
We have detected Egyptian blue pigment in the paint layer of the ``Birch. Spring'' painting by Robert Falk (1907); we have also found this pigment in the paints of the sketch drawn on the canvas back side. This is probably the first discovery of Egyptian blue in a 20th century work of art. We have analyzed a modern commercial Egyptian blue pigment (Kremer) and found it to be suitable as a standard for photoluminescence spectral analysis. The characteristic photoluminescence band of CaCuSi4O10 reaches maximum at the wavelength of about 910 nm. The luminescence is efficiently excited by incoherent green or blue light. The study demonstrates that the photoluminescence spectral micro analysis using excitation by incoherent light can be efficiently used for the identification of luminescent pigments in paint layers of artworks.
keywords:
Egyptian blue , Photoluminescence , Polarizing microscopy , Elemental mapping , Paints analysis , Russian avant-garde paintingGraphical abstract
![[Uncaptioned image]](/html/2007.03716/assets/x1.png)
Research highlights
-
1.
Egyptian blue is identified in ``Birch. Spring'' painting by R. Falk (1907)
-
2.
CaCuSi4O10 emission band is centered at the wavelength of 910 nm
-
3.
The luminescence is efficiently excited by incoherent green or blue light
-
4.
Luminescence enables detecting some pigments in paint layers of artworks
-
5.
Commercial Egyptian blue (Kremer) fits as a standard for spectral analysis
1 Introduction
1.1 Egyptian blue from the antiquity to the present: a brief historical reference
Egyptian blue, also known as calcium copper tetrasilicate or calcium copper phyllo-tetrasilicate (CaCuSi4O10), Alexandria frit or Pompeian blue, is one of the earliest synthetic pigments first obtained in Egypt no later than the 4th dynasty (ca. 2613–2494 BC) [1, 2, 3] and widely used in the antiquity [1, 4, 5] by different names [2].111Remind that, in antiquity, owing to the imperfectness of the production processes, Egyptian blue pigment was frit that, apart from calcium copper tetrasilicate, comprised appreciable quantities of numerous impurities such as, e.g., wollastonite (CaSiO3), Cu-rich glass, cuprite (Cu2O), tenorite (CuO) [6], cassiterite (SnO2), malayaite (CaSnSiO5), quartz and free lime [7]. At present, the term of Egyptian blue usually relates to CaCuSi4O10 itself, especially if the art pigment is concerned. Ancient Romans, e.g., knew this substance by the name Caeruleum aegyptium [2, 8, 9, 10]. Also, it was extensively produced throughout ancient Western Asia and the Mediterranean Region (Mesopotamia, Persia, Assyria, Urartu, Parthia and Greece) [2, 3, 7, 11, 12, 13, 14, 15, 16, 17, 18, 6, 19, 20]. It was found out as one of the main blue pigment in the Fayum mummy portraits (1st to 3d centuries AD) [6, 19] and in the paint layer of the early Christian encaustic icons ``Male and Female Martyrs'' and ``Sergius and Bacchus'' [21]. By the 3rd century, Egyptian blue spread in the Roman Europe (see Ref. [4] and references therein) and even in Norway [22].
Egyptian blue related to the early medieval period was reported to be detected in the mural painting of a church of the 9th or 10th century AD (Lombardy, Italy) [23, 24] and in an 11th century mural altarpiece of the church of Sant Pere (Terrassa, Spain) [25]. Later, in the Middle Ages, Egyptian blue, as considered, was lost [2]. However, CaCuSi4O10 was unexpectedly identified using optical and scanning electron microscopy, photoluminescence, and Raman microspectroscopy in the painting of St. Margaret by Ortolano Ferrarese (Giovanni Battista Benvenuto) made in Italy in 1524 [26].
The natural form of calcium copper tetrasilicate, cuprorivaite, was described as a new mineral from Vesuvius in 1938 [27]. Its structure is presented, e.g., in Refs. [28, 29, 30, 31, 32, 33]. However, it is a rarely met mineral usually intimately mixed with quartz [33]; it is mainly distributed in Italy, Germany, USA and South Africa [32, 33].
Nowadays, calcium copper tetrasilicate, due to its unique luminescence characteristics [34, 35, 36, 37, 38, 39], has achieved increasing importance in science and technology [40, 41, 42, 43, 44, 45, 46]; it may find numerous applications in various areas of photonics soon.
1.2 On the ``Birch. Spring'' painting by Robert Falk
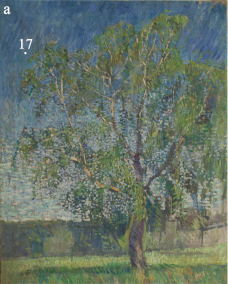
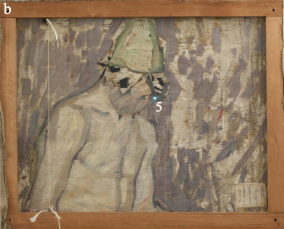
Surprisingly, calcium copper tetrasilicate has recently been detected using energy dispersive X-ray spectroscopy and polarizing microscopy in the 20th century painting ``Birch. Spring'' (oil on canvas, private collection, see Fig. 1) [47].
The author of the picture, Robert Falk (1886–1956) is one of the bright representatives of Russian avant-garde, a leading member of ``The Jack of Diamonds'' creative association (1910–1916) [48, 49, 50, 51]. However, the painting dates back to the early period of Robert Falk's work, the time of his formation as an artist, and was painted in his second year at the Moscow School of Painting, Sculpture and Architecture in 1907 [52].
A two-sided image on paintings is a characteristic feature of the artist's work at that time. Repeatedly, in need of a clean canvas, the artist turned over his work (and cut some into several parts) and wrote down the clean back of the canvas. This is exactly what he did with the ``Birch. Spring'' painting, when depicting a sketch of a human figure on the back of the canvas (Fig. 1). Interestingly, that Egyptian blue was identified in the blue paint layers of both images, which indirectly supports the assumption about close time of creation of both the spring landscape and the figured sketch on the back side of the canvas.
2 Experimental details
2.1 Methods and equipment
We have applied the multi-analytical approach to both the characterization of the commercial Egyptian blue pigment (Kremer), used as a standard in this work, and the studies of the paint layer composition of the ``Birch. Spring'' painting by Robert Falk presented in this article. The following techniques and equipment were used in the research.
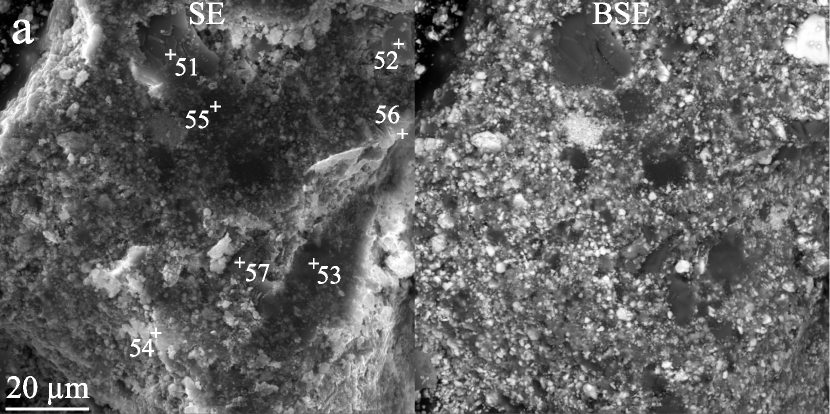
Mira 3 XMU (Tescan Orsay Holding) scanning electron microscope (SEM) was employed for sample imaging and elemental analysis. Pairs of SEM images were recorded simultaneously using secondary (SE) and backscattered (BSE) electrons.222As a rule, we record pairs of SEM SE and BSE images at each point since SEM running in the former mode it renders mainly the spatial relief of the studied surface, while operated in the latter mode it demonstrates mainly the substance density (i.e. its elemental or phase composition), whereas the information on both relief and composition of a sample is usually required for the correct interpretation of data obtained using SEM. Elemental microanalysis and mapping was made using EDS X-MAX 50 (Oxford Instruments Nanoanalysis) energy dispersive X-ray (EDX) spectrometer.
Binder was analyzed using Tensor 27 Fourier-transform infrared spectrometer (Bruker) equipped with MIRacle attenuated total reflection (ATR) accessory (PIKE Technologies) with a ZnSe ATR crystal.
X-ray phase analysis was carried out by means of the Debye-Scherrer powder diffraction [53] using D8 Advance diffractometer (Bruker) at non-monochromatic Cu Kα band (Cu K, = 1.54184 Å); the diffraction patterns were scanned over a range from 5 to 75∘. The PDF-2 Powder Diffraction Database (Joint Committee on Powder Diffraction Standards – International Centre for Diffraction Data) was used for the phase composition analysis.
For the examination of samples using polarizing microscopy (PM) a POLAM L213-M (LOMO) microscope was employed. Film polarizers rather than Nicol prisms are applied in the design of this instrument.
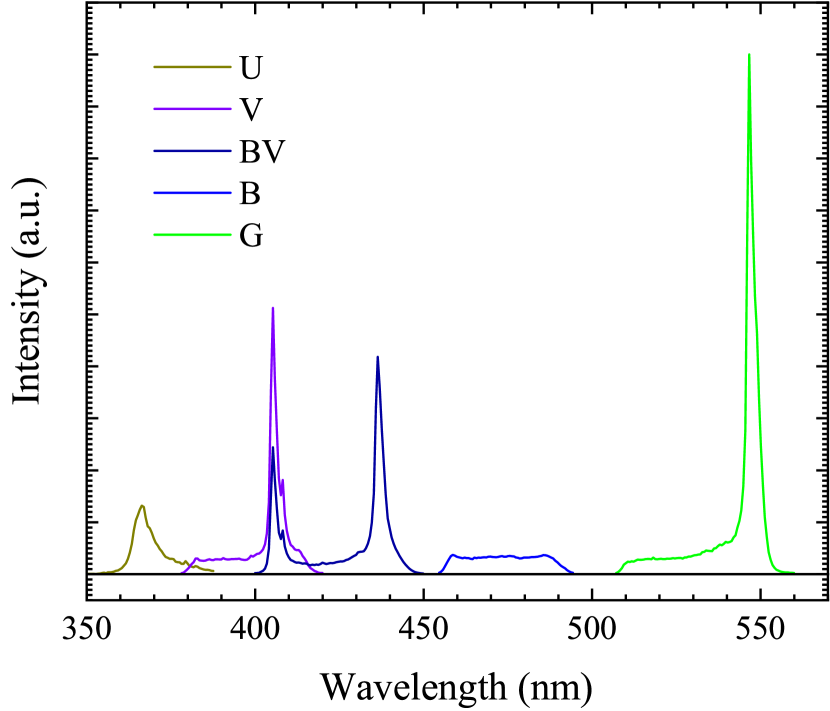
Micro photoluminescence (PL) spectra were acquired at room temperature using AvaSpec-2048 fiberoptic spectrometer (Avantes) connected with MIKMED-2 fluorescence stereo microscope (LOMO). Emission bands of atomic Hg and Xe of a 100-W mercury arc lamp (HBO 100, Osram) were employed for PL exciting. Five preinstalled microscope operation modes differing by the photoexcitation (PE) and data acquisition (DA) spectral ranges—designated as G (green), B (blue), BV (blue-violet), V (violet) and U (ultraviolet)—enabled varying the PE conditions. Spectral data for the operation modes are given in Table 1, and the spectral bands available for the PL excitation are plotted for each mode of the microscope in Fig. 2. The PL spectra of the samples studied in this article were generally obtained at the microscope magnification of . However, the magnification of 250 or 125 was also used sometimes.
| Band | PE filter | Dichroic mirror | DA filter |
|---|---|---|---|
| designation | transmission band | splitting wavelength | cut-on wavelength |
| (nm) | (nm) | (nm) | |
| G | 510 to 560 | 575 | 590 |
| B | 450 to 490 | 505 | 520 |
| BV | 400 to 440 | 455 | 470 |
| V | 380 to 420 | 430 | 450 |
| U | 330 to 380 | 400 | 420 |
2.2 Specimens, sampling and sample preparation
2.2.1 Samples from the painting by Robert Falk
Over 20 pigment micro samples covering the spectrum of hues used in the ``Birch. Spring'' painting by Robert Falk were taken under a microscope from the front and rear sides of the canvas. The samples were investigated using a set of analytical methods, such as SEM imaging and EDS X-ray elemental microanalysis including elemental mapping, PM and PL. The study showed, that the samples of the blue paint layer # 17 and # 5, which were taken at the points indicated in Fig. 1, are of topical interest.
An examining procedure of the samples was as follows. Before analyzing, every sample was divided into several portions; each portion was investigated using a specific kind analysis. SEM imaging and EDS X-ray elemental microanalysis including elemental mapping, PM and PL analyses were routinely carried out at different portions of an original sample. The originally obtained samples evidently were inhomogeneous. However, since they were small enough to provide specimens with close properties after the division into separate portions, we consider the random variations of composition between the sample portions as insignificant. Thus, we consider each portion of the original samples as representative, in general features reflecting the properties of the whole original sample. This allows us to compare the properties of the original samples in whole based on data of a specific kind of analysis of their portions. For this reason, comparing of data obtained using specific kinds of analysis from different portions of an individual sample is also justified.
2.2.2 Commercial Egyptian blue pigment (Kremer) used as a standard
We used the commercial Egyptian blue pigment (Kremer # 10060) as a standard of calcium copper tetrasilicate for the PL investigations. Commercial art pigments are known to often be a mixture of several compounds and considerably differ in their composition depending on the manufacturer [54] that makes it difficult to employ them as analytical standards. This consideration made us thoroughly analyze the degree of purity of this commercial pigment to be convinced that it did not contain foreign admixtures and could be utilized as a reliable standard. We have investigated its elemental and phase composition using EDS, X-ray powder diffraction and polarizing microscopy. Besides, we have explored its luminescence to determine the structure of its emission band. PL spectra were acquired using exciting light of different PE bands of the microscope (Fig. 2, Table 1).
Samples of the Kremer Egyptian blue powder were not subjected to any treatment before the examinations; they were neither washed nor etched [40].
3 Results and Discussion
3.1 Examination of the commercial Egyptian blue pigment
3.1.1 SEM and EDS
e
 f
f
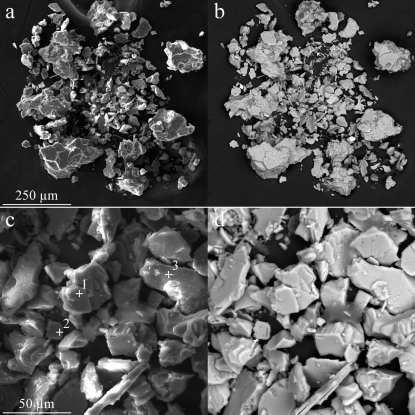
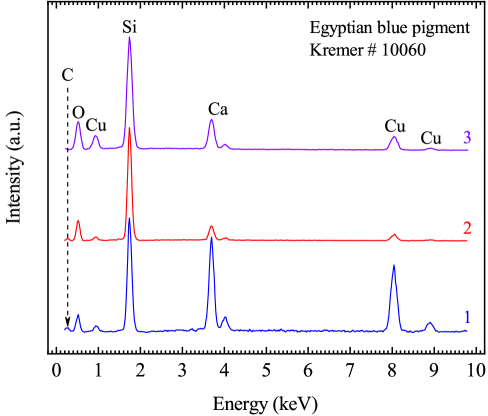
SEM images of samples of the investigated powder of the commercial Egyptian blue pigment are shown in Fig. 3 a–d and typical EDX spectra obtained at several points on powder particles are presented in Fig. 3 e. SEM images obtained in backscattered electrons demonstrate the homogeneity of the powder composition. The EDX spectra are seen to contain only peaks of oxygen, silicon, calcium and copper (the intensity of the peak of carbon likely present due to a contaminant or a residual gas of the SEM chamber atmosphere is negligible). Although the elemental analysis of this powder was semi-quantitative, its data allow us to consider this substance as pure enough to be used as a reference sample in further analyses of paints.
3.1.2 X-ray powder analysis
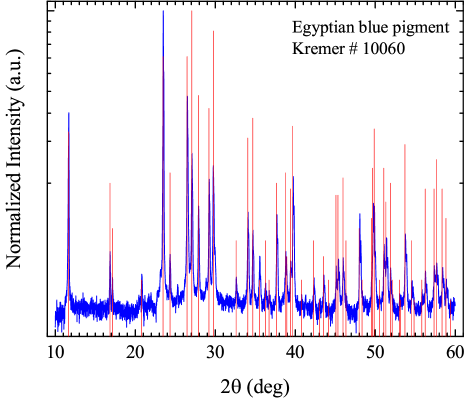
The X-ray powder pattern of the commercial Egyptian blue pigment shown in Fig. 3 f demonstrates that the phase of CaCuSi4O10 completely dominates its composition. The positions of all the diffraction maxima, except for a few very weak ones that likely emerge due to parasitic reflections, coincide with the positions of those documented in the PDF Card 01-085-0158 (ICSD Entry 402012) and Ref. [31].
We conclude that the possible content of some foreign crystalline phases is negligible in this powder that allows us to employ this commercial compound as the reference one in further analyses.
3.1.3 Polarizing microscopy
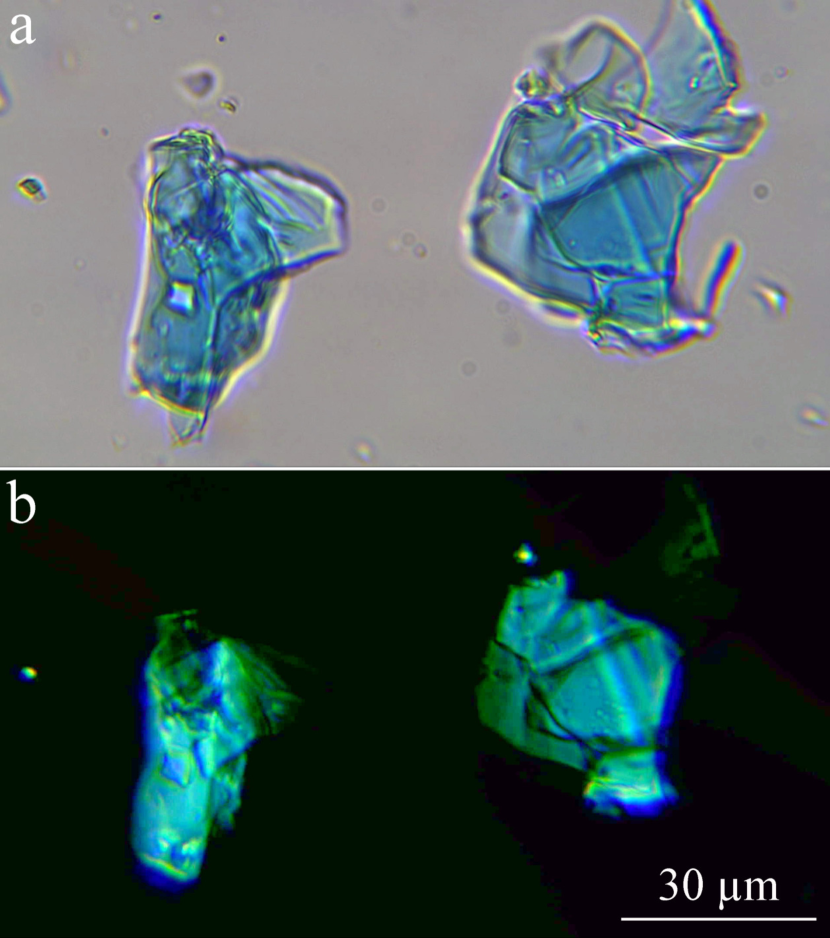
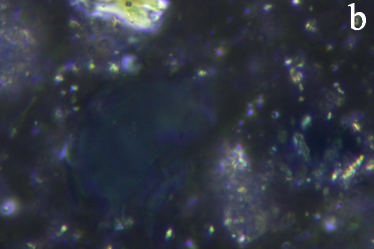
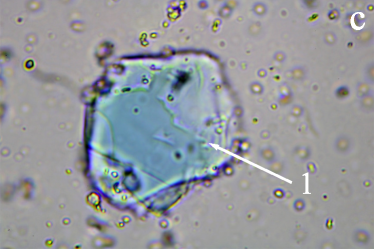
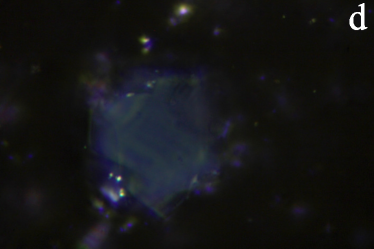
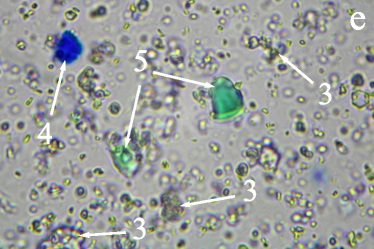
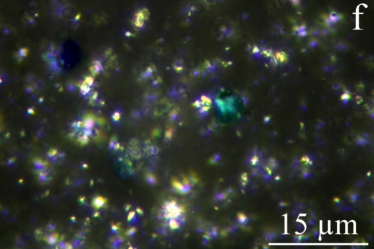
The study of samples of the commercial Egyptian blue pigment in the plane-polarized light shows optical properties, which are characteristic to Egyptian blue [55]. The thin bright blue translucent flat particles typical for Egyptian blue exhibit a very weak pleochroism.333Compare, e.g., with the Egyptian blue PM images given in Ref. [4]. Under crossed polars, the compound displays very low order interference colors and weak extinction. The shape of the particles is very diverse and characterized by irregular, angular fractures (Fig. 4). Besides, a broad particle size distribution from medium (1 to 3 µm) to very coarse ( µm) is observed (Figs. 3 a–d and 4).444According to Feller and Bayard’s particle size classification for pigments [56].
3.1.4 Photoluminescence
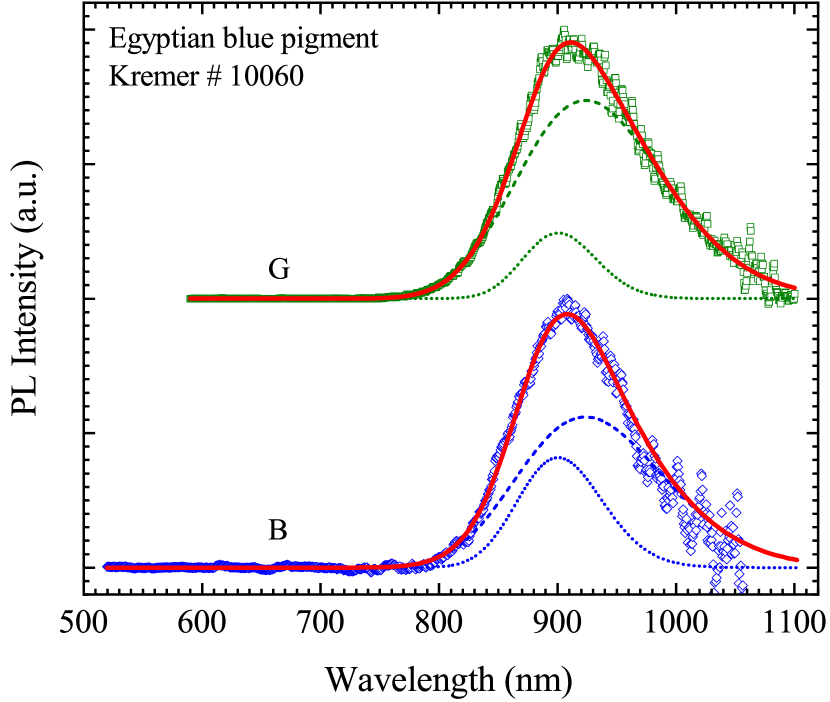
We have recorded PL spectra of the commercial Egyptian blue samples at a number of points of each sample and obtained similar results for them. Spectra of PL excited using the G and B bands (Fig. 2) nearly coincide; as it is seen in Fig. 5, they consist of the only spectral band peaking at the wavelength of about 910 nm. However, the deconvolution555We used Voigt functions for the peak analysis. of this band for PL excited by the G and B bands demonstrates that they are composed of two Gaussian spectral bands peaking at about 900 and about 923 nm somewhat differing in the ratio of maximum intensities for different excitation bands (Fig. 5).666The ratio of maximum intensities of the components peaking at 923 and 900 nm is for the G band and for the B band; the peak area ratios are and , respectively.
PL was not detected under the sample excitation by light from the other (BV, V or U) spectral ranges. This allows us to conclude that no other luminescent admixtures emitting visible or near infrared light are contained in the examined commercial Egyptian blue pigment that enables its utilization as a standard for the PL spectral analysis in these spectral ranges.
3.2 Analysis of samples from the painting by Robert Falk
3.2.1 SEM and EDS
| Chemical | Point number | Mean over | ||||||
|---|---|---|---|---|---|---|---|---|
| element | 51 | 52 | 53 | 54 | 55 | 56 | 57 | the map |
| Na | 9.53 | |||||||
| Al | 18.45 | 4.03 | 1.59 | 9.35 | ||||
| Si | 68.82 | 42.60 | 64.83 | 7.70 | ||||
| Ca | 15.51 | 12.20 | 13.61 | 2.78 | ||||
| Cr | 72.62 | 3.67 | 82.23 | 0.97 | 6.78 | |||
| Co | 1.87 | |||||||
| Cu | 13.08 | 18.54 | 12.58 | 1.70 | ||||
| Zn | 2.59 | 16.88 | 20.48 | 67.33 | 13.56 | 14.33 | 5.41 | 28.30 |
| Pb | 83.12 | 6.90 | 10.55 | 4.22 | 8.30 | 1.01 | 22.40 | |
| Chemical | Point number | Mean over | ||
|---|---|---|---|---|
| element | 171 | 172 | 173 | the map |
| Na | 12.58 | |||
| Al | 6.86 | 16.26 | ||
| Si | 69.45 | 68.89 | 44.87 | 9.09 |
| Ca | 15.23 | 16.56 | 12.63 | 1.48 |
| Co | 2.85 | |||
| Cu | 12.84 | 14.55 | 11.18 | |
| Zn | 1.22 | 10.08 | 25.36 | |
| Pb | 1.26 | 14.38 | 32.39 | |
Specimens taken from the samples obtained at the points # 5 and # 17 on the painting by Falk were examined using SEM operated in both SE and BSE modes.
Fig. 6 a presents a pair of such SEM images typical for the point # 5. As it is seen from the BSE image, the paint layer specimen is composed of particles of substances differing in their composition and sizes.
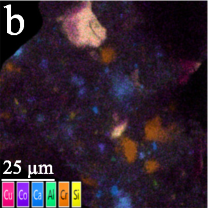
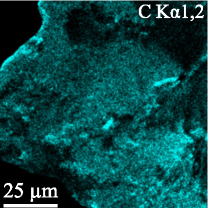
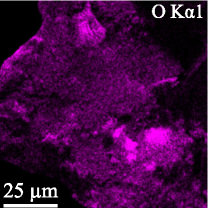
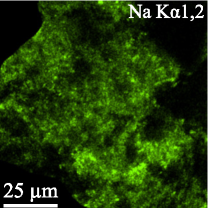
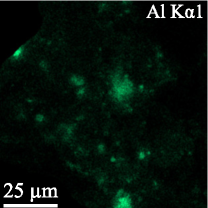
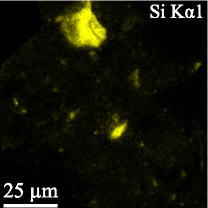
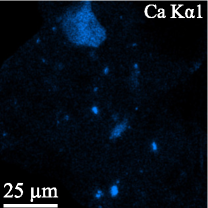
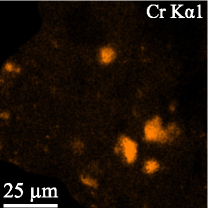
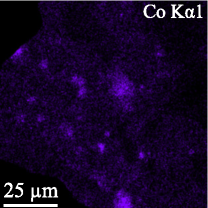
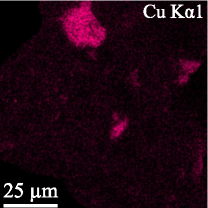
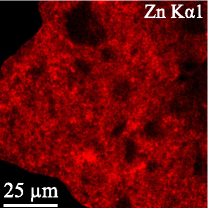
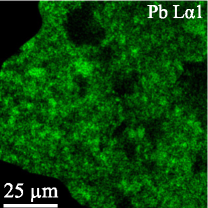
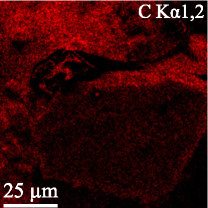
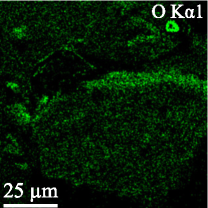
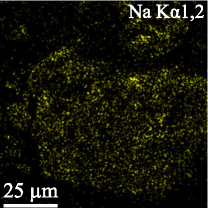
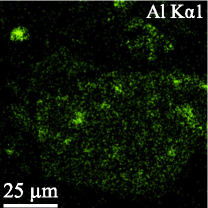
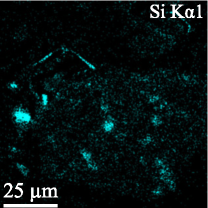
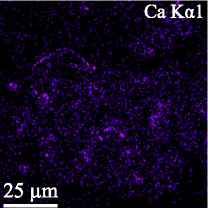
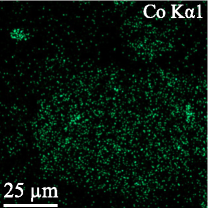
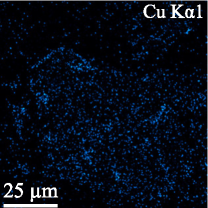
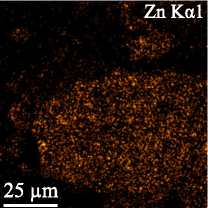
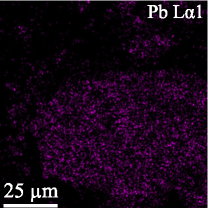
Maps of spatial distribution of X-ray bands corresponding to a number of chemical elements recorded using the SEM EDX spectrometer at the same areas on the specimen are shown in Fig. 6 b. The signal of the silicon K band is seen to spatially correlate with the signals of the calcium K, copper K and oxygen K bands in these maps. At the same time, it anti-correlates with the signals of the carbon K, sodium K and zinc K and lead L bands. No spatial correlation of this band was registered with the aluminum K, chromium K and cobalt K bands.
However, some domains of the map of the oxygen K band are seen to correlate with the map of the chromium K band. Besides, O K signal is seen to be distributed quite uniformly across the map as well as that of C K, Zn K and Pb L and all these signals correlate well with one another. Additionally, some bright features of the O K map coincide with some bright features of the C K map.
The signals of Al K and Co K also strongly correlate with one another. The Na K band is distributed quite homogeneously across the map with numerous tiny bright spots that are also spread rather uniformly in the map. The uniformity of the Na K distribution and the smallness of sizes of its bright features make it difficult to detect any correlation between this map and the rest ones. Nevertheless, some bright points in the Si K and Na K maps are seen to coincide (e.g., a couple of small bright spots at the center of the left edge of the Si K map and a pair of similar spots at the same place of the Na K map).
The multilayered map of the spatial distribution of the Cu, Co, Ca, Al, Cr and Si K X-ray bands clearly demonstrates the presence of compounds, which contain a combination of Co and Al and a combination Cu, Ca and Si, gathered in particles in this specimen. Besides, separate areas containing Cr are also seen in the map.
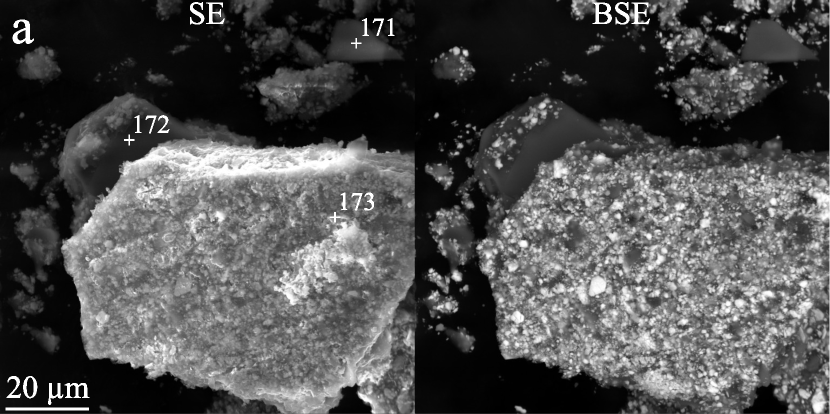
A pair of SEM SE and BSE images typical for the point # 17 is shown in Fig. 7. In general features, the composition of this paint layer specimen (see the BSE image in Fig. 7 a) looks similar to the composition of the specimen taken at the point # 5 (the BSE image in Fig. 6 a) with the exception of the sizes of most particles, which look somewhat smaller than those in the sample taken in the point # 5.
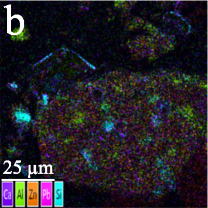
Maps of the X-ray bands distribution (Fig. 7 b) also demonstrate the same regularities as the maps of the sample from the point # 5. The maps of the Si K, Ca K and Cu K lines demonstrate coinciding features. Some features in the map of O K coincide on the specimen surface with the analogous features in the maps of Al K, Co K, Si K, Ca K and Cu K. Distributions of Zn K and Pb L are quite similar; they are distributed quite uniformly.
The multilayered map of the specimen from the point # 17 shows that, judging from the spatial distribution of the Ca K, Al K, Si K and Pb L X-ray bands, grains containing Si and particles of a substance containing Al are included in a quite uniformly distributed mixture of fine grains of compounds containing Pb or Zn.
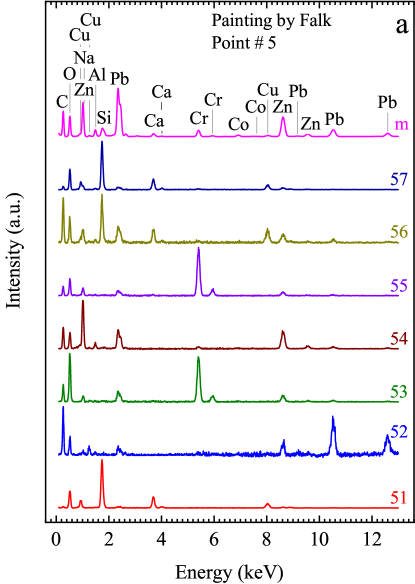
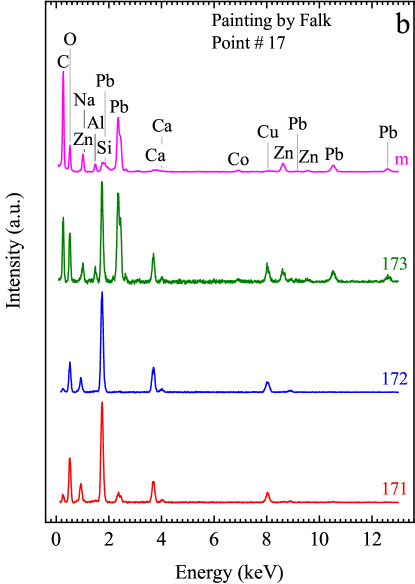
EDX spectra recorded at the points, indicated in Figs. 6 a and 7 a, are shown in the panels (a) and (b) of Fig. 8 for the points # 5 and # 17, respectively. They evidence the presence of C, O, Na, Al, Si, Ca, Cr, Co, Cu, Zn and Pb in detectable quantities in the point # 5 and the same set of elements except for Cr in the point # 17 on the painting by Falk. Semi-quantitative estimates of their content in the samples from both points are given in Tables 2 and 3. It is seen from the spectra and tables that different compounds are detected in different points of the elemental analysis.
They can be easily identified if elemental mapping and EDS analysis are combined with the polarizing optical microscopy.
3.2.2 Polarizing microscopy
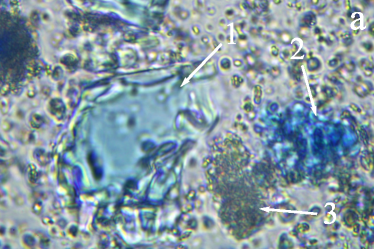
Preliminary studies of the samples # 5 and # 17 by PM microscopy show the presence of blue crystals, which optical properties correspond to Egyptian blue (see Section 3.1.3). However, in contrast to the commercial pigment, its color is much less intense (Fig. 9), likely due to thinner flakes. The particle sizes vary from large (3 to 10 µm) to coarse (10 to 40 µm) (Fig. 6 and 7).footnote 4 In addition, zinc white (ZnO), lead white (2PbCO3·Pb(OH)2 + PbCO3), synthetic ultramarine (Na7Al6Si6O24S3), cobalt blue (CoO·Al2O3) were identified in both samples, and viridian (Cr2O3·2H2O) in sample # 5.777The composition was determined based on both PM and the data of SEM-EDS (Figs. 6, 7 and 8; Tables 2 and 3). The ratio of these pigments in each sample is diverse and regulates the hue of the blue paint layer.
3.2.3 Photoluminescence
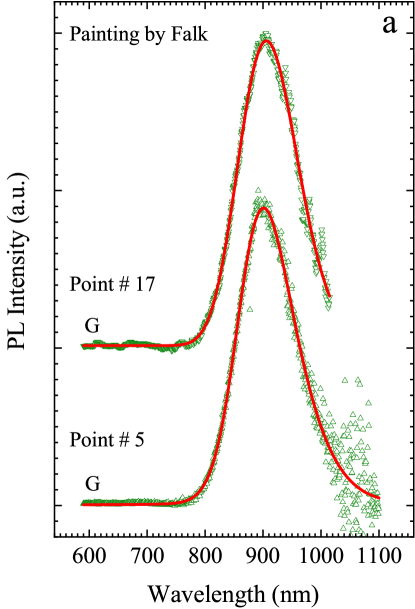
PL spectra recorded from different portions of the paint layer samples obtained at the points # 5 and # 17 of the painting by Falk (Fig. 1) demonstrate similar sets of features specific for each PE band (Fig. 10). The spectra obtained under the G-band PE (Fig. 2, Table 1) in the range from 590 to 1100 nm demonstrate a single band, peaked around 906 nm, which coincides with the band of the reference sample (Fig. 5) and for this reason is unequivocally attributed to Egyptian blue (Fig. 10 a).
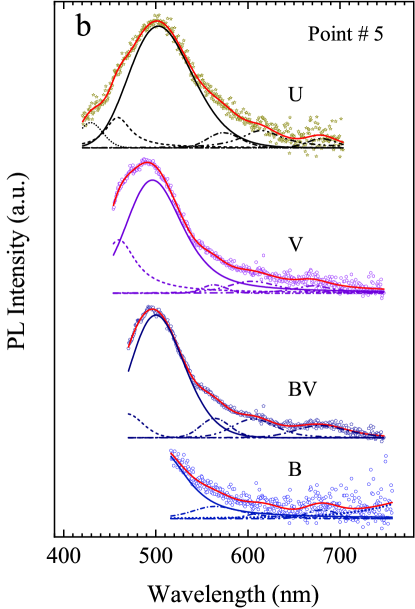
PL spectra obtained using the other PE bands are presented in Fig. 10 b. For each PE band, the spectra were recorded in the specific spectral range presented in Table 1. All the spectra consist of a broad spectral band peaked at nm composed of a predominating strong line and five weak lines on both sides of it (the spectra excited using the B-band show only the long-wavelength wing of this strong line). The strongest band is peaked at nm and the weak ones are peaked around 430, 460, 560–570, 610–620 and 680 nm (the parameters of the weak lines obtained from the deconvolution of the initial bands are determined with rather high degree of ambiguity).
Remark that only the spectra for the point # 5 are presented in Fig. 10 b. The spectra obtained for the point # 17 are similar to them but much more noisy because of somewhat lower intensity of PL excited using all the PE bands except for the band G. However, they demonstrate the same set of spectral lines as the spectra recorded at the point # 5 with a single predominating line at nm and five much weaker ones on both sides of it.
Note also that the B-band-excited PL of the samples from both points, like in the case of the reference sample of Egyptian blue, also demonstrates a spectral band at nm, but, due to much lower intensity, the recorded signal of this PL band is too noisy and for this reason is not shown in the spectrum obtained from the sample taken from the Falk's painting (Fig. 10 b).
3.3 Brief discussion
3.3.1 On the paint layer composition and the nature of its luminescence
The above analyses allow us to conclude that both of the samples from the painting by Falk contain close sets of pigments. The sample taken from the point # 17 contains lead white (2PbCO3·Pb(OH)2 + PbCO3) and zinc white (ZnO), artificial ultramarine (Na8-10Al6Si6O24S3), cobalt blue (CoO·Al2O3), and Egyptian blue (CaCuSi4O10).
The composition of the sample taken from the point # 5 is mainly similar to that of the sample from the point # 17. In addition to the pigments found in the latter sample, this one contains also viridian (Cr2O3·2H2O). Besides, it contains somewhat less amount of Egyptian blue. For this reason, paint in the point # 5 has somewhat greener tint than in the point # 17.
PL spectral analysis unambiguously proves the presence of Egyptian blue in the paint layer of the picture by Falk since the PL spectra obtained from the samples taken at both points (Fig. 10 a) demonstrate the intense emission at the characteristic PL band peaking at about 910 nm.
It should be noticed, however, that some earlier articles reported the position of the PL band characteristic to Egyptian blue nearly coinciding with the peak position presented in this work (e.g., nm at nm [34], nm at nm [40]). Others, on the contrary, reported a somewhat displaced PL band for this compound (e.g., nm at nm [39], nm [38]). Nevertheless, all those articles assigned these PL bands to the transition in Cu2+ ions.888The calcium copper silicate structure and a diagram of Cu2+ energy levels responsible for the light emission in their connection with the crystal structure are discussed, e.g., in Refs. [38, 39, 40, 41].
Moreover, the authors of Ref. [37], when investigated Ca, Ba and Sr copper silicates pigmented acrylic coatings, have demonstrated a broad PL band for calcium copper silicate situated in the interval from to nm. Its maximum gradually moved from to nm as the pigment concentration increased in the acrylic film. The band was obviously composed of a number of components that peaked in the range from to nm.
The issue of the characteristic peak position of calcium copper silicate and the changes in its position requires further investigations, which are, however, far beyond the scope of this article.
Besides the line of Egyptian blue presented in Fig. 10 a, the spectra plotted in Fig. 10 b show PL of some other pigments whose PL bands are peaked around 500 nm.
We ascribe this PL to mutually superimposed deep-level emission (DLE) bands in ZnO [57, 58, 59]. The intense cyan-green emission band of ZnO centered at nm ( eV) is often attributed to the electron transitions from oxygen vacancies (VO) to the valence band [59, 60, 61, 62, 63, 64]. Alternatively, it is assumed to be related to the emission of Cu2+ ion in a zinc lattice site [64].999Some other models of this emission are also reviewed in Ref. [64].
The weak DLE bands seen in Fig. 10 b are also described in the literature. The violet-blue emission band at nm ( eV) may be associated, e.g., with the electron transition from the zinc interstitial (Zni) level to that of zinc vacancy (VZn) [59, 63]. The DLE related blue band at nm ( eV) has not assigned thus far. However, since a considerable red shift of the deep-level PL maximum from to eV was observed with the growing sample temperature up to 150 K, the authors of Ref. [59] supposed that the deep-level related band was composed of two peaks, blue and cyan-green, with the former one dominating at the temperature K and the latter one at K. The greenish-yellow PL band peaking in the range from to nm ( eV) is likely related to the electron transitions from the conduction band to oxygen interstitials (Oi), whereas the orange band centered at 610 to 620 nm ( eV) may be assigned to the Zn Oi electron transitions [59]. The nature of red PL band at nm ( eV) is unknown at present [63, 64] although it is also assumed to be connected with defect-related DLE [65].
Note also that the emission band of hydrocerussite (2PbCO3·Pb(OH)2) also lies in the range 480 to 580 nm [57]. This band is probably superimposed on the ZnO DLE one.
Thus we can conclude that zinc and probably lead whites also contribute to the PL spectra of the samples emitting in the visible range at the wavelengths around 500 nm under B, BV, V and UV PE.
3.3.2 A remark on the provenance of Egyptian blue in the painting by Falk
We are sure that Egyptian blue detected in this painting can certainly be only of European provenance. The case is that, from the one hand, the manufacture of art materials was limited to only a small amount of paints of a rather poor color assortment at that period in Russia, which could not include such a rare pigment as Egyptian blue. On the other hand, it is well known that Russian artists preferred paints produced in Europe due to their higher quality. Despite there is no reliable information about Egyptian blue manufacturing in Europe in the beginning of 20th century, the oil paint based on this pigment was mentioned as `Bleu de Pompéi' in the Lefranc & Cie catalogue in 1930 [66, 67].101010Additionally, the same dry pigment, Pompeian Blue, according to Ref. [8], was presented in Lefranc & Cie, France, in 1929. It can be assumed that the paint was also being produced earlier, yet, it does not seem to be popular among artists. It may be the cause of the lack of Egyptian blue in artworks of the 20th century.
4 Conclusion
Summarizing the article let us present its main statements.
First, we have thoroughly analyzed the commercial Egyptian blue pigment produced by Kremer and found it suitable for utilization as a standard for PL spectral analysis. The characteristic emission band of CaCuSi4O10, which is used for the analysis, has been found to peak at the wavelength of about 910 nm. This band is composed of two components peaking at about 900 and 923 nm. The PL band is efficiently excited by green or blue incoherent light.
Second, we have detected Egyptian blue pigment in the paint layer of the ``Birch. Spring'' painting by Robert Falk (1907, oil on canvas, private collection). In addition, we have found the same pigment in the paints of the sketch drawn on the reverse side of the canvas. This is likely the first time that Egyptian blue has been discovered in 20th century paintings as well as in pieces of art of that period of time at all.
Finally, we should emphasize in conclusion that this study cogently demonstrates the micro PL spectral analysis to be an efficient tool for detecting luminescent pigments contained in paint layers of works of art. Excitation of pigment luminescence in paints of art pieces by incoherent light is effective. At the same time, application of light sources enabling the PE band selection in wide ranges, which are often available in PL microscopes, considerably enhances the pigment analysis possibilities that is especially important for examining compounds, which are characterized by selective PE of luminescence and their mixtures.
Acknowledgments
The research was accomplished under the collaboration agreement between GPI RAS and GOSNIIR.
Electronic supplementary material
Figure S1: Photographs of pages from the Lefranc & Cie catalogue of 1930: (a) the cover, (b) the title page and (c) the page 10 that contains the record about Egyptian blue (``Silicate de cuivre et de chaux. Bleu de Pompéi'').
Conflict of interest
None declared.
![[Uncaptioned image]](/html/2007.03716/assets/x45.png)
References
-
[1]
N. Easthaugh, V. Walsh, T. Chaplin, R. Siddall,
Pigment Compendium: A Dictionary
of Historical Pigments, Routledge, London, UK, 2004.
doi:10.4324/9780080473765.
URL https://doi.org/10.4324/9780080473765 -
[2]
J. Riederer,
Egyptian
blue, in: E. W. FitzHugh (Ed.), Artists' Pigments: A
Handbook of their History and Characteristics, Vol. 3, National Gallery of
Art, Washington, USA, 2012, pp. 21–46.
URL https://www.nga.gov/content/dam/ngaweb/research/publications/pdfs/artists-pigments-vol3.pdf -
[3]
H. Berke, The invention of blue and
purple pigments in ancient times, Chem. Soc. Rev. 36 (2007) 15–30.
doi:10.1039/B606268G.
URL http://doi.org/10.1039/B606268G -
[4]
M. G. Canti, J. L. Heathcote,
Microscopic Egyptian blue
(synthetic cuprorivaite) from sediments at two archaeological sites in West
Central England, J. Archaeol. Sci. 29 (8) (2002) 831–836.
doi:10.1006/jasc.2001.0717.
URL http://doi.org/10.1006/jasc.2001.0717 -
[5]
A. P. Laurie,
The
Materials of the Painter's Craft in Europe and Egypt: from Earliest Times to
the End of the XVIIth Century, with Some Account of Their Preparation and
Use, T. N. Foulis, London & Edinburgh, UK, 1910.
URL https://archive.org/details/cu31924016809927/page/n12/mode/2up -
[6]
M. Ganio, J. Salvant, J. Williams, L. Lee, O. Cossairt, M. Walton,
Investigating the use of
Egyptian blue in Roman Egyptian portraits and panels from Tebtunis,
Egypt, Appl. Phys. A 121 (3) (2015) 813–821.
doi:10.1007/s00339-015-9424-5.
URL https://doi.org/10.1007/s00339-015-9424-5 -
[7]
G. D. Hatton, A. J. Shortland, M. S. Tite,
The production technology of
Egyptian blue and green frits from second millennium BC Egypt and
Mesopotamia, J. Archaeol. Sci. 35 (6) (2008) 1591–1604.
doi:10.1016/j.jas.2007.11.008.
URL https://doi.org/10.1016/j.jas.2007.11.008 -
[8]
An
Atlas of Rare & Familiar Colour. The Harvard Art Museums'
Forbes Pigment Collection, Atelier Éditions, Los Angeles, California,
USA, 2017.
URL https://luciephotobookprize.com/submit/uploads/22290/51-1885-18/pdf/2bbb2c8a13987b0491d70b96f772d0cf.pdf -
[9]
D. D. T. Arrigoni, Colour
in Painting: Materials and Spirituality, Lulu Enterprises Inc., Egham, UK,
2015.
URL https://books.google.ru/books?id=9zrLCgAAQBAJ -
[10]
S. P. Diodato, Encaustic
Wall Painting: How to Execute an Encaustic Painting on a Terracotta Support
Following Recipes in Classical Sources, Ancient and medieval art techniques.
Handbooks, Nardini Editore, Florence, Italy, 2017.
URL https://books.google.ru/books?id=rIsmDwAAQBAJ -
[11]
E. Aloiz, J. G. Douglas, A. Nagel,
Painted plaster and glazed
brick fragments from Achaemenid Pasargadae and Persepolis, Iran, Heritage
Science 4 (1) (2016) 3.
doi:10.1186/s40494-016-0072-7.
URL https://doi.org/10.1186/s40494-016-0072-7 -
[12]
G. M. Ingo, A. Çilingiroğlu, G. D. Carlo, A. Batmaz, T. D. Caro,
C. Riccucci, E. I. Parisi, F. Faraldi,
Egyptian Blue cakes from
the Ayanis fortress (Eastern Anatolia, Turkey): micro-chemical and
-structural investigations for the identification of manufacturing process
and provenance, J. Archaeol. Sci. 40 (12) (2013) 4283–4290.
doi:10.1016/j.jas.2013.06.016.
URL https://doi.org/10.1016/j.jas.2013.06.016 -
[13]
Ö. Ormanci,
Non-destructive
characterization of Egyptian Blue cakes and wall painting fragments from
the east of Lake Van, Turkey, Spectrochim. Acta A 229 (2020) 117889.
doi:10.1016/j.saa.2019.117889.
URL https://doi.org/10.1016/j.saa.2019.117889 -
[14]
M. Panagiotaki, M. S. Tite, Y. Maniatis,
Egyptian
Blue in Egypt and beyond: the Aegean and the Near East, in:
P. Kousoulis, N. Lazaridis (Eds.), Proceedings of the Tenth International
Congress of Egyptologists, University of the Aegean, Rhodes 22–29 May 2008,
Vol. II of Orientalia Lovaniensia Analecta 241, Peeters, Leuven – Paris –
Bristol, CT, 2015, pp. 1769–1790.
URL https://www.peeters-leuven.be/detail.php?search_key=9789042925502 -
[15]
A. K. Marketou,
The
pigment production site of the ancient agora of Kos (Greece): Revisiting
the material evidence, Thiasos 8.1 (2019) 61–80.
URL http://www.thiasos.eu/wp-content/uploads/2019/06/02-2019-Marketou_20190610.pdf -
[16]
Y. I. Grenberg, S. A. Pisareva, A. B. Levstein,
The study of the paint
layer composition in the samples of mural paintings of Erebuni,
Preliminary report on research project (topic 7.3), The All-Union
Scientific-Research Institute for Restoration, Moscow, USSR, in Russian
(1982).
doi:10.13140/RG.2.2.25685.17129.
URL https://doi.org/10.13140/RG.2.2.25685.17129 -
[17]
S. A. Pisareva, V. N. Kireeva,
The
study of the paint layer composition in the samples of mural paintings of
Erebuni, in: Y. I. Grenberg (Ed.), Investigations of monumental painting
of Armenia and Novgorod, no. 6 in Culture and Arts in the USSR. Series:
Restoration of Historical and Cultural Monuments. Express Information, The
Lenin State Library of the USSR, Moscow, USSR, 1987, pp. 1–2, in Russian.
URL https://www.researchgate.net/publication/340129791_The_Study_of_the_paint_layer_composition_in_the_samples_of_mural_paintings_of_Erebuni_Issledovanie_sostava_krasocnogo_sloa_v_obrazcah_nastennyh_rospisej_iz_Erebuni -
[18]
R. Linn, E. H. Cline, A. Yasur-Landau,
The advantages of
visible induced luminescence technique for the investigation of
Aegean-style wall painting. A case study from Tel Kabri, Israel, in:
J. Becker, J. Jungfleisch, C. von Rüden (Eds.), Tracing Technoscapes.
The Production of Bronze Age Wall Paintings in the Eastern Mediterranean,
Sidestone Press, Leiden, The Netherlands, 2018, pp. 101–116.
URL https://www.sidestone.com/books/tracing-technoscapes -
[19]
J. Salvant, J. Williams, M. Ganio, F. Casadio, C. Daher, K. Sutherland,
L. Monico, F. Vanmeert, S. De Meyer, K. Janssens, C. Cartwright, M. Walton,
A Roman Egyptian painting
workshop: Technical investigation of the portraits from Tebtunis, Egypt,
Archaeometry 60 (4) (2018) 815–833.
doi:10.1111/arcm.12351.
URL https://doi.org/10.1111/arcm.12351 -
[20]
G. E. Veresotskaya,
Restoration
of a fragment of the ``Horsemen'' archaeological painting from Old Nisa,
in: Artistic Heritage. Conservation, Research, Restoration, no. 23(53), The
State Research Institute for Restoration, Moscow, Russia, 2006, pp. 166–174,
190, 191, Also in: ARTconservation, https://web.archive.org/web/20121111061508/http://art-con.ru/node/1222.
URL http://www.gosniir.ru/library/artistic-heritage/artistic-heritage-23.aspx -
[21]
M. M. Naumova, V. Y. Birshtein,
Comparison
of the paint layers characteristics and painting materials of three encaustic
icons from Kiev Museum of Eastern and Western Art, in: Artistic
Heritage. Conservation, Research, Restoration, no. 8(38), The All-Union
Research Institute for Restoration (VNIIR), Moscow, USSR, 1983, pp. 150–153,
in Russian.
URL http://www.gosniir.ru/library/artistic-heritage/artistic-heritage-08.aspx -
[22]
A. M. Rosenqvist,
Analyser
an skerd og skjold fra Bø-funnet (Analysis of sword and shield from
the Bø-find), Viking 23 (1959) 29–34.
URL https://www.duo.uio.no/bitstream/handle/10852/37585/1959-vol-23.pdf -
[23]
M. Nicola, L. M. Seymour, M. Aceto, E. Priola, R. Gobetto, A. Masic,
Late production of
Egyptian blue: synthesis from brass and its characteristics, Archaeol.
Anthrop. Sci. 11 (10) (2019) 5377–5392.
doi:10.1007/s12520-019-00873-w.
URL https://doi.org/10.1007/s12520-019-00873-w -
[24]
M. Nicola, M. Aceto, V. Gheroldi, R. Gobetto, G. Chiari,
Egyptian blue in the
Castelseprio mural painting cycle. Imaging and evidence of a
non-traditional manufacture, J. Archaeol. Sci. Rep. 19 (2018) 465–475.
doi:10.1016/j.jasrep.2018.03.031.
URL https://doi.org/10.1016/j.jasrep.2018.03.031 -
[25]
A. Lluveras, A. Torrents, P. Girález, M. Vendrell-Saz,
Evidence for the use
of Egyptian blue in an 11th century mural altarpiece by SEM–EDS, FTIR
and SR XRD (church of Sant Pere, Terrassa, Spain), Archaeometry 52 (2)
(2010) 308–319.
doi:10.1111/j.1475-4754.2009.00481.x.
URL https://doi.org//10.1111/j.1475-4754.2009.00481.x -
[26]
J. Bredal-Jørgensen, J. Sanyova, V. Rask, M. L. Sargent, R. H. Therkildsen,
Striking presence of
Egyptian blue identified in a painting by Giovanni Battista Benvenuto
from 1524, Anal. Bioanal. Chem. 401 (4) (2011) 1433–1439.
doi:10.1007/s00216-011-5140-y.
URL https://doi.org/10.1007/s00216-011-5140-y - [27] C. Minguzzi, Cuprorivaite: Un nuovo minerale, Period. Mineral. 9 (3) (1938) 333–345.
-
[28]
A. Pabst, Structures of some
tetragonal sheet silicates, Acta Cryst. 12 (10) (1959) 733–739.
doi:10.1107/S0365110X5900216X.
URL https://doi.org/10.1107/S0365110X5900216X -
[29]
F. Mazzi, A. Pabst,
Reexamination of
cuprorivaite, Am. Min. 47 (1962) 409–411.
URL http://www.minsocam.org/ammin/AM47/AM47_409.pdf -
[30]
B. C. Chakoumakos, J. A. Fernandez-Baca, L. A. Boatner,
Refinement of the structures of
the layer silicates MCuSi4O10 (M = Ca, Sr, Ba) by Rietveld
analysis of neutron powder diffraction data, J. Solid State Chem. 103 (1)
(1993) 105–113.
doi:10.1006/jssc.1993.1083.
URL http://doi.org/10.1006/jssc.1993.1083 -
[31]
W. Bensch, M. Schur, Crystal
structure of calcium copper phyllo-decaoxotetrasilicate,
CaCuSi4O10, Z. Kristallogr. Cryst. Mater. 210 (7) (1995) 530–530.
doi:10.1524/zkri.1995.210.7.530.
URL https://doi.org/10.1524/zkri.1995.210.7.530 -
[32]
Cuprorivaite.
CaCuSi4O10, in: J. W. Anthony, R. A. Bideaux, K. W. Bladh, M. C.
Nichols (Eds.), Handbook of Mineralogy, Vol. II, Mineralogical Society of
America, Chantilly, VA, USA, 2003.
URL http://www.handbookofmineralogy.org/pdfs/cuprorivaite.pdf -
[33]
Cuprorivaite, Hudson Institute of
Mineralogy, Keswick, VA, USA, dba Mindat.org (2019).
URL https://www.mindat.org/min-1189.html -
[34]
G. Accorsi, G. Verri, M. Bolognesi, N. Armaroli, C. Clementi, C. Miliani,
A. Romani, The exceptional
near-infrared luminescence properties of cuprorivaite (Egyptian blue),
Chem. Commun. 23 (2009) 3392–3394.
doi:10.1039/B902563D.
URL https://doi.org/10.1039/B902563D -
[35]
D. Ajò, G. Chiari, F. Zuane, M. Favaro, M. Bertolin,
Photoluminescence
of some Blue natural pigments and related synthetic materials, in:
Non-Destructive Testing, Budapest, Hungary, 1996.
URL https://www.researchgate.net/publication/317953199_Photoluminescence_of_some_Blue_natural_pigments_and_related_synthetic_materials -
[36]
P. A. M. Triolo, M. Spingardi, G. A. Costa, F. Locardi,
Practical application of
visible-induced luminescence and use of parasitic IR reflectance as
relative spatial reference in Egyptian artifacts, Archaeol. Anthrop. Sci.
11 (9) (2019) 5001–5008.
doi:10.1007/s12520-019-00848-x.
URL https://doi.org/10.1007/s12520-019-00848-x -
[37]
P. Berdahl, S. K. Boocock, G. C.-Y. Chan, S. S. Chen, R. M. Levinson, M. A.
Zalich, High quantum yield of the
Egyptian blue family of infrared phosphors (MCuSi4O10, M = Ca, Sr,
Ba), J. Appl. Phys. 123 (19) (2018) 193103.
doi:10.1063/1.5019808.
URL https://doi.org/10.1063/1.5019808 -
[38]
W. Chen, Y. Shi, Z. Chen, X. Sang, S. Zheng, X. Liu, J. Qiu,
Near-infrared emission and
photon energy upconversion of two-dimensional copper silicates, J. Phys.
Chem. C 119 (35) (2015) 20571–20577.
doi:10.1021/acs.jpcc.5b04819.
URL https://doi.org/10.1021/acs.jpcc.5b04819 -
[39]
G. Pozza, D. Ajò, G. Chiari, F. D. Zuane, M. Favaro,
Photoluminescence of the
inorganic pigments Egyptian blue, Han blue and Han purple, J. Cult.
Herit. 1 (4) (2000) 393–398.
doi:10.1016/S1296-2074(00)01095-5.
URL https://doi.org/10.1016/S1296-2074(00)01095-5 -
[40]
S. M. Borisov, C. Würth, U. Resch-Genger, I. Klimant,
New life of ancient pigments:
Application in high-performance optical sensing materials, Anal. Chem.
85 (19) (2013) 9371–9377.
doi:10.1021/ac402275g.
URL https://doi.org/10.1021/ac402275g - [41] T. E. Warner, Artificial cuprorivaite CaCuSi4O10 (Egyptian blue) by a salt-flux method, in: Synthesis, Properties and Mineralogy of Important Inorganic Materials, Wiley, UK, 2011, Ch. 3, pp. 26–49.
-
[42]
D. Johnson-McDaniel, C. A. Barrett, A. Sharafi, T. T. Salguero,
Nanoscience of an ancient pigment,
J. Am. Chem. Soc. 135 (2013) 1677–1679.
doi:10.1021/ja310587c.
URL https://doi.org/10.1021/ja310587c -
[43]
D. Johnson-McDaniel, S. Comer, J. W. Kolis, T. T. Salguero,
Hydrothermal formation of
calcium copper tetrasilicate, Chem. Eur. J. 21 (49) (2015)
17560–17564.
doi:10.1002/chem.201503364.
URL https://doi.org/10.1002/chem.201503364 -
[44]
D. Johnson-McDaniel, T. T. Salguero,
Exfoliation of Egyptian blue and
Han blue, two alkali earth copper silicate-based pigments, J. Vis.
Exp. (86) (2014) e51686.
doi:10.3791/51686.
URL http://www.jove.com/video/51686 -
[45]
Y. Chen, M. Kan, Q. Sun, P. Jena,
Structure and properties
of egyptian blue monolayer family: XCuSi4O10 (X = Ca, Sr, and
Ba), J. Phys. Chem. Lett. 7 (3) (2016) 399–405.
doi:10.1021/acs.jpclett.5b02770.
URL https://doi.org/10.1021/acs.jpclett.5b02770 -
[46]
B. Errington, G. Lawson, S. W. Lewis, G. D. Smith,
Micronised egyptian blue
pigment: A novel near-infrared luminescent fingerprint dusting powder, Dyes
Pigm. 132 (2016) 310–315.
doi:10.1016/j.dyepig.2016.05.008.
URL https://doi.org/10.1016/j.dyepig.2016.05.008 -
[47]
I. N. Shibanova, S. A. Pisareva, Y. V. Chaykina,
Electron
microscopy as one of the methods in the examination of paintings, in: The
XXVII Russian Conference ``Modern Methods of Electron and Probe Microscopy
in Studies of Organic, Inorganic Nanostructures and Nano-Biomaterials''
(RCEM–2018), August 28–30, 2018, Chernogolovka, Moscow Region, Russia, Book
of Abstracts, Vol. 2, FNIC ``Crystallography and Photonics'', Moscow, Russia,
2018, pp. 114–115, in Russian.
URL https://www.crys.ras.ru/document/RCEM-2018/RCEM-2018_abstracts_volume_2_(conference).pdf -
[48]
A. Besançon, R. R. Falk
(1886 – 1958), Cahiers du Monde Russe et Soviétique 3 (4) (1962)
564–581.
doi:10.3406/cmr.1962.1527.
URL https://doi.org/10.3406/cmr.1962.1527 - [49] D. Sarabjanow, Robert Falk. Mit einer Dokumentation, Briefen, Gesprächen, Lektionen des Künstlers und einer biographischen Übersicht, herausgegeben von A. W. Stschekin-Krotowa, Verlag der Kunst, Dresden, DDR, 1974, in German.
- [50] R. R. Falk, A. V. Shchekin-Krotova (ed.), Conversations about art. Letters. Memories about the artist, Soviet Artist, Moscow, USSR, 1981, in Russian.
- [51] A. V. Shchekin-Krotova, My Falk, HGS, Moscow, Russia, 2005, in Russian.
-
[52]
D. V. Sarabyanov, Y. I. Didenko,
Painting by Robert
Falk: A complete catalog of works, Computer Press, Moscow, Russia, 2006, in
Russian.
URL https://books.google.com/books?id=RGVHAQAAIAAJ - [53] B. E. Warren, X-ray Diffraction, Addison–Wesley, Reading, MA/Dover, Mineola, NY, USA, 1969.
-
[54]
L. Rampazzi, C. Corti,
Are commercial
pigments reliable references for the analysis of paintings?, Int. J.
Conserv. Sci. 10 (2) (2019) 207–220.
URL http://www.ijcs.uaic.ro/public/IJCS-19-19_Rampazzi.pdf -
[55]
N. Easthaugh, V. Walsh, T. Chaplin, R. Siddall,
Pigment Compendium: Optical
Microscopy of Historical Pigments, Routledge, London, UK, 2005.
doi:10.4324/9780080454573.
URL https://doi.org/10.4324/9780080454573 -
[56]
R. L. Feller, M. Bayard,
Terminology
and procedures used in the systematic examination of pigment particles with
the polarizing microscope, in: R. L. Feller (Ed.), Artists'
Pigments: A Handbook of their History and Characteristics, Vol. 1, National
Gallery of Art, Washington, USA, 1986, pp. 285–298.
URL https://www.nga.gov/content/dam/ngaweb/research/publications/pdfs/artists-pigments-vol1.pdf -
[57]
M. Ghirardello, G. Valentini, L. Toniolo, R. Alberti, M. Gironda, D. Comelli,
Photoluminescence imaging
of modern paintings: there is plenty of information at the microsecond
timescale, Microchem. J. 154 (2020) 104618.
doi:10.1016/j.microc.2020.104618.
URL https://doi.org/10.1016/j.microc.2020.104618 -
[58]
A. Artesani, F. Gherardi, A. Nevin, G. Valentini, D. A. Comelli,
Photoluminescence study of the
changes induced in the zinc white pigment by formation of zinc complexes,
Materials 10 (4) (2017) 340.
doi:10.3390/ma10040340.
URL https://doi.org/10.3390/ma10040340 -
[59]
C. H. Ahn, Y. Y. Kim, D. C. Kim, S. K. Mohanta, H. K. Cho,
A comparative analysis of deep level
emission in ZnO layers deposited by various methods, J. Appl. Phys.
105 (1) (2009) 013502.
doi:10.1063/1.3054175.
URL https://doi.org/10.1063/1.3054175 -
[60]
S.-H. Jeong, B.-S. Kim, B.-T. Lee,
Photoluminescence dependence of
ZnO films grown on Si(100) by radio-frequency magnetron sputtering on the
growth ambient, Appl. Phys. Lett. 82 (16) (2003) 2625–2627.
doi:10.1063/1.1568543.
URL https://doi.org/10.1063/1.1568543 -
[61]
F. K. Shan, G. X. Liu, W. J. Lee, B. C. Shin,
The role of oxygen vacancies in
epitaxial-deposited ZnO thin films, J. Appl. Phys. 101 (5) (2007) 053106.
doi:10.1063/1.2437122.
URL https://doi.org/10.1063/1.2437122 -
[62]
A. B. Djurišić, Y. H. Leung, K. H. Tam, Y. F. Hsu, L. Ding, W. K.
Ge, Y. C. Zhong, K. S. Wong, W. K. Chan, H. L. Tam, K. W. Cheah, W. M. Kwok,
D. L. Phillips, Defect
emissions in ZnO nanostructures, Nanotechnology 18 (9) (2007) 095702.
doi:10.1088/0957-4484/18/9/095702.
URL {https://doi.org/10.1088/0957-4484/18/9/095702} -
[63]
K. H. Tam, C. K. Cheung, Y. H. Leung, A. B. Djurišić, C. C. Ling,
C. D. Beling, S. Fung, W. M. Kwok, W. K. Chan, D. L. Phillips, L. Ding, W. K.
Ge, Defects in ZnO nanorods
prepared by a hydrothermal method, J. Phys. Chem. B 110 (42) (2006)
20865–20871.
doi:10.1021/jp063239w.
URL https://doi.org/10.1021/jp063239w -
[64]
Ü. Özgür, Y. I. Alivov, C. Liu, A. Teke, M. A. Reshchikov,
S. Doğan, V. Avrutin, S.-J. Cho, H. Morkoç,
A comprehensive review of ZnO
materials and devices, J. Appl. Phys. 98 (4) (2005) 041301.
doi:10.1063/1.1992666.
URL https://doi.org/10.1063/1.1992666 -
[65]
A. El Hichou, M. Addou, J. Ebothé, M. Troyon,
Influence of deposition
temperature (), air flow rate () and precursors on
cathodoluminescence properties of ZnO thin films prepared by spray
pyrolysis, J. Lumin. 113 (3) (2005) 183–190.
doi:10.1016/j.jlumin.2004.09.123.
URL https://doi.org/10.1016/j.jlumin.2004.09.123 - [66] Fabrique de Couleurs & Vernis. Couleurs Fines et Matériel pour la Peinture a l'Huile, Lefranc, Paris, France, 1930, Ch. Couleurs extra-fines en tubes, p. 10.
- [67] Y. I. Grenberg, S. A. Pisareva, Oil Paints of the XX Century and Examination of Works of Art. Composition, Disclosure, Commercial Production and Investigation of Paints, Zerkalo Mira, Moscow, Russia, 2010, in Russian.