A Compton-thick nucleus in the dual active galactic nuclei of Mrk 266
We present the results from our analysis of NuSTAR data of the luminous infrared galaxy Mrk 266, which contains two nuclei, south-western (SW) and north-eastern (NE), which were resolved in previous Chandra imaging. Combining this with the Chandra data, we intepret the hard X-ray spectrum obtained from a NuSTAR observation to result from a steeply rising flux from a Compton-thick active galactic nuclei (AGN) in the SW nucleus which is very faint in the Chandra band, confirming the previous claim. This hard X-ray component is dominated by reflection, and its intrinsic 2-10 keV luminosity is likely to be erg s-1. Although it is bright in soft X-ray, only a moderately absorbed NE nucleus has a 2-10 keV luminosity of erg s-1, placing it in the low-luminosity AGN class. These results have implications for understanding the detectability and duty cycles of emission from dual AGN in heavily obscured mergers.
Key Words.:
X-rays: galaxies - Galaxies: active - Galaxies:individual (Mrk 266)1 Introduction
Mrk 266 (= NGC 5256) is a major merger of two galaxies with nearly equal masses with a nuclear separation of 10 arcsec, corresponding to a projected physical distance of 6 kpc at . It is a luminous infrared galaxy (LIRG) with and is a member of the Great Observatories All-sky LIRG Survey (GOALS, Armus et al. 2009). While a significant portion of the large IR luminosity originates in intense star formation, both galaxies host active galactic nuclei (AGN). Dual AGN in galaxy mergers are relatively rare in infrared-selected samples such as GOALS (four out of 54 multiple systems, Iwasawa et al. 2011; Torres-Albà et al. 2018; Iwasawa et al. 2018); this is likely due to heavy obscuration making the dual AGN difficult to detect as opposed to the absence of them. Mrk 266 provides a good opportunity for a detailed study of dual AGN in a luminous IR system. The two AGN, as described in this paper, are, however, found to have rather different characteristics despite their similar host galaxy masses; additionally, heavy obscuration does indeed play a significant role.
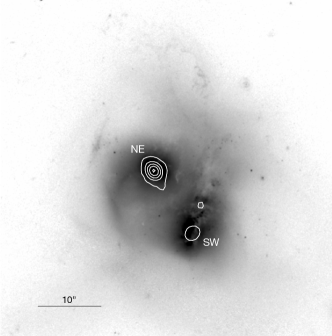
Following the extensive multiwavelength analysis of Mrk 266 presented by Mazzarella et al. (2012, hearafter MIV12), here, we give a brief summary of known properties focusing on the two active nuclei residing in the south-western (SW) and north-eastern (NE) galaxies. The galaxies have comparable masses of around (5-6), from which the black hole mass of each nucleus is estimated to be , based on their bulge luminosities (Marconi & Hunt 2003). The individual galaxies have of (SW) and (NE). This seems to be compatible with the Herschel imaging at 70 m and 100 m, which marginally resolves them (Chu et al. 2017). While there is confusion surrounding the reversed classifications given in the literature, the most likely optical classifications of the SW and NE nuclei are Seyfert 2 and LINER, respectively, as supported by works either dedicated to Mrk 266 or small samples including Mrk 266 (Osterbrock & Dahari 1983; Kollatschny & Fricke 1984; Hutchings et al. 1988; Mazzarella & Boroson 1993; Osterbrock & Martel 1993; Wang et al. 1997; Wu et al. 1998; Ishigaki et al. 2000). The mid-IR spectroscopy with the Spitzer IRS, as summarised by MIV12 (references are therein), shows that the spectra of both nuclei are dominated by polycyclic aromatic hydrocarbon (PAH) emission, indicating an intense starburst. However, the presence of AGN is also suggested by high-ionisation lines, such as [Ne v]m, and [O iv]m for the SW nucleus and warm dust continuum for the NE nucleus (see also Imanishi et al. 2009). A Chandra observation, which resolves the two nuclei, shows that a hard-spectrum source is clearly seen at the NE nucleus (Fig. 1), supporting the presence of a moderately obscured AGN with cm-2 (Brassington et al. 2007; MIV12 ; Torres-Albà et al. 2018). On the other hand, the SW nucleus is 13 times fainter than the NE nucleus and barely detected in the Chandra hard-band (4-7 keV) image (Fig. 1). The SW nucleus is also fainter than the NE nucleus in the optical and ultraviolet (UV), but it becomes progressively brighter at longer wavelengths m, leading to the SW nucleus to be 3 times more luminous than the NE nucleus in the entire IR band. The molecular gas mass in the SW nucleus is estimated to be M(H, which is 5 times larger than that of the NE nucleus (Imanishi et al. 2009). Even though these measurements were obtained from interferometric observations, they are consistent with the single-dish measurement by Sanders et al. 1986. These characteristics suggest that obscuration might be responsible for the relative faintness of the SW nucleus in X-rays. The XMM-Newton spectrum of Mrk 266, which does not resolve the individual galaxies, shows a strong Fe K line (MIV12 ). No Fe K line is present in the Chandra spectrum of the NE nucleus, but there is one in the spectrum of the SW nucleus (the Fe K line is, in fact, the major source of 4-7 keV counts detected with Chandra). This led MIV12 to suspect that the SW nucleus contains a Compton-thick AGN, in which the direct X-ray continuum is totally suppressed in the Chandra bandpass and only the Fe K line in its reflected light is observed. It is reminiscent of the double nucleus in another merger system in GOALS, Mrk 273, in which a Compton-thick nucleus is inferred for the nothern nucleus, which is molecular-rich, and the major IR source of the merger system (e.g. U et al. 2013; Iwasawa et al. 2011, 2018; Liu et al. 2019). In this paper, we examine this hypothesis for Mrk 266 using new NuSTAR data which cover the 3-50 keV band, expecting a sharp rise in the X-ray flux of the SW nucleus above 10 keV, which would exceed the flux from the NE nucleus in the NuSTAR band. The cosmology adopted here is km s-1 Mpc-1, , .
2 Observations
| Observatory | Date | ObsID | Exposure | Counts | Band |
|---|---|---|---|---|---|
| Chandra | 2001-11-02 | 2044 | 20 | 124 | 3-8 keV |
| XMM-Newton | 2002-05-15 | 0055990501 | 13/18 | 562 | 3-10 keV |
| NuSTAR | 2019-02-08 | 60465005002 | 64 | 441 | 3-50 keV |
Mrk 266 was observed with NuSTAR, XMM-Newton, and the Chandra X-ray Observatory and the observation log is shown in Table 1. The NuSTAR data were taken as part of the NuSTAR Obscured Seyferts Survey (PI: J. Miller) and we retrieved the data from the public archive. We used the event file processed by the standard pipeline. Spectral data extracted from a circular aperture with a radius of 30′′ of the two focal plane modules, FPMA and FPMB, were combined for the analysis presented below. The spectral data of the two modules are in agreement with each other within a statistical error, and the low-energy effective area problem reported for FPMA (Madsen et al. 2020) seems to have little impact. Since the NE and SW nuclei are unresolved with the NuSTAR beam, the spectrum contains emission from both nuclei, as in the XMM-Newton spectrum. The spectral data obtained from XMM-Newton and Chandra are the same as those presented in MIV12 .
3 Results
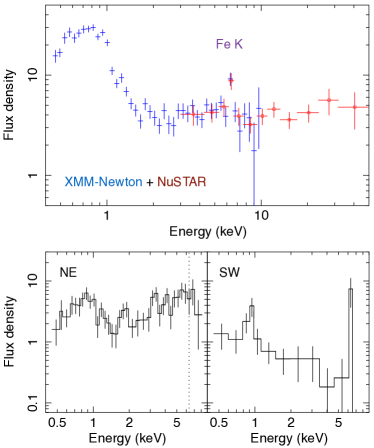
The NuSTAR spectrum is in agreement with the XMM-Newton EPIC spectrum in the overlapping 3-10 keV band, both in continuum and the Fe K line (Fig. 2). The 3-50 keV NuSTAR spectrum can be well described by a power-law of energy index 222We used energy-index for a power-law spectral slope since it is appropriate for the flux density spectra shown in this article. It is related to the conventional photon index by . plus a narrow Gaussian line at keV for Fe K ( for 51 degrees of freedom). The Fe line intensity is ph cm-2 s-1, corresponding to EW keV.
A hard spectrum with a slope, as observed at lower energies, would be interpreted as evidence of moderate absorption of cm-2 since an intrinsic AGN spectrum is known to have a well-defined range of slope around with a standard deviation of (e.g. Ueda et al. 2014; Nandra & Pounds 1994). The measured spectral slope, , which stretches up to 50 keV, is, however, unusual because a spectral slope would start to approach the intrinsic value towards higher energies as the effect of such moderate absorption diminishes. Therefore, it is unlikely that a single source, that is the NE nucleus, dominates the NuSTAR bandpass as it does in the 4-7 keV Chandra image. Instead, the NuSTAR spectrum strongly suggests, besides the NE source, the presence of an extra component rising above the Chandra bandpass, which elevates the hard band continuum emission. This is the same line of reasoning used to convey the presence of a Compton-thick AGN in the northern nucleus of Mrk 273 using NuSTAR data (Iwasawa et al. 2018). As argued in MIV12 , the SW nucleus is a likely source of this extra hard component, which can be attributed to a Compton-thick AGN.
| NE | ||
| SW | ||
| SW-A | SW-R | |
| Fe K line | ||
| /dof | 46.8/50 | 45.9/51 |
| Band | NE | SW |
|---|---|---|
| SW-A | ||
| 3-10 keV | 2.4 | 0.15 |
| 10-30 keV | 3.1 | 4.2 |
| SW-R | ||
| 3-10 keV | 2.1 | 0.45 |
| 10-30 keV | 2.7 | 4.9 |
According to the above hypothesis, we modelled the NuSTAR spectrum with two components from the NE and SW nuclei. To avoid over-fitting, we tested the two-component model, leaving a minimum set of parameters free. Many model parameters were set to reasonable or known values. A first assumption is that both X-ray sources in the NE and SW nuclei have the identical, standard AGN slope of . This is the intrinsic slope of the power-law source, not the apparent slope of mentioned above, which is affected by a contribution of reflection from a surrounding medium, as is found in Nandra & Pounds (1994).
The NE spectrum is mildly absorbed. The absorbing column density is found to be cm-2 by fitting the Chandra NE spectrum and we adopted the best-fit . This leaves the normalisation of the power-law as the only free parameter for the NE component.
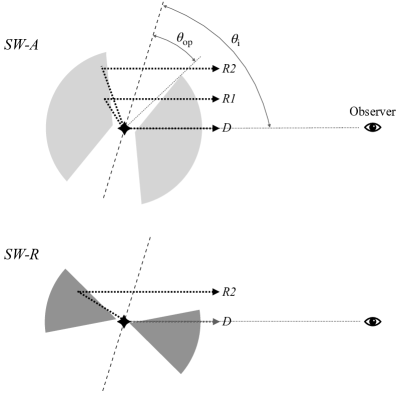
We are primarily interested in the SW component. However, as shown below, various configurations of a Compton-thick torus can describe the NuSTAR spectrum, as long as cm-2 is met. Therefore we tested the following two modelling options for a Compton-thick AGN: SW-A, which is a strongly absorbed spectrum, and SW-R, which is a reflection-dominated spectrum. In both cases, we used etorus (Ikeda et al. 2009; Awaki et al. 2009), which is one of the Monte-Carlo codes, to compute X-ray spectra emerging from an X-ray source surrounded by an absorber with a torus geometry, including Compton-scattered light. The etorus offers flexible parameterisations of torus geometry which are similar to those in another recent code borus02 (Baloković et al. 2018); additionally, Baloković et al. (2018) report that the two codes produce well-matched reflection spectra, apart from fluorescent emission-lines, which are not included in the current version of etorus. We modelled the most prominent Fe K line with a narrow Gaussian. The torus parameters were chosen so that a resulting model gives a representative spectral shape for each option. They are illustrated in Fig. 3 (see Figures 3 and 4 from Ikeda et al. 2009 for a visualisation of the simulated spectral components). Since the line-of-sight is obscured, the absorbing torus is expected to be highly inclined and we assume its inclination angle to be , which is approximately in the middle of the - range. In SW-A, a relatively narrow torus-opening angle of is assumed so that the inner surface of the torus is hardly visible and thus the observed spectrum is dominated by an absorbed component of the central source. The absorbing column and the power-law normalisation were fitted. The absorbing column density is found to be cm-2. In SW-R, a wide opening angle of and a large cm-2 were assumed. This results in a spectrum being reflection dominated since the highly Compton-thick opacity assures that the direct light from the central source is strongly suppressed and that it has a negligible contribution to the observed spectrum. Whereas the wide makes the inner wall of the torus well exposed to our view; however, the central source is still hidden from direct view by a small margin of . The only free parameter is the power-law normalisation.
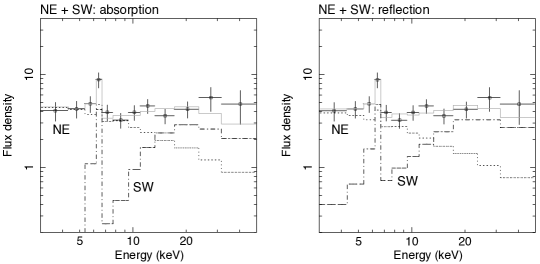
These spectral modellings are good matches for the NuSTAR data with a comparable quality, as is shown in Fig. 4 and Table 2. The Fe K line EW is found to be keV with respect to the total continuum. We note that depending on the SW modelling options, decomposed fluxes of the NE and SW nuclei vary (Table 3).
The NuSTAR data cannot distinguish between SW-A and SW-R. The primary reason is that, although the spectral models for the SW nucleus that were expected from SW-A and SW-R differ at some degree at energies below the Fe K band (see Fig. 4), this difference is compensated for by varying normalisation of the NE model. Here we investigate if the Chandra data of the SW nucleus can tell the difference between SW-A and SW-R, albeit with low source counts. The Chandra data for the SW nucleus have only six counts in 3-7 keV and there are no counts at higher energies; the six counts are composed of four counts for the Fe K line and two counts in the 4-5 keV continuum. The SW-A model has a sharp decline below 6 keV and its expected count rate in 4-5 keV is ct s-1 while the SW-R model has a Compton-scattered tail towards lower energies giving an expected count rate of ct s-1. The observed count rate ct s-1lies closer to the latter. Among 1000 simulations of Chandra data based on the absorption model, there were no incidences of two or more counts in 4-5 keV, which, in contrast, occur for 19% of simulations under the reflection model. This seems to favour the refelction model unless the 4-5 keV counts come from any other external sources, for example, X-ray binary emission from a starburst, which cannot be ruled out.
Estimating an intrinsic 2-10 keV luminosity, , of an absorbed X-ray source is straightforward when its absorption opacity is significantly smaller than a Thomson depth or cm-2. For example, in the case of the NE X-ray source, is (3.8-4.4) erg s-1, depending on the choice of the spectral model for the SW nucleus. In the Compton-thick regime, the absorption correction has a dependency on an assumed torus geometry (Matt et al. 1999). This applies to the absorption-dominated model (SW-A) for the SW nucleus. In our assumed torus geometry, which has a large covering fraction (Table 2), (SW) erg s-1. However, a similar absorption-dominated spectrum can be obtained with a smaller covering torus with, for instance, if the torus is precisely edge-on (). In this configuration, since less light is Compton-scattered into the line of sight from a small-covering torus than from that of large-covering, the (absorbed) illuminating source has to be more luminous, resulting in a factor of larger (SW) of erg s-1. This is a special configuration and it sets the upper bound of for SW-A.
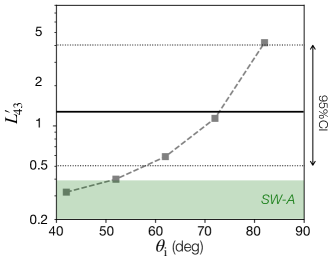
Uncertainty in the intrinsic luminosity estimate is even larger when observed light is reflection-dominated as no direct light from the obscured source is visible. In the SW-R model, and are assumed, but as long as is maintained, - gives a similar quality of fit. However, since the visible surface of the torus inner wall becomes small as the torus inclination increases (while the spectral shape of reflected light remains similar), the illuminating source needs to be more luminous to produce the same reflection luminosity and vice versa, as is shown in Fig. 5. For , the instrinsic luminosity was estimated to be erg s-1, but it could be smaller if were smaller. At a given , decreasing also makes the visible reflection surface smaller and thus pushes the illuminating luminosity up. However, if is too small, it would loose the quality of fit for the NuSTAR data due to a mismatch in the Fe K absorption edge depth; a small results in a relative increase in reflection light coming through the torus over directly visible reflection leading to a deeper Fe K edge, which overestimates the observed edge depth. For , we obtained a constraint of (the 90% lower limit). By decreasing , the data start to favour the absorption-dominated spectrum with a smaller , as is similar to what was obtained in SW-A. Thus, although there is a small forbidden area in the parameter space, various combinations of the torus parameters are possible to describe the NuSTAR spectrum. Accordingly, the 2-10 keV intrinsic luminosity of the obscured nucleus in SW, (SW), could range from erg s-1 to erg s-1.
4 Discussion
| log | log | log | log () | |
|---|---|---|---|---|
| NE | 41.60 | 42.80 | ||
| SW | 43.13 | 44.43 |
Our analysis of the NuSTAR spectrum suggests that the SW nucleus contains a Compton-thick nucleus, which is intrinsically more luminous than the NE nucleus, as speculated by MIV12 . Before examining their AGN properties in turn, some basic parameters of the two nuclei are summarised. The black hole masses for the two nuclei, which were estimated from their host spheroid luminosities, are similarly , for which the Eddington luminosity is erg s-1. The IR luminosity estimated for the NE and SW nuclei are erg s-1 and erg s-1. The AGN bolometric luminosity estimated from X-ray where is the X-ray bolometric correction, along with the Eddington ratio , and the AGN and IR luminosity ratio for each nucleus, as discussed below, are given in Table 4.
4.1 SW nucleus
As shown in Sect. 3, the SW nucleus is likely a Compton-thick AGN with cm-2, but the intrinsic X-ray luminosity of the heavily obscured source remains uncertain between erg s-1 and erg s-1. AGN-related mid-IR diagnostics seem to have a close relation to AGN bolometric power (e.g. Gruppioni et al. 2016). Since some of them have been reported to have a good correlation directly with intrinsic X-ray emission, we examine their predictions for below.
On account of being dust re-radiation from an obscuring torus, the mid-infrared continuum emission of AGN has been found to tightly correlate with the intrinsic 2-10 keV luminosity (Lutz et al. 2004; Horst et al. 2008; Gandhi et al. 2009; Mateos et al. 2015). However, one difficulty is isolating an AGN component from other continuum sources at the same wavelength. In Mrk 266, the available mid-IR photometric data were obtained from apertures with greater than a few arcsecs of the Spitzer-IRAC or IRAS, and we faced the difficulty mentioned above. First, we directly adopted the available photometric data, which gives an upper limit on . From the SED given in Fig. 9 of MIV12 , luminosities of the SW nucleus at 6 m and 12 m were estimated to be erg s-1 and erg s-1, respectively. Using the correlation for 6 m by Mateos et al. (2015), erg s-1 was obtained, where denotes the AGN fraction at the mid-IR wavelength. Similarly, the correlation for 12 m of Gandhi et al. (2009) gave erg s-1. We note that Mateos et al. (2015) and Gandhi et al. (2009) used distinct samples of AGN and their scaling-relations were calibrated independently. The AGN fraction, , in the SW nucleus was estimated using various mid-IR diagnostics (MIV12 ; Díaz-Santos et al. 2017) but the obtained values of spread widely, likely due to aperture effects. Here, we tentatively adopt the median of the six diagnostics, , which yields estimates of erg s-1 and erg s-1, based on and , respectively.
Another X-ray luminosity estimator is the [O iv] m emission line, which also shows a tight correlation with (Meléndez et al. 2008; Rigby et al. 2009; Diamond-Stanic et al. 2009; Liu et al. 2014). As [O iv] is a high-excitation line, which likely arises from AGN irradiation, it should be largely free from external contamination (Pereira-Santaella et al. 2010), unlike the continuum emission; therefore, it directly scales with the AGN luminosity. Being a mid-IR line, it is also relatively robust against dust extinction. Therefore it is deemed to give a reliable estimate of the AGN intrinsic luminosity. The [O iv] flux measured with the IRS aperture only for the SW nucleus is available (MIV12 ; Bernard-Salas et al. 2009), which gives [O iv] luminosity of erg s-1. The [Oiv]- correlation of Liu et al. (2014) for Seyfert 2 galaxies gives erg s-1.
The above three predictions for from the mid-IR features all lie around erg s-1 and within the range inferred by the modelling of the NuSTAR data. This supports the reflection-dominated spectrum of SW-R for modelling the data (see Fig. 5). By combining these estimates, we looked into the most likely value of (SW) and its uncertainty and then assessed how probable the reflection-dominated hypothesis might be. We label the X-ray and the mid-IR estimates as E (), where E0 is NuSTAR spectral modelling, E1 is m based, E2 is m based, and E3 is [O iv] based. In E0, we assume that log is equally likely between 42.3 and 43.6 [erg s-1], or E0. The mid-IR features-based estimates have uncertainties due to scatter around each correlation: 0.4 dex for E1 and 0.23 dex for E2 are given by Mateos et al. (2015) and Gandhi et al. (2009), respectively, and we estimate 0.5 dex for E3. We assume that each estimate of log follows a Gaussian distribution of E (): E1, E2, and E3, for which we included a factor of two of uncertainty of to and in addition to the scatter of the correlations. The posterior probability gives the most likely estimate of log (the 95% compatible interval (CI): 42.7-43.6). This is illustrated in Fig. 5. The range that can be obtained in SW-A lies below the 95% CI, indicating that SW-R is preferred and a reflection-dominated spectrum is a more probable description of the NuSTAR data for the SW nucleus.
Assuming a bolometric correction of 20 (Marconi et al. 2004), the (SW) is found to be erg s-1, based on the best-estimate of . The Eddington ratio is then 0.9%, which is typical of Seyferts. The luminosity ratio can be translated to the AGN fraction in the galaxy’s bolometric output if is all absorbed by circumnuclear dust and reradiated in the IR.
4.2 NE nucleus
The X-ray luminosity of the NE nucleus is relatively low, about erg s-1. Although the hard Chandra spectrum indicates a significant AGN contribution in the Chandra band (Torres-Albà et al. 2018) since intense star formation is also taking place in the NE nucleus, we first examine how much the star-forming activity might contribute to the observed hard X-ray emission. At energies above 3 keV, starburst emission mainly comes from high-mass X-ray binaries. Their collective X-ray luminosity can be estimated using the empirical relation with the star formation rate (Grimm et al. 2003; Ranalli et al. 2003; Lehmer et al. 2010). The star formation rate of the entire Mrk 266 system is 65 yr-1 (Howell et al. 2010). By scaling with , we estimate the star formation rate of the NE nucleus to be 15 yr-1. Using the formula of Lehmer et al. (2010) and given the star formation rate, , is dominated by high-mass X-ray binaries and given the contribution of low-mass X-ray binaries is minor, the expected 2-10 keV luminosity from X-ray binaries is found to be erg s-1 or % of the observed 2-10 keV luminosity. The radial surface brightness profile of the NE nucleus in the 4-7 keV Chandra image (Fig. 1) shows a small extension (% of the total emission), which might be attributed to the star formation, but most of the emission comes from a low-luminosity AGN. The 3-7 keV flux observed by Chandra is 25% higher than that of XMM-Newton and NuSTAR. Although the increase is marginal, X-ray variability would support the dominance of AGN emission.
The Eddington ratio of NE is rather low (). Among nearby AGN, the range around this value is populated by LINERs and low-luminosity Seyferts (Ho 2008). Although the radio to mid-IR flux-density ratio, , is consistent with those of star forming galaxies (Sargent et al. 2010), the radio source is compact and unresolved at HPBW (Mazzarella et al. 1988). Furthermore, it is likely associated with the AGN, which may have an inefficient accretion flow, suggested by the low , producing the radio emission. The observed radio flux of the NE nucleus is comparable with that of the SW nucleus with similar spectral slopes: for the NE nucleus and for the SW nucleus in the 1.4-15 GHz range (Mazzarella et al. 1988), whereas the intrinsic is dex lower than the SW nucleus (Table 4). This seems to be compatible with the characteritic radio excess of low-luminosity AGN (LLAGN) with an inefficient accretion flow (Ho 2008).
When the bolometric correction , suggested for LLAGN by Ho (2008) is used, erg s-1 is obtained. The is therefore %. The AGN contribution to the IR luminosity could even be lower if the NE nucleus had a SED typical of LLAGN, lacking a UV excess, which is a main source of heating of IR emitting circumnuclear dusts. This is in stark contrast to % obtained from the mid-IR diagnostics (MIV12 ). However, the Spitzer IRS spectrum of the NE nucleus alone was taken only from the SL module and it lacks the longer wavelength coverage where the key AGN diagnostic lines [Ne v]m and [O iv]m are present. This leaves the PAH strengths as the only mid-IR AGN diagnostics that may be biased. Given the low accretion rate inferred from the X-ray observations, strong outflows are expected from the AGN in the NE nucleus, which fit observed optical and radio signatures pointed out by MIV12 . The AGN energy output of the NE nucleus may be dominated by the mechanical power of those outflowing winds.
4.3 Dual AGN in Mrk 266
Mrk 266 exhibits properties that have close relevance to the merger-driven formation of dual AGN and their detectability. Two important characteristics of this merger system are 1) a close nuclear separation of 6 kpc in projection; and 2) the mass ratio of the host spheroids are close to unity and thus, presumably, as is the black hole mass ratio. These two are required conditions for forming dual AGN deduced from cosmological simulations (Steinborn et al. 2016; Volonteri et al. 2016, see also e.g. Hopkins et al. 2006; Solanes et al. 2019). As a substantial amount of cold molecular gas (a few ) is available between the galaxies (Imanishi et al. 2009), this reservoir provides individual galaxies with gas for further accretion, helping the system evolve into an ULIRG, as argued by MIV12 . However, it is interesting to note that the two AGN appear to have distinct characteristics: The SW nucleus is times more luminous than the NE nucleus and they are possibly accreting in different modes as discussed above, suggesting that the accretion conditions might actually be unbalanced between the galaxies. In terms of detectability of dual AGN, heavy obscuration certainly plays a role. Ricci et al. (2017) found an elevated proportion of Compton-thick AGN in advanced mergers with nuclear separations of kpc. Mrk 266 fits in the merger stage and the SW nucleus is indeed a Compton-thick AGN, which had not been verified until the NuSTAR observation. The spatial resolution of Chandra and the hard X-ray sensitivity of NuSTAR complement each other, helping to identify a Compton-thick AGN in advanced merger systems such as Mrk 266 and Mrk 273. A multiwavelength approach, as employed by GOALS, is obviously effective at overcoming the obscuration issue (e.g. Hickox & Alexander 2018), which would naturally be expected in luminous merger systems. We refer readers to an extensive review of both observational and theoretical aspects of dual AGN by De Rosa et al. (2019) who further discuss related X-ray observational works on samples that were selected using various techniques (e.g. Koss et al. 2010, 2012; Comerford et al. 2015; Satyapal et al. 2017).
Acknowledgements.
This research made use of data obtained from NuSTAR, XMM-Newton and Chandra X-ray Observatory, software packages of HEASoft and R (R Core Team 2017), and the NASA/IPAC Extragalactic Databases (NED), which is funded by the National Aeronatutics and Space Administration and operated by the California Institute of Technology. KI acknowledges support by the Spanish MICINN under grant PID2019-105510GB-C33. T.D-S. acknowledges support from the CASSACA and CONICYT fund CAS-CONICYT Call 2018. C.R. acknowledges support from the Fondecyt Iniciacion grant 11190831. ASE, GCP and KI acknowledge NASA Astrophysics Data Analysis Program (ADAP) Grant 80NSSC20K0450 (PI: U).References
- Armus et al. (2009) Armus, L., Mazzarella, J. M., Evans, A. S., et al. 2009, PASP, 121, 559
- Awaki et al. (2009) Awaki, H., Terashima, Y., Higaki, Y., & Fukazawa, Y. 2009, PASJ, 61, S317
- Baloković et al. (2018) Baloković, M., Brightman, M., Harrison, F. A., et al. 2018, ApJ, 854, 42
- Bernard-Salas et al. (2009) Bernard-Salas, J., Spoon, H. W. W., Charmandaris, V., et al. 2009, ApJS, 184, 230
- Brassington et al. (2007) Brassington, N. J., Ponman, T. J., & Read, A. M. 2007, MNRAS, 377, 1439
- Chu et al. (2017) Chu, J. K., Sanders, D. B., Larson, K. L., et al. 2017, ApJS, 229, 25
- Comerford et al. (2015) Comerford, J. M., Pooley, D., Barrows, R. S., et al. 2015, ApJ, 806, 219
- De Rosa et al. (2019) De Rosa, A., Vignali, C., Bogdanović, T., et al. 2019, New A Rev., 86, 101525
- Diamond-Stanic et al. (2009) Diamond-Stanic, A. M., Rieke, G. H., & Rigby, J. R. 2009, ApJ, 698, 623
- Díaz-Santos et al. (2017) Díaz-Santos, T., Armus, L., Charmandaris, V., et al. 2017, ApJ, 846, 32
- Gandhi et al. (2009) Gandhi, P., Horst, H., Smette, A., et al. 2009, A&A, 502, 457
- Grimm et al. (2003) Grimm, H. J., Gilfanov, M., & Sunyaev, R. 2003, MNRAS, 339, 793
- Gruppioni et al. (2016) Gruppioni, C., Berta, S., Spinoglio, L., et al. 2016, MNRAS, 458, 4297
- Hickox & Alexander (2018) Hickox, R. C. & Alexander, D. M. 2018, ARA&A, 56, 625
- Ho (2008) Ho, L. C. 2008, ARA&A, 46, 475
- Hopkins et al. (2006) Hopkins, P. F., Hernquist, L., Cox, T. J., et al. 2006, ApJS, 163, 1
- Horst et al. (2008) Horst, H., Gandhi, P., Smette, A., & Duschl, W. J. 2008, A&A, 479, 389
- Howell et al. (2010) Howell, J. H., Armus, L., Mazzarella, J. M., et al. 2010, ApJ, 715, 572
- Hutchings et al. (1988) Hutchings, J. B., Neff, S. G., & van Gorkom, J. H. 1988, AJ, 96, 1227
- Ikeda et al. (2009) Ikeda, S., Awaki, H., & Terashima, Y. 2009, ApJ, 692, 608
- Imanishi et al. (2009) Imanishi, M., Nakanishi, K., Tamura, Y., & Peng, C.-H. 2009, AJ, 137, 3581
- Ishigaki et al. (2000) Ishigaki, T., Yoshida, M., Aoki, K., et al. 2000, PASJ, 52, 185
- Iwasawa et al. (2011) Iwasawa, K., Mazzarella, J. M., Surace, J. A., et al. 2011, A&A, 528, A137
- Iwasawa et al. (2018) Iwasawa, K., U, V., Mazzarella, J. M., et al. 2018, A&A, 611, A71
- Kollatschny & Fricke (1984) Kollatschny, W. & Fricke, K. J. 1984, A&A, 135, 171
- Koss et al. (2012) Koss, M., Mushotzky, R., Treister, E., et al. 2012, ApJ, 746, L22
- Koss et al. (2010) Koss, M., Mushotzky, R., Veilleux, S., & Winter, L. 2010, ApJ, 716, L125
- Lehmer et al. (2010) Lehmer, B. D., Alexander, D. M., Bauer, F. E., et al. 2010, ApJ, 724, 559
- Liu et al. (2014) Liu, T., Wang, J.-X., Yang, H., Zhu, F.-F., & Zhou, Y.-Y. 2014, ApJ, 783, 106
- Liu et al. (2019) Liu, W., Veilleux, S., Iwasawa, K., et al. 2019, ApJ, 872, 39
- Lutz et al. (2004) Lutz, D., Maiolino, R., Spoon, H. W. W., & Moorwood, A. F. M. 2004, A&A, 418, 465
- Madsen et al. (2020) Madsen, K. K., Grefenstette, B. W., Pike, S., et al. 2020, arXiv e-prints, arXiv:2005.00569
- Marconi & Hunt (2003) Marconi, A. & Hunt, L. K. 2003, ApJ, 589, L21
- Marconi et al. (2004) Marconi, A., Risaliti, G., Gilli, R., et al. 2004, MNRAS, 351, 169
- Mateos et al. (2015) Mateos, S., Carrera, F. J., Alonso-Herrero, A., et al. 2015, MNRAS, 449, 1422
- Matt et al. (1999) Matt, G., Pompilio, F., & La Franca, F. 1999, New A, 4, 191
- Mazzarella & Boroson (1993) Mazzarella, J. M. & Boroson, T. A. 1993, ApJS, 85, 27
- Mazzarella et al. (1988) Mazzarella, J. M., Gaume, R. A., Aller, H. D., & Hughes, P. A. 1988, ApJ, 333, 168
- (39) Mazzarella, J. M., Iwasawa, K., Vavilkin, T., et al. 2012, AJ, 144, 125
- Meléndez et al. (2008) Meléndez, M., Kraemer, S. B., Armentrout, B. K., et al. 2008, ApJ, 682, 94
- Nandra & Pounds (1994) Nandra, K. & Pounds, K. A. 1994, MNRAS, 268, 405
- Osterbrock & Dahari (1983) Osterbrock, D. E. & Dahari, O. 1983, ApJ, 273, 478
- Osterbrock & Martel (1993) Osterbrock, D. E. & Martel, A. 1993, ApJ, 414, 552
- Pereira-Santaella et al. (2010) Pereira-Santaella, M., Diamond-Stanic, A. M., Alonso-Herrero, A., & Rieke, G. H. 2010, ApJ, 725, 2270
- R Core Team (2017) R Core Team. 2017, R: A Language and Environment for Statistical Computing, R Foundation for Statistical Computing, Vienna, Austria
- Ranalli et al. (2003) Ranalli, P., Comastri, A., & Setti, G. 2003, A&A, 399, 39
- Ricci et al. (2017) Ricci, C., Bauer, F. E., Treister, E., et al. 2017, MNRAS, 468, 1273
- Rigby et al. (2009) Rigby, J. R., Diamond-Stanic, A. M., & Aniano, G. 2009, ApJ, 700, 1878
- Sanders et al. (1986) Sanders, D. B., Scoville, N. Z., Young, J. S., et al. 1986, ApJ, 305, L45
- Sargent et al. (2010) Sargent, M. T., Schinnerer, E., Murphy, E., et al. 2010, ApJS, 186, 341
- Satyapal et al. (2017) Satyapal, S., Secrest, N. J., Ricci, C., et al. 2017, ApJ, 848, 126
- Solanes et al. (2019) Solanes, J. M., Perea, J. D., Valentí-Rojas, G., et al. 2019, A&A, 624, A86
- Steinborn et al. (2016) Steinborn, L. K., Dolag, K., Comerford, J. M., et al. 2016, MNRAS, 458, 1013
- Torres-Albà et al. (2018) Torres-Albà, N., Iwasawa, K., Díaz-Santos, T., et al. 2018, A&A, 620, A140
- U et al. (2013) U, V., Medling, A., Sanders, D., et al. 2013, ApJ, 775, 115
- Ueda et al. (2014) Ueda, Y., Akiyama, M., Hasinger, G., Miyaji, T., & Watson, M. G. 2014, ApJ, 786, 104
- Volonteri et al. (2016) Volonteri, M., Dubois, Y., Pichon, C., & Devriendt, J. 2016, MNRAS, 460, 2979
- Wang et al. (1997) Wang, J., Heckman, T. M., Weaver, K. A., & Armus, L. 1997, ApJ, 474, 659
- Wu et al. (1998) Wu, H., Zou, Z. L., Xia, X. Y., & Deng, Z. G. 1998, A&AS, 127, 521