IDS collaboration
Detailed spectroscopy of doubly magic 132Sn
Abstract
The structure of the doubly magic Sn82 has been investigated at the ISOLDE facility at CERN, populated both by the decay of 132In and -delayed neutron emission of 133In. The level scheme of 132Sn is greatly expanded with the addition of 68 -transitions and 17 levels observed for the first time in the decay. The information on the excited structure is completed by new -transitions and states populated in the -n decay of 133In. Improved delayed neutron emission probabilities are obtained both for 132In and 133In. Level lifetimes are measured via the Advanced Time-Delayed (t) fast-timing method. An interpretation of the level structure is given based on the experimental findings and the particle-hole configurations arising from core excitations both from the N = 82 and Z = 50 shells, leading to positive and negative parity particle-hole multiplets. The experimental information provides new data to challenge the theoretical description of 132Sn.
I Introduction
The 132Sn nucleus is one of the bastions of our understanding of nuclear structure in the framework of the nuclear shell model. With 50 protons and 82 neutrons it is one of the most exotic doubly-magic nuclei within reach of current experimental facilities. One of the signatures of its doubly-magic nature is the high lying first-excited state at 4041.6 keV Kerek1973; Bjornstad1986; NDS132. This value, once scaled by a factor of A1/3 to account for the size of the nucleus, is large in comparison to other doubly magic nuclei such as 208Pb and 16O, which points to a strong double shell closure. The 132Sn doubly magic structure is also manifested by the almost pure single-particle nature of the levels in 133Sn. This nature was probed by a transfer reaction in inverse kinematics Jones2010 yielding very large spectroscopic factors.
The region of the nuclear chart around 132Sn plays an important role in the astrophysical rapid neutron-capture process (r-process), which impacts elemental abundances in the solar system. Recently, the identification of the nucleosynthesis site for neutron-rich nuclei around N = 82 has been reported Barnes2016; Cowperth2017 associated to a "kilonova" Metzger2010, observed by multimessenger astronomy. The robustness of the N = 82 neutron shell is one of the important parameters when modeling r-process nucleosynthesis and describing light curves arising from compact object mergers. The shell structure in this region is also necessary to understand the role of fission in the r-process Martinez2007.
From the point of view on nuclear structure the nuclei with a valence particle or hole around 132Sn are relevant for investigating single-particle states and transition probabilities. They provide observables that are the main ingredients in state-of-the-art large scale shell-model calculations to understand the nuclear structure in the region. The single-particle states in the region are represented in Figure 1 following the procedure described in Grawe2007, and employing binding energies from Wang2017 and the excitation spectra from 131Sn, 133Sn, 133Sb and 131In. In particular, the neutron single-particle orbits above the N = 82 shell gap have been taken from low-lying states in 133Sn: the ground state and the , , and states at 854, 1367, 1561 and 2005 keV excitation energy Hoff1996; Hoff2000; Jones2010; Jones2011; Allmond2014; Vaquero2017; Piersa2019. The single-particle state has not been experimentally identified to date Korgul2015. These single particle states are not only relevant for 132Sn but also for neutron-rich nuclei in its vicinity.

Experimental data on 132Sn is essential for the shell-model description of the exotic nuclear region around N = 82 and to provide insight into particle-hole couplings for both protons and neutrons. Most of the excited levels in 132Sn correspond to particle-hole (p-h) configurations where a proton or a neutron is promoted across the closed shell. The coupling of single particle and single hole configurations (Figure 1) leads to multiplets of excited states with an expected low admixture of other configurations. The particle-hole residual interaction makes the level energies within a multiplet non-degenerate. The identification of these multiplets provides information on the nuclear two-body matrix elements to first order. Experimentally measured transition rates between states within a multiplet, and also between states of different multiplets, give important knowledge of the underlying single particle structure.
The investigation of the doubly-magic 132Sn is thus essential for theoretical models aiming at the understanding neutron-rich nuclei in the region. The development of these models is furthermore needed for the description of r-process nuclei that are at present experimentally out of reach.
The excited structure of 132Sn has been experimentally investigated since the 1970s. Beta decay experiments were carried out at OSIRIS Kerek1973; Fogelberg1994; Fogelberg1995; Mach1995a and ISOLDE Bjornstad1986; BJORNSTAD198035, as well as fission experiments performed at the JOSEF facility Kawade1982; DEHESA1978309 and the Argonne National Laboratory Bhattacharyya2001.
The most complete -decay experiment was performed by Fogelberg et al. Fogelberg1994; Fogelberg1995; Mach1995a at the OSIRIS facility in the 1990s, where the level scheme of 132Sn was expanded to 21 excited levels, including negative and positive parity states up to the neutron separation energy. Proton particle-hole states were identified for the first time, and the 4352-keV Jπ = 3- state was confirmed to have an octupole vibrational character. Lifetime measurements of the excited states down to the ps range were performed, and spin and parities assignments were made for the levels below 5 MeV.
Despite all the detailed studies on 132Sn attained through the -decay and fission experiments, many of the expected particle-hole multiplet states remain without experimental identification. Beta decay is the ideal tool to investigate the excited structure of 132Sn, both directly from 132In (7-) g.s. and via beta-delayed neutron emission from the 133In (9/2+) g.s. and the (1/2-) 330-keV beta-decaying isomer. This is due to the large energy window available for the decay, of (132In) = 14140(60) keV and (133In) = 11010(200) keV (from systematics) Wang2017, respectively, and due to the high spin of the parent nuclei that makes it possible to feed many states in 132Sn.
In this work we focus on the investigation of the excited structure of 132Sn populated in and -n decay. Taking advantage of the enhanced yield and selectivity achieved at the ISOLDE facility at CERN some of the missing particle-hole multiplet states have been identified. In addition, lifetimes of excited states in 132Sn have been measured using fast-timing techniques. The results from the decay study of the 133In isomers have been partially covered in Piersa2019. Details on the experimental method used in the present work are provided in Section II. The experimental results are presented in Section III and discussed in Section LABEL:sec:discussion. Conclusions are drawn in Section LABEL:sec:conclusions.
II Experimental details
The experiment was carried out at the ISOLDE facility at CERN. It was performed in two separate data-taking campaigns in 2016 and 2018, where the excited structure in 132Sn was populated in the decay of 132In and in the -n decay of the 133In (9/2+) and (1/2-) states. The 132In and 133In isotopes were produced by the bombardment of a UCx target equipped with a neutron converter by 1.4-GeV protons from the CERN PS-Booster (PSB). The indium ions thermally diffused out of the target and were ionized using the ISOLDE resonance ionization laser ion source (RILIS) Fedosseev2017. The use of RILIS granted isomeric selectivity, by taking advantage of the difference in the hyperfine splitting of the isomer and ground state. More details on the isomer selection can be found in Piersa:2018kgo. Following the ionization, indium ions were extracted and accelerated by a 40-kV potential difference, mass analyzed Catherall2017 and implanted on an aluminized mylar tape located at the center of our detector setup at the ISOLDE Decay Station (IDS) IDS. The ions reached the IDS following the time structure of the PSB supercycle whereby proton pulses were grouped into sets of 34 or 35 pulses, out of which around half of them are delivered to the ISOLDE target-unit separated in time by multiples of 1.2 s. The beam was collected on the tape for a fixed time varying from 200 to 400 ms after the impact of each proton pulse. Once every supercycle the tape was moved in order to reduce the activity of long-lived daughter nuclides. The average beam intensity at the experimental station was of the order of 4104 and 2103 ions per second for 132In and 133In, respectively. Data were collected for 20 hours for each mass.
The IDS setup consists of a set of detectors aimed at measuring the and radiation emitted after the -decay of the implanted isotopes. They are arranged in close geometry surrounding the implantation point. The setup can be divided in two branches. The first branch is composed of four clover-type HPGe detectors for -ray spectroscopy, with a combined full-energy peak efficiency of 4 at 1173 keV. The second branch is aimed at lifetime measurement of excited states using the Advanced Time-Delayed (fast timing) technique Mach1989; Moszynski1989; Fraile2017. It consists of two LaBr3(Ce) crystals with the shape of truncated cones Vedia2017 coupled to fast photomultiplier tubes (PMTs) fraile2013fast, with 1 of total efficiency at 1 MeV each, and an ultrafast 3-mm thick NE111A plastic scintillator used as a detector, with a 20 efficiency. The energy and fast-timing signals are taken from the PMT dynode and anode outputs, respectively. The timing signals are processed by analog constant fraction discriminators and introduced in pairs in time-to-amplitude converter (TAC) modules that provide the time difference between them. In this experiment, time differences between the and the two LaBr3(Ce) detectors as well as between the two LaBr3(Ce) detectors were recorded. More details on the setup are provided in Fraile2017; Lica2017.
All the signals from both branches were read and digitized by the Nutaq digital data acquisition system nutaq. Logic signals, such as the time of arrival of the proton pulse on target and the tape movement, were also digitized. Data were collected in a triggerless mode. Events were built during the offline analysis where they were sorted in coincidence windows, and correlated with the proton arrival time. At this stage, the energy calibration for each detector was applied, as well as add-back corrections for the clover detectors. Due to the large energy of the 132Sn rays, a precise efficiency calibration is needed in a wide energy range. Therefore, 152Eu, 138Cs, 140Ba and 133Ba radioactive sources were used to build the energy calibration. The calibration was extended up to 7.6 MeV by including high-energy rays originating from the capture of thermal neutrons produced at the ISOLDE target station, mainly in iron (IDS frame) and germanium (HPGe detectors).
For the timing measurements, the calibration of the LaBr3(Ce) time response for full-energy peaks (FEP) as a function of energy, the FEP walk curve, is required. It was built for each LaBr3(Ce) detector using (t) and (t) coincidences with 140Ba/140La and 152Eu -ray sources, 138Cs and 88Rb on-line sources and by including several transitions in 132Sb as an internal calibration source. In this way, we obtained FEP time response curves for each LaBr3(Ce) detector in the energy range 100 keV to 2.6 MeV, with an average one-sigma error of 3 ps. A similar procedure was implemented to build the Compton walk curve in order to take care of the corrections due to Compton events.
III Experimental results
The excited structure of 132Sn was populated through the decay of 132In (7-), and from the -n decay of the 133In (9/2+) g.s. and the (1/2-) isomer. The large differences in the spin and parity of the parent nuclei result in distinct feeding patterns for each decay, which provides information on the spin and parity of the levels fed.
Owing to the large difference in the -decay half-lives of 132In and 132Sn, of 200(2) ms and 39.7(8) s NDS132, respectively, the time distribution relative to the arrival of the proton on target makes it possible to identify whether a ray has been emitted during the decay of 132In or from the daughters. A similar situation occurs for the decay of 133In. Apart from the time distribution, the identification of the -rays belonging to 132Sn is based on - coincidences with previously-known transitions.
III.1 Beta decay of 132In
The Qβ in 132In is 14140(60) keV, while the neutron separation energy in 132Sn is 7353(4) keV Wang2017. Hence, the feeding of excited states up to 7 MeV is possible in this decay and high energy -rays may be observed. The excited structure populated in the 132In decay is very complex. The high spin of the parent, (7-) Jungclaus2016, favors the population of high spin (6-8) excited states in the energy range from 4 to 7 MeV. Those levels can only de-excite to the ground state by means of -ray cascades of 3 or more transitions. As discussed before, due to the doubly magic nature of 132Sn, the first excited state appears at a very high energy, 4041 keV.Therefore, it is not expected to find new levels in this decay that can de-excite directly to the g.s. with an energy below 4 MeV.
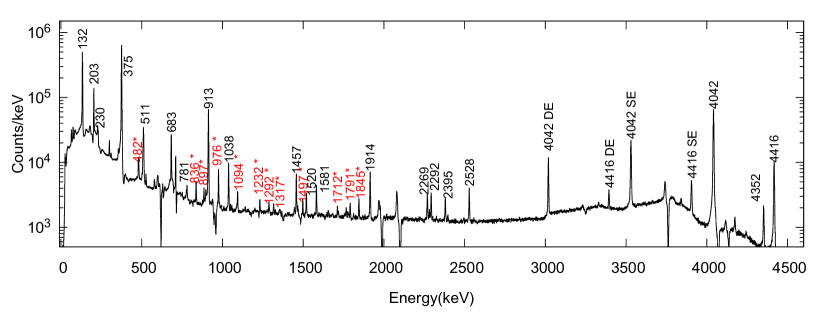
The energy spectra recorded by the HPGe clover detectors, setting a time window of 30-530 ms after proton impact are depicted in Figure 2. This condition was imposed in order to reduce the contribution of the different contaminants. The contribution of neutron-induced background coming from the target is suppressed by removing the first 30 ms of the time window. An upper limit of the time window at 530 ms was chosen to reduce the contribution of the long-lived daughters, while keeping most of the statistics.

III.1.1 Half-life of 132In ground state
The half-life of 132In was measured by fitting the time distribution of the 10 strongest rays (labeled in Fig. 2 except for the 4416 keV). Since the activity at the experimental station is pulsed by the proton beam structure and the release from the target, the time distribution is fitted to an exponential decay function with a constant background after the end of the implantation. The background contribution was estimated by analyzing the time range from 2400 to 3600 ms after proton impact.
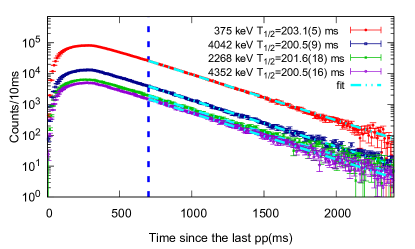
Due to the high count rates, dead time effects are sizable, mainly during implantation, but also at the beginning of the decay. In each HPGe crystal an average count rate of 3103 counts per seconds (cps) was observed, however, during the implantation time the count rate could rise up to 1.5104 cps. To account for this effect the beginning of the fit range was shifted by a few half-lives towards higher times and a fit test was performed to verify that the expected exponential decay behavior was recovered. The lifetime measurement was performed independently for each of the two data sets of 132In decay measured in the two experimental campaigns. The analysis made use of single events recorded in the HPGe detectors. The contribution of the Compton background under full-energy peaks was subtracted. This investigation furnishes 20 independent values for the 132In, 10 from each data set, which are all statistically compatible with each other. The final value of the 132In half-life was adopted as the weighted average of these measurements yielding T1/2=202.2(2) ms. The statistical uncertainty of the weighted average is calculated and increased by multiplying by the obtained. No systematic error is included. This half-lifes is in agreement with, but more precise than, the value reported in the latest evaluation, T1/2=200(2) ms NDS132. In Figure 3 the decay curves for 4 of the rays under consideration, from the 2016 data set, are shown.
III.1.2 Identification of new -rays in 132Sn
The analysis of - coincidences was done using the full statistics independently for the two data sets from each campaign. The assignments were cross-checked by requiring coincidences with the detector and/or a time range since proton impact from 30 to 530 ms. Figure 4 shows the rays in coincidence with the 6+ 4+ 299.3 keV transition in 132Sn. The spectrum illustrates the amount of statistics and the quality of the -ray coincidence spectra.
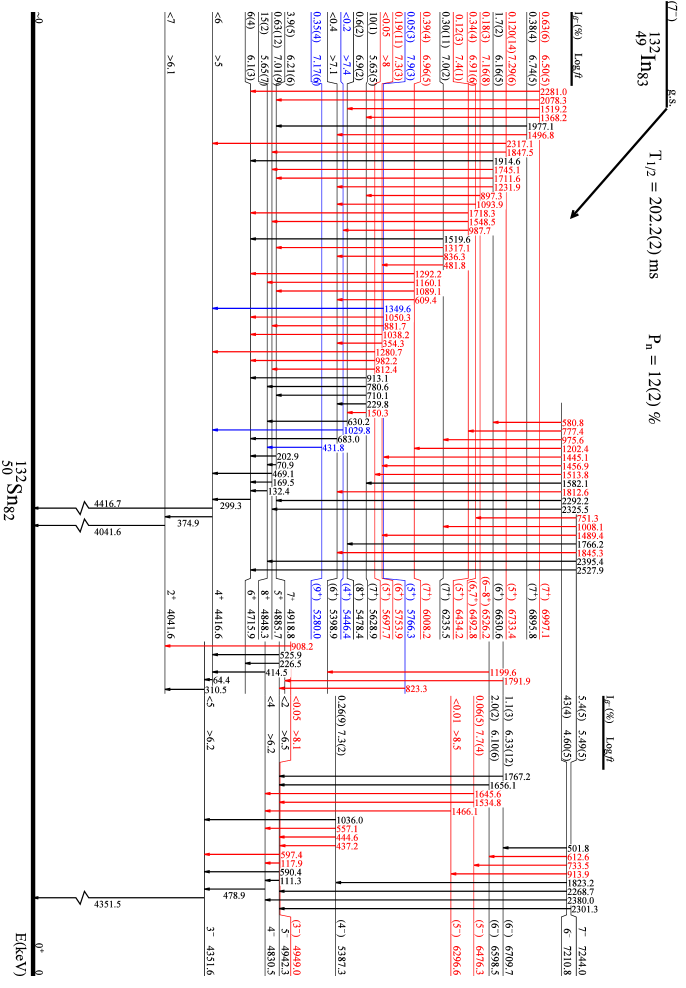
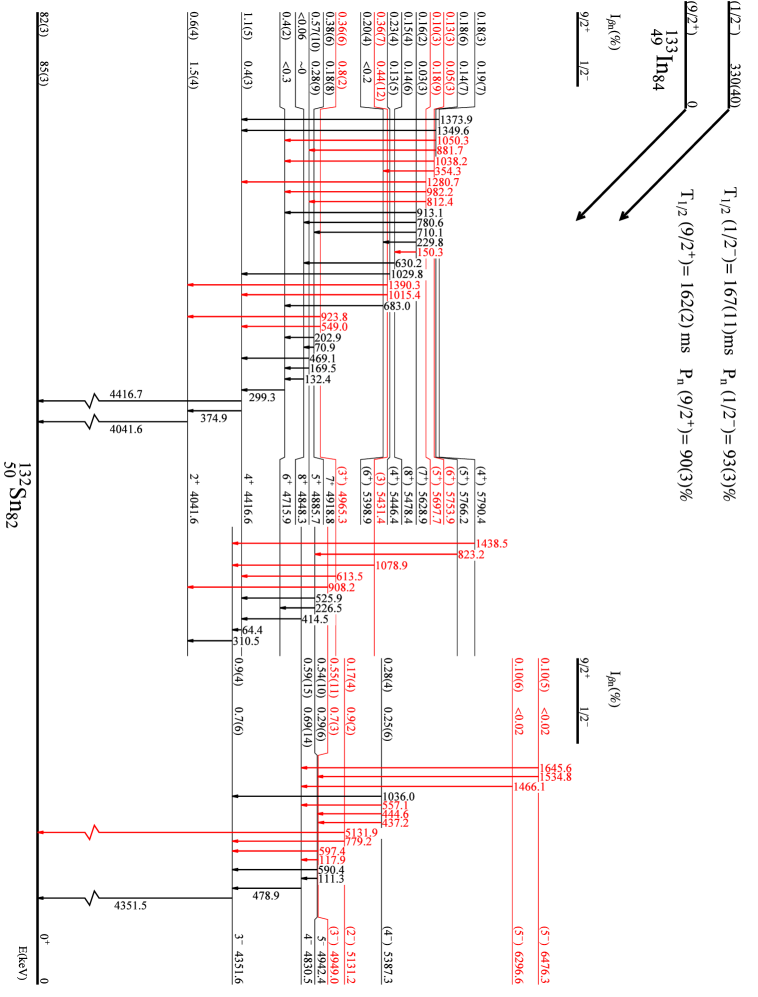
The level scheme of 132Sn has been greatly expanded with the addition of 57 new transitions and 11 new levels, observed following the direct 132In decay. The level scheme is shown in Figure 5. A list of the rays is provided in Table LABEL:tab:132sngammas.
The states located at 5766 and 5446 keV were previously observed in the -delayed neutron emission of 133In Piersa2019. The assignment is confirmed in this work with the uncovering of new cascades in the 132In decay involving both levels.
A new level is found at 5754 keV defined by the 1457-1038 keV cascade. This sequence had already been observed by Fogelberg et al. Fogelberg1994, however the order of the rays they proposed was inverted, giving rise to an excited level at 6173 keV with suggested (6+) spin-parity. This level has been ruled out in our analysis due to the finding of another -ray that de-excites the 5754-keV state, confirmed by - coincidences.
The 5280-keV level was already reported in 248Cm fission studies Bhattacharyya2001, and tentatively identified as the (9+) state that arises from the particle-hole configuration. That level is confirmed in this work by the observation of the de-exciting 431.8-keV transition in delayed coincidence with the 132-keV -ray that de-excites the 8+ 4848-keV level.
The direct feeding to states in 132Sn was determined from the balance between feeding and de-exciting rays to each level. The intensities of the rays were obtained from the measured HPGe singles with neither coincidence nor condition on the time from the impact of protons on target. Theoretical internal conversion coefficients have been taken from KIBEDI2008202 if required. The feeding to the states should be understood as upper limits and the log values as lower limits due to possible missing transitions.
III.1.3 -delayed neutron branches in 132In
The -delayed one neutron emission of 132In has been confirmed by the observation of rays belonging to the excited structure of 131Sn. Two transitions have been identified in this decay, specifically, the 2435.0(3) keV and 4273.6(5) keV with an absolute intensity of 0.11(1) and 0.04(1) respectively. The Pn value has been obtained from the analysis of the -ray intensities of the and -n branches, following the decay of the 132Sn and 131Sn daughters. For the 132Sn 132Sb decay branch, the intensities of the 5 most intense rays were considered. The absolute intensities for those transitions were adopted from PhysRevC.39.1963. Previous measurements of the 131Sn 131Sb decay Huck1981 were not able to disentangle the decay of the 131In isomers. Besides, in our analysis we observed that the intensity of the rays emitted in this decay mainly originate from the population of levels with high spin (11/2, 13/2, 15/2). This indicates that the 132In isotopes that decay by -n mostly feed the 11/2- isomer in 131Sn directly, which is strongly favored against the 3/2+ g.s. due to the angular momentum difference.
The total intensity from 131Sn 131Sb decay was calculated from the analysis of the rays from 131Sb observed in this data set. An absolute intensity of 69(7) has been estimated for the most intense transition, of 1226 keV. This value was obtained by making two assumptions: firstly that 132In -n decay mainly populates the (11/2-) isomer, which is consistent with our observations, and secondly that no direct intensity was lost due to direct population of 131Sn to the 131Sb g.s. This is to be expected in order to be consistent with the first assumption due to the large spin difference (11/2- 7/2+ transition). The 7 uncertainty in the value takes into account these assumptions.
Finally, the number of decays calculated for each tin isotope was corrected to account for the movement of the tape at the end of each super-cycle, considering the different half-lives of each isotope and for dead time effects. From this analysis a Pn=12(2) value was found for the 132In -n decay, which is notably higher than the 6.8(14) in NSR1980LU04 but in good agreement with the 10.7(33) from Rudstam1993.
| Ei(keV) | J | Ef(keV) | J | Eγ (keV) | I |
|---|---|---|---|---|---|
| 4041.6(3) | 2+ | 0 | 0+ | 4041.6(3) | 100(11) |
| 4351.6(3) | 3- | 0 | 0+ | 4351.5(3) | 43(5) |
| 4041.6(3) | 2+ | 310.5(3) | 4.2(3) | ||
| 4416.6(3) | 4+ | 0 | 0+ | 4416.7(3) | 16(2) |
| 4041.6(3) | 2+ | 374.9(3) | 100 | ||
| 4351.6(3) | 3- | 64.4(3) | 1.29(9) | ||
| 4715.9(4) | 6+ | 4416.6(3) | 4+ | 299.3(3) | 82(6) |
| 4830.5(4) | 4- | 4351.6(3) | 3- | 478.9(3) | 45(3) |
| 4416.6(3) | 4+ | 414.5(3) | 0.79(6) | ||
| 4848.3(5) | 8+ | 4715.9(4) | 6+ | 132.4(3) | 26(2) |
| 4885.7(5) | 5+ | 4416.6(3) | 4+ | 469.1(5) | 2.5(2) |
| 4715.9(4) | 6+ | 169.5(4) | 0.12(5)b | ||
| 4918.8(5) | 7+ | 4715.9(4) | 6+ | 202.9(3) | 8.0(6) |
| 4848.3(5) | 8+ | 70.9(4) | 1.2(2)b | ||
| 4942.4(4) | 5- | 4351.6(3) | 3- | 590.4(3) | 1.07(8) |
| 4416.6(3) | 4+ | 525.9(3) | 33(2) | ||
| 4715.9(4) | 6+ | 226.5(3) | 0.67(5) | ||
| 4830.5(4) | 4- | 111.3(3) | 2.8(2) | ||
| 4949.0(5) | (3-) | 4830.5(4) | 4- | 117.9(5) | 0.012(4)b |
| 4351.6(3) | 3- | 597.4(6) | 0.11(3)b | ||
| 4041.6(3) | 2+ | 908.2(4) | 0.016(6)b | ||
| 5280.0(6)) | (9+) | 4848.3(5) | 8+ | 431.8(4) | 0.63(6)b |
| 5387.3(3) | (4-) | 4351.6(3) | 3- | 1036.0(3) | 1.29(11) |
| 4830.5(4) | 4- | 557.1(4) | 0.13(2) | ||
| 4942.4(4) | 5- | 444.6(4) | 0.23(3) | ||
| 4949.0(5) | (3-) | 437.2(4) | 0.23(2) | ||
| 5398.9(5) | (6+) | 4715.9(4) | 6+ | 683.0(3) | 3.9(3) |
| 5446.4(5) | (4+) | 4416.6(3) | 4+ | 1029.8(4) | 0.26(3) |
| 5478.4(6) | (8+) | 4848.3(5) | 8+ | 630.2(3) | 4.6(3) |
| 5628.9(3) | (7+) | 4715.9(4) | 6+ | 913.1(3) | 12.2(10) |
| 4848.3(5) | 8+ | 780.6(3) | 5.0(4) | ||
| 4918.8(5) | 7+ | 710.1(3) | 2.0(2) | ||
| 5398.9(5) | (6+) | 229.8(3) | 0.65(5) | ||
| 5478.4(6) | (8+) | 150.3(3) | 0.29(3)b | ||
| 5697.7(3) | (5+) | 4416.6(3) | 4+ | 1280.7(3) | 0.134(13) |
| 4715.9(4) | 6+ | 982.2(5) | 0.08(2)b | ||
| 4885.7(5) | 5+ | 812.4(6) | 0.05(2)b | ||
| 5753.9(4) | (6+) | 4715.9(4) | 6+ | 1038.2(3) | 1.8(2) |
| 5398.9(5) | (6+) | 354.3(3) | 0.58(4) | ||
| 5766.3(3) | (5+) | 4416.6(3) | 4+ | 1349.6(3) | 0.27(2) |
| 4715.9(4) | 6+ | 1050.3(4) | 0.122(10) | ||
| 4885.7(5) | 5+ | 881.7(3) | 0.114(14) | ||
| 4942.4(4) | 5- | 823.2(7) | 0.068(5) | ||
| 6008.2(4) | (7+) | 4715.9(4) | 6+ | 1292.2(5) | 0.042(7)b |
| 4848.3(5) | 8+ | 1160.1(3) | 0.163(13) | ||
| 4918.8(5) | 7+ | 1089.1(4) | 0.15(2) | ||
| 5398.9(5) | (6+) | 609.4(4) | 0.37(5) | ||
| 6235.5(3) | (7+) | 4715.9(4) | 6+ | 1519.6(3) | 0.54(5)b |
| 4918.8(5) | 7+ | 1317.1(3) | 0.31(3) | ||
| 5398.9(5) | (6+) | 836.3(4) | 0.64(6) | ||
| 5753.9(4) | (6+) | 481.8(3) | 0.53(6) | ||
| 6296.6(5) | (5-) | 4830.5(4) | 4- | 1466.1(3) | 0.120(15)b |
| 6434.2(3) | (5+) | 4715.9(4) | 6+ | 1718.3(4) | 0.091(10) |
| 4885.7(5) | 5+ | 1548.5(4) | 0.14(2) | ||
| 5446.4(5) | (4+) | 987.7(3) | 0.14(4)b | ||
| 6476.3(4) | (5-) | 4830.5(4) | 4- | 1645.6(3) | 0.40(7) |
| 4942.4(4) | 5- | 1534.8(5) | 0.085(9) | ||
| 6492.8(3) | (6,7+) | 5398.9(5) | (6+) | 1093.9(3) | 0.73(5) |
| 6526.2(5) | (6-8+) | 5628.9(3) | (7+) | 897.3(3) | 0.32(4) |
| 6598.5(5) | (6-) | 4942.4(4) | 5- | 1656.1(3) | 4.0(3) |
| 5398.9(5) | (6+) | 1199.6(5) | 0.036(10)b | ||
| 6630.6(4) | (6+) | 4715.9(4) | 6+ | 1914.6(3) | 2.5(2) |
| 4885.7(5) | 5+ | 1745.1(5) | 0.23(5) | ||
| 4918.8(5) | 7+ | 1711.6(3) | 0.24(2) | ||
| 5398.9(5) | (6+) | 1231.9(4) | 0.27(3)b | ||
| 6709.7(4) | (6-) | 4918.8(5) | 7+ | 1791.0(3) | 0.42(4) |
| 4942.4(4) | 5- | 1767.2(3) | 3.2(3)b | ||
| 6733.4(4) | (5+) | 4416.6(3) | 4+ | 2317.1(4) | 0.098(10) |
| 4885.7(5) | 5+ | 1847.5(3) | 0.12(2)b | ||
| 6895.8(4) | (7+) | 4918.8(5) | 7+ | 1977.1(3) | 0.31(3) |
| 5398.9(5) | (6+) | 1496.8(3) | 0.37(3) | ||
| 6997.1(3) | (7+) | 4715.9(4) | 6+ | 2281.0(3) | 0.35(3) |
| 4918.8(5) | 7+ | 2078.3(3) | 0.22(2) | ||
| 5478.4(6) | (8+) | 1519.2(5) | 0.14(2)b | ||
| 5628.9(3) | (7+) | 1368.2(5) | 0.43(5)b | ||
| 7210.8(3) | 6- | 4830.5(4) | 4- | 2380.0(3) | 38(3) |
| 4885.7(5) | 5+ | 2325.5(3) | 0.85(6) | ||
| 4918.8(5) | 7+ | 2292.2(3) | 1.04(10) | ||
| 4942.4(4) | 5- | 2268.7(3) | 27(2) | ||
| 5387.3(3) | (4-) | 1823.2(3) | 1.41(10) | ||
| 5398.9(5) | (6+) | 1812.6(6) | 0.12(1) | ||
| 5628.9(3) | (7+) | 1582.1(3) | 1.16(9) | ||
| 5697.7(3) | (5+) | 1513.8(3) | 0.34(3) | ||
| 5753.9(4) | (6+) | 1456.9(3) | 1.44(11) | ||
| 5766.3(3) | (5+) | 1445.1(3) | 0.49(4) | ||
| 6008.2(4) | (7+) | 1202.4(6) | 0.024(7)b | ||
| 6235.5(3) | (7+) | 975.6(3) | 1.4(2)b | ||
| 6296.6(5) | (5-) | 913.9(4) | 0.121(14)b | ||
| 6434.2(3) | (5+) | 777.4(3) | 0.15(2)b | ||
| 6476.3(4) | (5-) | 733.5(3) | 0.38(3) | ||
| 6598.5(5) | (6-) | 612.6(3) | 0.42(3) | ||
| 6709.7(4) | (6-) | 501.8(4) | 1.7(4) | ||
| 6630.6(4) | (6+) | 580.8(5) | 0.09(2)b | ||
| 7244.0(3) | 7- | 4715.9(4) | 6+ | 2527.9(3) | 1.47(10) |
| 4848.3(5) | 8+ | 2395.4(3) | 2.3(2) | ||
| 4942.4(4) | 5- | 2301.3(3) | 2.0(2) | ||
| 5398.9(5) | (6+) | 1845.3(3) | 0.46(3) | ||
| 5478.4(6) | (8+) | 1766.2(3) | 3.2(3)b | ||
| 5753.9(4) | (6+) | 1489.4(4) | 0.084(11) | ||
| 6235.5(3) | (7+) | 1008.1(5) | 0.11(2) | ||
| 6492.8(3) | (6,7+) | 751.3(3) | 0.124(12) | ||
| a Relative intensities normalized to 100 units for the | |||||
| 42+ 375-keV transition. For intensity per 100 | |||||
| decays of the parent, multiply by 0.56(4). | |||||
| b Intensity from - coincidences. | |||||
Given the two-neutron separation energy in the 132Sn S2n(132Sn)=12557.0(27) keV Wang2017, there is a 1583 keV energy window, within Qβ(132In), that makes the decay via a -delayed two neutron branch possible. We have searched for rays belonging to the A = 130 mass chain. Nevertheless, no evidence has been found that would point to the existence of a -2n decay branch in 132In. This is consistent with expectations, since the only levels in 130Sn that could be populated are the 0+ g.s. and 2+ at 1221 keV NDS130. Assuming a (7-) spin-parity assignment for the 132In g.s. Jungclaus2016, this decay will be highly suppressed.
III.2 -delayed neutron decay of 133In
The large Qβ=13.4(2) MeV value along with the low neutron separation energy in 133Sn, Sn=2.399(3) MeV Wang2017, favor the 133In decay via -delayed neutron emission to 132Sn. This gives rise to the large Pn values for both 133In -decaying isomers Piersa2019. The lower spin of the 133In (9/2+) ground state and (1/2-) isomer, in comparison with 132In (7-), is expected to favor the population of low spin p-h excited states that are not fed in the decay of 132In due to the large spin of the parent (7-). The population of 132Sn excited levels in the decay of 133In was already reported in Piersa2019, where the decay of 133In was investigated focusing on the excited structure of 133Sn. In the present work, we concentrate on results of the -n decay of 133In to 132Sn, discuss excited states in 132Sn and report new transitions following the -n decay branch of 133In.
III.2.1 Feeding of excited states in 132Sn
Gamma rays emitted after the decay of 133In can be clearly distinguished from the background by their time distribution following the impact of protons on target. Nevertheless, the decay curve does not allow the separation of the transitions that belong to 132Sn from those of 133Sn, neither from the background induced by -delayed neutrons from 133In -n decay.
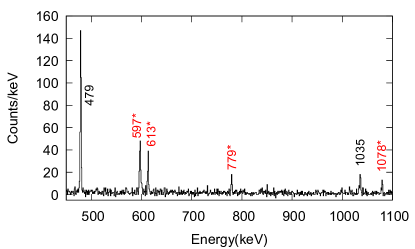
The identification of new rays that belong to 132Sn is based on - coincidences. Gamma rays with energies below 4 MeV are always a part of a cascade since they cannot directly feed the g.s. The analysis allows to identify several levels and rays in 132Sn that are not observed in the 132In decay, see Figure 6. Among them we confirm the states at 4965, 5131, 5431 and 5790 keV.
| Ei | J | Ef | J | Eγ | I | I |
|---|---|---|---|---|---|---|
| (keV) | (keV) | (keV) | 133gIn | 133mIn | ||
| 4041.6(3) | 2+ | 0 | 0+ | 4041.6(3) | 100 | 100 |
| 4351.6(3) | 3- | 0 | 0+ | 4351.5(3) | 54(8) | 70(11) |
| 4041.6(3) | 2+ | 310.5(3) | 7.0(9) | 12(2) | ||
| 4416.6(3) | 4+ | 0 | 0+ | 4416.7(3) | 13(2) | 9(2) |
| 4041.6(3) | 2+ | 374.9(3) | 74(9) | 39(6) | ||
| 4351.6(3) | 3- | 64.4(3) | 0.96(11)b | 0.51(7)b | ||
| 4715.9(4) | 6+ | 4416.6(3) | 4+ | 299.3(3) | 31(4) | 13(2) |
| 4830.5(4) | 4- | 4351.6(3) | 3- | 478.9(3) | 18(2) | 18(2) |
| 4416.6(3) | 4+ | 414.5(3) | 0.9(5) | 0.21(8)a | ||
| 4848.3(5) | 8+ | 4715.9(4) | 6+ | 132.4(3) | 4.0(6) | <2a |
| 4885.7(5) | 5+ | 4416.6(3) | 4+ | 469.1(5) | 11.1(14) | 7(2) |
| 4715.9(4) | 6+ | 169.5(4) | 1.5(7)a | <1.6a | ||
| 4918.8(5) | 7+ | 4715.9(4) | 6+ | 202.9(3) | 5.4(8) | 3(2) |
| 4848.3(5) | 8+ | 70.9(4) | 0.8(1)b | 0.4(2)b | ||
| 4942.4(4) | 5- | 4351.6(3) | 3- | 590.4(3) | 0.7(6)a | 0.22(3)b |
| 4416.6(3) | 4+ | 525.9(3) | 10.1(14) | 6.6(10) | ||
| 4715.9(4) | 6+ | 226.5(3) | 0.21(3)b | 0.14(2)b | ||
| 4830.5(4) | 4- | 111.3(3) | 1.0(3) | 0.56(9)b | ||
| 4949.0(5) | (3-) | 4830.5(4) | 4- | 117.9(5) | 1.4(4) | 1.0(7) |
| 4351.6(3) | 3- | 597.4(6) | 8(2)a | 12(4)a | ||
| 4041.6(3) | 2+ | 908.2(4) | 1.5(3) | <8 | ||
| 4965.3(7) | (3+) | 4416.6(3) | 4+ | 549.0(4) | 1.0(6) | 1.9(8)a |
| 4351.6(3) | 3- | 613.5(5) | 3.8(5) | 13(5)a | ||
| 4041.6(3) | 2+ | 923.8(7) | 2.4(5) | 3.2(12) | ||
| 5131.2(6) | (2-) | 4351.6(3) | 3- | 779.2(4) | 2.3(4) | 14(3) |
| 0 | 0+ | 5131.9(8) | 1.1(5) | 4(3) | ||
| 5387.3(3) | (4-) | 4351.6(3) | 3- | 1036.0(3) | 3.9(5) | 3.9(12) |
| 4830.5(4) | 4- | 557.1(4) | 0.39(6)b | 0.39(13)b | ||
| 4942.4(4) | 5- | 444.6(4) | 0.71(14)b | 0.7(2)b | ||
| 4949.0(5) | (3-) | 437.2(4) | 0.7(2)b | 0.7(2)b | ||
| 5398.9(5) | (6+) | 4715.9(4) | 6+ | 683.0(3) | 4.7(7) | 2.2(19) |
| 5431.4(7) | (3) | 4041.6(3) | 2+ | 1390.3(14) | 2.0(7) | 4.8(8) |
| 4351.6(3) | 3- | 1078.9(7) | 2.4(8)a | 4(2) | ||
| 4416.6(3) | 4+ | 1015.4(10) | 2.8(7)a | 1.1(8)a | ||
| 5446.4(5) | (4+) | 4416.6(3) | 4+ | 1029.8(4) | 4.6(6) | 2.9(12) |
| 5478.4(6) | (8+) | 4848.3(5) | 8+ | 630.2(3) | 3.2(7) | 3.2(13) |
| 5628.9(3) | (7+) | 4715.9(4) | 6+ | 913.1(3) | 1.9(3) | <1a |
| 4848.3(5) | 8+ | 780.6(3) | 0.79(13)b | <0.3b | ||
| 4918.8(5) | 7+ | 710.1(3) | 0.31(5)b | <0.2b | ||
| 5398.9(5) | (6+) | 229.8(3) | 0.10(2)b | <0.05b | ||
| 5478.4(6) | (8+) | 150.3(3) | 0.047(8)b | <0.03b | ||
| 5697.7(3) | (5+) | 4416.6(3) | 4+ | 1280.7(2) | 0.8(3) | 2.1(17)b |
| 4715.9(4) | 6+ | 982.2(3) | 0.8(4) | 1.3(9)a | ||
| 4885.7(5) | 5+ | 812.4(6) | 0.5(4)b | 0.7(7)b | ||
| 5753.9(4) | (6+) | 4715.9(4) | 6+ | 1038.2(3) | 2.0(6)a | 0.8(7)a |
| 5398.9(5) | (6+) | 354.3(3) | 0.6(2)b | 0.3(2)b | ||
| 5766.2(3) | (5+) | 4416.6(3) | 4+ | 1349.6(3) | 1.4(10) | 2.3(15)a |
| 4715.9(4) | 6+ | 1050.3(4) | 0.9(4)a | 0.46(7) | ||
| 4885.7(5) | 5+ | 881.7(3) | 0.9(3) | 0.24(6) | ||
| 4942.4(4) | 5- | 823.2(7) | 0.4(2)b | 0.26(4)a | ||
| 5790.4(6) | (4+) | 4416.6(3) | 4+ | 1373.9(4) | 2.7(3) | 3.3(13)a |
| 4351.6(3) | 3- | 1438.5(4) | 0.8(3) | 1.0(6) | ||
| 6296.6(5) | (5-) | 4830.5(4) | 4- | 1466.1(3) | 1.9(11)a | <0.5a |
| 6476.3(4) | (5-) | 4830.5(4) | 4- | 1645.6(3) | 1.6(10)a | <0.5a |
| 4942.4(4) | 5- | 1534.8(5) | 0.3(2)b | <0.1b | ||
| a Intensity obtained from - coincidences. | ||||||
| b Not observed in this decay, intensity calculated from | ||||||
| 132In decay data. | ||||||
| c Relative intensities normalized to 100 units for the | ||||||
| 4042-keV transition. | ||||||
| For intensity per 100 decays multiply by 0.049(5). | ||||||
| d Relative intensities normalized to 100 units for the | ||||||
| 4042-keV transition. | ||||||
| For intensity per 100 decays multiply by 0.043(5). | ||||||
The low spin of the states to which they can de-excite suggests a small spin value (2-4) for these levels, which makes them good candidates for the remaining particle-hole states with low spin expected in this energy range. In Figure 7 the level-scheme of 132Sn in the -n decay of 133In is depicted. The direct feeding to each level (Iβ-n) is measured by analyzing the -ray intensities calculated separately for each isomer. The indium beams for each isomer were separated taking advantage of the isomer selectivity provided by RILIS. However the separation was not complete, and the 133mIn beam contained a contribution of 30% of 133gIn Piersa2019. The amount of 133mIn in the 133gIn beam is below 5%. The total feeding has been calculated using the intensities of the -rays emitted by the daughters. The observed states in 132Sn following the -n decay of the 133In (9/2+) g.s. and (1/2-) isomeric state are listed in Table LABEL:tab:133In_gamma_intensities.
III.2.2 High energy -rays
Another interesting feature observed in the -decay of 133In is the presence of several rays at very high energies, above 5 MeV, with a time behavior compatible with the decay of 133g,mIn. The existence of those rays was already reported in Piersa2019, where the 6088-keV transition was assigned to 133Sn. Some other -rays were discussed in Piersa2019 as being emitted in the decay of 133In, however the lack of - coincidences does not allow to identify the daughter tin isotopes they belong to.
The high energy lines observed in the 133g,mIn decays are shown in Figure 8. As it can be seen, the observed peaks differ notably depending on the selected -decaying indium state. In the decay of the 133gIn (9/2+) g.s. there are two predominant -rays, the one at 6088 keV mentioned above, and another one at 6019 keV. Although the 6019-keV peak has the same energy as a transition in 57Fe produced by the neutron background as discussed in Piersa2019 its intensity is only a small fraction of the total -ray intensity from the excited 7647-keV level in 57Fe, while the other, more intense transitions, are not observed. Therefore the 6019-keV transition is likely to be emitted following the -decay of 133In, and predominantly from the (9/2+) g.s.

In the decay of the 133mIn (1/2-), the 6088- and 6019-keV transitions are suppressed, but several other peaks, which are absent in the decay of the 133gIn, can be identified. Those peaks appear at the energies of 5440, 5712, 5770, 5952, and 6067 keV. Two more tentative peaks, at the detection limit of the HPGe detectors, are seen at 6220 and 6463 keV. Some of these lines may be compatible with escape peaks from other rays (for instance single and double escape peaks from 6463 keV), but it is not possible to make a consistent identification for all of the energies. It is interesting to observe transitions having this energy from the decay of the (1/2-) isomer, as there are unidentified members of particle-hole multiplets in 132Sn, such as p3/2d, g7/2g and p3/2s, that can give rise to low spin levels. It is very unlikely to populate them in the decay of 132In with (7-). However, the feeding of such levels would be strongly favored in the -n decay of the (1/2-) state in 133mIn. All of this points towards these transitions likely originating from the de-excitation of such p-h multiplet states.
It is worth mentioning that a 5131-keV peak can be seen in both the 133gIn and 133mIn decays. This ray has been firmly identified to belong to 132Sn since its energy perfectly matches the de-excitation of the new 5131-keV level proposed in this work. In addition, the existence of a transition to the 0+ g.s. supports the tentative assignment of this level to the 2- state of the f7/2d multiplet.
For the sake of completeness, the -rays observed in the 133In decay that have not been assigned to any decay branch are listed in Table 3.
| Eγ | I | I |
| (keV) | 133gIn (9/2+) | 133mIn (1/2-) |
| 1116(2) | 2.5(4) | 4.6(8) |
| 1529.7(7) | - | 2.6(7) |
| 1649.9(4) | - | 7(1) |
| 4110.8(3) | 8(1) | 8(2) |
| 5439.6(4)d | - | 4(2) |
| 5711.6(9)e | - | 3.7(12)c |
| 5770(1) | - | 3.8(12)c |
| 5952.5(6)d | - | 6(2)c |
| 6018(2) | 4.7(9) | 6(2)c |
| 6067(2) | - | 3.9(13)c |
| 6220(2) | - | 2.6(10)c |
| 6463(3) | - | 2.0(9)c |
| aFor Iabs multiply by 0.049(5). | ||
| bFor Iabs multiply by 0.043(5). | ||
| cIntensity obtained from -gated spectrum. | ||
| dEnergy compatible with the escape peaks from the | ||
| tentative 6463-keV -ray. | ||
| eEnergy compatible with the single escape peak from | ||
| the tentative 6220-keV -ray. | ||
III.2.3 -delayed neutron emission from 133In
We have used the same procedure described above for 132In to determine the -delayed neutron emission probabilities from the 133In (9/2+) ground state and (1/2-) isomer. The most intense rays have been considered in the analysis. For 133Sn 133Sb decay, the absolute intensity of 12(2) for the 962-keV transition was adopted from Blomqvist1983, while for the 132Sn 132Sb an absolute intensity of 48.8(12) for the 340-keV transition was taken from PhysRevC.39.1963. The relative decay activity of the tin daughter nuclei was corrected for the tape movement. In particular, the supercycle structure of the proton beam has to be considered for the evaluation of the unobserved activity. Our analysis yields Pn=90(3) for the decay of the 133In 9/2+ g.s., and Pn=93(3) for the decay of the (1/2-) isomer. The results differ from those previously reported by us in Piersa2019, which were obtained from the same dataset but where the supercycle structure was not fully taken into account. The re-evaluated results are in agreement with the Pn=85(10) value in Hoff1996.
III.3 Lifetime measurements
Lifetimes of excited levels in 132Sn have been investigated by means of the Advanced Time-Delayed (t) fast-timing method Mach1989; Moszynski1989; Fraile2017. The lifetimes were mainly obtained from the time differences between the fast and LaBr3(Ce) detectors. A coincidence condition on the HPGe detectors is applied. The HPGe detectors do not participate in the timing information, but are essential in this complex level scheme due to their energy resolution to obtain the required -ray selectivity.
The use of two different LaBr3(Ce) detectors gives us the possibility to obtain two independent measurements for the same lifetime, one per -LaBr3(Ce) combination. In addition, (t) time differences between the two LaBr3(Ce) detectors are used when possible. To illustrate the analysis and the results here obtained, we discuss the half-life of the 4416-keV 4+ and 4831-keV 4- levels, depicted in Figure 9 and Figure 10 respectively.
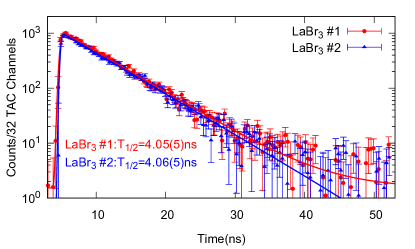
To measure the 4416-keV 4+ level half-life using (t) events a time distribution was generated by selecting the 526- and 375-keV transitions in the HPGe and LaBr3(Ce) detectors respectively. Corrections were included to account for the contribution of Compton background. The 4416-keV 4+ state lifetime is free from the influence of other long-lives states and shows up as an exponential tail which can be fitted to measure the half-life. The analysis was done separately for each of the two LaBr3(Ce) as well as for each of the two available data sets. In the case of (t) events, the 299-keV and 375-keV transitions are selected. Here no extra gate in the HPGe energies is needed thanks to the large peak to background ratio. The lifetime is measured from time difference distributions with the direct and reversed energy selection on the LaBr3(Ce) detectors, giving two independent measurements for each of the two data sets. Using the two experimental data sets, our analysis yields 8 independent measurements for the half life, 4 from (t) events and another 4 from (t), all of them consistent with each other. The final value is obtained from the weighted average from these measurements, yielding a final value of 3.99(2) ns, which is in good agreement with the 3.95(13) ns reported by Fogelberg et al. Fogelberg1995.
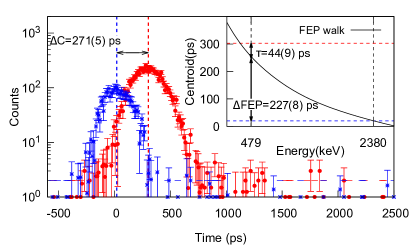
Shorter lifetimes were measured using the centroid shift method. In Figure 10, the analysis to extract the lifetime of the 4830-keV 4- level is is illustrated for (t) events for one of the LaBr3(Ce) detectors. In this case the mean life is derived from the centroid shift of the time distribution with respect to a prompt cascade, corrected by the FEP time response calibration.
The analysis has been repeated for both LaBr3(Ce) detectors and both data sets, and also using the (t) method, yielding six independent values for the 4830-keV 4- level mean-life. The weighted average of T1/2=27(2) ps is adopted as the final result. The half-life is in very good agreement with the 26(5) ps reported by Fogelberg et al. Fogelberg1995. It should be noted that the uncertainties in Fogelberg1994 are too small to be compatible with a fast-timing measurement; the values within brackets in Fogelberg1995 are actually the errors in ps Priv_Comm_Mach, so the uncertainties from Fogelberg1995 are adopted.
The lifetime of the 4848-keV 8+ level is beyond the fast-timing time range, but it can be investigated using (t) coincidences between the plastic scintillator and the HPGe detectors. Three -HPGe(t) time differences spectra were obtained by selecting the 132-, 299- and 375-keV rays, respectively. The half-life was measured by fitting the delayed slope of the spectra in a long time range of 30 s. The contribution of random coincidences to the time spectra in this range had to be carefully taken into account. Our analysis yields T1/2=2.108(14) s for the 4848-keV level in agreement with the value of 2.080(17) s reported in the latest evaluation NDS132.
The analysis procedures were extended to the other observed levels, provided sufficient statistics were available. The data sets from the two experimental runs have been combined for the analysis. The lifetimes of 7 different states were measured. In addition, upper limits for additional 7 levels were obtained. The results obtained in this work for level lifetimes in 132Sn are compiled in Tables LABEL:tab:rates and compared to the previous -decay studies.
The overall agreement is quite good, with the exception of the 4919-keV 7+ level whose half-life is 104(4) ps, much higher than the value of 62(7) ps reported earlier Fogelberg1994, which was measured using BaF2 scintillator detectors. Since this level can only be measured by analyzing the time distribution of the 203-keV -ray, where the contribution of Compton background is very important, the difference may stem from time corrections in this difficult energy range.
The reduced transition probabilities for de-exciting -transitions in 132Sn have been determined using the measured lifetimes, branching ratios and energies, and using theoretical internal conversion coefficients KIBEDI2008202. The most likely spin-parity assignments are employed (see Section LABEL:sec:discussion). The transition rates are calculated assuming a pure multipolarity character of the transitions.