Constraining the X-ray - Infrared spectral index of second-timescale flares from SGR 1935+2154 with Palomar Gattini-IR
Abstract
The Galactic magnetar SGR 1935+2154 has been reported to produce the first known example of a bright millisecond duration radio burst (FRB 200428) similar to the cosmological population of fast radio bursts (FRBs), bolstering the association of FRBs to active magnetars. The detection of a coincident bright X-ray burst has revealed the first observed multi-wavelength counterpart of a FRB. However, the search for similar emission at optical wavelengths has been hampered by the high inferred extinction on the line of sight. Here, we present results from the first search for second-timescale emission from the source at near-infrared wavelengths using the Palomar Gattini-IR observing system in -band, made possible by a recently implemented detector read-out mode that allowed for short exposure times of s with 99.9% observing efficiency. With a total observing time of hours ( images) on source during its 2020 outburst, we place median limits on the second-timescale emission of mJy ( AB mag). We present non-detection limits from epochs of four simultaneous X-ray bursts detected by the Insight-HXMT and NuSTAR telescopes during our observing campaign. The limits translate to an observed fluence limit of Jy ms, while the corresponding extinction corrected limit is Jy ms for an estimated extinction of mag. These limits provide the most stringent constraints (energy erg at 9 kpc) to date on the fluence of flares at frequencies of Hz, and constrain the ratio of the near-infrared (NIR) fluence to that of coincident X-ray bursts to . Our observations were sensitive enough to easily detect a near-infrared counterpart of FRB 200428 if the NIR emission falls on the same power law as that observed across its radio to X-ray spectrum. The non-detection of NIR emission around the coincident X-ray bursts constrains the fluence index of the brightest burst to be steeper than .
1 Introduction
The source SGR 1935+2154 was discovered in 2014 as a short ( s) burst (Stamatikos et al., 2014) by the Burst Alert Telescope on board the Neil Gehrels Swift Observatory (Gehrels et al., 2004). Subsequent follow-up in the X-ray wavebands revealed that the object was a new member of the class of Soft Gamma-ray Repeaters (SGRs) originating from a Galactic magnetar with a spin period of s, period derivative of s s-1, characteristic age of years and surface magnetic field of G (Israel et al., 2016). The source is coincident with the center of the supernova remnant G57.2+0.8 (Sun et al., 2011; Kozlova et al., 2016; Zhou et al., 2020; Zhong et al., 2020) at a distance of kpc. Pulsed radio emission has so far remained undetected at radio bands (Israel et al., 2016; Surnis et al., 2016; Younes et al., 2017; Lin et al., 2020b). In the optical and near-infrared (NIR) regime, a possible faint ( mag) counterpart has been identified in follow-up imaging with the Hubble Space Telescope (Levan et al., 2018).
Since its discovery, the source has sporadically gone into outburst over the last few years (Lin et al., 2020a), with the most recent being reported as a “forest” of X-ray bursts detected during 27-28 April 2020 (Palmer & BAT Team, 2020; Younes et al., 2020). Following the onset of the outburst, an unprecedented bright millisecond duration radio burst (hereafter FRB 200428) was detected from the source by the Canadian Hydrogen Intensity Mapping Experiment (CHIME; The CHIME/FRB Collaboration et al. 2020) and STARE2 (Bochenek et al., 2020) telescopes, together with a bright hard X-ray counterpart detected by the INTEGRAL (Mereghetti et al., 2020), AGILE (Tavani et al., 2020), Konus-Wind (Ridnaia et al., 2020) and HXMT (Li et al., 2020a) space telescopes. The high luminosity of the radio burst was within a factor of of the luminosity of extragalactic Fast Radio Bursts (FRBs; Cordes & Chatterjee 2019; Petroff et al. 2019) observed at cosmological distances, providing strong evidence that at least some FRBs could arise from active SGRs.
The simultaneous detection of the X-ray burst provides the first evidence of a multi-wavelength counterpart for FRBs. Thus, several optical facilities performed follow-up observations of the source to detect and constrain the presence of optical counterparts coincident with radio/X-ray bursts (Niino et al., 2020; Lin et al., 2020b). However, the location of the source in the Galactic plane together with the high observed X-ray column density ( cm-2; Israel et al. 2016; Younes et al. 2017; Li et al. 2020a) suggests a large line-of-sight optical extinction towards the source ( mag). In the case of FRB 200428, no optical counterpart was detected in a simultaneous observation by the BOOTES telescope (Lin et al., 2020b) to an extinction corrected fluence limit of Jy ms. However, the inferred extinction in the NIR is substantially smaller, and expected to be of the optical in -band.
Palomar Gattini-IR (PGIR) is a new wide-field NIR time domain survey scanning the entire Northern sky every two nights to a median depth of AB mag (Moore & Kasliwal, 2019; De et al., 2020a). With the implementation of a new detector readout mode that allows for fast (exposure time s) and continuous (duty cycle %) exposures of the sky, we initiated targeted follow-up observations of the source. In this paper, we describe the PGIR follow-up campaign and constraints from simultaneous NIR observations of SGR 1935+2154 at the times of detected X-ray bursts. Section 2 describes the observing strategy and resulting observation schedule. In Section 3, we describe the methods used to analyze the acquired data, and Section 4 uses the non-detection of NIR bursts to constrain the fluence ratios of multi-wavelength counterparts of X-ray bursts from SGR 1935+2154. We conclude with a summary of our results, and prospects for future searches in Section 5.
2 Observations
| ID | UT Start | UT End | Mode | Exp. time | Total exposure | Duty cycle | limit | |
|---|---|---|---|---|---|---|---|---|
| (s) | (s) | (%) | (mJy/Jy ms) | |||||
| 1 | 2020-05-01 08:24:38.9 | 2020-05-01 12:34:53.6 | I | 1.65 | 2722 | 4491.3 | 29.9 | 9/16 |
| 2* | 2020-05-02 07:49:45.5 | 2020-05-02 12:34:14.1 | II | 0.84 | 18009 | 15127.6 | 89.7 | 25/21 |
| 3* | 2020-05-05 08:20:13.7 | 2020-05-05 12:31:09.0 | II | 0.84 | 15917 | 13370.3 | 89.7 | 23/19 |
| 4 | 2020-05-23 11:23:09.0 | 2020-05-23 11:38:27.3 | III | 0.84 | 1084 | 910.6 | 99.9 | 16/13 |
| 5 | 2020-05-24 06:57:05.3 | 2020-05-24 07:29:43.4 | III | 0.84 | 2310 | 1940.4 | 99.9 | 19/16 |
| 6† | 2020-05-24 11:09:27.4 | 2020-05-24 11:34:12.3 | III | 0.84 | 1706 | 1433.0 | 97.3 | 21/18 |
| 7 | 2020-05-28 06:13:49.2 | 2020-05-28 07:13:34.7 | III | 0.84 | 4229 | 3552.4 | 99.9 | 18/15 |
| 8† | 2020-05-31 09:01:30.0 | 2020-05-31 09:39:32.9 | III | 0.84 | 1751 | 1470.8 | 64.6 | 62/52 |
Following the detection of the train of X-ray bursts from SGR 1935+2154 (Palmer & BAT Team, 2020) and FRB 200428 (The CHIME/FRB Collaboration et al., 2020; Bochenek et al., 2020), we triggered targeted observations of the source using PGIR on UT 2020-05-01. Due to the short expected emission timescale for counterparts from X-ray/radio bursts from the source ( s) as well as the background noise limited nature of NIR imaging with this instrument (see Table 1 in De et al. 2020a), we used the shortest possible exposure time allowed by the standard readout scheme ( s) used in survey operations with an observing efficiency of 30% including dithers. Following this initial epoch, we significantly increased our observing efficiency, as well as our sensitivity to short timescale flares, by using a newly implemented readout mode of the H2RG detector array in Palomar Gattini-IR (De et al., 2020a). In this new mode, the detector is read out and digitized continuously while exposing on the sky, with an effective exposure time equivalent to the frame readout time of s (see Appendix A for details).
Table 1 provides a summary of all the observing epochs on the source, including the readout mode used and the placement of the source in the large field of view. While the initial observations were designed to monitor the source for the total duration of its night time visibility from Palomar ( hours below airmass of 2) near the peak of its outburst, subsequent epochs in the second half of May 2020 were coordinated with the published visibility windows of the source with the Insight-HXMT satellite111Published at http://enghxmt.ihep.ac.cn/dqjh.jhtml and the CHIME telescope (K. Smith, pers. comm.).
3 Data analysis
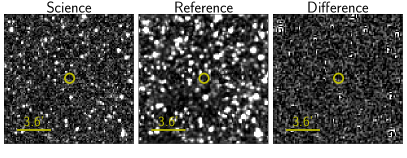
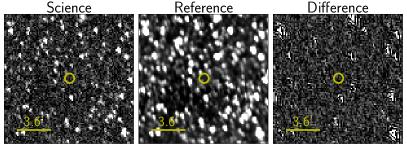
The location of the source in a dense region of the Galactic plane together with the large pixel scale and under-sampled PSFs of the Gattini observing system present several challenges to the data reduction procedure, which were modified and adapted from the nominal survey mode. Appendix B provides a detailed summary of the reduction process adopted for this data set. Figure 1 shows an example triplet of a fast readout science frame centered at the location of the source, the corresponding reference image and the resulting difference image. We were able to obtain high quality difference images in all the epochs, which show only background noise fluctuations and residual astrometric/Poisson noise from nearby bright stars.
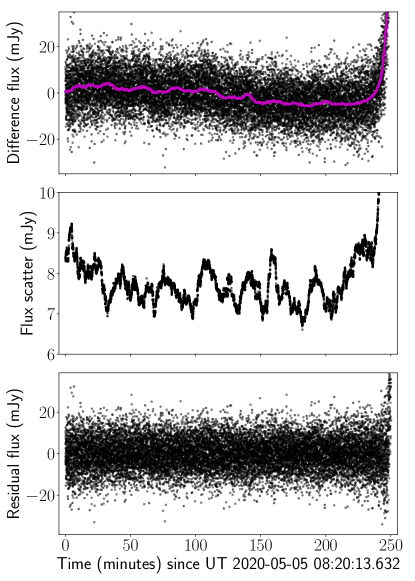
Figure 2 shows a time series of the measured difference flux during one of the observing sessions222The measured flux in counts was converted to mJy using the 2MASS zero-points published at https://old.ipac.caltech.edu/2mass/releases/allsky/doc/sec6_4a.html. The corresponding flux density is Jy.. In order to estimate the uncertainty and signal-to-noise ratio of the flux measurements, we measured the standard deviation of the fluxes in a running window of 200 observations around each image in the sequence. The measured flux scatter exceeds the propagated noise terms by % due to the presence of unaccounted noise terms such as correlated noise between the pixels introduced during the resampling process. The measured flux uncertainty exhibits temporal variations of the order of % over the duration of the night, reflecting the variation in the foreground -band sky brightness.
In addition to random scatter introduced due to time variable airglow in the -band sky, the measured fluxes also show slow temporal variations (over time scales of tens of minutes) in the median (see Figure 2) that correlate with the changing scatter from the sky background, thus arising from imperfect background subtraction with the changing sky background. Since this effect introduces a slow temporal trend, we subtract it using a running median around each image since we aim to detect short timescale flares ( s) from the source. The resulting residual time series is shown in Figure 2, and is consistent with Gaussian noise in the flux measurements.
4 Results
| ID | Instrument | Trigger time | Duration | X-ray fluence | Obs Start | Obs End | Diff. Fluence | limit |
|---|---|---|---|---|---|---|---|---|
| (UT) | (s) | (erg cm-2) | (UT Day) | (UT Day) | (erg cm-2) | (erg cm-2) | ||
| A | HXMT/NuSTAR | 2020-05-02 10:17:26.00 | 0.076 | 10:17:25.90 | 10:17:26.74 | |||
| B† | HXMT/NuSTAR | 2020-05-02 10:25:25.80 | 0.415 | 10:25:25.07 | 10:25:26.77 | |||
| C | HXMT | 2020-05-02 10:46:20.85 | 0.077 | 10:46:20.12 | 10:46:20.96 | |||
| D† | HXMT | 2020-05-05 12:09:29.75 | 0.039 | 12:09:28.94 | 12:09:30.65 |
Variability in the NIR correlated with X-ray flux changes have been detected in several known Galactic magnetars, but over timescales of days to years (e.g. Rea et al. 2004; Tam et al. 2004; Israel et al. 2005). Fast optical flaring has also been observed in a candidate Galactic soft gamma-ray repeater (Stefanescu et al., 2008; Castro-Tirado et al., 2008) over timescales of a few seconds. Similarly, a probable faint NIR counterpart (at mag) of SGR 1935+2154 was identified with a deep Hubble Space Telescope exposure during its 2015 – 2016 outbursts (Levan et al., 2018), where the IR emission was shown to be enhanced during periods of the X-ray outburst. Yet, it was suggested that the lack of a direct correlation between the NIR – X-ray fluxes disfavors a disk reprocessing scenario for the NIR emission, and was likely more consistent with a magnetospheric origin of both the emission components (Levan et al., 2018). Here, we focus instead on the detection and limits on second-timescale flares in the NIR, which remain so far observationally unconstrained from this source.
Over the duration of hours of observations (Table 1), we identified no reliable detections in the NIR time series at a flux level above from the background noise, beyond that expected from Gaussian noise. The median observed fluence limit on NIR bursts is Jy ms (uncorrected for line-of-sight extinction). In order to constrain potential multi-wavelength counterparts, we searched all available public reports of X-ray and radio bursts from the source within our observing time intervals. A total of four X-ray bursts were reported by the HXMT (Li et al., 2020b)333The updated list of bursts are available at http://enghxmt.ihep.ac.cn/bfy/331.jhtml and NuSTAR (Borghese et al., 2020) satellites during our observations. Table 2 provides an overview of the X-ray bursts reported during our observations. Notably, no significant emission was found detected around the reported epochs of four X-ray bursts. Below, we use the derived limits from our observations to constrain the fluence ratio of NIR bursts when compared to both the coincident X-ray bursts as well as the observed X-ray to radio spectrum of FRB 200428.
4.1 Extinction along the line of sight
Israel et al. (2016) find the neutral hydrogen column density () along the line of sight to be cm-2 using XMM-Newton spectra fitted by a two-component power-law (PL) and blackbody (BB) model, from which we obtain an attenuation mag (Güver & Özel, 2009) and mag (Rieke & Lebofsky, 1985). This extinction value is consistent with mag obtained using 3D dust map based on Pan-STARRS 1, Gaia, and 2MASS optical/NIR data (Green et al., 2019) assuming a distance of 8–12 kpc, although these dust maps suffer the lack of bright M-dwarf stars observable at these distances. For mag, the corresponding median limits on the intrinsic fluence of the bursts will be Jy ms (within a factor of two). For the rest of this work, we assume an extinction of mag towards the source, noting that the exact value does not significantly affect our constraints below due to the smaller effect of extinction in the NIR.
4.2 Constraints on the NIR fluence ratio from coincident X-ray bursts
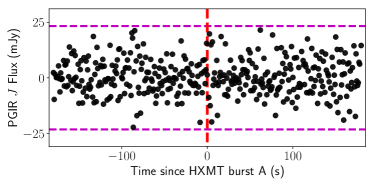
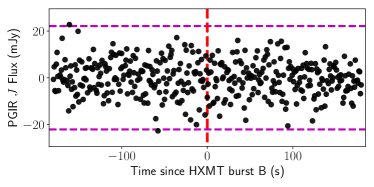
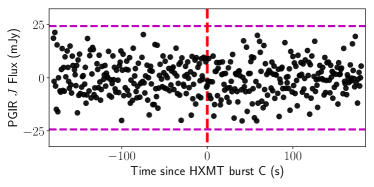
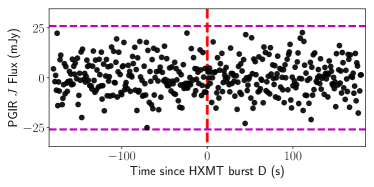
In Table 2, we list the X-ray bursts reported from HXMT and NuSTAR during our observing sequence, together with the reported X-ray fluences from HXMT and our measured difference image flux and corresponding limit on the NIR fluence444In order to be consistent with reported X-ray bursts, we define fluence as where is the observed frequency, is the spectral flux density and is the exposure time for our data.. We note that the expected dispersion delay between X-ray and optical pulses for the reported DM of pc cm-3 (The CHIME/FRB Collaboration et al., 2020; Bochenek et al., 2020; Zhang et al., 2020) is s and thus not important for our observations. However, since a delay between the X-ray and optical emission could arise as a result of the intrinsic emission mechanism, we show in Figure 3, the measured difference flux in a window of minutes centered on the times of the reported X-ray bursts555For comparison, we note that the X-ray and radio emission observed in FRB 200428 was coincident within a maximum conservative uncertainty of s, and shorter than our exposure time..
No significant emission is identified within this time window of the reported X-ray bursts and we list the derived limits on the NIR fluence of the bursts in Table 2. The strongest constraint on the NIR to X-ray fluence ratio () is derived from the brightest burst (Burst B), where the non-detection of NIR emission constrains after correcting for extinction. For comparison, we note that the extinction corrected for longer term correlated X-ray - NIR outbursts (over days – weeks) observed in Galactic magnetars range from typical values of (as seen for SGR 1935+2154 as well as some other X-ray pulsars; Levan et al. 2018; Rea et al. 2004; Tam et al. 2004) to (for the IR counterpart of SGR 1806-20; Israel et al. 2005).
4.3 Comparison to the multi-wavelength properties of FRB 200428
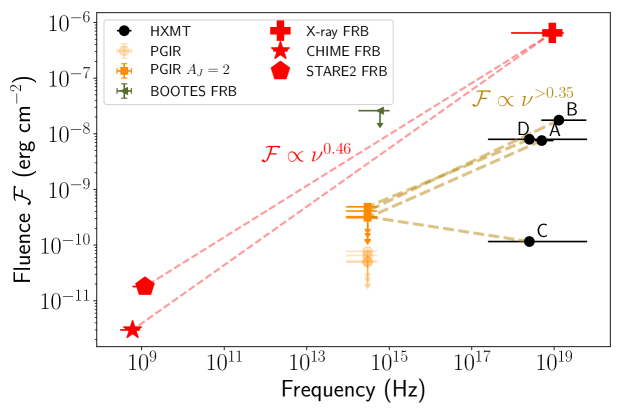
As the only other X-ray burst from SGR 1935+2154 that has been reported with a multi-wavelength (radio) counterpart, we compare the NIR limits to the observed spectral energy distribution (SED) of FRB 200428. The striking time coincidence between two X-ray pulses observed in the X-ray burst associated with FRB 200428 (Li et al., 2020a; Mereghetti et al., 2020) with the two radio pulses detected by CHIME (The CHIME/FRB Collaboration et al., 2020) potentially suggest a common emission source extending from the X-ray to radio frequencies. Li et al. (2020a) show that the HXMT X-ray burst associated FRB 200428 was characterized with a hard power law spectrum with a photon index666The corresponding flux density dependence is and fluence dependence is of . In particular, they show that the observed STARE2 fluence at GHz can be explained by a single power law in extending from X-ray to radio frequencies (see also Ridnaia et al. 2020).
In Figure 4, we show the observed fluence of FRB 200428 as a function of frequency, which suggests a fluence dependence of approximately . In addition, Figure 4 shows the observed fluences of the X-ray bursts reported within our observing session along with our NIR fluence limits. While the spectrum of the X-ray burst for FRB 200428 remains unconstrained below keV, Figure 4 shows that our observations had the sensitivity to detect (at confidence) a NIR counterpart of FRB 200428 if PGIR was observing at the time of the burst and the emission was characterized by a continuous power law extending from X-ray to radio frequencies. We note that the BOOTES limit from Lin et al. 2020b does not rule this out. However, we caution that the observed radio spectrum of FRB 200428 shows signatures of narrow bandwidth fluctuations (The CHIME/FRB Collaboration et al., 2020; Bochenek et al., 2020). Hence, the SED of FRB 200428 may not be consistent with a single power law extending from X-ray to radio frequencies, although propagation effects may affect this interpretation.
We compare this fluence index777Here we refer to the fluence index as the exponential factor of the observed fluence that scales as . () to the expected NIR emission from the coincident X-ray bursts within our observing sessions. The strongest constraints on the fluence index are derived from the brightest burst (Burst B), for which the fluence index888The corresponding constraint on the spectral index of is is constrained to . This index is close but not constraining enough to rule out a NIR counterpart for these X-ray bursts with the estimated fluence index of FRB 200428, assuming the NIR emission falls on the same power law as observed across the X-ray to radio spectrum. The non-detection is consistent with radio constraints derived from the non-detection of radio bursts by FAST of bursts from SGR 1935+2154 detected by Fermi-GBM (Lin et al., 2020b), who derive deep limits of Jy ms at 1.25 GHz for these bursts. These non-detections require much steeper X-ray to radio fluence indices () for the majority of bursts from SGR 1935+2154, suggesting that our limits in the NIR would not be deep enough to detect possible counterparts of the majority of bursts.
4.4 Comparison to theoretical models
Recent works have aimed to provide constraints on several proposed models for FRBs to explain the observed occurrence of FRB 200428 simultaneously with the bright X-ray burst (e.g. Margalit et al. 2020; Lu et al. 2020). These models primarily revolve around two scenarios – one where the X-ray/radio emission is generated inside the neutron star magnetosphere via coherent curvature radiation (e.g. Pen & Connor 2015; Cordes & Wasserman 2016; Kumar et al. 2017; Lu & Kumar 2018) or via coherent maser processes produced at shock interaction of relativistic ejecta with circumstellar material (e.g. Lyubarsky 2014; Beloborodov 2019; Metzger et al. 2019; Margalit et al. 2020). In addition, the X-ray, optical/NIR and radio emission may not be generated at the same location near the neutron star in several of these scenarios. Since the theoretical predictions for multi-wavelength counterparts are not well constrained enough to interpret our upper limits, we only briefly compare them to our NIR observational data.
Chen et al. (2020) provide a summary of the predictions for the fluence in the aforementioned models. In the case of the relativistic shock interaction model by Beloborodov (2019), if the the blast wave strikes a wind bubble in the tail of a previous flare, a bright optical flare could result with an optical to radio fluence ratio of (Chen et al., 2020). If some X-ray bursts from SGR 1935+2154 during the PGIR campaign were accompanied by a radio burst similar to FRB 200428, then we have the corresponding prediction of for (as observed by STARE2; Bochenek et al. 2020) and for (as observed by CHIME; The CHIME/FRB Collaboration et al. 2020). Our upper limits are thus comparable to these model predictions for the brighter X-ray bursts. On the other hand, for the curvature radiation model of Lu & Kumar (2018), very little NIR/optical (or higher-frequency) emission is expected from the coherently emitting particles. The transient event may be accompanied by incoherent emission processes inside the magnetosphere, and the maximum possible NIR flux from any incoherent emission processes from an emitting volume of radius cm and plasma temperature K is given by
| (1) | |||
| (2) |
where kpc is the distance to the source. We see that the NIR/optical emission from within the magnetosphere is undetectable in our observations for burst duration s.
5 Summary
In this Letter, we have presented results from a targeted follow-up campaign to search for second timescale NIR flares from the Galactic magnetar SGR 1935+2154 using Palomar Gattini-IR. The observations were enabled with a recently implemented detector read-out mode that allows for high time resolution readout of the detector array with nearly 100% observing efficiency. We found no significant counterparts for second timescale flares from the source above a median fluence limit of Jy ms. This non-detection, together with the relatively low inferred extinction towards the source at NIR wavelengths ( mag) allows us to place the most stringent extinction-corrected constraints till date on second-timescale flares from the source of Jy ms at optical/NIR wavelengths ( Hz). The NIR limit corresponds to an energy erg at a distance of 9 kpc (Zhong et al., 2020), and is within an order of magnitude of that reported in the radio for FRB 200428 at 1.25 GHz ( erg; Bochenek et al. 2020). It is also several orders of magnitude deeper than reported optical limits from nearby well-localized FRBs ( erg; Hardy et al. 2017; Andreoni et al. 2020).
A total of four X-ray bursts were detected by the HXMT and NuSTAR telescopes within our continuous observing campaign, although no NIR counterparts were detected. The non-detection of NIR emission around these bursts constrain the NIR to X-ray fluence ratio to . Comparing these fluence limits to the radio/X-ray fluence observed in FRB 200428, we show that our observations were sensitive enough to detect a NIR counterpart at a significance of if PGIR was observing at the time of FRB 200428 and the NIR emission falls on the same power law suggested for the radio/X-ray emission. The non-detection of NIR emission associated with the brightest X-ray burst within our observation time constrains the X-ray to NIR fluence index of the burst to be (spectral index ).
As Palomar Gattini-IR performs the first all-sky untargeted time domain survey of the dynamic infrared sky at timescales of days to years over the survey duration, these observations further demonstrate a unique new capability of this instrument to probe the infrared time domain sky at second timescales. Although the instrument uses a small (30 cm) telescope with coarse pixels that severely limit its sensitivity due to the bright -band foreground, these observations prove the scientific utility of specialized NIR detector read-out modes in finding large amplitude second-timescale flares from dust-obscured sources in the Galactic plane. This advocates for a systematic exploration of this hitherto unexplored phase space, which is possible with PGIR not only for single sources (as demonstrated in this work) but for large patches of the sky, enabled by the instrument’s large field of view.
References
- Andreoni et al. (2020) Andreoni, I., Lu, W., Smith, R. M., et al. 2020, arXiv e-prints, arXiv:2005.06273. https://arxiv.org/abs/2005.06273
- Beloborodov (2019) Beloborodov, A. M. 2019, arXiv e-prints, arXiv:1908.07743. https://arxiv.org/abs/1908.07743
- Bertin et al. (2002) Bertin, E., Mellier, Y., Radovich, M., et al. 2002, in Astronomical Society of the Pacific Conference Series, Vol. 281, Astronomical Data Analysis Software and Systems XI, ed. D. A. Bohlender, D. Durand, & T. H. Handley, 228
- Bochenek et al. (2020) Bochenek, C. D., Ravi, V., Belov, K. V., et al. 2020, arXiv e-prints, arXiv:2005.10828. https://arxiv.org/abs/2005.10828
- Borghese et al. (2020) Borghese, A., Coti Zelati, F., Rea, N., et al. 2020, arXiv e-prints, arXiv:2006.00215. https://arxiv.org/abs/2006.00215
- Castro-Tirado et al. (2008) Castro-Tirado, A. J., de Ugarte Postigo, A., Gorosabel, J., et al. 2008, Nature, 455, 506, doi: 10.1038/nature07328
- Chen et al. (2020) Chen, G., Ravi, V., & Lu, W. 2020, arXiv e-prints, arXiv:2004.10787. https://arxiv.org/abs/2004.10787
- Cordes & Chatterjee (2019) Cordes, J. M., & Chatterjee, S. 2019, ARA&A, 57, 417, doi: 10.1146/annurev-astro-091918-104501
- Cordes & Wasserman (2016) Cordes, J. M., & Wasserman, I. 2016, MNRAS, 457, 232, doi: 10.1093/mnras/stv2948
- De et al. (2020a) De, K., Hankins, M. J., Kasliwal, M. M., et al. 2020a, PASP, 132, 025001, doi: 10.1088/1538-3873/ab6069
- De et al. (2020b) De, K., Kasliwal, M. M., Tzanidakis, A., et al. 2020b, arXiv e-prints, arXiv:2004.09029. https://arxiv.org/abs/2004.09029
- Fruchter & Hook (2002) Fruchter, A. S., & Hook, R. N. 2002, PASP, 114, 144, doi: 10.1086/338393
- Gehrels et al. (2004) Gehrels, N., Chincarini, G., Giommi, P., et al. 2004, ApJ, 611, 1005, doi: 10.1086/422091
- Green et al. (2019) Green, G. M., Schlafly, E., Zucker, C., Speagle, J. S., & Finkbeiner, D. 2019, ApJ, 887, 93, doi: 10.3847/1538-4357/ab5362
- Güver & Özel (2009) Güver, T., & Özel, F. 2009, MNRAS, 400, 2050, doi: 10.1111/j.1365-2966.2009.15598.x
- Hardy et al. (2017) Hardy, L. K., Dhillon, V. S., Spitler, L. G., et al. 2017, MNRAS, 472, 2800, doi: 10.1093/mnras/stx2153
- Israel et al. (2005) Israel, G., Covino, S., Mignani, R., et al. 2005, A&A, 438, L1, doi: 10.1051/0004-6361:200500138
- Israel et al. (2016) Israel, G. L., Esposito, P., Rea, N., et al. 2016, MNRAS, 457, 3448, doi: 10.1093/mnras/stw008
- Kozlova et al. (2016) Kozlova, A. V., Israel, G. L., Svinkin, D. S., et al. 2016, MNRAS, 460, 2008, doi: 10.1093/mnras/stw1109
- Kumar et al. (2017) Kumar, P., Lu, W., & Bhattacharya, M. 2017, MNRAS, 468, 2726, doi: 10.1093/mnras/stx665
- Levan et al. (2018) Levan, A., Kouveliotou, C., & Fruchter, A. 2018, ApJ, 854, 161, doi: 10.3847/1538-4357/aaa88d
- Li et al. (2020a) Li, C. K., Lin, L., Xiong, S. L., et al. 2020a, arXiv e-prints, arXiv:2005.11071. https://arxiv.org/abs/2005.11071
- Li et al. (2020b) Li, C. K., Cai, C., Zhang, S. N., et al. 2020b, GRB Coordinates Network, 28027, 1
- Lin et al. (2020a) Lin, L., Göğü\textcommabelows, E., Roberts, O. J., et al. 2020a, ApJ, 893, 156, doi: 10.3847/1538-4357/ab818f
- Lin et al. (2020b) Lin, L., Zhang, C. F., Wang, P., et al. 2020b, arXiv e-prints, arXiv:2005.11479. https://arxiv.org/abs/2005.11479
- Lu & Kumar (2018) Lu, W., & Kumar, P. 2018, MNRAS, 477, 2470, doi: 10.1093/mnras/sty716
- Lu et al. (2020) Lu, W., Kumar, P., & Zhang, B. 2020, arXiv e-prints, arXiv:2005.06736. https://arxiv.org/abs/2005.06736
- Lyubarsky (2014) Lyubarsky, Y. 2014, MNRAS, 442, L9, doi: 10.1093/mnrasl/slu046
- Margalit et al. (2020) Margalit, B., Beniamini, P., Sridhar, N., & Metzger, B. D. 2020, arXiv e-prints, arXiv:2005.05283. https://arxiv.org/abs/2005.05283
- Mereghetti et al. (2020) Mereghetti, S., Savchenko, V., Ferrigno, C., et al. 2020, arXiv e-prints, arXiv:2005.06335. https://arxiv.org/abs/2005.06335
- Metzger et al. (2019) Metzger, B. D., Margalit, B., & Sironi, L. 2019, MNRAS, 485, 4091, doi: 10.1093/mnras/stz700
- Moore & Kasliwal (2019) Moore, A. M., & Kasliwal, M. M. 2019, Nature Astronomy, 3, 109, doi: 10.1038/s41550-018-0675-x
- Niino et al. (2020) Niino, Y., Morokuma, T., Sako, S., et al. 2020, GRB Coordinates Network, 27678, 1
- Palmer & BAT Team (2020) Palmer, D. M., & BAT Team. 2020, GRB Coordinates Network, 27665, 1
- Pen & Connor (2015) Pen, U.-L., & Connor, L. 2015, ApJ, 807, 179, doi: 10.1088/0004-637X/807/2/179
- Petroff et al. (2019) Petroff, E., Hessels, J. W. T., & Lorimer, D. R. 2019, A&A Rev., 27, 4, doi: 10.1007/s00159-019-0116-6
- Rea et al. (2004) Rea, N., Testa, V., Israel, G. L., et al. 2004, A&A, 425, L5, doi: 10.1051/0004-6361:200400052
- Ridnaia et al. (2020) Ridnaia, A., Svinkin, D., Frederiks, D., et al. 2020, arXiv e-prints, arXiv:2005.11178. https://arxiv.org/abs/2005.11178
- Rieke & Lebofsky (1985) Rieke, G. H., & Lebofsky, M. J. 1985, ApJ, 288, 618, doi: 10.1086/162827
- Stamatikos et al. (2014) Stamatikos, M., Malesani, D., Page, K. L., & Sakamoto, T. 2014, GRB Coordinates Network, 16520, 1
- Stefanescu et al. (2008) Stefanescu, A., Kanbach, G., Słowikowska, A., et al. 2008, Nature, 455, 503, doi: 10.1038/nature07308
- Sun et al. (2011) Sun, X. H., Reich, P., Reich, W., et al. 2011, A&A, 536, A83, doi: 10.1051/0004-6361/201117693
- Surnis et al. (2016) Surnis, M. P., Joshi, B. C., Maan, Y., et al. 2016, ApJ, 826, 184, doi: 10.3847/0004-637X/826/2/184
- Tam et al. (2004) Tam, C. R., Kaspi, V. M., van Kerkwijk, M. H., & Durant, M. 2004, ApJ, 617, L53, doi: 10.1086/426963
- Tavani et al. (2020) Tavani, M., Casentini, C., Ursi, A., et al. 2020, arXiv e-prints, arXiv:2005.12164. https://arxiv.org/abs/2005.12164
- The CHIME/FRB Collaboration et al. (2020) The CHIME/FRB Collaboration, :, Andersen, B. C., et al. 2020, arXiv e-prints, arXiv:2005.10324. https://arxiv.org/abs/2005.10324
- Younes et al. (2017) Younes, G., Kouveliotou, C., Jaodand, A., et al. 2017, ApJ, 847, 85, doi: 10.3847/1538-4357/aa899a
- Younes et al. (2020) Younes, G., Guver, T., Enoto, T., et al. 2020, The Astronomer’s Telegram, 13678, 1
- Zackay et al. (2016) Zackay, B., Ofek, E. O., & Gal-Yam, A. 2016, ApJ, 830, 27, doi: 10.3847/0004-637X/830/1/27
- Zhang et al. (2020) Zhang, C. F., Jiang, J. C., Men, Y. P., et al. 2020, The Astronomer’s Telegram, 13699, 1
- Zhong et al. (2020) Zhong, S. Q., Dai, Z. G., Zhang, H. M., & Deng, C. M. 2020, arXiv e-prints, arXiv:2005.11109. https://arxiv.org/abs/2005.11109
- Zhou et al. (2020) Zhou, P., Zhou, X., Chen, Y., et al. 2020, arXiv e-prints, arXiv:2005.03517. https://arxiv.org/abs/2005.03517
Appendix A Fast readout mode
Conventional readout in the H2RG array requires one frame scan to reset and measure the resulting initial offset (which contains various random errors) and a second frame to measure the final value. The signal is then the difference of these two frames. At the fastest frame rate (no delay between frames), the duty cycle drops to 50%. In the new fast readout mode, we altered the readout sequence such that each line is digitized, then reset and digitized again before preceding to the next line. Signal is then being recorded except during the interval between signal and post-reset level samples. Given the high sky noise, we were able to reduce signal sampling time so that pixel time was reduced from typical s to s. With two samples per pixel per frame, the frame time is then s. The dead time between reading final sample and the next post-reset sample s. The first frame in a sequence still requires two frames, with the first merely establishing the post reset level. The duty cycle for an frame sequence is then
| (A1) |
which approaches % for long exposure sequences. Anomalous behavior due to self heating variations were avoided by clocking the detector continuously. The camera was setup to read continuously and store data in a ten frame circular buffer in the computer’s memory with the only distinction between “idling” and exposing being whether the data was written to disk.
Appendix B Data reduction
While the nominal survey mode operations in Gattini-IR use the Drizzle (Fruchter & Hook, 2002) technique to reconstruct the under-sampled PSFs by stacking several dithered images taken on sky, our requirement for high time resolution at the native image readout timescale makes it unsuitable for this application. We thus modified our default data processing pipeline to perform detrending, astrometry, photometry and subtractions on individual images at the native pixel scale of the detector, which we describe below.
B.1 Flat-field generation and image detrending
A master flat-field was created for the read-out mode using a median combination of sky images across several observing nights in order to calibrate the pixel-to-pixel response of the array in the new readout mode. Using images acquired a wide range of times ensures that temporal structures in the sky background variation do not affect the resulting flat-field. Each acquired image ( pixels) was flat-fielded using the derived flat-field, and only 1/16 of the full image ( pixels; hereafter referred to as a sub-quadrant as per the terminology in De et al. 2020a) containing the target of interest was retained for further processing. Retaining a smaller portion of the image containing the source leads to a large reduction in the variation of the PSF across the image, thus producing better quality astrometric and photometric solutions, as well as subtractions downstream.
B.2 Astrometry, photometry and reference image generation
An astrometric and photometric solution for the sub-quadrant was derived using relatively bright and isolated stars in the field. The calibration was performed using the same techniques as in the regular Gattini observing system and using the same reference catalog, which is calibrated astrometrically to Gaia DR2 and photometrically to the 2MASS point source catalog. The astrometric solutions achieved typical RMS of ″( of a pixel) , while the photometric solutions have typical uncertainties on the zero-point of % as calibrated from stars in each image.
Due to the location of the source in a dense region of the Galactic plane (see Figure 1) and the highly non-stationary background limited by confusion noise, direct aperture photometry measurements on un-subtracted images are not well-suited for deriving accurate constraints on the source flux. We thus created for each observing night, a deep median stack of sub-quadrants to serve as a reference image with nearly identical PSF as the science images taken each night. Since the reference stack was produced as a median combination as implemented in Swarp (Bertin et al. 2002; at the same pixel scale as that of the science images), we do not expect any short timescale emission to contaminate the reference image.
B.3 Difference imaging and forced photometry
Each reduced sub-quadrant was processed through image subtraction by resampling the respective reference image (one for each night) to the coordinate grid of the science frame. The resampled reference frame was then flux-scaling to each science frame using common cross-matched stars in the two images. The typical astrometric registration uncertainty between the cross-matched stars was pixels, while the corresponding flux scaling certainty was %. Image subtraction was performed using the ZOGY algorithm (Zackay et al., 2016), including propagation of noise uncertainties from the science and reference images to produce an uncertainty image for each produced difference image (as in De et al. 2020b). The flux and its uncertainty at the location of the source was measured directly from the difference images by performing a weighted flux measurement using the difference image PSF at the location of the target in the difference image and the corresponding uncertainty image.