The Role of Active Galactic Nuclei in the Quenching of Massive Galaxies in the SQuiGGE Survey
Abstract
We study the incidence of nuclear activity in a large sample of massive post-starburst galaxies at selected from the Sloan Digital Sky Survey, and identify active galactic nuclei based on radio continuum and optical emission lines. Over our mass range of , the incidence of radio activity is weakly dependent on stellar mass and independent of stellar age, while radio luminosity depends strongly on stellar mass. Optical nuclear activity incidence depends most strongly on the Dn4000 line index, a proxy for stellar age, with an active fraction that is ten times higher in the youngest versus oldest post-starburst galaxies. Since a similar trend is seen between age and molecular gas fractions, we argue that, like in local galaxies, the age trend reflects a peak in available fueling rather than feedback from the central black hole on the surrounding galaxy.
1 Introduction
Ever since the realization that supermassive black holes (BHs) are ubiquitous at the centers of massive galaxies, we have invoked energy input from active galactic nuclei (AGN) as a mechanism for heating or removing the interstellar medium of galaxies and suppressing star formation (e.g., Silk & Rees, 1998; Springel et al., 2005). While there is strong evidence that radio emission from central galaxies keeps the intracluster medium from cooling in the cluster environment (e.g., Fabian, 2012), we do not know whether AGN play an active role in shutting off star formation in massive elliptical galaxies (e.g., Heckman & Best, 2014). It is hard to define an experiment that can directly implicate the AGN, given that star formation necessarily lasts at least an order of magnitude longer in time than the typical mass doubling time of a BH (the Salpeter time of yr).
Large AGN surveys (predominantly identified using X-rays) have shown clearly that accretion depends on both the mass of the galaxy (and thus presumably the black hole) and the star formation rate (e.g., Silverman et al., 2009; Aird et al., 2012; Chen et al., 2013; Yang et al., 2017, 2018; Aird et al., 2018, 2019). In cases where detailed spectroscopic information is available, there is some evidence that AGN tend to occur a few hundred million years after a burst of star formation (e.g., Kauffmann et al., 2003; Davies et al., 2007; Wild et al., 2010), although optical spectroscopy may be biased against finding accretion activity in the most luminous starbursts (e.g., Trump et al., 2015; Jones et al., 2016).
In this work, we identify galaxies for which a burst of star formation has ended recently, so-called post-starburst (PSB) galaxies. We are interested in massive galaxies whose primary epoch of star formation has recently ended. Since massive galaxies ended their star formation early (e.g., Thomas et al., 2005), observations at significant lookback times are required to find massive PSBs. Such galaxies are identifiable, although quite rare, at the modest redshift of (e.g., Tremonti et al., 2007; Pattarakijwanich et al., 2014; Wild et al., 2016). In this work, we ask whether a sample of massive and recently quenched PSBs show any sign of enhanced nuclear activity compared with quiescent galaxies of similar mass. We adopt a standard concordance cosmology with km s-1 Mpc-1, , .
2 Post-Starburst Sample
In order to understand the detailed processes driving galaxy quenching, we have launched the Studying of QUenching in Intermediate-z Galaxies: Gas, anguar momentum, and Evolution (SQuIGGE) Survey. In Suess et al. in preparation, we present a large new sample of 1,318 post-starburst galaxies that are selected from the Sloan Digital Sky Survey Data Release 14 (SDSS DR14; Abolfathi et al., 2018). The sample ranges in redshift from , (median ). The galaxies are relatively bright and massive, with mag (median mag), with nearly all having (median ).
The sample was selected from the SDSS DR14 spectroscopic catalog following Kriek et al. (2010). In brief, we calculate the flux in synthetic rest-frame , , and band filters for all SDSS spectra with . We require that the spectra have S/N in both the and filters and then use the color cuts and to isolate galaxies with the unique A-star–like spectral shape indicative of a recently-quenched stellar population.
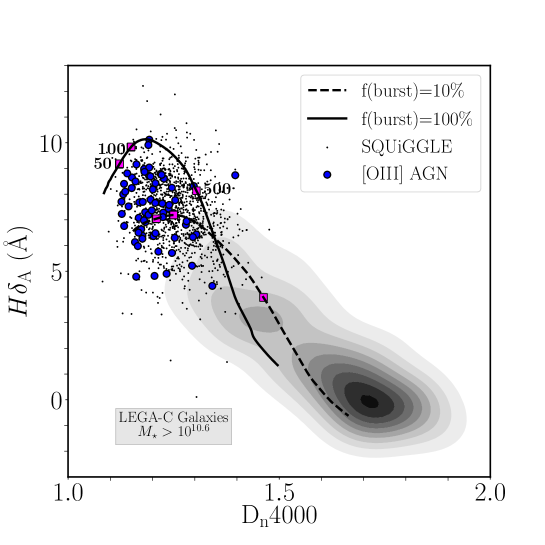
To demonstrate the success of our selection, we look at two key stellar absorption indices (Fig. 1). The equivalent width of H combined with the Dn4000 index (the ratio in flux at 3850-3950Å with that at 4000-4100Å) are a powerful non-parametric way to track stellar age (e.g., Kauffmann et al., 2003). We show two tracks in Figure 1 based on two-component stellar population models with an old population plus a young burst with varying burst fraction. SQuIGGE galaxies had bursts of star formation that ended 100-500 Myr in the past. The actual quenching time is degenerate with the burst fraction, but the light-weighted ages tend to be Myr for a Dn4000 (D. Setton et al. in preparation).
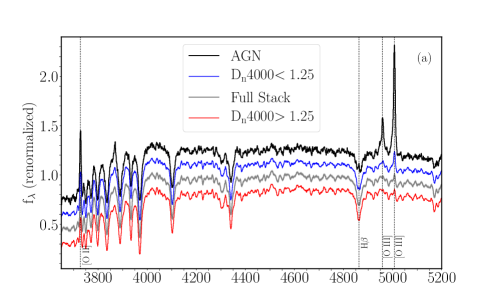
Within SDSS, objects are targeted spectroscopically for many reasons, including radio emission. To avoid any pre-selection based on active galaxy attributes, we restrict attention to the 1207 galaxies that fall within the “CMASS” SDSS sample. This sample is targeted based solely on color and magnitude (Dawson et al., 2013). The inverse-variance–weighted mean spectrum of the full sample, normalized at 4020Å, is shown in Figure 2.
SQuIGGE aims to study the gas fractions, angular momenta, stellar populations, and merger fractions of this PSB sample. With ALMA, we have searched for CO 2-1 in 13 galaxies (Suess et al., 2017), and found that roughly half contain surprisingly large gas reservoirs, with gas fractions of (R. Bezanson et al. in preparation).
2.1 LEGA-C Comparisons
We rely on the Large Early Galaxy Astrophysics Census (LEGA-C, van der Wel et al., 2016) sample to provide a more complete view of the galaxy population at this epoch. The LEGA-C survey is an ESO Large spectroscopic program, which consists of deep (20-hour) integrations of -magnitude selected galaxies at , regardless of morphology or color, in the COSMOS field. Thus, we can mitigate possible bias from the CMASS color selection by comparison with LEGA-C. Although we will not take full advantage of their exquisite spectra, the color-independent selection provides a mass-selected sample of galaxies to compare with SQuIGGE. While covering a larger area on the sky, the CMASS sample is very incomplete in our mass and redshift range of interest (Leauthaud et al., 2016). Furthermore, the deep 3 GHz VLA imaging in COSMOS (Smolčić et al., 2017) and resulting radio source catalog for LEGA-C (Barišić et al., 2017), allows us to identify AGN in both LEGA-C and SQuIGGE using similar radio and optical diagnostics.
We use the publicly available LEGA-C Data Release 2 (Straatman et al., 2018), and select galaxies in a matching mass range of . The stellar masses of both samples are similarly determined using the Fitting and Assessment of Synthetic Templates (FAST; Kriek et al., 2009) code, assuming the same initial mass function (Chabrier, 2003) and stellar population models (Bruzual & Charlot, 2003) (and in the case of LEGA-C the UltraVISTA photometry of Muzzin et al. 2013). We select our LEGA-C comparison sample based only on mass, regardless of stellar age or galaxy morphology. The redshift ranges are similar enough that we do not specifically match them.
3 Spectral Fitting
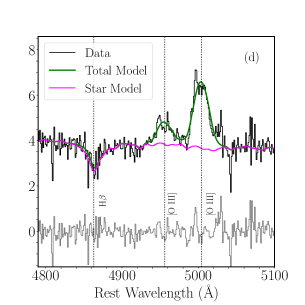
We select AGN using the ratio between [O III] and H, requiring reliable measurements of the emission line strengths of these two key lines. Due to the strong stellar absorption in H, we jointly model the stellar continuum and emission lines ([O II], H, and [O III]) using the publicly available penalized pixel-fitting code pPXF (Cappellari & Emsellem, 2004). Our stellar templates are the single stellar population models from Vazdekis et al. (2010) built from the MILES stellar library (Sánchez-Blázquez et al., 2006), and we include an order 12 additive polynomial to account for flux calibration uncertainties. We model the line-of-sight stellar velocity distribution as a Gaussian and fix the velocities and linewidths of all emission lines to the same value.
We generate mock spectra to measure uncertainties on our flux measurements. We start with the best-fit pPXF model fit to the stars and gas, and for each of 100 artificial runs we draw the noise spectrum randomly from the variance array, and refit. The standard deviation in flux values from these runs is our adopted uncertainty, which is 20% higher than the statistical errors returned by pPXF. We select all galaxies with [O III] line equivalent width EW, which corresponds to a minimum S/N in the line, although all but ten of the galaxies have S/N. H is most challenging to detect, given the strong absorption. In the case of non-detections of H emission, we assign the upper limit as the flux for the purpose of calculating line ratios.
4 Identifying AGN
We select two complementary AGN samples. First, we look for high-ionization optical emission line ratios indicative of a hard ionizing spectrum. Then, we use the Faint Images of the Radio Sky at Twenty-cm (FIRST; Becker et al., 1995) survey to find AGN through radio emission. We adopt the FIRST survey because it overlaps so well with the SDSS footprint, and it remains the most uniform survey available over this area with a beam size roughly matched to that of galaxies.
4.1 Optical Emission-line Selection
We search for high-ionization emission lines in the SDSS PSB spectra. Classic narrow-line region selection relies on two-dimensional emission-line ratio plots known as BPT diagrams (Baldwin et al., 1981). Unfortunately, at the redshifts of our sample, the SDSS spectra do not include H or [N II] , which play a central role in standard BPT diagrams. Instead, we are forced to rely on [O III]/H alone.
At first glance, this single line ratio does not appear sufficient to classify a galaxy as an AGN. In standard BPT diagrams, there are many galaxies without nuclear activity but with high values of [O III]/H. However, in the absence of AGN activity, high [O III]/H is predominantly seen in low-mass, low-metallicity galaxies (e.g., Moustakas et al., 2006). At higher masses, star-formation–powered emission lines have lower [O III]/H ratios. This realization was formalized by Juneau et al. (2011) in what they call the Mass-Excitation (MeX) diagram, which plots [O III]/H against stellar mass, and shows that local galaxies with and [O III]/H are all AGN. While strong line ratios are known to shift within the BPT diagram at higher redshift (e.g., Shapley et al., 2005), in our redshift range of interest , galaxies are observed to have ISM emission lines similar to local galaxies (e.g., Kewley et al., 2013). Furthermore, even at , higher-mass galaxies like those studied here do not appear significantly offset (e.g., Shapley et al., 2015).
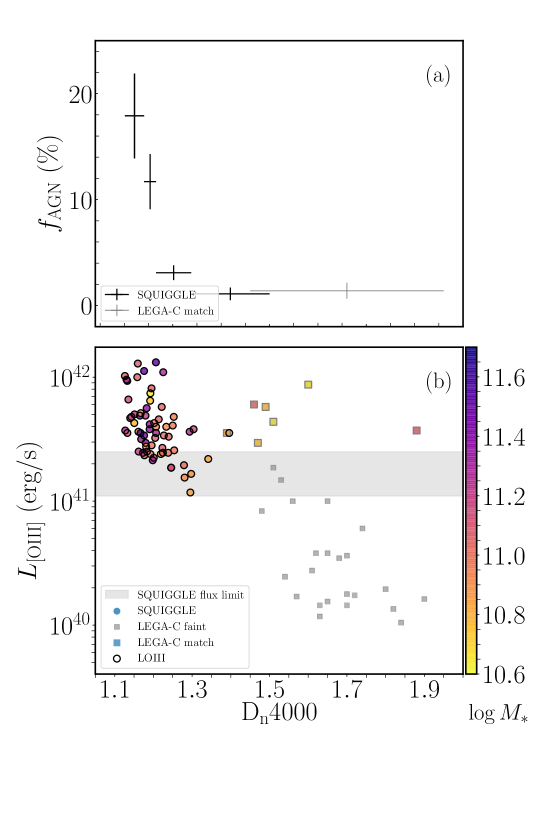
We apply the simple joint criteria that (a) the [O III] line EWÅ and (b) [O III]/H (e.g., Ho, 2008). This ensures adequate signal-to-noise in the line and corresponds to a flux limit of erg s-1 cm-2. All but four of the galaxies with [O III] above our EW cut qualify as AGN based on line ratios. These two cuts identify a total of 64 AGN, out of 1207 galaxies, for an AGN fraction of (see Table 1). As additional confirmation that we are selecting bona-fide AGN, we note that the [O III]/H distribution is peaked at a ratio of 10, and that our qualitative results would not change if we selected the 50 objects with [O III]/H.
In Figure 3, we plot the [O III] luminosity distribution of the detected AGN. Our objects span only one order of magnitude in [O III] luminosity. Sources with fluxes erg s-1 cm-2 or erg s-1 at are not included in our sample. We are likely less complete in AGN at lower stellar masses, given the correlation between and . We quantify this correlation and investigate the impact of this incompleteness in §5.1. Furthermore, the most luminous targets may be too blue to either be included in the CMASS sample or the PSB color selection, due to scattered light from the obscured quasar (e.g., Zakamska et al., 2006; Liu et al., 2009) but such objects are very rare (Reyes et al., 2008). For physical context, black holes of (for typical stellar masses of ; Häring & Rix, 2004) have a range in Eddington ratio of 1-10%, assuming a bolometric correction of 103 (Liu et al., 2009) for [O III].
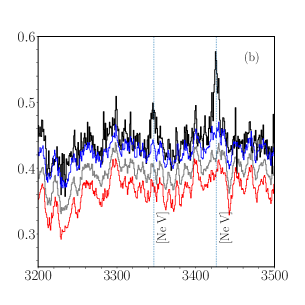
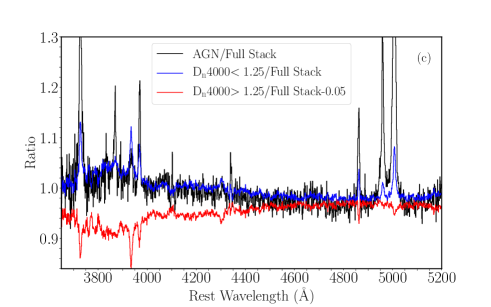
Through stacking, we compare the average spectra of the [O III]-selected AGN with the full inactive sample, as well as stacks of the younger and older galaxies divided at the median Dn4000. We can see that the AGN have a bluer stellar continuum than the full stack, matching that of the younger inactive stack (§5.1), but the line emission is much stronger in the AGN stack than in the young inactive stack. We also detect [Ne V] Å, a line that is very hard to excite without the hard ionizing spectrum of an AGN (e.g., Goulding & Alexander, 2009). In Figure 2b, we show that the [Ne V] line is clearly detected in the stacked AGN spectrum, providing some confidence that a significant fraction of our optically selected AGN are powered by accreting black holes.
4.1.1 LEGA-C Comparison Sample
We select as LEGA-C AGN those galaxies with [O III]/H and an [O III] flux above the SQuIGGE [O III] flux limit of erg s-1. The resulting five galaxies are shown as colored squares in Figure 3 corresponding to an AGN fraction of %. We also relax the [O III] luminosity cut and show all galaxies with AGN-like line ratios in LEGA-C (grey squares). Unlike the SQuIGGE sample, LEGA-C does not contain many massive PSBs, and it has very few AGN above our flux limit. Both are almost certainly due to the small volume.
4.2 Radio Selection
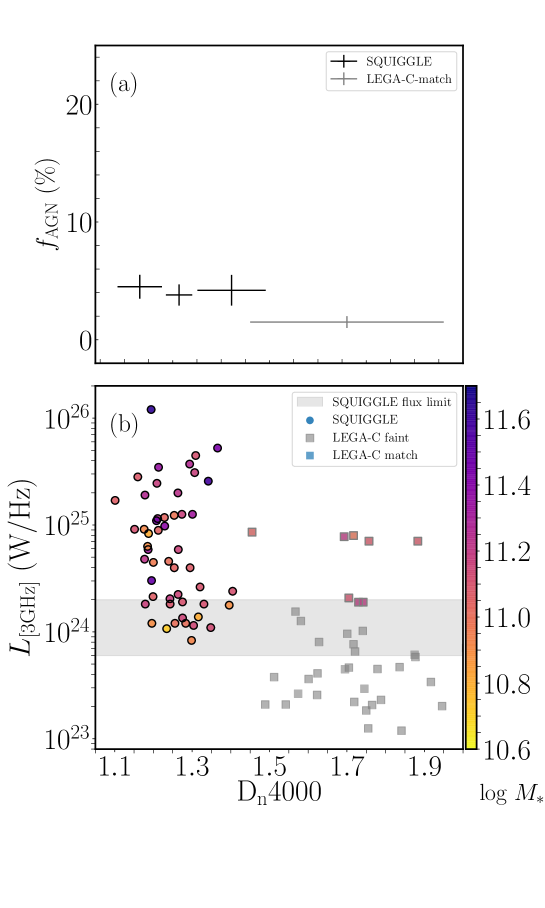
To find the radio-detected AGN within the SQuIGGE sample, we search the FIRST archive for cross-matches within 5″ of the position of each SQuIGGE galaxy. In practice, all but two are matched within 3″ of the SDSS position. One of those is a extended jet source, leaving one possible mis-matched source. We do not inspect the images for possible radio detections at larger radius (as in, for instance, Best et al., 2005). For ease of comparison with other radio AGN samples, we calculate our radio detection limit at 3 GHz rather than 1.4 GHz, assuming a standard radio spectral slope of . FIRST has a uniform flux limit of 1 mJy, which corresponds to a luminosity limit range W Hz-1, and W Hz-1 for a median distance of .
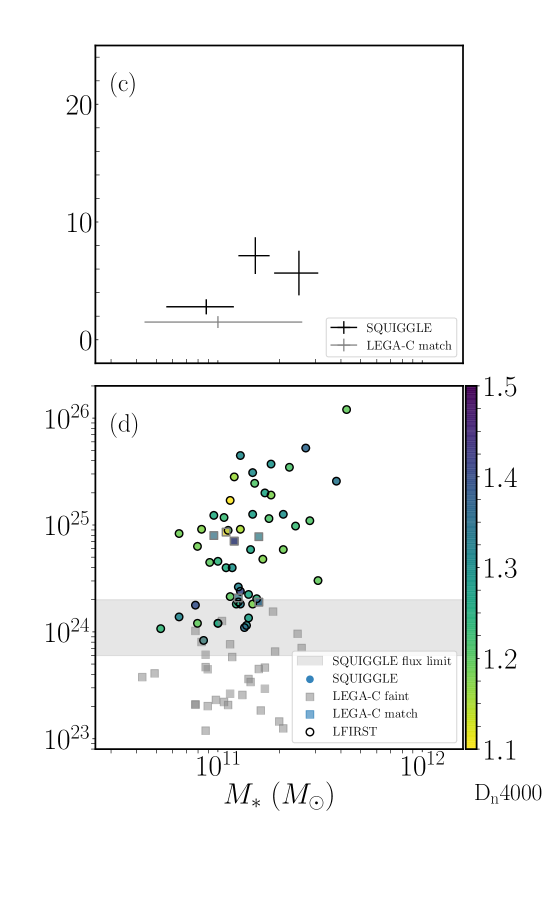
This selection yields 52 radio AGN, or a radio AGN fraction of %. The distribution of radio luminosities are plotted in Figure 4. The star formation rate needed to explain the observed radio emission is many hundreds of solar masses per year (e.g., Bell, 2003). Given that we observe upper limits on the star formation rates of tens of solar masses per year from [O II] fluxes (Suess et al., 2017), we view as highly unlikely that the radio emission we observe arises from star formation.
In contrast to the [O III]-selected sample, we observe a very wide range of radio luminosities, spanning nearly three decades (Figure 4). Radio luminosity does not have a simple or well-understood relationship with the accretion rate (see references in Heckman & Best, 2014), although radio emission contributes a larger fraction of the bolometric luminosity at lower AGN accretion rates (e.g., Ho, 2008, and references therein). We detect [O III] emission from only five of our radio galaxies. The majority appear to be “low-excitation” (Hine & Longair, 1979) sources that, likely due to very low Eddington ratios, do not show radiative signatures of standard optically thick but geometrically thin accretion disks (e.g., Shakura & Sunyaev, 1973; Best & Heckman, 2012). Conversely, among the [O III] sources, we detect few radio AGN due to our flux limit; [O III]-selected AGN in SDSS with erg s-1 have radio luminosities of W Hz-1 as probed by stacks (e.g., de Vries et al., 2007).
4.2.1 LEGA-C Comparison
Barišić et al. (2017) built a catalog of radio AGN in LEGA-C; we simply take the subset of these that obey our flux limit of mJy and fall within our stellar mass range. We find a radio AGN fraction of %. In the case of radio AGN, the fraction in SQuIGGE is consistent within of the radio-loud fraction in a mass-matched LEGA-C sample.
5 AGN Demographics
Having identified a sample of recently-quenched galaxies that host AGN, we now examine trends between the AGN and host galaxy properties. As shown in Fig. 1, Dn4000 tracks stellar age; the median Dn4000 corresponds to a light-weighted age of Myr. In the following, binned quantities are constructed to have equal numbers of AGN per bin, and error bars are Poisson.
5.1 [O III]-selected AGN
We see a dramatic rise in AGN fraction towards lower values of Dn4000 (Fig. 3). AGN are ten times more likely to occur in the youngest as in the oldest SQuIGGE galaxies, rising from % to % from Dn4000 to . Interestingly, all of the SQuIGGE galaxies with ALMA detections are similarly in galaxies with Dn4000.
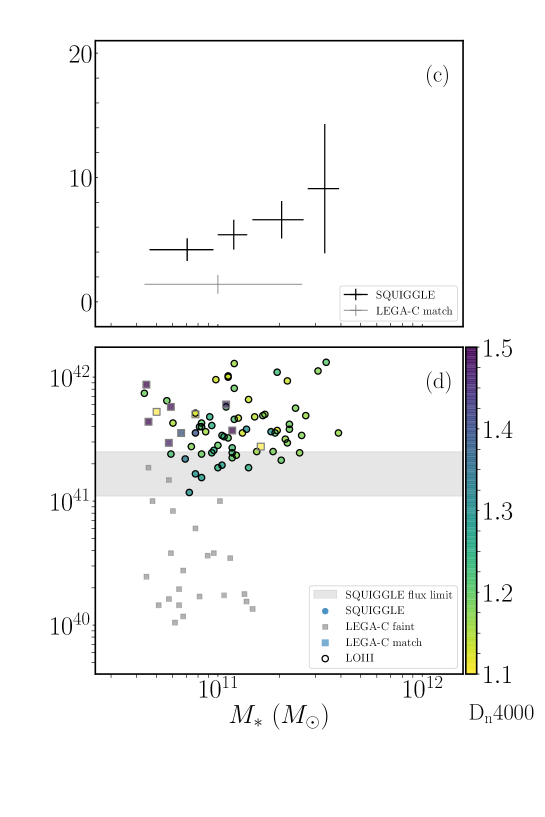
In contrast, we see a very weak trend between galaxy stellar mass and AGN fraction (Figure 2cd). Despite the weak trend between AGN fraction and stellar mass, we find a strong correlation between and for the detected AGN. Using a partial pearson correlation analysis, we find and . The trend between and is shallow, but highly significant.
The lower objects likely suffer more [O III] flux incompleteness. To investigate the impact of preferentially missing AGN in lower- galaxies, we measure the AGN fraction as a function of Dn4000 and for (a) galaxies with , that should be more complete in and (b) galaxies with that should be complete in . In both cases, our primary result holds: there is an order of magnitude rise in AGN fraction over the observed range in Dn4000 and no significant trend in AGN fraction with .
| Sample | Subset | NTot | NAGN | fAGN |
|---|---|---|---|---|
| Optical | All | 1207 | 64 | |
| Optical | Young | 603 | 53 | |
| Optical | Old | 604 | 11 | |
| Optical | Low Mass | 602 | 26 | |
| Optical | High Mass | 605 | 38 | |
| LEGA-C | Optical | 803 | 10 | |
| Radio | All | 1207 | 51 | |
| Radio | Young | 603 | 26 | |
| Radio | Old | 603 | 38 | |
| Radio | Low Mass | 602 | 14 | |
| Radio | High Mass | 605 | 37 | |
| LEGA-C | Radio | 675 | 10 |
Note. — AGN fraction over galaxy parameters. We divide old vs. young at Dn4000 and high vs. low mass at .
5.2 Radio-Selected Sample
The radio sample contrasts with the [O III]-selected sample in that neither the radio luminosities nor the detection fraction shows any relation with Dn4000 over our narrow range. While Barišić et al. (2017) do find that radio AGN in LEGA-C are more common in older galaxies, this effect may be driven by stellar mass, since we observe a very steep relationship between stellar mass and radio luminosity within the AGN population. The partial Pearson correlation coefficients in this case are and .
This steep dependence of radio luminosity on stellar mass is well-documented in the literature for massive elliptical galaxies. Heckman & Best (2014) quote a slope of . Our data also favor a super-linear slope () but we caution that our mass range is quite limited. It is not clear what drives this strong mass dependence, but there is clear evidence that halo mass matters. At fixed stellar mass, galaxies in more massive halos show higher radio AGN fractions (Mandelbaum et al., 2009; Sabater et al., 2013). This halo mass dependence has been ascribed to increased BH spin, a higher gas accretion rate, or jet enhancement, but the origin is unknown. We show here that stellar age is not a strong factor.
6 Discussion and Summary
Suess et al. in preparation have assembled a large sample of massive and rare post-starburst galaxies at using SDSS DR14 spectroscopy. We study the nuclear activity of the SQuIGGE sample using both optical narrow emission-line diagnostics and radio emission from FIRST. The radio AGN are likely dominated by systems that are accreting at very low Eddington fractions and are thus unobservable with optical diagnostics, while the optically selected AGN are accreting at a few percent of Eddington.
We replicate the previously-observed trend between radio luminosity and stellar mass in radio AGN that has been reported previously (e.g., Best et al., 2005; Barišić et al., 2017), extending this finding to recently quenched galaxies. Radio AGN fractions are not a strong function of or stellar age. AGN fractions are not a strong function of for [O III]-selected samples either, but the optical AGN fraction is a strong function of Dn4000. The youngest PSBs are ten times more likely to harbor an optical AGN than the oldest PSBs. These younger galaxies, particularly those with Dn4000, are also most likely to harbor significant molecular gas fractions. What may this tell us about the relationship between black hole and galaxy growth?
Temporal connections between merging, star-formation, black hole growth, and AGN-driven outflows have long been considered in the literature (e.g., Sanders et al., 1988; Canalizo & Stockton, 2001; Springel et al., 2005). We note also that there is an ongoing debate about the relative roles of stellar mass and star formation rate on accretion rate distributions (e.g., Yang et al., 2018; Aird et al., 2019). Since we consider a very narrow range in stellar mass and redshift, we will focus only on the possible connections between star formation and accretion here. Because of the very short timescales for accretion compared with star formation, establishing an observational temporal link is challenging. Even if trends are observed, the connection could be due to either fueling or feedback.
A number of local studies of [O III]-selected AGN have reported a boost in AGN fractions Myr after a starburst (e.g., Kauffmann et al., 2003; Davies et al., 2007). These studies suggest that gas availability links AGN and star formation, perhaps with winds from massive stars providing the fuel for the AGN activity (Wild et al., 2010). Interestingly, Aird et al. (2019) find an increase (by 2-5 times) in the AGN fraction for X-ray selected AGN in galaxies that live below the star forming main sequence as compared with galaxies on the main sequence. These results all may point to a similar fueling mechanism. We are also seeing a dramatic increase in availability of molecular gas at the lowest Dn4000 in our sample. We thus postulate that the increase in AGN activity towards younger ages is a function of increased gas availability leading to fueling, rather than AGN feedback shutting down star formation in older systems. Of course, both could be true. Thus, we lastly consider whether we might link AGN activity to quenching in these systems.
Crudely speaking, theorists often conceptually divide the feedback roles of low and high accretion rate sources into a “maintainence” (or “radio”) mode, and a radiatively efficient quenching mode (e.g., Croton et al., 2006). The former happens in a quasi-continuous fashion to keep hot gas envelopes from cooling (e.g., Fabian, 2012). We see clear evidence for such activity in our galaxies, and if our radio observations were deeper we would undoubtably uncover a very high radio active fraction. The latter is more elusive; despite some evidence for massive outflows in luminous AGN (e.g., Greene et al., 2012; Liu et al., 2013), we still do not have a clear verdict on the role of AGN in shutting down star formation in galaxies. In SQuIGGE, we will search for signs of outflow in IFU data (Hunt et al., 2018). So far, we have found one intriguing object showing extended ionized and molecular gas (J. Spilker in preparation). We will see if there are compelling signs of outflow in this or other targets, to more cleanly disentangle the relationship between fueling and feedback in massive galaxies.
References
- Abolfathi et al. (2018) Abolfathi, B., Aguado, D. S., Aguilar, G., et al. 2018, ApJS, 235, 42
- Aird et al. (2018) Aird, J., Coil, A. L., & Georgakakis, A. 2018, MNRAS, 474, 1225
- Aird et al. (2019) —. 2019, MNRAS, 484, 4360
- Aird et al. (2012) Aird, J., Coil, A. L., Moustakas, J., et al. 2012, ApJ, 746, 90
- Baldwin et al. (1981) Baldwin, J. A., Phillips, M. M., & Terlevich, R. 1981, PASP, 93, 5
- Barišić et al. (2017) Barišić, I., van der Wel, A., Bezanson, R., et al. 2017, ApJ, 847, 72
- Becker et al. (1995) Becker, R. H., White, R. L., & Helfand, D. J. 1995, ApJ, 450, 559
- Bell (2003) Bell, E. F. 2003, ApJ, 586, 794
- Best & Heckman (2012) Best, P. N., & Heckman, T. M. 2012, MNRAS, 421, 1569
- Best et al. (2005) Best, P. N., Kauffmann, G., Heckman, T. M., & Ivezić, Ž. 2005, MNRAS, 362, 9
- Bruzual & Charlot (2003) Bruzual, G., & Charlot, S. 2003, MNRAS, 344, 1000
- Canalizo & Stockton (2001) Canalizo, G., & Stockton, A. 2001, ApJ, 555, 719
- Cappellari & Emsellem (2004) Cappellari, M., & Emsellem, E. 2004, PASP, 116, 138
- Chabrier (2003) Chabrier, G. 2003, PASP, 115, 763
- Chen et al. (2013) Chen, C.-T. J., Hickox, R. C., Alberts, S., et al. 2013, ApJ, 773, 3
- Croton et al. (2006) Croton, D. J., Springel, V., White, S. D. M., et al. 2006, MNRAS, 365, 11
- Davies et al. (2007) Davies, R. I., Müller Sánchez, F., Genzel, R., et al. 2007, ApJ, 671, 1388
- Dawson et al. (2013) Dawson, K. S., Schlegel, D. J., Ahn, C. P., et al. 2013, AJ, 145, 10
- de Vries et al. (2007) de Vries, W. H., Hodge, J. A., Becker, R. H., White, R. L., & Helfand, D. J. 2007, AJ, 134, 457
- Fabian (2012) Fabian, A. C. 2012, ARA&A, 50, 455
- Goulding & Alexander (2009) Goulding, A. D., & Alexander, D. M. 2009, MNRAS, 398, 1165
- Greene et al. (2012) Greene, J. E., Murphy, J. D., Comerford, J. M., Gebhardt, K., & Adams, J. J. 2012, ApJ, 750, 32
- Häring & Rix (2004) Häring, N., & Rix, H.-W. 2004, ApJ, 604, L89
- Heckman & Best (2014) Heckman, T. M., & Best, P. N. 2014, ARA&A, 52, 589
- Hine & Longair (1979) Hine, R. G., & Longair, M. S. 1979, MNRAS, 188, 111
- Ho (2008) Ho, L. C. 2008, ARA&A, 46, 475
- Hunt et al. (2018) Hunt, Q., Bezanson, R., Greene, J. E., et al. 2018, ApJ, 860, L18
- Jones et al. (2016) Jones, M. L., Hickox, R. C., Black, C. S., et al. 2016, ApJ, 826, 12
- Juneau et al. (2011) Juneau, S., Dickinson, M., Alexander, D. M., & Salim, S. 2011, ApJ, 736, 104
- Kauffmann et al. (2003) Kauffmann, G., Heckman, T. M., Tremonti, C., et al. 2003, MNRAS, 346, 1055
- Kewley et al. (2013) Kewley, L. J., Maier, C., Yabe, K., et al. 2013, ApJ, 774, L10
- Kriek et al. (2009) Kriek, M., van Dokkum, P. G., Labbé, I., et al. 2009, ApJ, 700, 221
- Kriek et al. (2010) Kriek, M., Labbé, I., Conroy, C., et al. 2010, ApJ, 722, L64
- Leauthaud et al. (2016) Leauthaud, A., Bundy, K., Saito, S., et al. 2016, MNRAS, 457, 4021
- Liu et al. (2013) Liu, G., Zakamska, N. L., Greene, J. E., Nesvadba, N. P. H., & Liu, X. 2013, MNRAS, 436, 2576
- Liu et al. (2009) Liu, X., Zakamska, N. L., Greene, J. E., et al. 2009, ApJ, 702, 1098
- Mandelbaum et al. (2009) Mandelbaum, R., Li, C., Kauffmann, G., & White, S. D. M. 2009, MNRAS, 393, 377
- Moustakas et al. (2006) Moustakas, J., Kennicutt, Robert C., J., & Tremonti, C. A. 2006, ApJ, 642, 775
- Muzzin et al. (2013) Muzzin, A., Marchesini, D., Stefanon, M., et al. 2013, ApJS, 206, 8
- Pattarakijwanich et al. (2014) Pattarakijwanich, P., Strauss, M. A., Ho, S., & Ross, N. P. 2014, arXiv:1410.7394, arXiv:1410.7394
- Reyes et al. (2008) Reyes, R., Zakamska, N. L., Strauss, M. A., et al. 2008, AJ, 136, 2373
- Sabater et al. (2013) Sabater, J., Best, P. N., & Argudo-Fernández, M. 2013, MNRAS, 430, 638
- Sánchez-Blázquez et al. (2006) Sánchez-Blázquez, P., Peletier, R. F., Jiménez-Vicente, J., et al. 2006, MNRAS, 371, 703
- Sanders et al. (1988) Sanders, D. B., Soifer, B. T., Elias, J. H., et al. 1988, ApJ, 325, 74
- Shakura & Sunyaev (1973) Shakura, N. I., & Sunyaev, R. A. 1973, A&A, 500, 33
- Shapley et al. (2005) Shapley, A. E., Coil, A. L., Ma, C.-P., & Bundy, K. 2005, ApJ, 635, 1006
- Shapley et al. (2015) Shapley, A. E., Reddy, N. A., Kriek, M., et al. 2015, ApJ, 801, 88
- Silk & Rees (1998) Silk, J., & Rees, M. J. 1998, A&A, 331, L1
- Silverman et al. (2009) Silverman, J. D., Lamareille, F., Maier, C., et al. 2009, ApJ, 696, 396
- Smolčić et al. (2017) Smolčić, V., Novak, M., Bondi, M., et al. 2017, A&A, 602, A1
- Springel et al. (2005) Springel, V., White, S. D. M., Jenkins, A., et al. 2005, Nature, 435, 629
- Straatman et al. (2018) Straatman, C. M. S., van der Wel, A., Bezanson, R., et al. 2018, ApJS, 239, 27
- Suess et al. (2017) Suess, K. A., Bezanson, R., Spilker, J. S., et al. 2017, ApJ, 846, L14
- Thomas et al. (2005) Thomas, D., Maraston, C., Bender, R., & Mendes de Oliveira, C. 2005, ApJ, 621, 673
- Tremonti et al. (2007) Tremonti, C. A., Moustakas, J., & Diamond-Stanic, A. M. 2007, ApJ, 663, L77
- Trump et al. (2015) Trump, J. R., Sun, M., Zeimann, G. R., et al. 2015, ApJ, 811, 26
- van der Wel et al. (2016) van der Wel, A., Noeske, K., Bezanson, R., et al. 2016, ApJS, 223, 29
- Vazdekis et al. (2010) Vazdekis, A., Sánchez-Blázquez, P., Falcón-Barroso, J., et al. 2010, MNRAS, 404, 1639
- Wild et al. (2016) Wild, V., Almaini, O., Dunlop, J., et al. 2016, MNRAS, 463, 832
- Wild et al. (2010) Wild, V., Heckman, T., & Charlot, S. 2010, MNRAS, 405, 933
- Yang et al. (2017) Yang, G., Chen, C. T. J., Vito, F., et al. 2017, ApJ, 842, 72
- Yang et al. (2018) Yang, G., Brandt, W. N., Vito, F., et al. 2018, MNRAS, 475, 1887
- Zakamska et al. (2006) Zakamska, N. L., Strauss, M. A., Krolik, J. H., et al. 2006, AJ, 132, 1496