Causal Feature Selection via Orthogonal Search
Abstract
The problem of inferring the direct causal parents of a response variable among a large set of explanatory variables is of high practical importance in many disciplines. However, established approaches often scale at least exponentially with the number of explanatory variables, are difficult to extend to nonlinear relationships and are difficult to extend to cyclic data. Inspired by Debiased machine learning methods, we study a one-vs.-the-rest feature selection approach to discover the direct causal parent of the response. We propose an algorithm that works for purely observational data while also offering theoretical guarantees, including the case of partially nonlinear relationships possibly under the presence of cycles. As it requires only one estimation for each variable, our approach is applicable even to large graphs. We demonstrate significant improvements compared to established approaches.00footnotetext: Equal contributions
1 Introduction
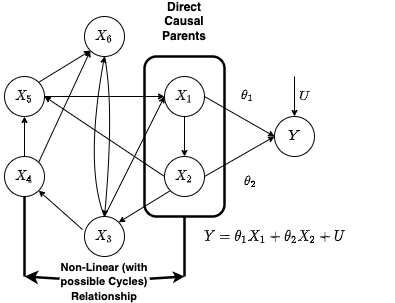
Identifying causal relationships is a profound and hard problem pervading experimental sciences such as biology (Sachs et al., 2005), medicine (Castro et al., 2020), earth system sciences (Runge et al., 2019), or robotics (Ahmed et al., 2020). While randomized controlled interventional studies are considered the gold standard, they are in many cases ruled out by financial or ethical concerns (Pearl, 2009; Spirtes et al., 2000). In order to improve the understanding of a system and help design relevant interventions, the subset of causes that have a direct effect (direct causes/direct causal parents) often needs to be identified based on observations only. This paper assumes a structural equation model (SEM) comprising (1) a set of covariates represented by random vector whose values are determined by a uniquely solvable set of structural equations, possibly non-linear and possibly including cycles and confounding (2) a response variable , who is not a parent of any and whose value is determined by a linear structural equation of the form,
| (1) |
where is an exogenous variable with zero mean, independent from any other exogenous variables of the SEM and denotes the inner product. Such a SEM is exemplified in Figure 1. Uniquely solvability of SEMs amounts to not having self-cycles in the causal structure, but any other arbitrary non-linear cyclic structure between covariates is allowed (Bongers et al., 2021), possibly including hidden confounders, as long as there is no hidden confounder for the response variable (this would violate the assumption of independence of ). Practically speaking, almost all causal discovery applications lie under the umbrella of simple SCMs (Bollen, 1989; Sanchez-Romero et al., 2019). Besides, the assumption of not having self-cycles is usually assumed not-limiting in the literature (Lacerda et al., 2012; Rothenhäusler et al., 2015; Bongers et al., 2016).
In this paper, we investigate how to find the direct causes of among a high-dimensional vector of covariates . From our formulation, a given entry of should be non-zero if and only if the variable corresponding to that particular coefficient is a direct causal parent (Peters et al., 2017), e.g., and in Figure 1. We restrict ourselves to the setting of linear direct causal effects of (LDC, as specified in Equation 1) and no feature descending from (NFD). LDC is justified as an approximation when the effects of each causal feature are weak such that the possibly non-linear effects can be linearized; NFD is justified in some applications where we can exclude any influence of on a covariate. This is, for example, the case when are genetic factors, and is a particular trait/phenotype. Our method, in particular, comes handy in this case due to the relatively complex non-linear cyclic structure of these genetic factors in high-dimensional regimes (Yao et al., 2015; Meinshausen et al., 2016; Warrell & Gerstein, 2020).
While applicable to full graph discovery rather than the simplified problem of finding causal parents, state-of-the-art methods for causal discovery often rely on strong assumptions or the availability of interventional data or have prohibitive computational costs explained in section 1.1. In addition to and despite their strong assumptions, causal discovery methods may perform worse than simple regression baselines (Heinze-Deml et al., 2018; Janzing, 2019; Zheng et al., 2018). However, estimating in high dimensional settings (i.e. observations ) using unregularized least squares regression, will lead to identifiability problems since there can be infinitely many possible choices for recovered with equivalent prediction accuracy for regressing (Bühlmann & Van De Geer, 2011). On the other hand, when using a regularized method such as Lasso, a critical issue is the bias induced by regularization (Javanmard & Montanari, 2018). While regularized and unregularized Least Squares as well as debiased Lasso are applicable to the same problem, they have different statistical characteristics and we will explore their empirical performance in extensive experiments.
Double ML approaches (Chernozhukov et al., 2018a) have shown promising bias compensation results in the context of high dimensional observed confounding of a single variable. In the present paper, we use this approach to find direct causes among a large number of covariates. Our key contributions are:
-
•
We show that under the assumption that no feature of is a child of , the Double ML (Chernozhukov et al., 2018) principle can be applied in an iterative and parallel way to find the subset of direct causes with observational data.
-
•
Our approach has a computational complexity requirement polynomial (fast) time in dimension .
-
•
Our method provides asymptotic guarantees that the set can be recovered from observational data. Importantly, this result neither requires linear interactions among the covariates, faithfulness, nor acyclic structure.
-
•
Extensive experimental results demonstrate the state-of-the-art performance of our method. Our approach significantly outperforms all other methods (even though underlying data generation conditions favor them), especially in the case of non-linear interactions between covariates, despite relying only on linear projection.
1.1 Related work
The question of finding direct causal parents is also addressed in the literature as mediation analysis (Baron & Kenny, 1986; Hayes, 2017; Shrout & Bolger, 2002). Several principled approaches have been proposed (relying, for instance, on Instrumental Variables (IVs)) (Angrist & Imbens, 1995; Angrist et al., 1996; Bowden & Turkington, 1990) to test for a single direct effect in the context of specific causal graphs. Extensions of the IV-based approach to generalized IVs-based approaches (Brito & Pearl, 2012; Van der Zander & Liskiewicz, 2016) are the closest known result to discovering direct causal parents. However, no algorithm is provided in Brito & Pearl (2012) to identify the instrumental set. Subsequently, an algorithm is provided in Van der Zander & Liskiewicz (2016) for discovering the instrumental set in the simple setting where all the interactions are linear and the graph is acyclic. In contrast, our method allows non-linear cyclic interaction amongst the variables.
Several other works have also tried to address the problem of discovering causal features. The authors review work on causal feature selection in Guyon & Aliferis (2007). More recent papers on causal feature selection have appeared since (Cawley, 2008; Paul, 2017; Yu et al., 2018), but none of those claims to recover all the direct causal parents asymptotically or non-asymptotically as we do in our case. There has been another line of works on inferring causal relationships from observational data based on conditional independences, such as the -algorithm, which can be used for more general causal inference purposes, at the expense of extra assumptions, such as faithfulness, allowing inference of the Markov equivalence class through testing iterative testing of d-separation statements (Mastakouri et al., 2019; Pearl, 2009; Spirtes et al., 2000). In contrast, under our LDC, NFD and totally independent U assumptions, only a small subset of d-separation relationships are relevant, and further, these assumptions imply that the observed relevant conditional independences and associated d-separation are equivalent, so that a full set of faithfulness assumptions about conditioning sets besides are not necessary.
Another approach is to restrict the class of interactions among the covariates and the functional form of the signal-noise mixing (typically considered additive) or the distribution (e.g., non-Gaussianity) to achieve identifiability (see (Hoyer et al., 2009; Peters et al., 2014)); this includes linear approaches like (Shimizu et al., 2006) and nonlinear generalizations with additive noise (Peters et al., 2011). For a recent review of the empirical performance of structure learning algorithms and a detailed description of causal discovery methods, we refer to (Heinze-Deml et al., 2018). Recently, there have been several attempts at solving the problem of causal inference by exploiting the invariance of a prediction under a causal model given different experimental settings (Ghassami et al., 2017; Peters et al., 2016). The computational cost to run both algorithms is exponential in the number of variables when aiming to discover the full causal graph.
Our method mainly takes inspiration from Debiased/Double ML method (Chernozhukov et al., 2018a) which utilizes the concept of orthogonalization to overcome the bias introduced due to regularization. We will discuss this in detail in the next section. Considering a specific example, the Lasso suffers from the fact that the estimated coefficients are shrunk towards zero, which is undesirable (Tibshirani & Wasserman, 2017). To overcome this limitation, a debiasing approach was proposed for the Lasso in several papers (Javanmard & Montanari, 2014; 2018; Zhang & Zhang, 2014). However, unlike our approach, Debiased Lasso methods do not recover all the non-zero coefficients of the parameter vector under the generic assumptions of the present work. To be more specific, (Javanmard & Montanari, 2018) is built upon the Equation 1 with the following differences to our setting: Noise is Gaussian; has independent zero-mean Gaussian rows with covariance matrix satisfying specific bounding conditions; sparsity conditions 111 is the covariate dimension. and where and are sparsity levels of the true coefficients and the precision matrix of respectively.
2 Methodology
Before describing the proposed method, we discuss our general strategy as well as Double ML and Neyman orthogonality in the next sections, which will be helpful in building the theoretical framework for our method.
2.1 Reduction to a nonparametric estimation problem
According to Equation 1, determining whether is a parent of in our setting amounts to testing whether . Let , this can be reduced to testing whether the following estimand vanishes:
| (2) |
Indeed, independent of entails . This leads to
| (3) |
Under mild assumptions, testing whether thus reduces to testing whether . Equation 2 shows that constitutes a non-parametric estimand, i.e. a model-free functional of the observed data distribution. Nonparametric estimation results (Robins et al., 2008; Van der Laan et al., 2011; Chernozhukov et al., 2018a) make use of the efficient influence function of such estimand (see e.g. Hines et al. (2022)) to derive valid estimates and confidence bounds, while allowing the use of data adaptive estimation strategies, such as machine learning algorithms. The resulting strategies are known as target learning and debiased/double machine learning, and are suitable in challenging settings such as ours when is high dimensional with possibly non-linear dependencies among components.
2.2 Double Machine Learning (Double ML)
Double ML constitutes one possible way to derive efficient nonparametric estimates. We introduce it with the partial linear regression setting introduced in Chernozhukov et al. (2018a, Example 1.1). Given a fixed set of policy variables and control variables acting as common causes of and , we consider the partial regression model of Equation 4,
| (4) | ||||
where is the outcome variable, are disturbances and are (possibly non-linear) measurable functions. An unbiased estimator of the causal effect parameter can be obtained via the orthogonalization approach as in Chernozhukov et al. (2018a), which is obtained via the use of the “Neyman Orthogonality Condition" described below.
Neyman Orthogonality Condition:
Let denote the collection of all observed variables. The traditional estimator of in Equation 4 can be simply obtained by finding the zero of the empirical average of a score function such that . However, the estimation of is sensitive to the bias in the estimation of the function . Neyman (Neyman, 1979) proposed an orthogonalization approach to get an estimate for that is more robust to the bias in the estimation of nuisance parameter . Assume for a moment that the true nuisance parameter is (which represents and in Equation 4) then the orthogonalized “score” function should satisfy the property that the Gateaux derivative operator with respect to vanishes when evaluated at the true parameter values:
| (5) |
One way to build such a score, following Chernozhukov et al. (2018a) [eq. (2.7)], is to start from a biased score associated to maximum likelihood-like estimate. Let be the log likelihood function or another smooth objective for which the true parameter is the unique maximizer. The true parameter then satisfies , suggesting to start with as a (biased) score. In order to compensate the bias due to the nuisance parameters, we then subtract a linear function of the derivative of the likelihood with respect it, leading to the orthogonalized score
where is determined by the constraint of Equation 5 (see proof of Proposition 6 in appendix). The corresponding Orthogonalized or Double/Debiased ML estimator solves a constraint of vanishing empirical average of the orthogonalized score, based on -iid samples of the observed variables.
| (6) |
where is the estimator of and satisfies condition in Equation 5. For the partially linear model discussed in Equation 4, the orthogonalized score function is,
| (7) |
with . This leads to an debiased estimator satisfying
| (8) |
which relies on the “double” use of machine learning algorithm: once to learn and once to learn , hence the name Double ML for such estimator. We can further relate this approach to the design an estimator of the non-parametric estimand of previous section.
Indeed by subtracting on both sides of eq. 8, we get
| (9) |
Noticing that , the term in eq. 9 appears as an ML estimator of , such that we recognize on the right hand side of Equation 9 a Double ML estimator of , which is a special case of the non-parametric estimand defined in Equation 3, for the setting and . In practice, we directly learn an ML estimator of by predicting using , relying on the double robustness of the estimands (Smucler et al., 2019), as described in section 2.5.
From Double ML to Causal Discovery:
The distinction between policy variables and confounding variables is not always known in advance. Fortunately, as described in section 2.1, Double ML relies on estimating a non-parameteric estimand that does only depend on observational data and not on the causal model. This will allow us to exploit the same approach iteratively in the setting of causal discovery. To this end, we consider a set of variables which includes direct causal parents of the outcome variable as well as other variables. We also reiterate our assumption that the relationship between the outcome variable and direct causal parents of the outcome variable is linear. The relationship among other variables can be cyclic and nonlinear. We now provide a general approach to scanning putative direct causes scaling “polynomially” in their number (see Computational Complexity paragraph in next section), based on the application of a statistical test and Double ML estimators. We describe first the algorithm and then provide theoretical support for its performance.
2.3 Informal Search Algorithm Description
Pseudo-code for our proposed method (CORTH Features) is in Algorithm 1. The idea is to do a one-vs-rest split for each variable in turn and estimate the link between that particular variable and the outcome variable using Double ML. To do so, we decompose Equation 1 to single out a variable as policy variable and take the remaining variables as multidimensional control variables, and run Double ML estimation assuming the partial regression model presented in Section 2.2, which now takes the form
| (10) | ||||
The step-wise description of our estimation algorithm goes as follows:
-
(a)
Select one of the variables to estimate its (hypothetical) linear causal effect on .
-
(b)
Set all of the other variables as the set of possible confounders.
-
(c)
Use the Double ML approach to estimate the parameter i.e. the causal effect of on .
-
(d)
If the variable is not a causal parent, the distribution of the conditional covariance (Proposition 3) is a Gaussian centered around zero. We use a simple normality test for to select or discard as one of the direct causal parents of .
We iteratively repeat the procedure on each of the variables until completion. Pseudo-code for the entire procedure is given below in Algorithm 1. Guaranties for this approach to identify the true parents rely on the assumptions stated in Section 2.5, Equations ( 13-15). They notably allow for hidden confounders between covariates, as long as those are not direct causes of , not descendent of . On the contrary, if is an ancestor of any covariate, the search algorithm may fail in both directions (false positive and false negative).
Note that Equation 10 is not necessarily a correct structural equation model to describe the true underlying causal structure. In general, for instance, when actually causes , it is non-trivial to show that the Double ML estimation of parameter will be unbiased (see Section 2.4).
Remarks on Algorithm 1:
is a vector which corresponds to the samples chosen in the subsampling procedure, for any . In general the subscript represents the estimation for the variable and super-script represents the subsampling procedure. represents the set obtained after sample splitting. are (possibly nonlinear) parametric functions fitted using subsamples.
Computational Complexity:
For each subset randomly selected from the data, we fit two lasso estimators. Accelerated coordinate descent (Nesterov, 2012) can be applied to optimize the lasso objective. To achieve error, number of iterations are required where is the maximum of the two condition number for both the problems and each iteration requires computation. Hence, the computational complexity of running our approach is only polynomial in .
2.4 Orthogonal Scores
Now we describe the execution of our algorithm for a simple graph with 3 nodes. Let us consider the following linear structural equation model as an example of our general formulation:
| (11) |
Example 1.
Consider the system of structural equation given in Equation 10. If , and are independent uncorrelated noise terms with zero mean, Algorithm 1 will recover the coefficients and .
A detailed proof is given in Section A.1. While the estimation of the parameter is in line with the assumed partial regression model of Equation 11, the estimation of does not follow the same. However, it can be seen from the proof that can also be estimated from the orthogonal score in Equation 7.
We now show that this result holds for a more general graph structure given in Figure 2, allowing for non-linear cyclic interactions among features.
Proposition 2.
Assume the structural causal model of Figure 2, with (possibly non-linear and confounded) assignments between elements of , with , parameterized by . Assume the unconfounded linear structural assignment , with zero mean random variable with finite variance , independent of . Then, the score
| (12) |
with , follows the Neyman orthogonality condition for the estimation of with nuisance parameters which reads
Please refer to Section A.2 for the proof. Applying Equation 6, this leads to the debiased estimator
which relies on ML estimates and . Comparing the score in Equation 21 with the score in Equation 7, there are two takeaways from Proposition 2: (i) the orthogonality condition remains invariant irrespective of the causal direction between and , and (ii) the second term in Section 2.4 replaces function by the (unbiased) linear regression estimator for modelling all the relations; given that the relation between and is linear, even if relationships between and are non-linear (See Appendix B for concrete examples). Combining with the Double ML theoretical results (Chernozhukov et al., 2018a), this suggests that regularized predictors based on Lasso or ridge regression are tools of choice for fitting functions .
2.5 Statistical Test
We now provide a theoretically grounded statistical decision criterion for the direct causes after the model has been fitted. Consider , , , satisfying
| (13) | |||
| (14) | |||
| (15) |
where is an exogenous variable and represents all the variables except . The assumptions made with the above formulation are standard in the orthogonal machine learning literature (Rotnitzky et al., 2019; Smucler et al., 2019; Chernozhukov et al., 2018). They allow identifying causal parents based on estimates of conditional covariances defined in Equation 3
Proposition 3.
Let Then under the conditions given in Equations 13, 14 and 15, for each
-
a)
and if and only if .
-
b)
We also have (with notations of Prop. 2)
The proof is given in section A.3. There are two main implications of the results provided in Proposition 3. (i) is non-zero only for direct causal parents of the outcome variable, and has double robustness property as shown in (Rotnitzky et al., 2019; Smucler et al., 2019; Chernozhukov et al., 2018). Having double robustness property means that while computing the empirical version of the which we denote as , one can use regularized methods like ridge regression or Lasso to estimate the conditional expectation (function ). Afterward, one can perform statistical tests on top of it to decide between zero or non-zero tests. (ii) In line with the above orthogonal score results, we see that this quantity can be estimated using linear (unbiased) regression to fit the function , although interactions between features may be non-linear. Next, we discuss the variance of our estimator so that a statistical test can be used to identify causal parents. For the sake of convenience, the case of 2 partitions ()222Extension to arbitrary number of data partitions () is straightforward. Check Algorithm 1. is explained here.
Variance of Empirical Estimates of :
Suppose we have i.i.d. observations indicated by . Randomly split the data in two halves, say and . Take . For let , for let . For , compute estimates of using the data in sample . Following Smucler et al. (2019), we can use estimates of and that are solutions of -regularized regression problems to obtain square root N convergence guaranties. We use Lasso as the estimator for conditional expectation in the experiments. Now, we compute the cross-fitted empirical estimates of and associated empirical variances
| (16) | ||||
| (17) |
where denotes the empirical average over the half. Finally, let
| (18) |
Consistency of such estimators notably relies on sparsity assumptions for ground truth models in the asymptotic high-dimensional setting where covariate dimension and sparsity is allowed to vary with number of samples . In the notations below, we drop this dependency and specialize to our case.
Definition 4 (Approximate Linear-Sparse class (ALS)).
Ground truth predictor belongs to the approximately sparse class whenever there exists and a function satisfying
Theorem 1 of (Smucler et al., 2019) provides general conditions under which (see also (Chernozhukov et al., 2018)), when the estimators and are Lasso-type regularized linear regressions.
Proposition 5.
Given eqs. (13-15) and . Assume: (i) For true parameter in (13), with ; (ii) is in the ALS class with ; (iii) All have support bounded by the same constant; (iv) is independent of and has tail decaying at least as fast as an exponential random variable; (v) has eigenvalues lower and upper bounded; (vi) and are bounded with variance lower bounded.
Then the pair of estimators of eq. (18), using regularization coefficient for both Lasso estimates, satisfies
, as .
All stated bounds are uniform across and strictly positive. Proof is provided in Appendix A.4 with the broader context on the doubly robust estimation framework. The provided conditions correspond to a concise special case of the general statements provided in Smucler et al. (2019). It is possible to relax some of these assumptions, notably to allow some misspecifications of the sparsity assumptions for the Lasso estimates. Overall, the mildness of these assumptions may explain the empirical success of this approach in the following section.
Under conditions of proposition 5, the test that rejects when will have approximately confidence level. The probability of rejecting the null when it is false is
In order to account for multiple testing, we use Bonferroni correction.
Conditional Independence Tests:
Asymptotically, the conditional independence testing between and given is also a possible solution for our proposed approach. Indeed, d-separation rules imply that true causes are conditionally dependent according to this test, while non-causes are conditionally independent (because is not a collider under our NFD assumption). However, conditional independence testing is challenging in high-dimensional/non-linear settings. Kernel-based conditional independence testing is computationally expensive (Zhang et al., 2012). We used in the paper because it was already known from previous works (Smucler et al., 2019; Chernozhukov et al., 2018b) that it has double robustness property, which means one can use regularized methods like Lasso to estimate empirical conditional expectation from a finite number of samples and the empirical estimator is still unbiased with controlled variance. Our work is related to the recent work of (Shah & Peters, 2020), which proposes a conditional independence test whose proofs rely heavily on (Chernozhukov et al., 2018a). In this paper, we use for the first time such double ML-based tests for the search problem.
3 Experiments
3.1 Experimental Setup
To showcase performance of our algorithm, we conducted two sets of experiments: i) Comparison with causal structure learning methods (Casual and Markov Blanket discovery) using data consisted of DAGs with high number of observations-to-number of variables ratio () which is applicable to causal structure learning methods. Markov Blanket discovery methods are included since under NFD, faithfulness, and no-hidden-confounders assumptions, Markov Blanket of the target variable corresponds to the direct parents. Note that, faithfulness and no-hidden-confounders assumptions are not necessary for our method. These experiments are discussed in details in Section 3.1.1 ii) Comparison with inference by regression methods using data consisted of DAGs with high number of observations-to-number of variables ratio ( and ) to illustrate performance in high-dimensional regimes. This part is explained thoroughly in Section 3.1.2
3.1.1 Causal Structure Learning
For every combination of number of nodes (#nodes), connectivity , noise level , number of observations , and non-linear probability (see Table C.1), 100 examples (DAGs) are generated and stored as csv files (altogether 72.000 DAGs are simulated, comprising a dataset of overall 10GB). For each DAG, samples are generated. We provide more details about the parameters (#nodes, , and ) and data generation process in Section C.1.1. For future benchmarking, the generated files with the code will be made available later.
The baselines we compare our method against are categorized in two groups which are suitable for observational data: i) Causal Structure Learning methods: LiNGAM (Shimizu et al., 2006), order - independent PC (Colombo & Maathuis, 2014), rankPC, MMHC (Tsamardinos et al., 2006), GES (Chickering, 2003), rankGES, ARGES (adaptively restricted GES (Nandy et al., 2016)), rankARGES, FCI+ (Claassen et al., 2013), PCI (Shah & Peters, 2020) and Lasso333None-zero coefficients are reported. (Tibshirani, 1996). ii) Markov Blanket discovery methods: Grow-Shrink (GS (Margaritis & Thrun, 1999)), Incremental Association Markov Blanket (IAMB (Tsamardinos et al., 2003b)), Max-Min Parents & Children (MMPC (Tsamardinos et al., 2003a)), FastIAMB (Yaramakala & Margaritis, 2005). and IAMB with FDR Correction (Pena, 2008). The "CompareCausalNetworks"444 https://cran.r-project.org/web/packages/CompareCausalNetworks/index.html and "bnlearn: Bayesian Network Structure Learning, Parameter Learning and Inference"555https://cran.r-project.org/web/packages/bnlearn/ R Packages are used to run most of the baselines methods. We use 10-fold cross-validation to choose the parameters of all approaches. As direction of the possible causes in the defined setting is determined, the non-directional edges inferred by some baselines, e.g., PC are evaluated as direct causes of the target variable.
3.1.2 Inference by Regression
Similar to the previous section, for every combination of parameters, 50 examples are generated and stored, which means 15000 DAGs overall. Details are provided in Section C.1.2 We compare our algorithm to methods for inference in regression models: Standard Regression, Lasso with exact post-selection inference (Lee et al., 2016), Debiased Lasso (Javanmard et al., 2015), Forward Stepwise Regression for active variables (Loftus & Taylor, 2014; Tibshirani et al., 2016), Forward Stepwise Regression for all variables (Loftus & Taylor, 2014; Tibshirani et al., 2016), LARS for active variables (Efron et al., 2004; Tibshirani et al., 2016), and LARS for all variables (Efron et al., 2004; Tibshirani et al., 2016). "selectiveInference: Tools for Post-Selection Inference" R Package 666https://cran.r-project.org/web/packages/selectiveInference/ is leveraged to run most of these baselines. We used cross-validation to choose hyperparameters and confidence level for hypothesis testing considered is .
Regression Technique and Hyper-parameters:
We use Lasso as the estimator of conditional expectation for our method because the variance bound for with Lasso type estimator of conditional expectation is provided in equation 17. Further, using more splits than splits in the experiment relatively increases the performance of parameter estimation. See Figure for parameter estimations.
Evaluation:
3.2 Results
3.2.1 Causal Structure Learning
Results aggregated by the number of observations (corresponding to 24000 simulations per entry in the table) are illustrated in Table 1777Please refer to Section C.3.1 for thorough tables for all parameters.. Our method performs better than the competing baselines in terms of accuracy and F1 score, especially for more connected structures, despite data being generated according to DAG causal structures, which, dissimilar to our method, is an essential condition for them. To provide a visual comparison, we plot the accuracy of all methods w.r.t. the connectivity parameter () in Figure for different values of and on 1800 samples.
It can be observed that the accuracies of the competing baselines significantly drop with increasing noise level and nonlinearity, while our method is more robust to them. We also extensively compare all the metrics (Recall, Fall-out, Critical Success Index, Accuracy, F1 Score, and Matthews correlation coefficient) for all the methods in Appendix C.3.1. According to these metrics, our approach performs better than baselines in most cases regardless of the set of parameters used for generating data. Our method shows in particular stability in performance w.r.t. the number of nodes (Table C.3), partially non-linear relationships (Table C.4), connectivity (Table C.5), number of observations (Table C.7), and noise level (Table C.6). We also show the plot of parameter estimation for direct causal parents vs. non-causal parents in Figure . In the plots and tables, we denote our approach as CORTH Features.
| Number of Observations | ||||||
|---|---|---|---|---|---|---|
| Method | 100 | 500 | 1000 | |||
| ACC | F1 | ACC | F1 | ACC | F1 | |
| GES | 0.80 | 0.59 | 0.81 | 0.65 | 0.81 | 0.67 |
| rankGES | 0.79 | 0.56 | 0.81 | 0.64 | 0.81 | 0.65 |
| ARGES | 0.78 | 0.49 | 0.80 | 0.58 | 0.80 | 0.59 |
| rankARGES | 0.78 | 0.47 | 0.79 | 0.57 | 0.80 | 0.58 |
| FCI+ | 0.84 | 0.67 | 0.86 | 0.75 | 0.87 | 0.78 |
| LINGAM | 0.84 | 0.65 | 0.91 | 0.74 | 0.94 | 0.88 |
| PC | 0.83 | 0.64 | 0.86 | 0.73 | 0.87 | 0.75 |
| rankPC | 0.82 | 0.62 | 0.85 | 0.71 | 0.85 | 0.73 |
| MMPC | 0.77 | 0.37 | 0.82 | 0.53 | 0.83 | 0.57 |
| MMHC | 0.80 | 0.56 | 0.82 | 0.62 | 0.83 | 0.64 |
| GS | 0.79 | 0.43 | 0.84 | 0.59 | 0.86 | 0.62 |
| IAMB | 0.74 | 0.39 | 0.81 | 0.57 | 0.83 | 0.61 |
| Fast-IAMB | 0.80 | 0.46 | 0.84 | 0.59 | 0.86 | 0.62 |
| IAMB-FDR | 0.78 | 0.37 | 0.84 | 0.58 | 0.85 | 0.61 |
| PCI | 0.83 | 0.59 | 0.91 | 0.85 | 0.93 | 0.89 |
| Lasso | 0.87 | 0.81 | 0.89 | 0.85 | 0.89 | 0.85 |
| CORTH Features | 0.88 | 0.78 | 0.93 | 0.91 | 0.94 | 0.92 |
3.2.2 Inference by Regression
Analogous to previous part, results are aggregated by nonlinear probability (corresponding to 3750 simulations per entry in the table), number of observations (3000 simulations per entry in the table), connectivity (5000 simulations per entry in the table) and beta distribution parameters are provided in Tables C.8, C.9, C.10 and C.11. Based on these results, our method suggests more robustness w.r.t. the set of parameters used for generating data and relatively better performance compared to other methods.
3.3 Scaling Causal Inference to Large Graphs
Figure 5 shows the runtime of the method in secs as a function of the graph’s size. Notice that the runtime of our algorithm in the log-log plot is roughly linear, supporting our above statement about the computational time being polynomial in . As we used 5000 observations, additional overhead comes from cross-validation.
3.4 Real-World Data
We also apply our algorithm to a recent COVID-19 Dataset (Einstein, 2020) where the task is to predict COVID-19 cases (confirmed using RT-PCR) amongst suspected ones. For an existing and extensive analysis of the dataset with predictive methods, we refer to Schwab et al. (2020). We apply our algorithm to discover the features which directly cause the diagnosed infection. We found that the following were the most common causes across different runs of our approach: Patient age quantile, Arterial Lactic Acid, Promyelocytes, and Base excess venous blood gas analysis. Lacking medical ground truth, we report these not as corroboration of our approach but rather as a potential contribution to causal discovery in this challenging problem. It is encouraging that some of these variables are consistent with other studies Schwab et al. (2020). Details on data preprocessing and more results are available in Appendix D.
4 Discussion
A recent empirical evaluation of different causal discovery methods highlighted the desirability of more efficient search algorithms (Heinze-Deml et al., 2018). In the present work, we provide identifiability results for the set of direct causal parents, including the case of partially nonlinear cyclic models, as well as a highly efficient algorithm that scales well w.r.t. the number of variables and exhibits state-of-the-art performance across extensive experiments. Our approach builds on the Double ML method Chernozhukov et al. (2018a) and properties of conditional covariance estimands, which can leverage Lasso predictors to obtain consistent estimators in high dimensional settings Smucler et al. (2019). Theoretical properties of such approaches (Smucler et al., 2019, Section 2), such as rate double robustness, which accommodates non-strict (approximate) sparsity assumptions, as well as model double robustness, which allows some degree of model misspecification, may explain the empirically observed performance of our approach. Whilst not amounting to full causal graph discovery, identification of causal parents is of major interest in real-world applications, e.g., when assaying the causal influence of genes on the phenotype. A natural direction worth exploring is to extend this approach for discovering direct causal parents in the case when nonlinear relationships exist between the output variable and its direct causal parents.
Acknowledgements
This work was supported by the German Federal Ministry of Education and Research (BMBF): Tübingen AI Center, FKZ: 01IS18039B.
References
- Ahmed et al. (2020) Ossama Ahmed, Frederik Träuble, Anirudh Goyal, Alexander Neitz, Yoshua Bengio, Bernhard Schölkopf, Manuel Wüthrich, and Stefan Bauer. Causalworld: A robotic manipulation benchmark for causal structure and transfer learning. arXiv preprint arXiv:2010.04296, 2020.
- Angrist & Imbens (1995) Joshua D Angrist and Guido W Imbens. Identification and estimation of local average treatment effects. Technical report, National Bureau of Economic Research, 1995.
- Angrist et al. (1996) Joshua D Angrist, Guido W Imbens, and Donald B Rubin. Identification of causal effects using instrumental variables. Journal of the American statistical Association, 91(434):444–455, 1996.
- Baron & Kenny (1986) Reuben M Baron and David A Kenny. The moderator–mediator variable distinction in social psychological research: Conceptual, strategic, and statistical considerations. Journal of personality and social psychology, 51(6), 1986.
- Bollen (1989) Kenneth A Bollen. Structural equations with latent variables, volume 210. John Wiley & Sons, 1989.
- Bongers et al. (2016) Stephan Bongers, Jonas Peters, Bernhard Schölkopf, and Joris M Mooij. Theoretical aspects of cyclic structural causal models. arXiv preprint arXiv:1611.06221, 2016.
- Bongers et al. (2021) Stephan Bongers, Patrick Forré, Jonas Peters, and Joris M Mooij. Foundations of structural causal models with cycles and latent variables. The Annals of Statistics, 49(5):2885–2915, 2021.
- Bowden & Turkington (1990) Roger J Bowden and Darrell A Turkington. Instrumental variables, volume 8. Cambridge university press, 1990.
- Brito & Pearl (2012) Carlos Brito and Judea Pearl. Generalized instrumental variables. arXiv preprint arXiv:1301.0560, 2012.
- Bühlmann & Van De Geer (2011) Peter Bühlmann and Sara Van De Geer. Statistics for high-dimensional data: methods, theory and applications. Springer Science & Business Media, 2011.
- Castro et al. (2020) Daniel C Castro, Ian Walker, and Ben Glocker. Causality matters in medical imaging. Nature Communications, 11(1):1–10, 2020.
- Cawley (2008) Gavin C Cawley. Causal & non-causal feature selection for ridge regression. In Causation and Prediction Challenge, 2008.
- Chernozhukov et al. (2018a) Victor Chernozhukov, Denis Chetverikov, Mert Demirer, Esther Duflo, Christian Hansen, Whitney Newey, and James Robins. Double/debiased machine learning for treatment and structural parameters, 2018a.
- Chernozhukov et al. (2018b) Victor Chernozhukov, Whitney Newey, and James Robins. Double/de-biased machine learning using regularized riesz representers. arXiv preprint arXiv:1802.08667, 2018b.
- Chernozhukov et al. (2018) Victor Chernozhukov, Whitney K. Newey, and Rahul Singh. Learning L2 Continuous Regression Functionals via Regularized Riesz Representers. arXiv preprint arXiv:1809.05224, Sep 2018.
- Chickering (2003) David Maxwell Chickering. Optimal structure identification with greedy search. J. Mach. Learn. Res., 3(null):507–554, March 2003. ISSN 1532-4435. doi: 10.1162/153244303321897717. URL https://doi.org/10.1162/153244303321897717.
- Claassen et al. (2013) Tom Claassen, Joris M. Mooij, and Tom Heskes. Learning sparse causal models is not np-hard. In Proceedings of the Twenty-Ninth Conference on Uncertainty in Artificial Intelligence, UAI’13, pp. 172–181, Arlington, Virginia, USA, 2013. AUAI Press.
- Colombo & Maathuis (2014) Diego Colombo and Marloes H. Maathuis. Order-independent constraint-based causal structure learning. Journal of Machine Learning Research, 15(116):3921–3962, 2014. URL http://jmlr.org/papers/v15/colombo14a.html.
- Efron et al. (2004) Bradley Efron, Trevor Hastie, Iain Johnstone, and Robert Tibshirani. Least angle regression. The Annals of statistics, 32(2):407–499, 2004.
- Einstein (2020) Hospital Israelita Albert Einstein. Diagnosis of COVID-19 and its clinical spectrum, 2020. https://www.kaggle.com/einsteindata4u/covid19.
- Forré & Mooij (2017) Patrick Forré and Joris M Mooij. Markov properties for graphical models with cycles and latent variables. arXiv preprint arXiv:1710.08775, 2017.
- Ghassami et al. (2017) AmirEmad Ghassami, Saber Salehkaleybar, Negar Kiyavash, and Kun Zhang. Learning causal structures using regression invariance. In Advances in Neural Information Processing Systems, pp. 3011–3021, 2017.
- Guyon & Aliferis (2007) Isabelle Guyon and Constantin Aliferis. Causal feature selection. In Computational methods of feature selection. Chapman and Hall/CRC, 2007.
- Hayes (2017) Andrew F Hayes. Introduction to mediation, moderation, and conditional process analysis: A regression-based approach. Guilford publications, 2017.
- Heinze-Deml et al. (2018) Christina Heinze-Deml, Marloes H Maathuis, and Nicolai Meinshausen. Causal structure learning. Annual Review of Statistics and Its Application, 5:371–391, 2018.
- Hines et al. (2022) Oliver Hines, Oliver Dukes, Karla Diaz-Ordaz, and Stijn Vansteelandt. Demystifying statistical learning based on efficient influence functions. The American Statistician, pp. 1–13, 2022.
- Hoyer et al. (2009) Patrik O Hoyer, Dominik Janzing, Joris M Mooij, Jonas Peters, and Bernhard Schölkopf. Nonlinear causal discovery with additive noise models. In Advances in neural information processing systems, pp. 689–696, 2009.
- Janzing (2019) Dominik Janzing. Causal regularization. In Advances in Neural Information Processing Systems, 2019.
- Javanmard et al. (2015) A Javanmard et al. De-biasing the lasso: Optimal sample size for gaussian designs. arxiv, 2015.
- Javanmard & Montanari (2014) Adel Javanmard and Andrea Montanari. Confidence intervals and hypothesis testing for high-dimensional regression. The Journal of Machine Learning Research, 15(1), 2014.
- Javanmard & Montanari (2018) Adel Javanmard and Andreas Montanari. Debiasing the lasso: Optimal sample size for gaussian designs. The Annals of Statistics, 46(6A), 2018.
- Lacerda et al. (2012) Gustavo Lacerda, Peter L Spirtes, Joseph Ramsey, and Patrik O Hoyer. Discovering cyclic causal models by independent components analysis. arXiv preprint arXiv:1206.3273, 2012.
- Lee et al. (2016) Jason D Lee, Dennis L Sun, Yuekai Sun, and Jonathan E Taylor. Exact post-selection inference, with application to the lasso. The Annals of Statistics, 44(3):907–927, 2016.
- Loftus & Taylor (2014) Joshua R Loftus and Jonathan E Taylor. A significance test for forward stepwise model selection. arXiv preprint arXiv:1405.3920, 2014.
- Margaritis & Thrun (1999) Dimitris Margaritis and Sebastian Thrun. Bayesian network induction via local neighborhoods. Advances in neural information processing systems, 12, 1999.
- Mastakouri et al. (2019) Atalanti Mastakouri, Bernhard Schölkopf, and Dominik Janzing. Selecting causal brain features with a single conditional independence test per feature. In Advances in Neural Information Processing Systems 32, pp. 12532–12543, 2019.
- Matthews (1975) Brian W Matthews. Comparison of the predicted and observed secondary structure of t4 phage lysozyme. Biochimica et Biophysica Acta (BBA)-Protein Structure, 405(2):442–451, 1975.
- Meinshausen et al. (2016) Nicolai Meinshausen, Alain Hauser, Joris M Mooij, Jonas Peters, Philip Versteeg, and Peter Bühlmann. Methods for causal inference from gene perturbation experiments and validation. Proceedings of the National Academy of Sciences, 113(27):7361–7368, 2016.
- Nandy et al. (2016) Preetam Nandy, Alain Hauser, and Marloes Maathuis. High-dimensional consistency in score-based and hybrid structure learning. Annals of Statistics, 46, 03 2016. doi: 10.1214/17-AOS1654.
- Nesterov (2012) Yu Nesterov. Efficiency of coordinate descent methods on huge-scale optimization problems. SIAM Journal on Optimization, 22(2):341–362, 2012.
- Neyman (1979) Jerzy Neyman. C () tests and their use. Sankhyā: The Indian Journal of Statistics, Series A, 1979.
- Paul (2017) Michael Paul. Feature selection as causal inference: Experiments with text classification. In Proceedings of the 21st Conference on Computational Natural Language Learning (CoNLL 2017), pp. 163–172, 2017.
- Pearl (2009) Judea Pearl. Causality. Cambridge university press, 2009.
- Pena (2008) Jose M Pena. Learning gaussian graphical models of gene networks with false discovery rate control. In European conference on evolutionary computation, machine learning and data mining in bioinformatics, pp. 165–176. Springer, 2008.
- Peters et al. (2011) Jonas Peters, Joris Mooij, Dominik Janzing, and Bernhard Schölkopf. Identifiability of causal graphs using functional models. In Proceedings of the 27th Annual Conference on Uncertainty in Artificial Intelligence ( UAI), pp. 589–598, 2011.
- Peters et al. (2014) Jonas Peters, Joris M Mooij, Dominik Janzing, and Bernhard Schölkopf. Causal discovery with continuous additive noise models. The Journal of Machine Learning Research, 15(1):2009–2053, 2014.
- Peters et al. (2016) Jonas Peters, Peter Bühlmann, and Nicolai Meinshausen. Causal inference by using invariant prediction: identification and confidence intervals. Journal of the Royal Statistical Society: Series B (Statistical Methodology), 78(5):947–1012, 2016.
- Peters et al. (2017) Jonas Peters, Dominik Janzing, and Bernhard Schölkopf. Elements of causal inference: foundations and learning algorithms. MIT press, 2017.
- Robins et al. (2008) James Robins, Lingling Li, Eric Tchetgen, Aad van der Vaart, et al. Higher order influence functions and minimax estimation of nonlinear functionals. Probability and statistics: essays in honor of David A. Freedman, 2:335–421, 2008.
- Rothenhäusler et al. (2015) Dominik Rothenhäusler, Christina Heinze, Jonas Peters, and Nicolai Meinshausen. Backshift: Learning causal cyclic graphs from unknown shift interventions. Advances in Neural Information Processing Systems, 28, 2015.
- Rotnitzky et al. (2019) Andrea Rotnitzky, Ezequiel Smucler, and James M. Robins. Characterization of parameters with a mixed bias property. arXiv preprint arXiv:1904.03725, 2019.
- Runge et al. (2019) Jakob Runge, Sebastian Bathiany, Erik Bollt, Gustau Camps-Valls, Dim Coumou, Ethan Deyle, Clark Glymour, Marlene Kretschmer, Miguel D Mahecha, Jordi Muñoz-Marí, et al. Inferring causation from time series in earth system sciences. Nature communications, 10(1):1–13, 2019.
- Sachs et al. (2005) Karen Sachs, Omar Perez, Dana Pe’er, Douglas A Lauffenburger, and Garry P Nolan. Causal protein-signaling networks derived from multiparameter single-cell data. Science, 308(5721):523–529, 2005.
- Sanchez-Romero et al. (2019) Ruben Sanchez-Romero, Joseph D Ramsey, Kun Zhang, Madelyn RK Glymour, Biwei Huang, and Clark Glymour. Estimating feedforward and feedback effective connections from fmri time series: Assessments of statistical methods. Network Neuroscience, 3(2):274–306, 2019.
- Schwab et al. (2020) Patrick Schwab, August DuMont Schütte, Benedikt Dietz, and Stefan Bauer. predcovid-19: A systematic study of clinical predictive models for coronavirus disease 2019. arXiv preprint arXiv:2005.08302, 2020.
- Shah & Peters (2020) Rajen D Shah and Jonas Peters. The hardness of conditional independence testing and the generalised covariance measure. The Annals of Statistics, 48(3):1514–1538, 2020.
- Shimizu et al. (2006) Shohei Shimizu, Patrik O Hoyer, Aapo Hyvärinen, and Antti Kerminen. A linear non-gaussian acyclic model for causal discovery. Journal of Machine Learning Research, 7(Oct):2003–2030, 2006.
- Shrout & Bolger (2002) Patrick E Shrout and Niall Bolger. Mediation in experimental and nonexperimental studies: new procedures and recommendations. Psychological methods, 7(4), 2002.
- Smucler et al. (2019) Ezequiel Smucler, Andrea Rotnitzky, and James M Robins. A unifying approach for doubly-robust regularized estimation of causal contrasts. Technical report, 2019.
- Spirtes et al. (2000) Peter Spirtes, Clark N Glymour, Richard Scheines, and David Heckerman. Causation, prediction, and search. MIT press, 2000.
- Tibshirani (1996) Robert Tibshirani. Regression shrinkage and others. Journal of the Royal Statistical Society: Series B (Methodological), 58(1):267–288, 1996.
- Tibshirani & Wasserman (2017) Ryan Tibshirani and Larry Wasserman. Sparsity, the lasso, and friends, 2017.
- Tibshirani et al. (2016) Ryan J Tibshirani, Jonathan Taylor, Richard Lockhart, and Robert Tibshirani. Exact post-selection inference for sequential regression procedures. Journal of the American Statistical Association, 111(514):600–620, 2016.
- Tsamardinos et al. (2003a) Ioannis Tsamardinos, Constantin F Aliferis, and Alexander Statnikov. Time and sample efficient discovery of markov blankets and direct causal relations. In Proceedings of the ninth ACM SIGKDD international conference on Knowledge discovery and data mining, pp. 673–678, 2003a.
- Tsamardinos et al. (2003b) Ioannis Tsamardinos, Constantin F Aliferis, Alexander R Statnikov, and Er Statnikov. Algorithms for large scale markov blanket discovery. In FLAIRS conference, volume 2, pp. 376–380. St. Augustine, FL, 2003b.
- Tsamardinos et al. (2006) Ioannis Tsamardinos, Laura Brown, and Constantin Aliferis. The max-min hill-climbing bayesian network structure learning algorithm. Machine Learning, 65:31–78, 10 2006. doi: 10.1007/s10994-006-6889-7.
- Van der Laan et al. (2011) Mark J Van der Laan, Sherri Rose, et al. Targeted learning: causal inference for observational and experimental data, volume 10. Springer, 2011.
- Van der Zander & Liskiewicz (2016) Benito Van der Zander and Maciej Liskiewicz. On searching for generalized instrumental variables. In AISTATS, pp. 1214–1222, 2016.
- Warrell & Gerstein (2020) Jonathan Warrell and Mark Gerstein. Cyclic and multilevel causation in evolutionary processes. Biology & Philosophy, 35(5):1–36, 2020.
- Yao et al. (2015) Shun Yao, Shinjae Yoo, and Dantong Yu. Prior knowledge driven granger causality analysis on gene regulatory network discovery. BMC bioinformatics, 16(1):1–18, 2015.
- Yaramakala & Margaritis (2005) Sandeep Yaramakala and Dimitris Margaritis. Speculative markov blanket discovery for optimal feature selection. In Fifth IEEE International Conference on Data Mining (ICDM’05), pp. 4–pp. IEEE, 2005.
- Yu et al. (2018) Kui Yu, Lin Liu, and Jiuyong Li. A unified view of causal and non-causal feature selection. arXiv preprint arXiv:1802.05844, 2018.
- Zhang & Zhang (2014) Cun-Hui Zhang and Stephanie S Zhang. Confidence intervals for low dimensional parameters in high dimensional linear models. Journal of the Royal Statistical Society: Series B (Statistical Methodology), 76(1), 2014.
- Zhang et al. (2012) Kun Zhang, Jonas Peters, Dominik Janzing, and Bernhard Schölkopf. Kernel-based conditional independence test and application in causal discovery. arXiv preprint arXiv:1202.3775, 2012.
- Zheng et al. (2018) Xun Zheng, Bryon Aragam, Pradeep K Ravikumar, and Eric P Xing. Dags with no tears: Continuous optimization for structure learning. In Advances in Neural Information Processing Systems, pp. 9472–9483, 2018.
Appendix A Causal Discovery via Orthogonalization
A.1 Example 1
Proof of Example 1 .
Let us start from the easier case first (See Figure A.1) . Let us first try to estimate the coefficient of interaction between and but it is also very clear that the estimation of will be unbiased as the given setting precisely match with the double machine learning setting. However, we will see in this example that given the population, can be approximated as well. Let us write down the structural equation model first:
| (19) | ||||
From the set of equations we have:
Let also denote and . Hence, , and . Let us first try to find the regression co-efficient of fitting on .
Hence, if is independent of .
| (20) |
Similarly, if we fit on then
then . However can also be written as following:
Hence,
Residual . Hence we can have
We now calculate,
Last equation was written after a step of minor calculation. Since the estimator is
∎
A.2 Influence of the interactions between parents
In this section, we use a generic example shown in Figure 2 which we show again in Figure A.2 to illustrate the role of interactions between the covariates on the proposed causal discovery algorithm.
The estimator discussed can simply be derived from the Neyman orthogonality condition. We now provide the below the proof for Proposition 2. For the sake of completeness, we also rewrite the statement of the proposition again.
Proposition 6 (Restatement of Proposition 2).
Assume the structural causal model of Fig. A.2, with (possibly non-linear and confounded) assignments between elements of , with , parameterized by . Assume the unconfounded linear structural assignment , with zero mean random variable with finite variance , independent of . Then, the score
| (21) |
with , follows the Neyman orthogonality condition for the estimation of with nuisance parameters which reads
Proof of Proposition 2.
We first use a likelihood based approach under an additional Gaussianity assumption before addressing the general setting.
Special case
Let us assume is Gaussian. Using the global Markov factorization for simple SCMs888The necessary condition for this statement to be true is uniquely solvability which is equivalent to not having self-cycles in the causal structure. (Forré & Mooij, 2017; Bongers et al., 2021),
due to linearity and gaussianity of the assignment of , we obtain a negative log likelihood of the form (up to additive constants)
where stands for the negative log likelihood of the second factor and is the nuisance parameter vector. Following the principle of the approach described in main text, we use Chernozhukov et al. (2018a) [Eq. (2.7)] to define the Neyman orthogonalized score, leading to :
The quantity should be chosen to satisfy Neyman orthogonality of Equation 5, which leads to999the transpose in should be understood as organizing columnwise the partial derivatives with respect to each components of
leading to the expression of given in Chernozhukov et al. (2018a) [eq. (2.8)]:
with
and
resulting in
Reintroducing in the expression of the correction term leads to
leads to
which leads to the final expression of the orthogonalized score :
Since is a positive constant of the problem, we can remove it while still having an appropriate orthogonalized score for this estimation problem, leading to the final expression
General case
We now drop the Gaussianity assumption. Interestingly, the least square objective
is still an appropriate (biased) score for the estimation problem, in which the nuisance parameters do not play a role. Indeed, starting from the structural equation of
we get
which can be rewritten as
As a consequence, the true parameter is the unique minimizer of the loss, identified by this vanishing paratial derivative. We can thus apply the previous orthogonalization procedure in the same way as we did for the likelihood, defining
and leading to the exact same orthogonalized score (up to irrelevant sign change).
∎
A.3 Proof of proposition 3
Proof.
From Equation 13
Thus
Since , if and only if , proving a)-b). For c), we rely on the properties of the Hilbert space of square integrable RV’s , equiped with the scalare product . We rewrite
Under our assumptions, is the orthogonal projection of on the subspace of -measurable square integrable RV’s , so is orthogonal to any elements of . Noticing that is an element of , the second right-hand side term of the above equation vanishes and we get the result. ∎
A.4 Background on the Bilinear Influence Function (BIF) class and proof of Proposition 5
We summarize the results in Smucler et al. (2019) that justify the normal convergence of the Lasso-type estimates that we relying on in Section 2.5 to perform statistical hypothesis tests. This paper investigates the properties of -regularised machine learning estimators for a particular family of non-parametric estimands, called Bilinear Influence Function (BIF) functionals.
The estimand is denoted where denotes the model. The bias of the estimator due to the unperfect estimate of can be quantified using the influence function framework, leading to the following Taylor expansion in the neighborhood of the true model ,
where is the influence function, which is a mean zero random variable under distribution of the true model, and is the empirical distribution of iid samples of the observation distribution.
Estimands belonging to the BIF class are characterized by an influence function of the following form, for observed random variables including a vector ,
where and are in and and are linear in the second argument (Smucler et al., 2019, Definition 1).
Our estimand of Equation 3 belongs to this BIF class as an expected conditional covariance (Smucler et al., 2019, Example 5), written in the notation of that paper as Lin.L, Lin.E and Lin.V.
For this case, Hines et al. (2022) (among others) provide the influence function:
which entails the BIF function parameters , , , , ,.
An estimation procedure of BIF functionals based on Lasso-type estimators of conditional expectations is described in Smucler et al. (2019, Section 3.1), and corresponds to ours described in section 2.5. In short, estimates are chosen among a family of models of the form and , with parameters , that solve the regularized problem of the general form
| (22) |
for with an -sample empirical average, the regularization parameter and objective function
In our case, we can use linear models which entail an identity link function and anti-derivative . Moreover the weight can be set to Smucler et al. (2019), leading to
and
which thus both reduce to least square linear regression objectives, and thus turn eq. 22 into the classical Lasso objective.
Asymptotic properties are established for the true and/or belonging sequences of models associated to each sample size with parameter dimension and sparsity , quantified as an upper bound on the number of non-zero coefficients of a vector, i.e. its norm , such that
In particular, (Smucler et al., 2019, Section 4) use the approximately generalized linear-sparse class, for some , such that there exists and a function satisfying (dependence on is dropped to ease notation)
where and . In our main text Definition 4, we specialize this class to the linear case () and .
Sketch of the proof of Proposition 5.
Statement (3) of Theorem 1 in Smucler et al. (2019) provides necessary conditions the estimators’ error to converges to a zero mean distribution with an accurate empirical estimate of the the variance. These conditions are gathered in 3 subsets of assumptions called Lin.L, Lin.E and Lin.V (see conditions 1-3 in (Smucler et al., 2019, Section 5.1.1) together with statements of sufficient conditions to satisfy them. Based on these statements, we go through justifications for each assumptions.
Lin.L
Our assumption (i) entails that this as Lin.L.1 trivially satisfied for (see (Smucler et al., 2019, Section 4, Example 9)). Moreover, Lin.L.1 is satisfied for explicitly by our assumption (ii).
For Lin.L.2, we use the statement of Smucler et al. (2019) that it can be replaced by an assumption of “tails decays at least as fast as the tails of an exponential random variable”. This is achieved by the combined effect of our assumptions (iii) and (iv).
For Lin.L.3-4, we use the statement of Smucler et al. (2019) that our assumptions (iii) and (v) are sufficient.
Lin.L.5, is trivial as in our case .
Lin.E
For Lin.E.1 we use the statement by Smucler et al. (2019) that our assumption (vi) is sufficient.
For Lin.E.2, a) results from the (strictly positive) lower bound on the variances in our assumption (vi), combined with (iii-iv) for the requested upper bounds.
Lin.V
For Lin.V.1 is directly stated in our assumption (iii).
For Lin.V.2 is trivial as in our case .
For Lin.V.3 is directly imposed by our assumption (iii), as stated by Smucler et al. (2019) for their Example 9.
∎
Appendix B Examples
The result discussed in Proposition 2 is not directly intuitive. In simple words, there are two takeaways from Proposition 2: (i) the orthogonality condition remains invariant irrespective of the causal direction between and , and (ii) the second term in Proposition 6 suggests to use a linear estimator for modeling all the relations, given that the relation between and is linear.
To generate more intuition, we provide a few examples. Let us go back again to the three variable interaction assuming the following structural equation model:
| (23) | ||||
where is a nonlinear function and are zero mean Gaussian noises.
-
•
Consider the case when . The goal is to estimate the parameter which we call . We follow the standard double ML procedure assuming policy variable and control , although the ground truth causal dependency in contradiction with such setting (see Equation 4). The estimate of following the double ML procedure, which we call . Similarly, we want to estimate from which we get, . It is easy to see that . Hence, and it is easy to see .
-
•
Consider now the more general case where is any nonlinear function. As in the previously discussed example, the goal is to estimate . We have . Similarly, . We substitute these estimates into the orthogonality condition in Proposition 6:
From the above two examples, it is clear that even though the internal relations between the variables are nonlinear, all we need is an unbiased linear estimate to estimate the causal parameter.
Appendix C Data Generation and Evaluation Metric
C.1 Data Generation
C.1.1 Causal Structure Learning Data
| connectivity | # nodes | nonlinear probability | # observ. | noise level |
|---|---|---|---|---|
| n | ||||
| 0.1 | 5 | 0 | 100 | 0.01 |
| 0.3 | 10 | 0.3 | 500 | 0.1 |
| 0.5 | 20 | 0.5 | 1.000 | 0.3 |
| 50 | 1 | 0.5 | ||
| 1 |
For every combination of number of nodes (#nodes), connectivity , noise level , number of observation , and non-linear probability (look at Table C.1), 100 examples (DAGs) are generated and stored as csv files (altogether 72.000 DAGs are simulated, comprising a dataset of overall 10GB). For each DAG, number of samples are generated by sampling noise ( in Equation 25) with variance starting from root of the DAG. For future benchmarking, the generated files will be made available with the code later on.
We generate DAGs (Direct Acyclic Graphs) in multiple steps: i) a random permutation of nodes is chosen as a topological order of a DAG. ii) Based on this order, directed edges are added to this DAG from each node to its followers with a certain probability (connectivity). iii) For each observation, values are assigned to nodes according to the topological order of the DAG in such a way that each node’s value is determined by summing over transformations (linear or nonlinear with a certain nonlinear probability ) of values of its direct causes with the addition of Gaussian distributed noise. The non-linear transformation used is 101010The resulting values in the experiments are not concentrated around zero, and they are even up to 10ks for large graphs ( nodes). With the nonlinearity feature of for relatively large values taken into account, this is a good representer of nonlinear relationships., with and . If the set of parents for the node is denoted as as before then value assignment for a node is as follow:
| (24) |
where in which represents noise level. is an indicator functions which decides between linear or non-linear contribution of in . We decide the value of by generating a binary randon number which is with probablity and with probability . The value of is set to for the small DAGs (number of nodes equal to 5 or 10) and for large DAGs (number of nodes equal to 20 or 50) due to the value exploitation that might happen in large graphs.
We vary and investigate the effect of non-linear relationships, the number of nodes, number of observations, effect of connectivity and noise level while simulating the data. We summarize the factors in the data generation in Table C.1.
C.1.2 Inference by Regression Data
Similar to Section C.1.1, data generation follows the random topological order but with a slight difference, i.e., with the following value assignment,
| (25) |
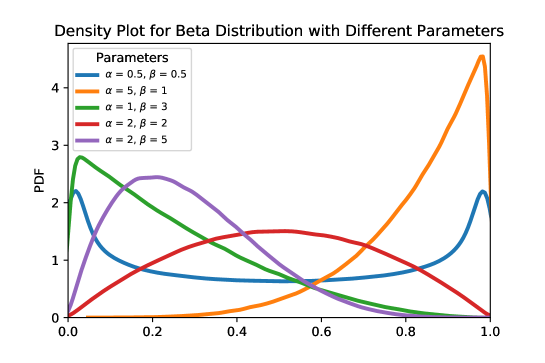
where in which and are parameters of beta distribution. The reason for this is that most of the inference methods exploit normality tests and this way it is possible to challenge them. A diverse set of parameters are chosen for the beta distribution to signifies this point (see Figure C.1). The set of parameters of DAGs varies according to Table C.2. For each setting, 50 examples are generated and stored (15000 DAGs overall) which will be available for future studies.
| connectivity | # nodes | nonlinear probability | # observ. | beta distribution parameter |
|---|---|---|---|---|
| n | ||||
| 0.1 | 100 | 0 | 10 | (0.5, 0.5) |
| 0.3 | 0.3 | 20 | (5, 1) | |
| 0.5 | 0.5 | 50 | (1, 3) | |
| 1 | 100 | (2, 2) | ||
| 200 | (2, 5) |
Code:
The code for the method and data generation is available in this GitHub repository.
C.2 Evaluation Metric
Correctly and incorrectly inferred direct causes are considered true and false. Let the total number of true positives, false positives, true negatives ,and false negatives denoted by TP, FP, TN, and FN, we evaluate our method using following metrics:
-
•
Recall (true positive rate):
-
•
Fall-out (false positive rate):
-
•
Critical Success Index (CSI): also known as Threat Score.
-
•
Accuracy:
-
•
F1 Score: harmonic mean of precision and sensitivity.
-
•
Matthews correlation coefficient (MCC): a metric for evaluating quality of binary classification introduced in (Matthews, 1975).
In some rare cases, we encountered zero-divided-by-zero and divided-by-zero cases for some of these metrics. In these situations, scores are reported 1 and 0 respectively while Fall-out is reported 0 and 1.
C.3 Supplementary Tables for Performance in Inferring Direct Causes
Here, additional tables for the result of the experiments are provided.
C.3.1 Compared to Causal Structure Learning Methods
In this section, supplementary tables supporting superior performance of CORTH Features compared to well-established Causal and Markov Blanket discovery methods are provided (See Tables C.5, C.3, C.7, C.4 and C.6). This superiority is consistent w.r.t. connectivity (Table C.5), number of nodes (Table C.3), number of observations (Table C.7), nonlinearity (Table C.4), and noise (Table C.6) using different evaluation metrics.
| Number of Nodes | ||||||||||||
| Method | 5 | 10 | 20 | 50 | ||||||||
| ACC | CSI | F1 | ACC | CSI | F1 | ACC | CSI | F1 | ACC | CSI | F1 | |
| GES | 0.935 | 0.890 | 0.911 | 0.854 | 0.730 | 0.779 | 0.743 | 0.442 | 0.526 | 0.698 | 0.245 | 0.323 |
| rankGES | 0.923 | 0.857 | 0.883 | 0.846 | 0.700 | 0.753 | 0.740 | 0.428 | 0.514 | 0.697 | 0.237 | 0.316 |
| ARGES | 0.922 | 0.864 | 0.885 | 0.797 | 0.551 | 0.584 | 0.752 | 0.447 | 0.524 | 0.705 | 0.186 | 0.221 |
| rankARGES | 0.914 | 0.838 | 0.861 | 0.793 | 0.537 | 0.572 | 0.750 | 0.435 | 0.514 | 0.705 | 0.181 | 0.216 |
| FCI+ | 0.963 | 0.918 | 0.932 | 0.873 | 0.744 | 0.808 | 0.830 | 0.602 | 0.703 | 0.766 | 0.368 | 0.486 |
| LINGAM | 0.991 | 0.978 | 0.982 | 0.953 | 0.865 | 0.889 | 0.891 | 0.712 | 0.778 | 0.750 | 0.318 | 0.385 |
| PC | 0.957 | 0.913 | 0.929 | 0.864 | 0.723 | 0.786 | 0.823 | 0.569 | 0.664 | 0.763 | 0.348 | 0.457 |
| rankPC | 0.946 | 0.891 | 0.912 | 0.854 | 0.701 | 0.768 | 0.813 | 0.541 | 0.638 | 0.754 | 0.324 | 0.431 |
| MMPC | 0.868 | 0.586 | 0.597 | 0.823 | 0.494 | 0.535 | 0.790 | 0.412 | 0.489 | 0.749 | 0.260 | 0.350 |
| MMHC | 0.929 | 0.878 | 0.905 | 0.841 | 0.675 | 0.739 | 0.767 | 0.432 | 0.507 | 0.725 | 0.218 | 0.281 |
| GS | 0.883 | 0.613 | 0.623 | 0.855 | 0.563 | 0.601 | 0.824 | 0.501 | 0.580 | 0.759 | 0.310 | 0.388 |
| IAMB | 0.850 | 0.571 | 0.585 | 0.791 | 0.508 | 0.561 | 0.806 | 0.500 | 0.587 | 0.768 | 0.337 | 0.424 |
| FastIAMB | 0.883 | 0.614 | 0.624 | 0.858 | 0.571 | 0.611 | 0.828 | 0.511 | 0.593 | 0.770 | 0.326 | 0.409 |
| IAMB-FDR | 0.869 | 0.584 | 0.593 | 0.831 | 0.494 | 0.526 | 0.825 | 0.484 | 0.558 | 0.770 | 0.322 | 0.406 |
| PCI | 0.984 | 0.965 | 0.972 | 0.922 | 0.844 | 0.875 | 0.888 | 0.734 | 0.782 | 0.773 | 0.414 | 0.491 |
| Lasso | 0.965 | 0.948 | 0.968 | 0.905 | 0.834 | 0.892 | 0.894 | 0.786 | 0.866 | 0.773 | 0.489 | 0.627 |
| CORTH Features (Ours) | 0.988 | 0.968 | 0.973 | 0.949 | 0.908 | 0.934 | 0.949 | 0.865 | 0.905 | 0.795 | 0.559 | 0.663 |
| Number of Nodes | ||||||||||||
| Method | 5 | 10 | 20 | 50 | ||||||||
| TPR | FPR | MCC | TPR | FPR | MCC | TPR | FPR | MCC | TPR | FPR | MCC | |
| GES | 0.934 | 0.056 | 0.891 | 0.790 | 0.090 | 0.711 | 0.502 | 0.088 | 0.436 | 0.304 | 0.083 | 0.221 |
| rankGES | 0.924 | 0.068 | 0.877 | 0.780 | 0.098 | 0.695 | 0.493 | 0.089 | 0.425 | 0.297 | 0.083 | 0.215 |
| ARGES | 0.903 | 0.046 | 0.906 | 0.590 | 0.041 | 0.841 | 0.500 | 0.073 | 0.557 | 0.220 | 0.020 | 0.794 |
| rankARGES | 0.897 | 0.054 | 0.896 | 0.584 | 0.044 | 0.832 | 0.495 | 0.075 | 0.549 | 0.216 | 0.020 | 0.789 |
| FCI+ | 0.969 | 0.029 | 0.948 | 0.797 | 0.054 | 0.759 | 0.642 | 0.042 | 0.645 | 0.389 | 0.030 | 0.454 |
| LINGAM | 0.991 | 0.007 | 0.988 | 0.886 | 0.008 | 0.934 | 0.770 | 0.055 | 0.759 | 0.391 | 0.072 | 0.471 |
| PC | 0.950 | 0.024 | 0.941 | 0.759 | 0.041 | 0.759 | 0.600 | 0.032 | 0.650 | 0.363 | 0.021 | 0.468 |
| rankPC | 0.944 | 0.039 | 0.925 | 0.750 | 0.053 | 0.734 | 0.580 | 0.034 | 0.629 | 0.341 | 0.024 | 0.427 |
| MMPC | 0.588 | 0.006 | 0.965 | 0.498 | 0.011 | 0.852 | 0.417 | 0.006 | 0.684 | 0.261 | 0.003 | 0.528 |
| MMHC | 0.895 | 0.011 | 0.903 | 0.691 | 0.015 | 0.724 | 0.444 | 0.009 | 0.523 | 0.219 | 0.005 | 0.330 |
| GS | 0.615 | 0.002 | 0.973 | 0.566 | 0.001 | 0.895 | 0.506 | 0.001 | 0.739 | 0.311 | 0.000 | 0.688 |
| IAMB | 0.573 | 0.003 | 0.960 | 0.511 | 0.002 | 0.848 | 0.505 | 0.001 | 0.711 | 0.338 | 0.001 | 0.660 |
| FastIAMB | 0.616 | 0.003 | 0.972 | 0.575 | 0.002 | 0.888 | 0.518 | 0.002 | 0.734 | 0.327 | 0.001 | 0.677 |
| IAMB-FDR | 0.585 | 0.001 | 0.975 | 0.494 | 0.001 | 0.909 | 0.485 | 0.001 | 0.766 | 0.322 | 0.001 | 0.661 |
| PCI | 0.992 | 0.017 | 0.981 | 0.875 | 0.028 | 0.890 | 0.754 | 0.016 | 0.839 | 0.430 | 0.030 | 0.638 |
| Lasso | 0.999 | 0.074 | 0.949 | 0.944 | 0.119 | 0.817 | 0.954 | 0.147 | 0.794 | 0.681 | 0.148 | 0.488 |
| CORTH Features (Ours) | 0.999 | 0.016 | 0.986 | 0.952 | 0.044 | 0.906 | 0.884 | 0.011 | 0.894 | 0.609 | 0.101 | 0.567 |
| Nonlinear Probability | ||||||||||||
| Method | 0 | 0.3 | 0.5 | 1 | ||||||||
| ACC | CSI | F1 | ACC | CSI | F1 | ACC | CSI | F1 | ACC | CSI | F1 | |
| GES | 0.803 | 0.583 | 0.646 | 0.806 | 0.566 | 0.622 | 0.811 | 0.577 | 0.632 | 0.810 | 0.581 | 0.641 |
| rankGES | 0.796 | 0.559 | 0.625 | 0.801 | 0.546 | 0.605 | 0.805 | 0.556 | 0.613 | 0.805 | 0.561 | 0.623 |
| ARGES | 0.781 | 0.476 | 0.515 | 0.786 | 0.486 | 0.525 | 0.792 | 0.506 | 0.546 | 0.818 | 0.581 | 0.628 |
| rankARGES | 0.778 | 0.461 | 0.503 | 0.782 | 0.474 | 0.515 | 0.788 | 0.490 | 0.531 | 0.814 | 0.564 | 0.615 |
| FCI+ | 0.827 | 0.599 | 0.674 | 0.860 | 0.663 | 0.745 | 0.872 | 0.685 | 0.764 | 0.873 | 0.685 | 0.746 |
| LINGAM | 0.907 | 0.738 | 0.778 | 0.886 | 0.689 | 0.725 | 0.880 | 0.684 | 0.724 | 0.911 | 0.762 | 0.808 |
| PC | 0.818 | 0.574 | 0.641 | 0.854 | 0.641 | 0.720 | 0.864 | 0.665 | 0.7430 | 0.869 | 0.672 | 0.731 |
| rankPC | 0.813 | 0.560 | 0.630 | 0.841 | 0.614 | 0.694 | 0.848 | 0.627 | 0.704 | 0.864 | 0.656 | 0.720 |
| MMPC | 0.775 | 0.372 | 0.416 | 0.809 | 0.439 | 0.503 | 0.818 | 0.462 | 0.528 | 0.828 | 0.479 | 0.523 |
| MMHC | 0.797 | 0.516 | 0.578 | 0.815 | 0.549 | 0.610 | 0.823 | 0.566 | 0.625 | 0.826 | 0.571 | 0.620 |
| GS | 0.806 | 0.450 | 0.491 | 0.828 | 0.494 | 0.554 | 0.835 | 0.510 | 0.571 | 0.851 | 0.534 | 0.576 |
| IAMB | 0.762 | 0.389 | 0.440 | 0.799 | 0.463 | 0.538 | 0.809 | 0.488 | 0.565 | 0.830 | 0.520 | 0.576 |
| FastIAMB | 0.807 | 0.454 | 0.497 | 0.835 | 0.503 | 0.566 | 0.842 | 0.522 | 0.587 | 0.855 | 0.543 | 0.587 |
| IAMB-FDR | 0.796 | 0.418 | 0.457 | 0.818 | 0.456 | 0.511 | 0.827 | 0.481 | 0.538 | 0.853 | 0.529 | 0.578 |
| PCI | 0.853 | 0.674 | 0.720 | 0.897 | 0.746 | 0.789 | 0.905 | 0.763 | 0.806 | 0.911 | 0.774 | 0.805 |
| Lasso | 0.847 | 0.694 | 0.773 | 0.891 | 0.776 | 0.853 | 0.902 | 0.797 | 0.869 | 0.896 | 0.790 | 0.857 |
| CORTH Features (Ours) | 0.871 | 0.768 | 0.824 | 0.934 | 0.830 | 0.873 | 0.943 | 0.851 | 0.891 | 0.933 | 0.852 | 0.887 |
| Nonlinear Probability | ||||||||||||
| Method | 0 | 0.3 | 0.5 | 1 | ||||||||
| TPR | FPR | MCC | TPR | FPR | MCC | TPR | FPR | MCC | TPR | FPR | MCC | |
| GES | 0.643 | 0.093 | 0.564 | 0.620 | 0.074 | 0.557 | 0.629 | 0.071 | 0.568 | 0.637 | 0.079 | 0.570 |
| rankGES | 0.633 | 0.100 | 0.550 | 0.612 | 0.080 | 0.546 | 0.620 | 0.076 | 0.557 | 0.628 | 0.083 | 0.559 |
| ARGES | 0.514 | 0.041 | 0.789 | 0.526 | 0.041 | 0.793 | 0.547 | 0.043 | 0.791 | 0.626 | 0.055 | 0.725 |
| rankARGES | 0.509 | 0.044 | 0.780 | 0.522 | 0.044 | 0.788 | 0.540 | 0.046 | 0.783 | 0.620 | 0.059 | 0.715 |
| FCI+ | 0.638 | 0.045 | 0.637 | 0.704 | 0.037 | 0.708 | 0.728 | 0.035 | 0.731 | 0.728 | 0.037 | 0.730 |
| LINGAM | 0.775 | 0.025 | 0.832 | 0.723 | 0.028 | 0.759 | 0.722 | 0.034 | 0.741 | 0.819 | 0.053 | 0.822 |
| PC | 0.605 | 0.037 | 0.649 | 0.672 | 0.027 | 0.707 | 0.695 | 0.025 | 0.728 | 0.702 | 0.029 | 0.734 |
| rankPC | 0.597 | 0.043 | 0.626 | 0.656 | 0.040 | 0.680 | 0.668 | 0.036 | 0.695 | 0.692 | 0.031 | 0.714 |
| MMPC | 0.376 | 0.009 | 0.754 | 0.442 | 0.006 | 0.738 | 0.465 | 0.005 | 0.749 | 0.482 | 0.005 | 0.787 |
| MMHC | 0.528 | 0.017 | 0.581 | 0.561 | 0.008 | 0.623 | 0.578 | 0.007 | 0.636 | 0.582 | 0.008 | 0.639 |
| GS | 0.452 | 0.001 | 0.850 | 0.496 | 0.001 | 0.797 | 0.513 | 0.001 | 0.799 | 0.538 | 0.001 | 0.849 |
| IAMB | 0.847 | 0.003 | 0.773 | 0.891 | 0.002 | 0.853 | 0.902 | 0.001 | 0.869 | 0.896 | 0.001 | 0.857 |
| FastIAMB | 0.457 | 0.001 | 0.848 | 0.506 | 0.002 | 0.784 | 0.526 | 0.002 | 0.791 | 0.548 | 0.002 | 0.848 |
| IAMB-FDR | 0.418 | 0.001 | 0.837 | 0.457 | 0.001 | 0.819 | 0.481 | 0.001 | 0.822 | 0.530 | 0.001 | 0.833 |
| PCI | 0.712 | 0.057 | 0.792 | 0.765 | 0.011 | 0.848 | 0.781 | 0.010 | 0.845 | 0.794 | 0.013 | 0.864 |
| Lasso | 0.823 | 0.130 | 0.684 | 0.907 | 0.120 | 0.778 | 0.926 | 0.116 | 0.800 | 0.921 | 0.122 | 0.787 |
| CORTH Features (Ours) | 0.840 | 0.119 | 0.730 | 0.849 | 0.007 | 0.872 | 0.870 | 0.008 | 0.888 | 0.885 | 0.038 | 0.863 |
| Connectivity | ||||||||||||
|---|---|---|---|---|---|---|---|---|---|---|---|---|
| Method | 0.1 | 0.3 | 0.5 | |||||||||
| ACC | CSI | F1 | MCC | ACC | CSI | F1 | MCC | ACC | CSI | F1 | MCC | |
| GES | 0.961 | 0.786 | 0.825 | 0.857 | 0.815 | 0.539 | 0.598 | 0.522 | 0.646 | 0.405 | 0.482 | 0.315 |
| rankGES | 0.954 | 0.746 | 0.790 | 0.840 | 0.809 | 0.522 | 0.584 | 0.511 | 0.642 | 0.398 | 0.475 | 0.308 |
| ARGES | 0.965 | 0.794 | 0.828 | 0.876 | 0.805 | 0.456 | 0.501 | 0.726 | 0.612 | 0.286 | 0.330 | 0.720 |
| rankARGES | 0.959 | 0.763 | 0.801 | 0.863 | 0.802 | 0.447 | 0.494 | 0.721 | 0.611 | 0.282 | 0.328 | 0.716 |
| FCI+ | 0.974 | 0.819 | 0.853 | 0.910 | 0.866 | 0.631 | 0.714 | 0.674 | 0.734 | 0.524 | 0.629 | 0.521 |
| LINGAM | 0.966 | 0.763 | 0.796 | 0.889 | 0.896 | 0.710 | 0.753 | 0.761 | 0.827 | 0.682 | 0.727 | 0.715 |
| PC | 0.975 | 0.819 | 0.849 | 0.921 | 0.861 | 0.609 | 0.689 | 0.676 | 0.718 | 0.486 | 0.588 | 0.516 |
| rankPC | 0.971 | 0.797 | 0.831 | 0.912 | 0.852 | 0.587 | 0.670 | 0.653 | 0.701 | 0.458 | 0.560 | 0.470 |
| MMPC | 0.949 | 0.606 | 0.637 | 0.901 | 0.815 | 0.390 | 0.451 | 0.722 | 0.658 | 0.318 | 0.389 | 0.648 |
| MMHC | 0.978 | 0.834 | 0.867 | 0.901 | 0.830 | 0.497 | 0.561 | 0.574 | 0.639 | 0.321 | 0.397 | 0.385 |
| GS | 0.954 | 0.644 | 0.669 | 0.935 | 0.843 | 0.467 | 0.524 | 0.815 | 0.693 | 0.380 | 0.451 | 0.722 |
| IAMB | 0.969 | 0.692 | 0.745 | 0.864 | 0.841 | 0.463 | 0.522 | 0.807 | 0.692 | 0.377 | 0.452 | 0.709 |
| FastIAMB | 0.955 | 0.650 | 0.676 | 0.931 | 0.845 | 0.474 | 0.535 | 0.804 | 0.705 | 0.392 | 0.467 | 0.718 |
| IAMB-FDR | 0.950 | 0.608 | 0.626 | 0.961 | 0.832 | 0.436 | 0.492 | 0.816 | 0.689 | 0.369 | 0.446 | 0.707 |
| PCI | 0.986 | 0.902 | 0.920 | 0.954 | 0.906 | 0.716 | 0.759 | 0.838 | 0.783 | 0.600 | 0.661 | 0.720 |
| Lasso | 0.976 | 0.886 | 0.925 | 0.926 | 0.876 | 0.725 | 0.811 | 0.737 | 0.800 | 0.682 | 0.778 | 0.622 |
| CORTH Features (Ours) | 0.988 | 0.915 | 0.934 | 0.959 | 0.926 | 0.813 | 0.858 | 0.833 | 0.847 | 0.747 | 0.814 | 0.724 |
| Noise Level | ||||||||||||
| Method | 0.01 | 0.5 | 1 | |||||||||
| ACC | CSI | F1 | MCC | ACC | CSI | F1 | MCC | ACC | CSI | F1 | MCC | |
| GES | 0.804 | 0.579 | 0.639 | 0.559 | 0.808 | 0.571 | 0.629 | 0.562 | 0.818 | 0.586 | 0.644 | 0.589 |
| rankGES | 0.797 | 0.557 | 0.619 | 0.548 | 0.802 | 0.552 | 0.613 | 0.551 | 0.812 | 0.565 | 0.625 | 0.577 |
| ARGES | 0.810 | 0.572 | 0.625 | 0.653 | 0.789 | 0.496 | 0.534 | 0.814 | 0.774 | 0.434 | 0.460 | 0.897 |
| rankARGES | 0.804 | 0.549 | 0.605 | 0.643 | 0.786 | 0.483 | 0.523 | 0.806 | 0.774 | 0.433 | 0.459 | 0.895 |
| FCI+ | 0.843 | 0.617 | 0.691 | 0.674 | 0.865 | 0.678 | 0.753 | 0.717 | 0.874 | 0.697 | 0.766 | 0.740 |
| LINGAM | 0.888 | 0.703 | 0.744 | 0.763 | 0.899 | 0.723 | 0.763 | 0.797 | 0.903 | 0.732 | 0.773 | 0.803 |
| PC | 0.837 | 0.595 | 0.664 | 0.683 | 0.859 | 0.659 | 0.731 | 0.716 | 0.870 | 0.686 | 0.752 | 0.745 |
| rankPC | 0.831 | 0.584 | 0.657 | 0.653 | 0.845 | 0.626 | 0.699 | 0.688 | 0.856 | 0.655 | 0.724 | 0.714 |
| MMPC | 0.796 | 0.405 | 0.456 | 0.762 | 0.812 | 0.453 | 0.510 | 0.756 | 0.825 | 0.480 | 0.533 | 0.780 |
| MMHC | 0.806 | 0.526 | 0.585 | 0.605 | 0.818 | 0.557 | 0.615 | 0.626 | 0.829 | 0.586 | 0.639 | 0.652 |
| GS | 0.820 | 0.468 | 0.518 | 0.824 | 0.836 | 0.513 | 0.566 | 0.819 | 0.846 | 0.538 | 0.586 | 0.833 |
| IAMB | 0.784 | 0.421 | 0.483 | 0.779 | 0.807 | 0.485 | 0.552 | 0.769 | 0.823 | 0.523 | 0.586 | 0.790 |
| FasIAMB | 0.821 | 0.469 | 0.520 | 0.819 | 0.842 | 0.526 | 0.582 | 0.814 | 0.852 | 0.548 | 0.600 | 0.828 |
| IAMB-FDR | 0.810 | 0.432 | 0.478 | 0.834 | 0.831 | 0.492 | 0.545 | 0.825 | 0.841 | 0.514 | 0.563 | 0.841 |
| PCI | 0.873 | 0.690 | 0.730 | 0.819 | 0.901 | 0.760 | 0.801 | 0.846 | 0.906 | 0.777 | 0.815 | 0.854 |
| Lasso | 0.868 | 0.728 | 0.807 | 0.725 | 0.891 | 0.780 | 0.852 | 0.779 | 0.898 | 0.794 | 0.861 | 0.793 |
| CORTH Features (Ours) | 0.899 | 0.789 | 0.839 | 0.795 | 0.929 | 0.842 | 0.883 | 0.858 | 0.934 | 0.854 | 0.891 | 0.866 |
| Number of Observations | ||||||||||||
|---|---|---|---|---|---|---|---|---|---|---|---|---|
| Method | 100 | 500 | 1000 | |||||||||
| ACC | CSI | F1 | MCC | ACC | CSI | F1 | MCC | ACC | CSI | F1 | MCC | |
| GES | 0.797 | 0.524 | 0.588 | 0.539 | 0.811 | 0.593 | 0.650 | 0.572 | 0.815 | 0.612 | 0.666 | 0.583 |
| rankGES | 0.788 | 0.495 | 0.561 | 0.522 | 0.806 | 0.576 | 0.636 | 0.564 | 0.810 | 0.595 | 0.652 | 0.573 |
| ARGES | 0.780 | 0.446 | 0.489 | 0.786 | 0.799 | 0.535 | 0.576 | 0.773 | 0.803 | 0.555 | 0.595 | 0.764 |
| rankARGES | 0.776 | 0.428 | 0.473 | 0.778 | 0.795 | 0.523 | 0.566 | 0.766 | 0.800 | 0.542 | 0.584 | 0.757 |
| FCI+ | 0.837 | 0.589 | 0.671 | 0.652 | 0.865 | 0.684 | 0.755 | 0.720 | 0.871 | 0.702 | 0.771 | 0.732 |
| LINGAM | 0.840 | 0.578 | 0.650 | 0.678 | 0.908 | 0.719 | 0.743 | 0.825 | 0.941 | 0.858 | 0.883 | 0.862 |
| PC | 0.830 | 0.568 | 0.642 | 0.661 | 0.858 | 0.662 | 0.732 | 0.719 | 0.866 | 0.684 | 0.752 | 0.733 |
| rankPC | 0.821 | 0.544 | 0.617 | 0.632 | 0.849 | 0.639 | 0.711 | 0.696 | 0.855 | 0.660 | 0.733 | 0.707 |
| MMPC | 0.771 | 0.323 | 0.368 | 0.787 | 0.819 | 0.476 | 0.534 | 0.739 | 0.832 | 0.515 | 0.575 | 0.745 |
| MMHC | 0.800 | 0.495 | 0.557 | 0.579 | 0.820 | 0.570 | 0.625 | 0.633 | 0.826 | 0.587 | 0.642 | 0.647 |
| GS | 0.793 | 0.375 | 0.427 | 0.785 | 0.842 | 0.540 | 0.592 | 0.834 | 0.856 | 0.577 | 0.625 | 0.852 |
| IAMB | 0.745 | 0.316 | 0.390 | 0.705 | 0.815 | 0.510 | 0.574 | 0.794 | 0.835 | 0.556 | 0.614 | 0.821 |
| FastIAMB | 0.803 | 0.401 | 0.461 | 0.770 | 0.844 | 0.541 | 0.593 | 0.833 | 0.857 | 0.574 | 0.623 | 0.850 |
| IAMB-FDR | 0.783 | 0.325 | 0.372 | 0.825 | 0.837 | 0.523 | 0.578 | 0.815 | 0.850 | 0.564 | 0.613 | 0.843 |
| PCI | 0.829 | 0.551 | 0.594 | 0.804 | 0.914 | 0.812 | 0.853 | 0.842 | 0.931 | 0.855 | 0.893 | 0.866 |
| Lasso | 0.870 | 0.729 | 0.812 | 0.732 | 0.889 | 0.778 | 0.848 | 0.773 | 0.893 | 0.786 | 0.854 | 0.780 |
| CORTH Features (Ours) | 0.883 | 0.710 | 0.780 | 0.754 | 0.935 | 0.874 | 0.906 | 0.874 | 0.942 | 0.891 | 0.920 | 0.887 |
C.3.2 Compared to Inference for Regression Methods
In this part, the superiority of our method in comparison to decent Inference for Regression methods, in different settings of connectivity (Table C.10), beta distribution parameters (Table C.11), number of observations (Table C.9), and nonlinearity (Table C.8) is provided.
| Nonlinear Probability | ||||||||||||
|---|---|---|---|---|---|---|---|---|---|---|---|---|
| Method | 0 | 0.3 | 0.5 | 1 | ||||||||
| TPR | CSI | F1 | TPR | CSI | F1 | TPR | CSI | F1 | TPR | CSI | F1 | |
| Standard Regression | 0.149 | 0.103 | 0.139 | 0.166 | 0.112 | 0.141 | 0.175 | 0.108 | 0.136 | 1.000 | 0.801 | 0.801 |
| Lasso | 0.237 | 0.116 | 0.176 | 0.285 | 0.126 | 0.202 | 0.360 | 0.165 | 0.263 | 1.000 | 0.046 | 0.046 |
| Debiased Lasso | 0.238 | 0.117 | 0.178 | 0.267 | 0.112 | 0.178 | 0.300 | 0.124 | 0.202 | 1.000 | 0.050 | 0.050 |
| Forward Stepwise Reg_active | 0.174 | 0.112 | 0.162 | 0.157 | 0.110 | 0.167 | 0.194 | 0.129 | 0.190 | 1.000 | 0.329 | 0.329 |
| Forward Stepwise Reg_all | 0.04 | 0.039 | 0.060 | 0.062 | 0.059 | 0.085 | 0.089 | 0.086 | 0.116 | 1.000 | 0.861 | 0.861 |
| LARS_active | 0.073 | 0.054 | 0.094 | 0.104 | 0.078 | 0.131 | 0.118 | 0.081 | 0.134 | 1.000 | 0.382 | 0.382 |
| LARS_all | 0.017 | 0.016 | 0.028 | 0.030 | 0.029 | 0.048 | 0.039 | 0.037 | 0.057 | 1.000 | 0.866 | 0.866 |
| CORTH Features (Ours) | 0.481 | 0.287 | 0.407 | 0.436 | 0.258 | 0.366 | 0.364 | 0.220 | 0.313 | 1.000 | 0.610 | 0.610 |
| Number of Observations | ||||||||||
|---|---|---|---|---|---|---|---|---|---|---|
| Method | 10 | 20 | 50 | 100 | 200 | |||||
| CSI | F1 | CSI | F1 | CSI | F1 | CSI | F1 | CSI | F1 | |
| Standard Regression | 0.250 | 0.250 | 0.250 | 0.250 | 0.250 | 0.250 | 0.263 | 0.272 | 0.392 | 0.499 |
| Lasso | 0.075 | 0.117 | 0.100 | 0.155 | 0.127 | 0.192 | 0.131 | 0.196 | 0.132 | 0.198 |
| Debiased Lasso | 0.066 | 0.102 | 0.086 | 0.134 | 0.115 | 0.173 | 0.122 | 0.179 | 0.114 | 0.171 |
| Forward Stepwise Reg_active | 0.193 | 0.199 | 0.161 | 0.177 | 0.103 | 0.134 | 0.071 | 0.111 | 0.322 | 0.439 |
| Forward Stepwise Reg_all | 0.222 | 0.224 | 0.222 | 0.226 | 0.229 | 0.236 | 0.244 | 0.257 | 0.389 | 0.458 |
| LARS_active | 0.193 | 0.200 | 0.171 | 0.191 | 0.143 | 0.177 | 0.090 | 0.128 | 0.160 | 0.242 |
| LARS_all | 0.218 | 0.222 | 0.217 | 0.221 | 0.226 | 0.231 | 0.230 | 0.235 | 0.293 | 0.342 |
| CORTH Features (Ours) | 0.125 | 0.173 | 0.250 | 0.314 | 0.353 | 0.445 | 0.443 | 0.548 | 0.550 | 0.640 |
| Connectivity | |||||||||
| Method | 0.1 | 0.3 | 0.5 | ||||||
| TPR | CSI | F1 | TPR | CSI | F1 | TPR | CSI | F1 | |
| Standard Regression | 0.395 | 0.267 | 0.290 | 0.372 | 0.292 | 0.313 | 0.350 | 0.284 | 0.310 |
| Lasso | 0.789 | 0.211 | 0.314 | 0.353 | 0.094 | 0.150 | 0.269 | 0.035 | 0.052 |
| Debiased Lasso | 0.787 | 0.211 | 0.314 | 0.296 | 0.054 | 0.087 | 0.270 | 0.037 | 0.055 |
| Forward Stepwise Reg_active | 0.437 | 0.182 | 0.231 | 0.352 | 0.156 | 0.198 | 0.355 | 0.171 | 0.208 |
| Forward Stepwise Reg_all | 0.356 | 0.315 | 0.343 | 0.275 | 0.235 | 0.252 | 0.263 | 0.234 | 0.245 |
| LARS_active | 0.360 | 0.149 | 0.192 | 0.312 | 0.145 | 0.183 | 0.340 | 0.169 | 0.196 |
| LARS_all | 0.289 | 0.246 | 0.264 | 0.267 | 0.233 | 0.246 | 0.259 | 0.231 | 0.239 |
| CORTH Features (Ours) | 0.494 | 0.367 | 0.417 | 0.540 | 0.274 | 0.355 | 0.677 | 0.390 | 0.499 |
| Beta Distribution Parameters | ||||||||||
| Method | (0.5, 0.5) | (1, 3) | (2, 2) | (2, 5) | (5, 1) | |||||
| CSI | F1 | CSI | F1 | CSI | F1 | CSI | F1 | CSI | F1 | |
| Standard Regression | 0.282 | 0.305 | 0.280 | 0.304 | 0.280 | 0.303 | 0.280 | 0.303 | 0.283 | 0.306 |
| Lasso | 0.109 | 0.168 | 0.106 | 0.164 | 0.116 | 0.174 | 0.105 | 0.163 | 0.129 | 0.189 |
| Debiased Lasso | 0.096 | 0.148 | 0.092 | 0.143 | 0.101 | 0.152 | 0.093 | 0.144 | 0.120 | 0.173 |
| Forward Stepwise Reg_active | 0.169 | 0.211 | 0.168 | 0.210 | 0.169 | 0.211 | 0.172 | 0.214 | 0.172 | 0.215 |
| Forward Stepwise Reg_all | 0.261 | 0.279 | 0.257 | 0.275 | 0.265 | 0.284 | 0.259 | 0.278 | 0.266 | 0.284 |
| LARS_active | 0.161 | 0.198 | 0.150 | 0.184 | 0.146 | 0.182 | 0.155 | 0.191 | 0.157 | 0.193 |
| LARS_all | 0.235 | 0.248 | 0.236 | 0.249 | 0.241 | 0.254 | 0.238 | 0.251 | 0.234 | 0.247 |
| CORTH Features (Ours) | 0.336 | 0.417 | 0.330 | 0.411 | 0.354 | 0.434 | 0.336 | 0.417 | 0.363 | 0.441 |
Appendix D Real-World Data Experiment-Covid19
D.1 Preprocessing
The preprocessing stage for this dataset is the same as (Schwab et al., 2020) except that, for each target variable upsampling is used to resolve data imbalance.
D.2 Results
The results obtained by leveraging CORTH Features is suprisingly consistent with (Schwab et al., 2020) which demonstrates the ability of this method in feature selection. The selected features are indicated in Tables D.2, D.2, D.4 and D.4
| Rank | Feature | Rate of being Predicted as a Direct Cause |
|---|---|---|
| 1 | Patient age quantile | 1 |
| Arterial Lactic Acid | ||
| Promyelocytes | ||
| Base excess venous blood gas analysis | ||
| 5 | pH venous blood gas analysis | 0.999 |
| 6 | MISSING Mean platelet volume | 0.992 |
| 7 | MISSING Lactic Dehydrogenase | 0.966 |
| 8 | Segmented | 0.934 |
| 9 | Myelocytes | 0.904 |
| 10 | Eosinophils | 0.794 |
| 11 | Leukocytes | 0.784 |
| 12 | Total CO2 arterial blood gas analysis | 0.450 |
| 13 | Potassium | 0.340 |
| 14 | MISSING International normalized ratio INR | 0.289 |
| 15 | Metapneumovirus not detected | 0.234 |
| 16 | Arteiral Fio2 | 0.092 |
| 17 | HCO3 arterial blood gas analysis. | 0.046 |
| 18 | Creatinine | 0.035 |
| 19 | MISSING.Magnesium | 0.034 |
| 20 | pO2 arterial blood gas analysis | 0.031 |
| 21 | MISSING Arteiral Fio2 | 0.024 |
| 22 | Direct Bilirubin | 0.016 |
| 23 | MISSING Ferritin | 0.014 |
| Respiratory Syncytial Virus detected | ||
| 25 | MISSING Albumin | 0.010 |
| Creatine phosphokinase CPK | ||
| 27 | Strepto A positive | 0.008 |
| 28 | Neutrophils | 0.004 |
| Red blood cell distribution width RDW | ||
| Coronavirus HKU1 detected | ||
| Influenza A rapid test positive | ||
| 32 | Hb saturation venous blood gas analysis | 0.002 |
| 33 | Urine pH | 0.001 |
| Inf A H1N1 2009 detected | ||
| MISSING Serum Glucose | ||
| Aspartate transaminase | ||
| Urine Esterase nan |
| Rank | Feature | Rate of being Predicted as a Direct Cause |
|---|---|---|
| 1 | Patient age quantile | 1 |
| HCO3 venous blood gas analysis | ||
| Total CO2 venous blood gas analysis | ||
| Gamma glutamyltransferase | ||
| 5 | MISSING Lactic Dehydrogenase | 0.987 |
| 6 | Alanine transaminase | 0.845 |
| 7 | MISSING International normalized ratio INR | 0.804 |
| 8 | Serum Glucose | 0.652 |
| 9 | pH venous blood gas analysis | 0.631 |
| 10 | Base.excess venous blood gas analysis | 0.341 |
| 11 | MISSING Arteiral Fio2 | 0.334 |
| 12 | Urine Density | 0.334 |
| 13 | Magnesium | 0.323 |
| 14 | Metapneumovirus not detected | 0.261 |
| 15 | MISSING Mean platelet volume | 0.118 |
| 16 | Creatine phosphokinase CPK | 0.086 |
| 17 | Creatinine | 0.058 |
| 18 | International normalized ratio INR | 0.049 |
| 19 | MISSING Ferritin | 0.046 |
| 20 | Urea | 0.044 |
| 21 | Respiratory Syncytial Virus detected | 0.032 |
| 22 | MISSING Magnesium | 0.021 |
| 23 | MISSING Albumin | 0.018 |
| 24 | MISSING Potassium | 0.016 |
| 25 | Inf A H1N1 2009 detected | 0.014 |
| 26 | Coronavirus HKU1 detected | 0.010 |
| 27 | Strepto A positive | 0.008 |
| 28 | Influenza A rapid test positive | 0.007 |
| 29 | MISSING Sodium | 0.002 |
| Urine Protein nan | ||
| 31 | ctO2 arterial blood gas analysis | 0.001 |
| Influenza A detected | ||
| Influenza B detected |
| Rank | Feature | Rate of being Predicted as a Direct Cause |
|---|---|---|
| 1 | Patient age quantile | 1 |
| Creatinine | ||
| MISSING Lactic Dehydrogenase | ||
| Total CO2 venous blood gas analysis | ||
| Magnesium | ||
| Gamma glutamyltransferase | ||
| Alanine transaminase | ||
| 8 | ctO2 arterial blood gas analysis | 0.999 |
| HCO3 venous blood gas analysis | ||
| 10 | Relationship Patient Normal | 0.786 |
| 11 | MISSING Arteiral Fio2 | 0.595 |
| 12 | Base excess venous blood gas analysis | 0.578 |
| 13 | pO2 venous blood gas analysis | 0.449 |
| 14 | MISSING International normalized ratio INR | 0.435 |
| 15 | Mean platelet volume | 0.366 |
| 16 | Metapneumovirus not detected | 0.308 |
| 17 | Proteina C reativa mg dL | 0.235 |
| 18 | Sodium | 0.212 |
| 19 | Phosphor | 0.164 |
| 20 | Urine Density | 0.085 |
| 21 | Respiratory Syncytial Virus detected | 0.068 |
| 22 | MISSING Mean platelet volume | 0.056 |
| 23 | MISSING Ferritin | 0.054 |
| 24 | pH venous blood gas analysis | 0.021 |
| 25 | Strepto A positive | 0.018 |
| 26 | Inf A H1N1 2009 detected | 0.016 |
| 27 | Influenza A rapid test positive | 0.014 |
| 28 | MISSING Albumin | 0.012 |
| Coronavirus HKU1 detected | ||
| 30 | MISSING Magnesium | 0.008 |
| 31 | Aspartate transaminase | 0.004 |
| 32 | Urine Ketone Bodies absent | 0.001 |
| Red blood cell distribution width RDW | ||
| Influenza A detected | ||
| Urine Esterase absent | ||
| Urine Protein nan |
| Rank | Feature | Rate of being Predicted as a Direct Cause |
|---|---|---|
| 1 | Patient age quantile | 1 |
| MISSING Mean platelet volume | ||
| Total CO2 venous blood gas analysis | ||
| HCO3 venous blood gas analysis | ||
| Alanine transaminase | ||
| Gamma glutamyltransferase | ||
| Magnesium | ||
| MISSING Lactic Dehydrogenase | ||
| Creatinine | ||
| 10 | pO2 venous blood gas analysis | 0.982 |
| 11 | ctO2 arterial blood gas analysis | 0.962 |
| 12 | pH venous blood gas analysis | 0.938 |
| 13 | MISSING Arteiral Fio2 | 0.667 |
| 14 | MISSING International normalized ratio INR | 0.586 |
| 15 | Red blood cell distribution width RDW | 0.503 |
| 16 | Urine Density | 0.414 |
| 17 | Creatine phosphokinase CPK | 0.380 |
| 18 | Base excess venous blood gas analysis | 0.352 |
| 19 | Potassium | 0.234 |
| 20 | Promyelocytes | 0.221 |
| 21 | MISSING Ferritin | 0.174 |
| 22 | Metapneumovirus not detected | 0.132 |
| 23 | Phosphor | 0.082 |
| 24 | Sodium | 0.036 |
| 25 | MISSING Magnesium | 0.032 |
| 26 | Proteina C reativa mg dL | 0.016 |
| 27 | Aspartate transaminase | 0.015 |
| 28 | Respiratory Syncytial Virus detected | 0.010 |
| 29 | Relationship Patient Normal | 0.007 |
| 30 | MISSING Albumin | 0.006 |
| Arterial Lactic Acid | ||
| 32 | Coronavirus HKU1 detected | 0.005 |
| Eosinophils | ||
| 34 | Inf A H1N1 2009 detected | 0.004 |
| 35 | Influenza A rapid test positive | 0.002 |
| International normalized ratio INR | ||
| 37 | Urine Crystals Ausentes | 0.001 |
| Leukocytes | ||
| Strepto A positive |