11email: itraulsen@aip.de 22institutetext: AIM, CEA, CNRS, Université Paris-Saclay, Université Paris Diderot, Sorbonne Paris Cité, 91191 Gif-sur-Yvette, France 33institutetext: Instituto de Física de Cantabria (CSIC-UC), Avenida de los Castros, 39005 Santander, Spain 44institutetext: IRAP, Université de Toulouse, CNRS, UPS, CNES, 9 Avenue du Colonel Roche, BP 44346, 31028 Toulouse Cedex 4, France 55institutetext: Max-Planck-Institut für extraterrestrische Physik, Giessenbachstraße 1, 85748 Garching, Germany 66institutetext: Observatoire astronomique, Université de Strasbourg, CNRS, UMR 7550, 11 rue de l’Université, 67000 Strasbourg, France 77institutetext: Mullard Space Science Laboratory, University College London, Holbury St Mary, Dorking, Surrey RH5 6NT, UK 88institutetext: Department of Physics & Astronomy, University of Leicester, Leicester, LE1 7RH, UK
The XMM-Newton serendipitous survey
Abstract
Context. The XMM-Newton Survey Science Centre Consortium (SSC) develops software in close collaboration with the Science Operations Centre to perform a pipeline analysis of all XMM-Newton observations. In celebration of the twentieth anniversary of the XMM-Newton launch, the SSC has compiled the fourth generation of serendipitous source catalogues, 4XMM.
Aims. The catalogue described here, 4XMM-DR9s, explores sky areas that were observed more than once by XMM-Newton. These observations are bundled in groups referred to as stacks. Stacking leads to a higher sensitivity, resulting in newly discovered sources and better constrained source parameters, and unveils long-term brightness variations.
Methods. The 4XMM-DR9s catalogue was constructed from simultaneous source detection on overlapping observations. As a novel feature, positional rectification was applied beforehand. Observations with all filters and suitable camera settings were included. Exposures with a high background were discarded. The high-background thresholds were determined through a statistical analysis of all exposures in each instrument configuration. The X-ray background maps used in source detection were modelled via an adaptive smoothing procedure with newly determined parameters. Source fluxes were derived for all contributing observations, irrespective of whether the source would be detectable in an individual observation.
Results. The new catalogue lists the X-ray sources detected in 1 329 stacks with 6 604 contributing observations over repeatedly covered 300 square degrees in the sky. Most stacks are composed of two observations, the largest one comprises 352 observations. We find 288 191 sources of which 218 283 were observed several times. The number of observations of a source ranges from 1 to 40. Auxiliary products, like X-ray full-band and false-colour images, long-term X-ray light curves, and optical finding charts, are published as well.
Conclusions. 4XMM-DR9s contains new detections and is considered a prime resource to explore long-term variability of X-ray sources discovered by XMM-Newton. Regular incremental releases, including new public observations, are planned.
Key Words.:
catalogs – astronomical databases: miscellaneous – surveys – X-rays: general1 Introduction
Since its launch in December 1999, ESA’s space-based X-ray telescope XMM-Newton (Jansen et al. 2001) has observed about 1 150 square degrees of the sky in pointed and mosaic mode, and about a third of that area several times. From all public X-ray data taken with its EPIC111European Photon Imaging Camera CCD instruments MOS1, MOS2 (Turner et al. 2001), and pn (Strüder et al. 2001), the XMM-Newton Survey Science Centre Consortium (SSC, Watson et al. 2001) compiles the serendipitous source catalogues. Their third generation named 3XMM (Rosen et al. 2016) was augmented by the first source catalogue from overlapping observations, 3XMM-DR7s (Traulsen et al. 2019). Other major source catalogues based on XMM-Newton observations include the XMM-Newton Slew Survey Source Catalogue (Saxton et al. 2008) of X-ray sources observed by EPIC pn during telescope slews with its latest edition XMMSL2222https://www.cosmos.esa.int/web/xmm-newton/xmmsl2-ug and the OM Serendipitous Ultraviolet Source Survey Catalogue (Page et al. 2012) of sources observed by the Optical Monitor (Mason et al. 2001) with its latest edition SUSS4.1333https://www.cosmos.esa.int/web/xmm-newton/om-catalogue.
After upgrades to the catalogue pipelines and the underlying SAS444XMM-Newton Science Analysis System, https://www.cosmos.esa.int/web/xmm-newton/sas. tasks, all XMM-Newton EPIC data were fully re-processed555The pipeline version ppsprod-18.0 incorporates tasks from SAS 18.0.0. by the XMM-Newton Science Operations Centre (SOC) at the European Space Astronomy Centre (ESAC). Based on these data, the SSC compiled the fourth generation of serendipitous source catalogues. The new 4XMM-DR9 catalogue from all individual observations is described by Webb et al. (2020) and the second catalogue from overlapping observations, named 4XMM-DR9s, is explored in this work. To produce 4XMM-DR9s, observations that overlap by at least 1′ in radius are grouped into stacks and processed together. Source detection is performed simultaneously in all images of all observations in a stack. The number of input images for a detection run is thus given by the total number of exposures666The term ‘observation’ is used for a full XMM-Newton pointing and all its data products. It comprises one or more ‘exposure(s)’. An exposure is taken by one of the EPIC instruments pn, MOS1, MOS2. for this stack times the number of energy bands (which is five in the serendipitous source catalogues).
This paper on the second catalogue from overlapping XMM-Newton observations describes the updates with respect to Traulsen et al. (2019) to the underlying software and the respective processing parameters in Section 2. In particular, an astrometric field rectification prior to stacked source detection is new to this catalogue and introduced in Section 2.3. Updates to the field selection and the catalogue processing are described in Section 3. Section 4 is dedicated to the structure of 4XMM-DR9s, the revised and newly introduced columns, and the cross-match with 4XMM-DR9. Positional accuracy, source content and information in comparison to 4XMM-DR9, and long-term variability of catalogue sources are studied in Section 5. Section 6 summarises the results.
2 Updates to data processing and source detection
The data processing for 4XMM-DR9s was based on the event lists and attitude files produced for 4XMM-DR9 and essentially followed the strategy of Traulsen et al. (2019). Mosaic-mode observations, which consist of a series of exposures, were split into several observation identifiers by the pipeline, creating one for each sub-pointing (cf. Rosen et al. 2016). They were thus treated like independently overlapping observations by stacked source detection. The data of each stack were projected tangentially onto the same reference coordinates with respect to the centre of the full area covered by all observations in the stack. The centre was calculated from the attitude coordinates of the contributing observations as the mean of minimum and maximum right ascension and declination. Input products for source detection were created for each observation, consisting of images, background maps, exposure maps, and detection masks.
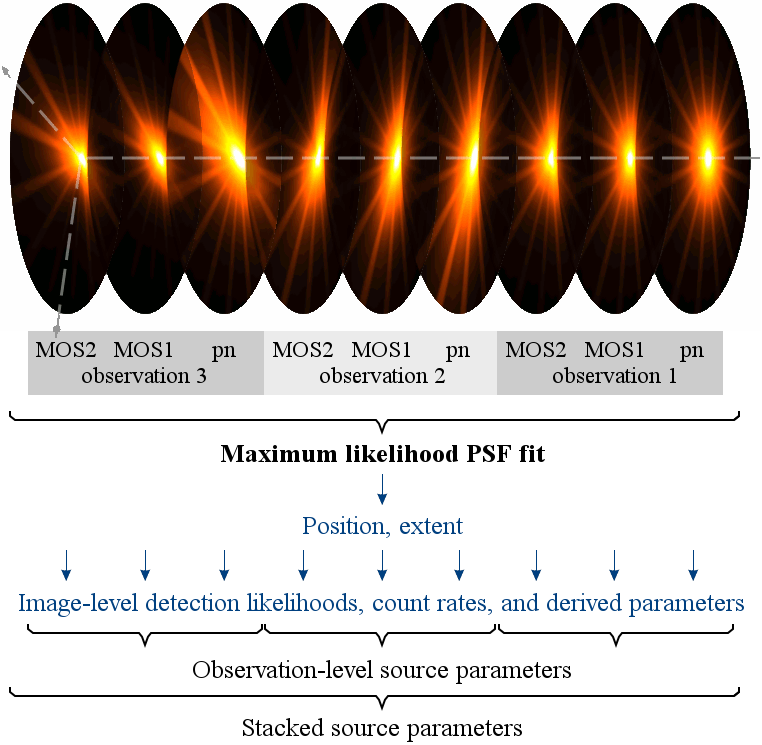
The source-detection method was described in detail by Traulsen et al. (2019). Images, exposure and background maps were created for each exposure and energy band, and detection masks were created for each exposure. They were used in the two-step source detection process, which was simultaneously run on all images in the stack. Sliding-box source detection was performed to create an input list of tentative source positions for the main step, a maximum-likelihood PSF fit in all images of the contributing observations, instruments, and energy bands. Using the three EPIC CCD instruments pn, MOS1, MOS2, and the five XMM-Newton standard energy bands777Band 1: keV, band 2: keV, band 3: keV, band 4: keV, band 5: keV, full band: keV., the fit thus involved five, ten, or fifteen images for each observation. The point-spread functions (PSFs) at the tentative source position and mid-band energy were read (cf. sketch in Fig. 1), taking the different PSF shapes and distortions in the individual contributing images into account. The 2d model of the point-spread functions was derived by Read et al. (2011) and involves a Gaussian core, a King component, and the primary and secondary spokes that arise from the mirror structure and scattering. In the simultaneous maximum-likelihood PSF fit, the count rate in each image and a common source position and source extent were determined. Position and extent were considered to be the same in all images since they are not expected to vary between observations, while the count rate and all derived parameters were determined in each image individually. A detection likelihood was calculated from the count rate under the PSF using Cash statistics (Cash 1979) and the null hypothesis that the measured signal arises from pure background fluctuations. Source extent was tested by convolving the point-like PSF with a beta model, whose radius was a free parameter of the fit. A minimum extent radius of 6″ and a log-likelihood difference of at least four between the fits with the extended and the point-like PSF were required to accept the extended fit. Otherwise, the source was considered point-like. All source parameters, in particular the detection likelihood, were derived from the combined fit. The fit results of all images were used to calculate the all-stack source parameters. Observation-level parameters were calculated from the same fit results by using the subset of the images of each observation separately (Fig. 1). Comprehensive parameter lists are given in the Appendix of Traulsen et al. (2019) and of this paper. Its structure is also shown in Fig. 22. The catalogue includes sources which have a detection likelihood of at least six in the total stack or in a contributing observation. The likelihood threshold of six is used in all XMM-Newton serendipitous source catalogues.
2.1 Task updates
Several source-detection SAS tasks have been revised since publication of the first catalogue 3XMM-DR7s, in particular esplinemap888The task is still named after its initial functionality, but used in its new smoothing mode (Traulsen et al. 2019). producing the background maps, eboxdetect for the first sliding-box detection step, emldetect performing the maximum-likelihood source detection, and srcmatch, which was used to create merged 4XMM-DR9s input source lists and the final 4XMM-DR9 source lists. The most relevant changes are described in this Section. More details on all updates are included in the task history of the SAS packages, which is for example part of the SAS release notes999https://www.cosmos.esa.int/web/xmm-newton/sas-release-notes/.
For all 4XMM catalogues (DR9 and DR9s), a pile-up estimate has been introduced (Webb et al. 2020). It is calculated for each detection and EPIC instrument within emldetect. Also, emldetect gives the extent likelihood now for all sources, including those fitted with a point-like PSF (cf. Sect. 4.4 and Webb et al. 2020).
To handle large stacks, runtime and memory requirements of several tasks were reduced, in particular for esplinemap and emldetect. Runtime is crucial for very deep stacks with many directly overlapping observations. Memory is crucial for very extended stacks containing observations that cover several square degrees on the sky in total. Depending on the depth and size of the stack, emldetect for example consumes up to 30 % less memory after the revision and becomes faster by 20 % to 90 %. These enhancements and new functionalities become public with the release of SAS 19.
In addition, SSC-internal versions of eboxdetect, emldetect, and srcmatch were established which can process large stacks of up to 400 observations. They are automatically chosen by the catalogue pipeline whenever necessary. These updates and the pipeline are not part of the public SAS releases, since compiler options deviating from SAS standards are used to produce them and hardware beyond standard PCs is required to run them.
2.2 Background modelling: new default parameters for all 4XMM catalogues
To determine the background at the tentative source positions during source detection, a background map was created for each input image and the modelled signal of out-of-time events added to the EPIC-pn maps101010https://xmm-tools.cosmos.esa.int/external/sas/current/doc/esplinemap. The background structure was modelled based on the source-free image regions. For catalogues prior to 3XMM-DR7s, it was approximated with a spline fit. Traulsen et al. (2019) employed an adaptive smoothing technique for the first catalogue from overlapping observations, which was created from good-quality data. The exposure-normalised images were convolved with a Gaussian kernel and divided by the detection masks which were smoothed using the same kernel. For increasing kernel widths, the signal-to-noise ratio in each pixel was derived from the counts under the kernel. The background value for which the intended signal-to-noise was reached was written to the background map. Parameters of the adaptive smoothing method are the signal-to-noise value, the minimum kernel width, and the brightness threshold above which sources are excised from the input image. This approach has now been used for all 4XMM catalogues consistently. To work with single and stacked observations of very different background levels, the smoothing parameters were re-investigated as described in Webb et al. (2020). A brightness threshold for the source cut-out radius of , a minimum smoothing radius of 10 pixels (40″ in default image binning), and a signal-to-noise ratio of 12 were established for 4XMM-DR9 and for 4XMM-DR9s.
2.3 Event-based astrometric correction

As described in Rosen et al. (2016), celestial coordinates of sources emerging from the PSF fitting step of a given observation include a generally small systematic error arising from offsets in the spacecraft boresight position from the nominal pointing direction for the observation. Such systematics were removed from source lists of individual observations by applying the SAS task catcorr which reveals shifts in RA and DEC and a field rotation angle via probabilistic matching of X-ray sources with sources listed in SDSS (Ahn et al. 2012), USNO-B1.0 (Monet et al. 2003), or 2MASS (Skrutskie et al. 2006). The procedure for 4XMM-DR9 is described in Webb et al. (2020).
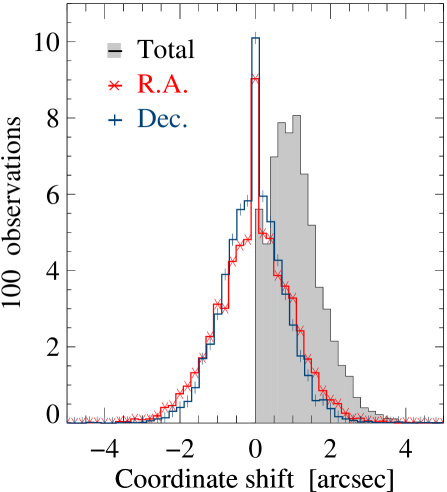
When several overlapping observations are to be processed, such corrections can only be applied before simultaneous source detection and not at the end of the processing, because individual OBS_IDs have their own catcorr corrections. We therefore introduced an event-based astrometric field rectification during pre-processing, shifting the recorded events to corrected positions. The catcorr results per observation, derived within the 4XMM-DR9 processing, were directly applied to the relevant header keywords of the attitude files and to the attitude coordinates, which were later used to project the event lists onto the common coordinate system of the stack. Stacked source detection was then performed on the individually modified event lists. The distribution of the shifts applied to the 4XMM-DR9s input observations is shown in Fig. 2. The plots include the results from 2 516 fields that were corrected against SDSS positions, 2 267 fields against USNO-B1.0 positions, and 842 against 2MASS positions. The astrometric accuracy of all three comparison catalogues is of the order of 0.1″ to 0.2″. For 4XMM-DR9 observations that could not be corrected, a mean systematic astrometric uncertainty of about 1.3″ remains (Webb et al. 2020).
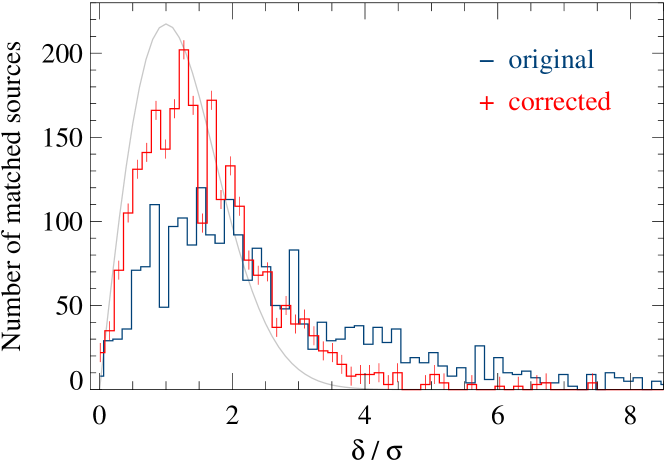
Before compiling the full 4XMM-DR9s, we verified the approach on a test sample of 25 stacks with large catcorr shifts. They comprised two to six observations with total offsets of up to 3.8″. Figure 3 shows the differences between X-ray and optical SDSS positions in the test sample with and without positional rectification (matching radius 3″). The success of the chosen approach becomes rather obvious (on the remaining deviations from an ideal Rayleigh distribution, cf. Sect. 5.1). The number of matches and the positional accuracy of the X-ray sources from stacked source detection both increase. The improvement in positional accuracy was independently confirmed through a match with GAIA-DR2 (Gaia Collaboration et al. 2018) which was not used by catcorr, again within 3″.
3 Field selection and catalogue processing
3.1 Determination of the background cut
Exposures affected by high background emission may reduce the detection reliability and the accuracy of the source parameters in a stack. In extreme cases, the number of tentative input sources to the maximum-likelihood fitting, which are selected by a sliding-box detection algorithm, may even become too large to process the stack at all. As for 3XMM-DR7s, we thus defined background cuts above which an exposure is discarded from stacked source detection. They were determined following the general method outlined in Traulsen et al. (2019), now derived individually for each camera, each filter, and each observation mode. This method was employed to select or discard exposures from the catalogue sample. The background maps used in source detection are described in Sect. 2.2.
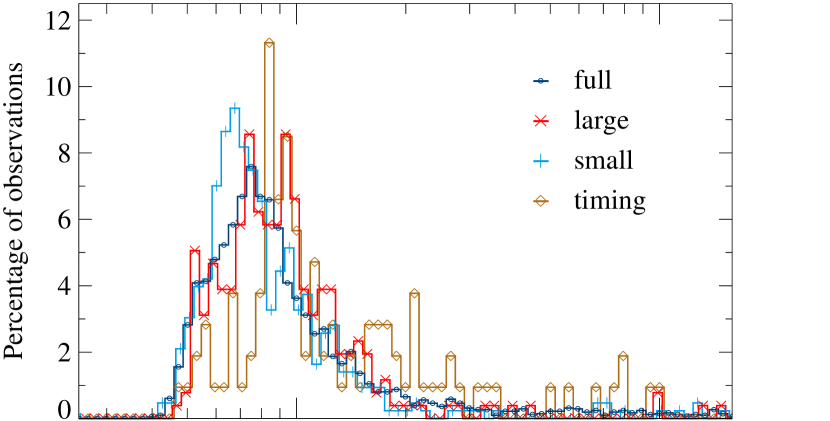
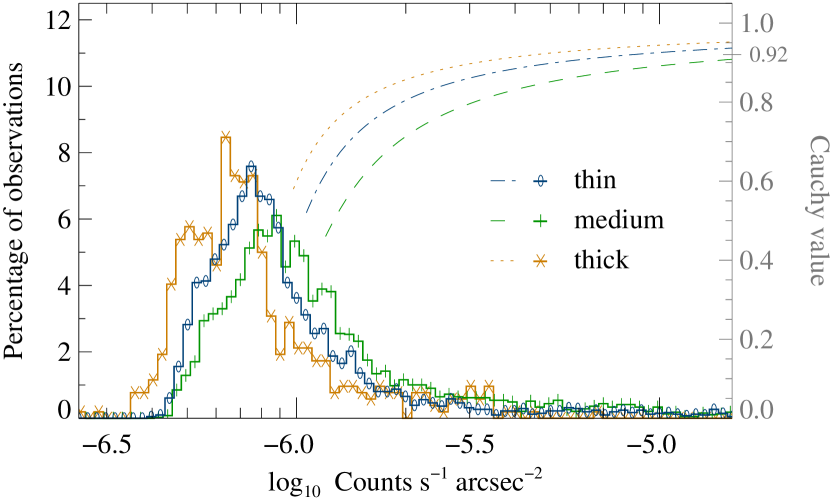
In the source-excised full-band images of all 4XMM-DR9 exposures, we determined the mean background count rate per unit area. For EPIC pn, the rate was calculated for each quadrant separately, where one quadrant comprises three CCDs. For EPIC MOS, it was calculated for each CCD separately except for the central one. Usually, the target of the observation is placed on this central CCD, and if a large area had to be cut out around a bright or extended target, the remaining area might be too small for a reliable background determination. Correspondingly, the other CCDs were considered in the analysis if at least 100 valid pixels remained after masking the sources. The maximum rate among all usable pn quadrants or MOS CCDs was chosen in each exposure and the distribution of background rates derived for each filter-mode combination. While the results for the three imaging modes, which were used in the catalogues, were similar within their uncertainties, clear discrepancies were found between imaging mode and timing mode and between exposures obtained with different filters (Fig. 4). An empirically chosen Lorentz function (Traulsen et al. 2019) was fitted to the rate distribution of all exposures taken in the same imaging mode and filter. In MOS timing mode, too few exposures were available to fit the filters individually, thus one fit was used for all of them. Since count rates are instrument-dependent and cannot be compared directly if taken in different technical setups, we opted for an independent quantity to characterise the background level. From the Lorentz functions, we thus derived the associated Cauchy cumulative probability distributions (examples shown in the lower panel of Fig. 4). The Cauchy probability attributed to an exposure then serves as a configuration-independent measure of the background level, which catalogue users can access to apply their own stricter restriction on the background level consistently without caring about technical details of the individual observations.
To choose the final high-background cut, we selected sky areas which were observed repeatedly at very different background levels and performed source detection in the individual observations and their stacks. The usable sources at the different background levels, the sources in the stack, and those in the contributing observation with the lowest background were compared. From the results and from additional visual inspection of the images using a brightness scale depending on the exposure time, we chose a background cut of 0.92. Exposures with a higher Cauchy probability tend to degrade the source-detection quality and were rejected. The remaining observations are considered suitable for stacked source detection.
3.2 Exposure selection
4XMM-DR9s is based on a subset of all observations that entered 4XMM-DR9. Discarded from stacked source detection were: (1) observations with too small an overlap; (2) pn exposures in small window mode; (3) the central MOS CCDs of exposures in small window mode; and (4) exposures with too high a background (see Sect. 3.1).
Observations were grouped into a stack if they overlap by at least 1′ in radius, which corresponds to the maximum radius of the fit region of a point source in the catalogue processing and ensures that the fit region is fully covered by the combined observations. Thus, observations were selected if their aim points have a maximum distance of 29′, referring to the mean field coordinates given in the headers of the 4XMM-DR9 source lists. Because of the offset between the pn and MOS detectors, the area covered by EPIC instruments is slightly asymmetric. In terms of actually exposed area, 29 observations therefore overlap by less than 1′ with their neighbouring observations although formally meeting the 29′ criterion. These were de-selected manually. Another 88 candidate stacks which met the selection criteria (1) to (3) were discarded because the background level of all their observations or of all but one was too high.
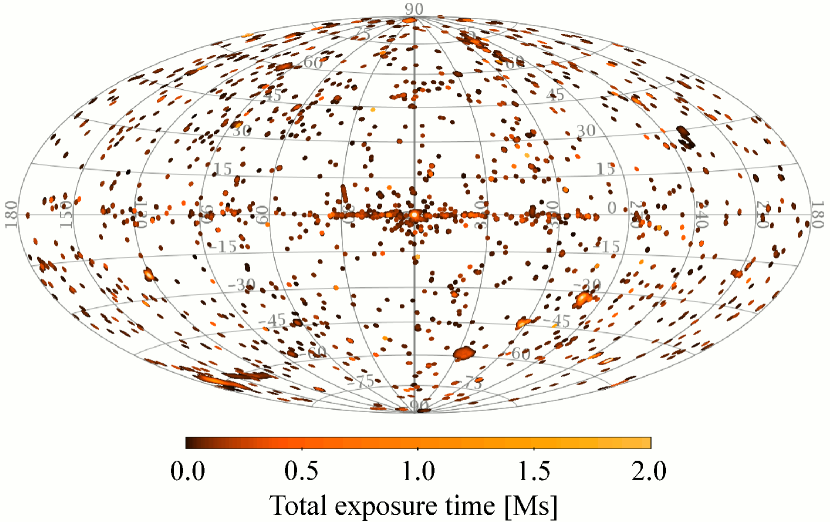
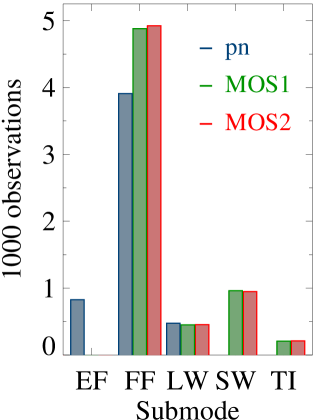
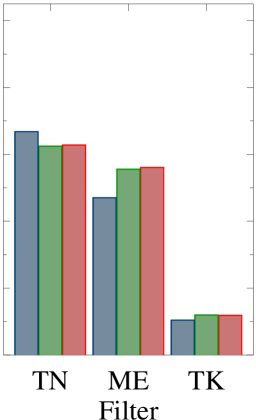
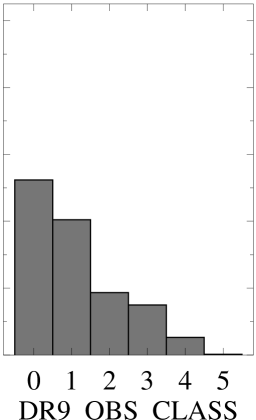
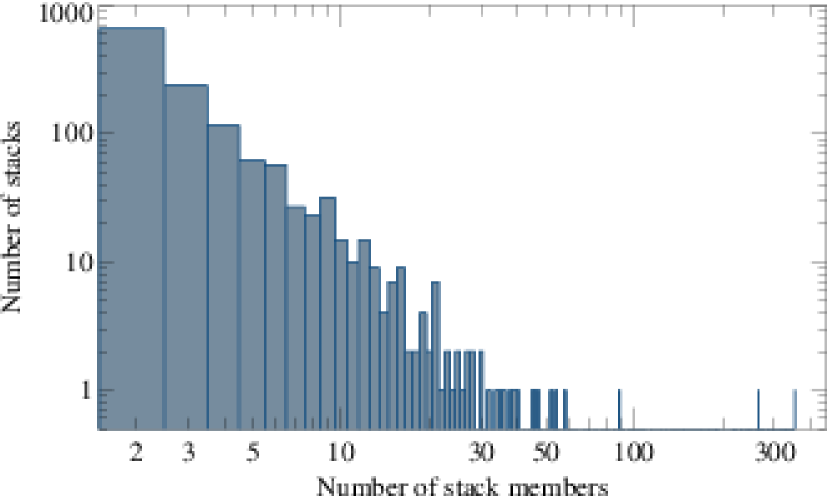
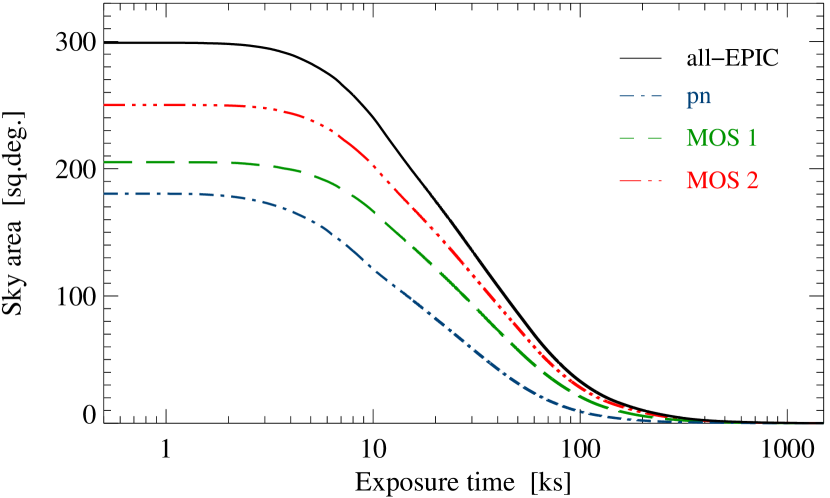
The final selection comprises 6 604 observations with at least one usable exposure in 1 329 stacks. Their depth and distribution over the sky are shown in Fig. 5 in a Hammer-Aitoff representation and their observation modes, filters, and usable chip area according to their OBS_CLASS classification in 4XMM-DR9 in Fig. 6. The number of observations in the stacks are given in Fig. 7. Two thirds of the stacks comprise two or three observations. The largest stacks are the XXL North and South regions with 352 and 266 observations, of which up to eleven overlap directly at a given sky position. Figure 8 shows the depth of all stacks as cumulative repeatedly covered sky area over total exposure time. Out of about 485 square degrees total sky area in 4XMM-DR9s, 300 square degrees were multiply observed with a maximum exposure time of about 1.9 Ms.
3.3 Catalogue processing
The data processing strategy, starting from the modified 4XMM-DR9 attitude files and event lists, and source detection were described in Traulsen et al. (2019) and not changed. In addition to the standard products needed to run source detection, the pipeline produces coverage maps, mosaic images, and exposure maps for each stack, which are newly published together with the catalogue (Sect. 4.5).
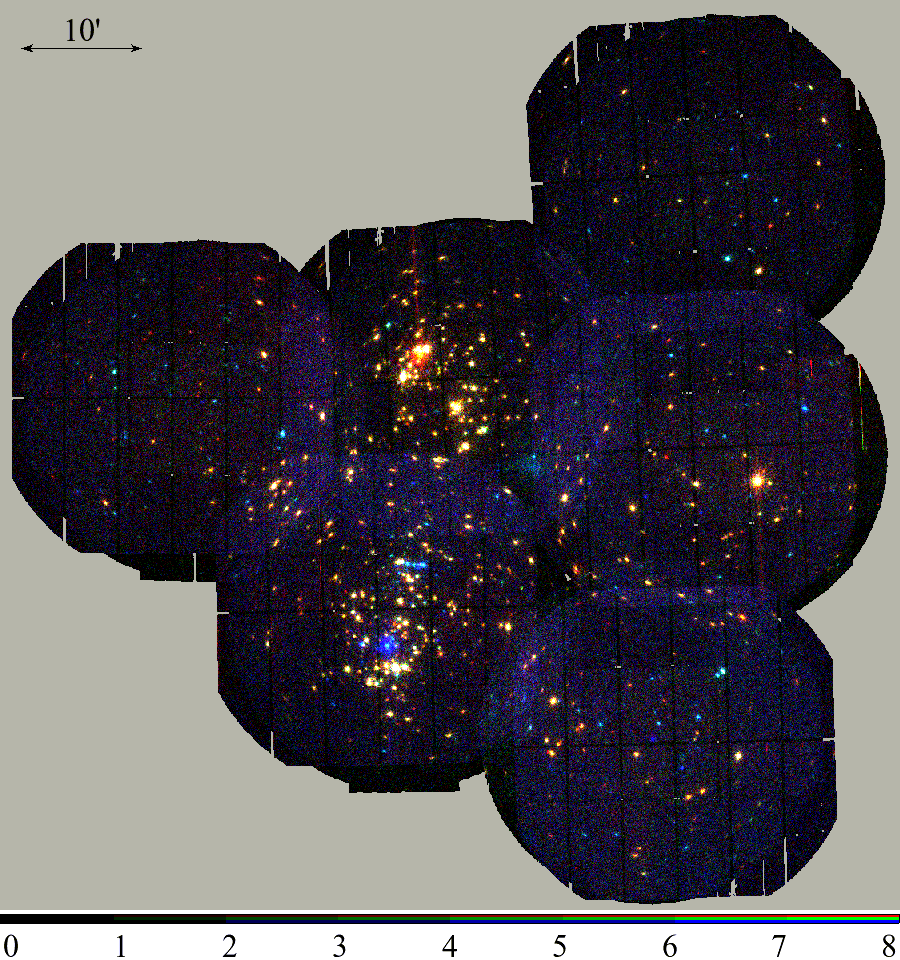
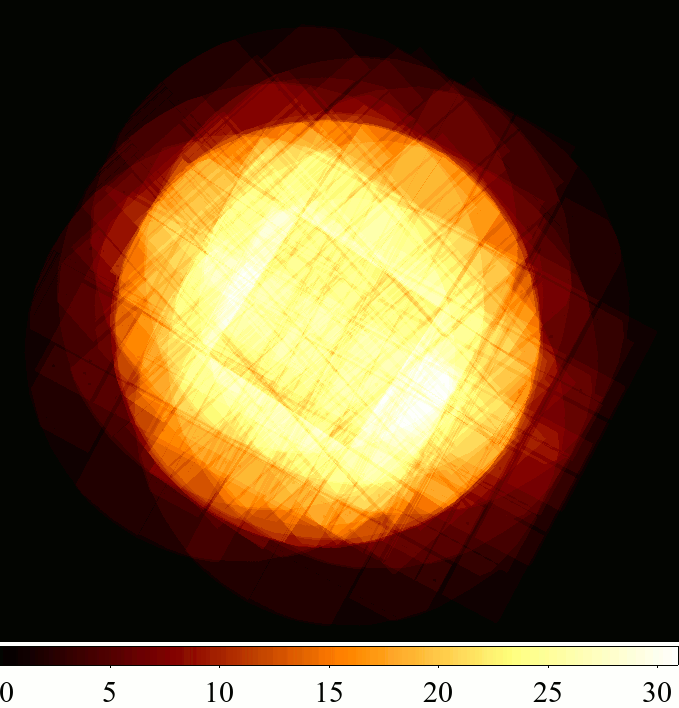
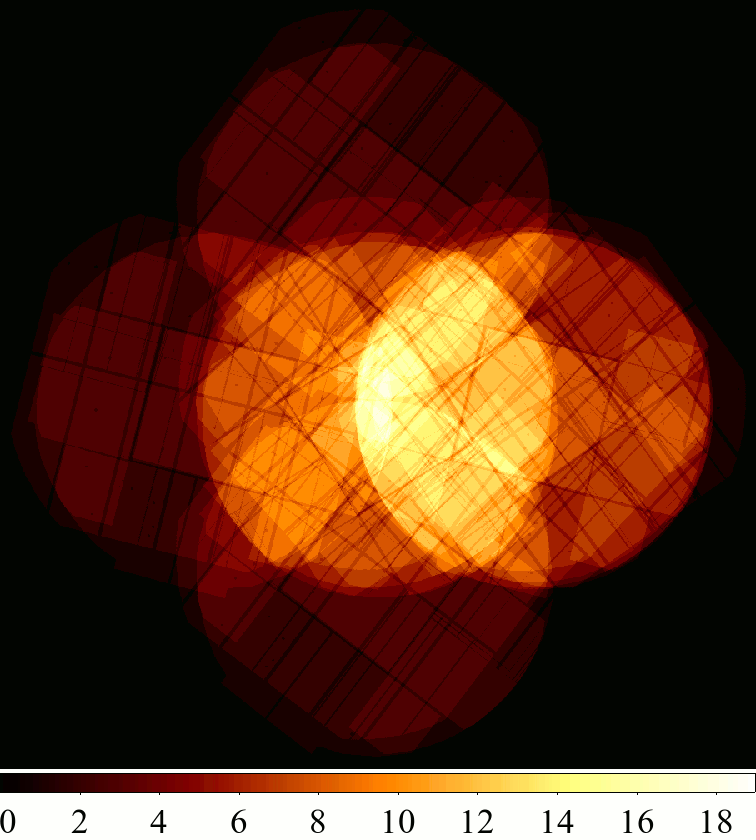
While the largest stack in 3XMM-DR7s comprised 66 observations, the catalogue pipeline for 4XMM-DR9s was revised to be capable of processing several hundred observations and deep stacks with dozens of directly overlapping observations. The standard tasks published in SAS18 were modified to speed up preparation time by parallel pre-processing of the observations. Using these software versions, the catalogue could be produced on standard PCs and a server with higher memory capacity. Figure 9 shows an example detection image and exposure map of a pipeline-processed stack comprising six observations.
4 The second edition of the catalogue from overlapping observations: 4XMM-DR9s
| Description | 4XMM-DR9s | 3XMM-DR7s |
| Number of stacks | 1 329 | 434 |
| Number of observations | 6 604 | 1 789 |
| Time span first to last observation Feb 03, 2000 Nov 13, 2018 | Feb 20, 2000 Apr 02, 2016 | |
| Approximate sky coverage | 480 sq. deg. | 150 sq. deg. |
| Approximate multiply observed sky area | 300 sq. deg. | 100 sq. deg. |
| Total number of sources | 288 191 | 71 951 |
| Sources with one contributing observation | 69 908 | 14 286 |
| Observed once with flag 0 or 1 | 65 307 | 14 076 |
| Observed once and manually flagged | 3 668 | |
| Sources with several contributing observations | 218 283 | 57 665 |
| Multiply observed sources with flag 0 or 1 | 191 497 | 55 450 |
| Multiply observed and manually flagged | 19 224 | |
| Multiply observed with a total detection likelihood of at least six | 181 132 | 49 935 |
| Multiply observed with a total detection likelihood of at least ten | 153 487 | 42 077 |
| Multiply observed extended sources (extent radius ) with flag 0 or 1 | 9 234 | 2 588 |
| Multiply observed point sources with VAR_PROB10-3 and flag 0 or 1 | 11 327 | 3 301 |
| Multiply observed point sources with VAR_PROB10-5 and flag 0 or 1 | 7 182 | 1 839 |
4.1 Basic properties
The serendipitous XMM-Newton source catalogue from overlapping observations is composed from the source lists of all stacks. It consists of several rows for each individual source, which is identified through its IAU name 4XMMs Jhhmmss.sddmmss and a unique identifier SRCID. A summary row lists the source parameters determined for the full stack of observations. The following rows give the source parameters for each contributing observation separately. They are also derived from the same stacked maximum-likelihood fit (cf. Sect. 2). Stack-specific columns can be used to restrict the catalogue to its summary rows, for example by choosing N_CONTRIB0 for all sources and N_CONTRIB1 for sources in overlap regions. Observation-specific rows can be selected for example via the observation identifier OBS_ID. An overview of the catalogue layout including a column list and screen shots are given in the Appendix Section A.3. All detected sources from the input observations are transferred to the catalogue, whether located in overlap areas or not. A newly introduced boolean flag OVERLAP is set to true in all rows of the sources with at least two contributing observations and thus allows for direct selection of multiply observed sources.
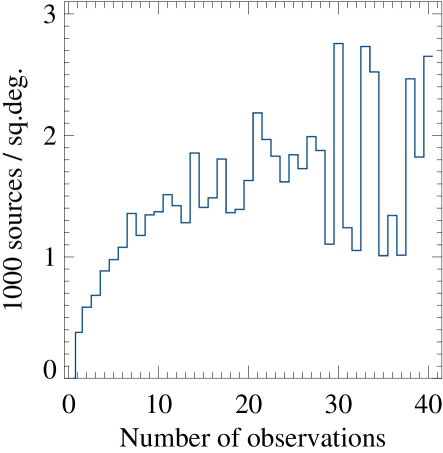
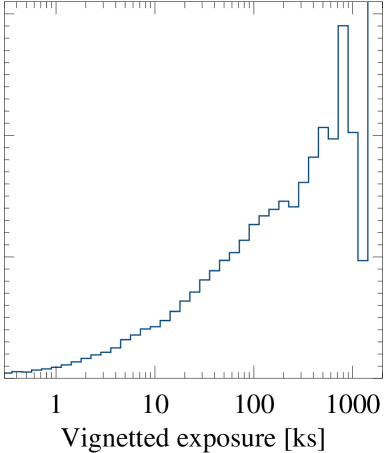
4XMM-DR9s comprises 288 191 unique sources from 6 604 observations, and 218 283 of them were found in overlap areas. The other 69 908 sources were observed only once. These are located in the outer parts of the stacks or in smaller regions missing from one of the observations like a chip gap, the gaps in MOS large-window mode observations, or on the de-activated MOS1 CCDs. The higher source density through stacked source detection is plotted in Fig. 10 in terms of extrapolated source number per square degree over the number of contributing observations and over the cumulated exposure time, taking vignetting effects into account.
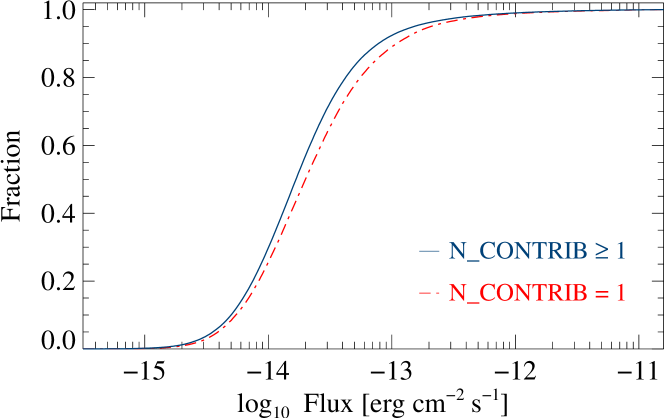
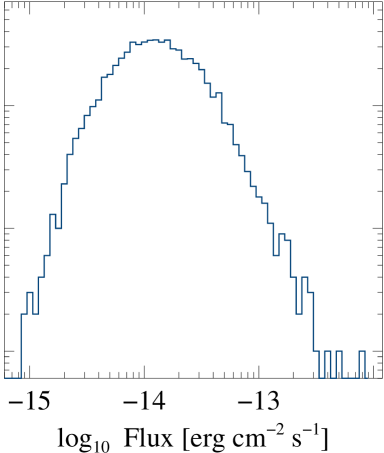
Seven percent of the sources are detected as extended with a core radius of at least 6″, and 88 % have a good or very good quality flag (STACK_FLAG1, referred to as ‘un-flagged’ throughout this paper, cf. Sect. 4.2). The full-band median fluxes and flux errors of the catalogue sources are and for multiply observed sources and and in non-overlapping areas, respectively. About 4 % of the un-flagged multiply observed sources show signs of high long-term inter-observation variability according to . VAR_PROB, one of the variability parameters which were introduced for 3XMM-DR7s (Traulsen et al. 2019), is the probability that the fitted source fluxes are consistent with constant flux in all observations (cf. Sect. 5.3). An overview of the catalogue properties and a comparison to 3XMM-DR7s are given in Table 1.
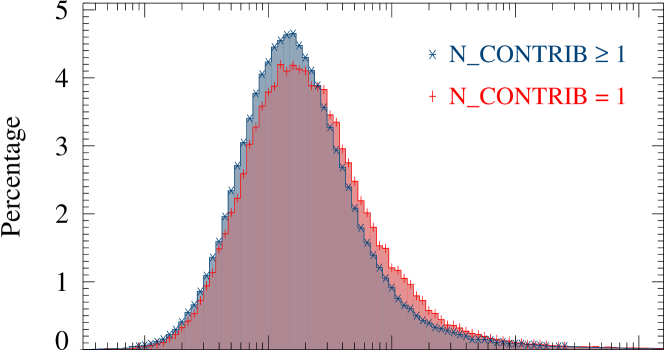
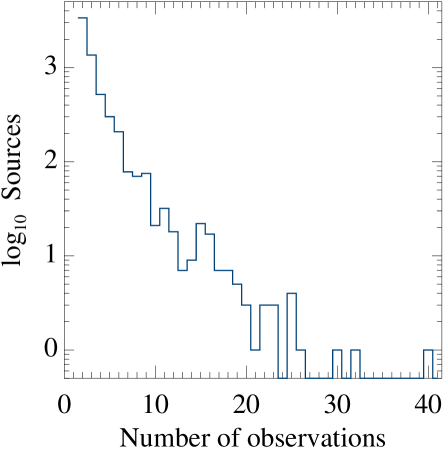
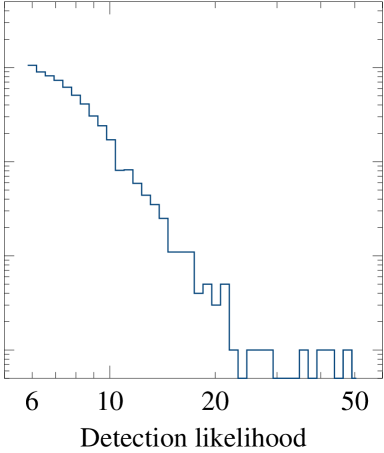
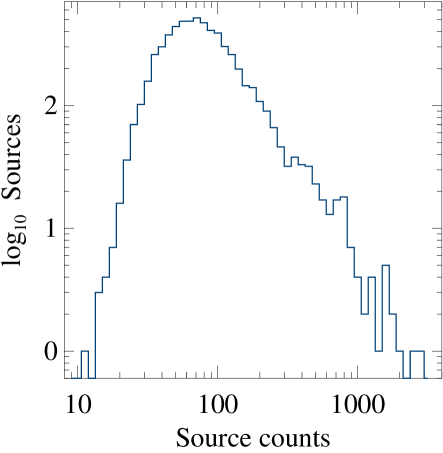
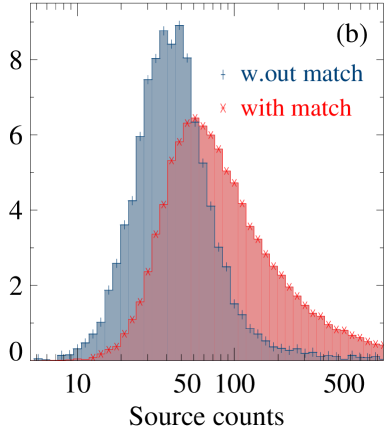
Figure 11 illustrates that through stacked source detection a larger fraction of low-flux sources is uncovered in the overlap areas (N_CONTRIB1) compared to sky areas observed once (N_CONTRIB1). The lower median flux in overlap than in non-overlap areas, given in the paragraph above, corresponds to the relative flux histogram peaking at lower fluxes (upper panel of Fig. 11). The cumulative representation (lower panel of Fig. 11) shows the higher number of detected low-flux sources in the overlap areas. 4XMM-DR9s contains 6 142 sources that have low detection likelihood (EP_DET_ML6) in all contributing observations and become significant (EP_DET_ML6) only through stacked source detection. Their parameters are plotted in Fig. 12: contributing observations, total detection likelihood, counts, and flux. New sources with up to 2 000 counts and sources with a detection likelihood up to 50 are found that were missed when the observations would be processed individually. They are located in areas with eight to forty directly overlapping observations. Section 5.2 discusses the source gain compared to the catalogue from individual observations 4XMM-DR9.
4.2 Quality assessment and visual screening
All XMM-Newton catalogues include information on the quality of a detection in terms of flags that indicate whether it is potentially spurious or located in a problematic region that could affect the reliability of its parameters. The initial quality assessment is performed automatically by the SSC-internal SAS tasks dpssflag within the processing pipeline, following the strategy of Watson et al. (2009). It defines nine boolean flags for each exposure of a source, coding several poor observing conditions which potentially deteriorate the accuracy of the detection or its parameters. The flags enter the catalogue as nine-character strings _FLAG, where stands for one of the instrument abbreviations PN, M1, M2. An overview of their definition is given in Table ‣ 2. The all-EPIC string flag EP_FLAG is true wherever an instrument flag is true. The integer STACK_FLAG summarises the nine boolean flags and is ‘0’ in case of no warnings, ‘1’ for reduced detection quality in at least one image, ‘2’ for potentially spurious sources (cf. Table ‣ 2), and ‘3’ in the summary row for flags ‘2’ during all contributing observations. The cleanest set can thus be chosen by applying the filtering expression ‘STACK_FLAG1’, while detections with higher flags can still come from real sources, but may have uncertain fit parameters. Subsequent quality assessment is done through visual inspection of all source-detection results. The first catalogue from overlapping observations 3XMM-DR7s was based on a clean sample and used the automatically set flags only. 4XMM-DR9s includes significantly more observations taken under various and partly unfavourable conditions. Therefore, additional manual flags are introduced with this version, which resemble those in the series of catalogues from single observations.
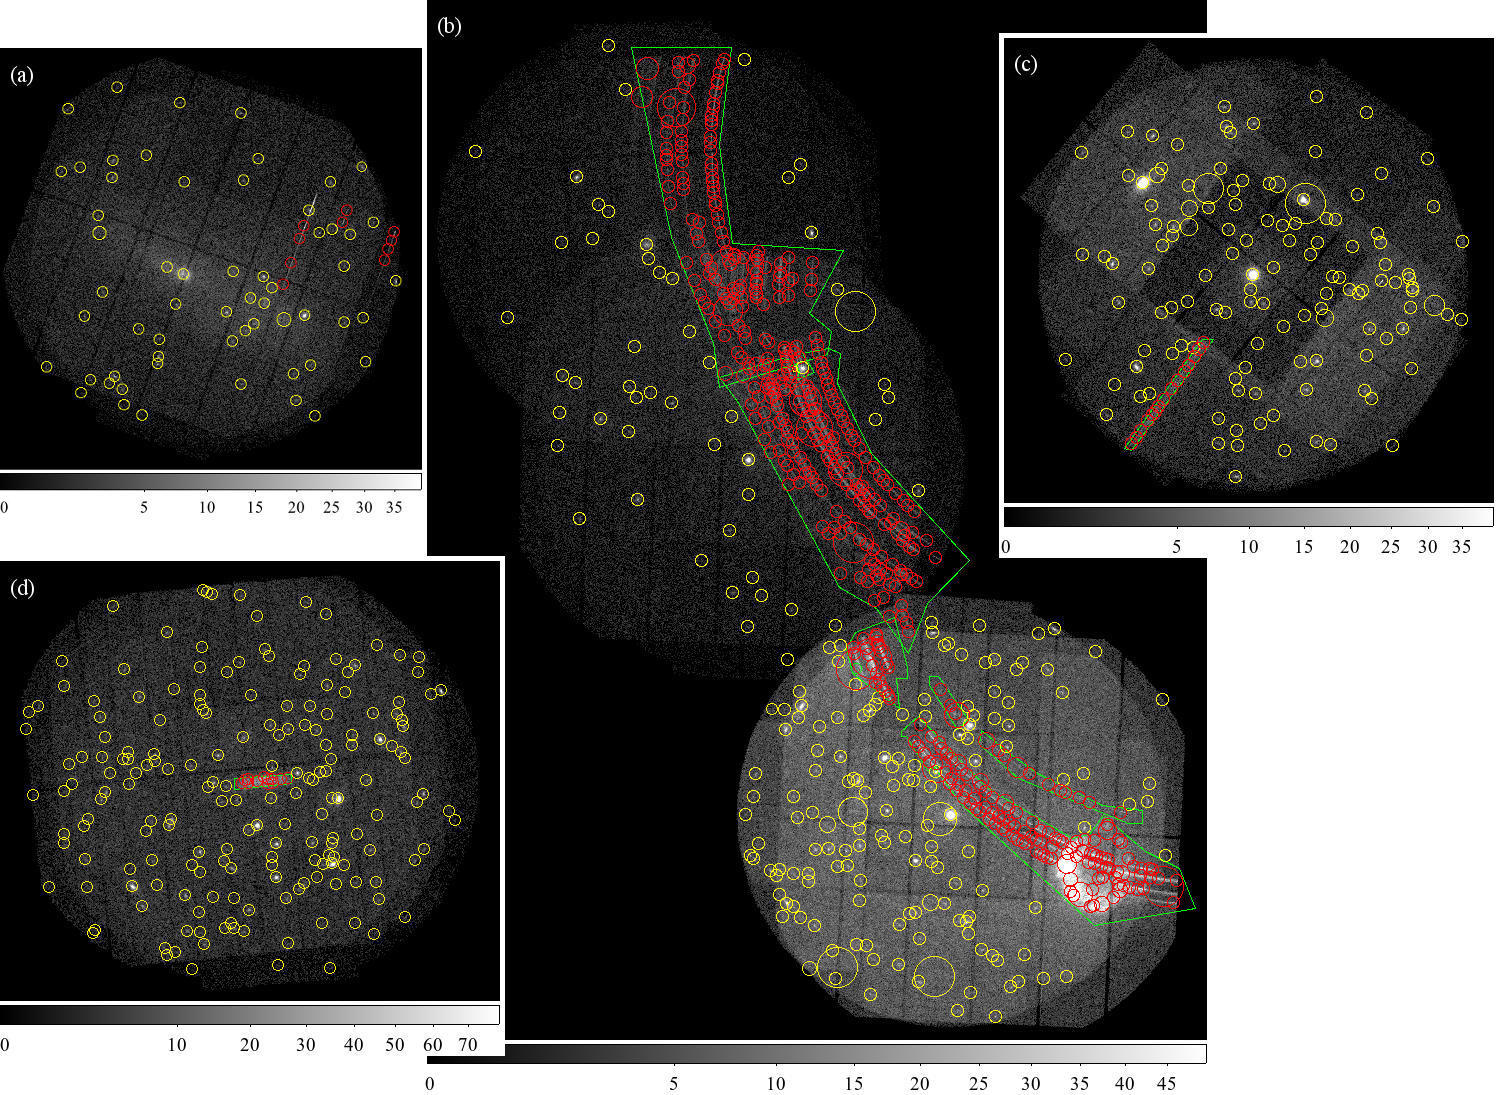
The results of source detection in each stack were screened visually making use of SAOImage DS9 with XPA (Joye & Mandel 2000) and STILTS (Taylor 2005) commands. Obviously spurious sources are flagged manually, (a) if detections lie on single reflection patterns, (b) if several detections are found on detector features like clusters of bad pixels without any sign of a blended real source, (c) if they are heavily confused with bright extended emission and thus have unreliable source parameters, (d) if several detections lie directly on the PSF spikes of bright sources, (e) if a bright source is fitted with several off-set detections because of extreme pile-up, (f) if emission of a very bright target triggers spurious extended detections, or (g) if multiple overlapping sources are fitted to large extended emission or to the footprint of a Solar System body. The screening process is not meant to be complete, but shall help users to reject evidently not genuine sources. Ambiguous cases remain un-flagged in the visual screening to reduce the risk of erroneously excluding good detections, since they are prone to visual mis-classification, for example whenever a real source might be overlapping with a detector feature, if few non-overlapping extended detections cover large extended emission, or if two detections are used to describe the emission of probably only one real source. Sources can have automatically set flags and no manual flag, for example in the vicinity of bright or extended sources where their source parameters could be affected by higher uncertainties than in clean areas. Figure 13 shows examples from the screening process.
Manual flags are indicated in the STACK_FLAG and EP_FLAG columns: EP_FLAG is expanded from nine to ten characters by an additional flag (character) at the end of the string which is true (‘T’) for manually flagged sources and false (‘F’) for the rest. STACK_FLAG is increased by ten if a manual flag was set. The results of the automated flagging are thus preserved in its units’ digit, while the manual flag appears in its tens’ digit. A filtering expression ‘STACK_FLAG 1’ removes both sources with the highest automatic flags 2 and 3 and sources with a manual flag. Eventually, 22 892 catalogue sources received a manual flag and additional 8 495 have STACK_FLAG 2 or 3.
4.3 Cross-matching with the 4XMM-DR9 catalogue
The catalogue 4XMM-DR9 from individual observations (Webb et al. 2020) is distributed in two flavours: From the source lists of all individual observations, the catalogue of detections is created. Sources can thus be included several times in the 4XMM-DR9 catalogue of detections, if they were observed repeatedly. By a positional match, individual detections from different observations are merged into unique sources, and the parameters of the individual detections are merged into unique source parameters. In particular, an averaged unique source position and position error are calculated from the positions and errors of the individual detections. The results of the merging compose the 4XMM-DR9 catalogue of unique sources, also referred to as “slim version” in other publications.
The catalogue 4XMM-DR9s from overlapping observations is matched with a subset of 4XMM-DR9 beginning with the catalogue of sources. The 473 488 unique DR9 sources which have at least one contributing detection with a good summary flag, SUM_FLAG 1, are selected. The search radius is set to 2.2698 times their statistical and systematic position errors, corresponding to the 99.73 % confidence region of a Rayleigh distribution. In DR9, the combination of the errors is given in the column . In DR9s, we use the statistical position error given in the column and the additional error component derived from a fit to a Rayleigh distribution in Sect. 5.1.
For each 4XMM-DR9s source, the nearest associated DR9 source is included in the 4XMM-DR9s catalogue. In particular, if more than one DR9 source is found within the matching radius, the one with the closest position is chosen. The DR9 identifier, position, quality and variability flags are copied from the 4XMM-DR9 catalogue of sources into the stack-level rows (for the structure of 4XMM-DR9s, cf. Fig. 22). From the DR9 catalogue of detections, the parameters are copied into the DR9s observation-level rows of the associated source. The distances between the DR9s and the DR9 positions are calculated and also listed. Columns with DR9 information are marked by the suffix _4XMMDR9. If no association is found, the table cells remain empty. The matching results are further discussed in Sect. 5.2.
| String position | Description STACK_FLAG | |
|---|---|---|
| 1 TFFFFFFFF | PSF coverage below 50% | 1 |
| 2 FTFFFFFFF | detection close to a bright point-like detection | 1 |
| 3 FFTFFFFFF | detection close to an extended detection | 1 |
| 4 FFFTFFFFF | possibly spurious extended detection close to a bright point detection | 2 |
| 5 FFFFTFFFF | possibly spurious extended detection close to a bright extended detection | 2 |
| 6 FFFFFTFFF | possibly spurious extended detection which is significant in one band only | 2 |
| 7 FFFFFFTFF | summary: possibly spurious extended detection with at least one flag out of ‘4’, ‘5’, ‘6’ | 2 |
| 8 FFFFFFFTF | detection on a bad pixel or CCD area | 2 |
| 9 FFFFFFFFT | detection close to a bad CCD area | 1 |
4.4 New and revised columns in 4XMM-DR9s
With 4XMM-DR9s, 26 columns are newly introduced with respect to 3XMM-DR7s. The definitions of three more columns were revised, and all columns from the match with the catalogues from individual observations were renamed. These changes are listed in this Section. An overview of all 4XMM-DR9s columns is given in Table LABEL:tab:columns in the Appendix and more details on all the columns that were initially defined for 3XMM-DR7s in Traulsen et al. (2019).
N_EXP. Analogously to the number of contributing observations N_CONTRIB, N_EXP gives the number of exposures used in the fitting process, which is the sum of active instruments in all contributing observations. If all instruments were active during all observations, it is thus 3 N_CONTRIB in the summary rows. Exposures may be missing because an instrument was operated in timing mode for example, because of technical problems, or because they were excluded from the catalogue processing due to a high background level (Sect. 3.1).
EXTENT_ML. The likelihood of a source being extended is included for extended and newly also for point-like sources in all 4XMM catalogues. It is derived from a fit with a -profile broadened PSF and calculated with respect to the null hypothesis that the source is point-like as the log-likelihood difference between the extended and the point-like fits using Cash statistics. The minimum allowed core radius of extended sources is 6″. For negative values, thus, the source is detected with higher significance in the fit with a point-like PSF.
PN_PILEUP, M1_PILEUP, M2_PILEUP indicate whether the source might be affected by pile-up in the pn, MOS1, MOS2 exposure. The method to derive the values is described in Webb et al. (2020).
N_BLEND gives the number of simultaneously fitted sources in emldetect. In the catalogue pipeline, it is limited to two.
DIST_REF is the distance of a source to the reference coordinates in the centre of a stack. It is given in arcminutes.
The flag OVERLAP indicates whether the centre of the source is located in the overlap area of two or more observations. It corresponds to N_CONTRIB 1 in the summary row and is set in all rows of a source. In rare cases, for instance on chip gaps, the centre of the source may be covered by one observation only, triggering the flag to be false, while the outer regions are covered by several observations.
EP_FLAG. The first nine characters of the all-EPIC quality flag include the automatically set flags as in the previous catalogue. A tenth character adds the manual flag from visual screening (Sect. 4.2), being ‘T’ if the source has been regarded obviously spurious and ‘F’ otherwise.
STACK_FLAG. The integer summary of the quality assessment takes the values 0 to 3 from the automatically set flags as introduced by Traulsen et al. (2019) and summarised in Sect. 4.2. If a manual flag has been set, STACK_FLAG is increased by ten.
ASTCORR. This flag indicates whether an exposure was astrometrically corrected before performing stacked source detection. It is thus set in the observation-level rows and undefined in the summary rows. If it is true, the following astrometry-related columns are set, whose prefix CC_ stands for the task catcorr:
CC_RAOFFSET, CC_DEOFFSET give the field shift in arcseconds as derived by the SAS task catcorr for 4XMM-DR9 (Webb et al. 2020 and Sect. 2.3). CC_ROT_CORR gives the catcorr field rotation in degrees. CC_POFFSET is the absolute offset between the original and the corrected source position in arcseconds. CC_RAOFFERR, CC_DECOFFERR, CC_ROT_ERR, and CC_POFFERR are the corresponding 1 errors.
CC_REFCAT is the name of the reference catalogue used by catcorr. CC_NMATCHES gives the number of matches between 4XMM-DR9 detections in the field and sources in the reference catalogue which were used by catcorr to determine the field rotation and shift.
The following six columns inform on the background level of an observation (Sect. 3.1). They are thus set in the observation-level rows and undefined in the summary rows:
PN_BKG_CRAREA, M1_BKG_CRAREA, M2_BKG_ CRAREA give the instrument-specific background rate per square arcsecond in the source-free regions. They are derived per exposure and thus identical for all sources in a given exposure.
PN_BKG_CPROB, M1_BKG_CPROB, M2_BKG_CPROB are the respective Cauchy probabilities. They are derived from the rate distributions per observing mode and filter (Sect. 3.1).
*_4XMMDR9. Columns copied from 4XMM-DR9 have the suffix _4XMMDR9 and are set if a 4XMM-DR9 source has been associated to a DR9s source (Sect. 4.3). They correspond to the 3XMM-DR7 columns described by Traulsen et al. (2019). A new column SUM_FLAG_MIN_4XMMDR9 gives the lowest – best – summary flag of all individual detections which are merged into the 4XMM-DR9 source.
The integer OBS_CLASS indicates the usable area of an observation in 4XMM-DR9. It is thus set in the observation-level rows and undefined in the summary rows. In 3XMM-DR7s, it was included in the list of observations only. The definition of the OBS_CLASSes is detailed by Webb et al. (2020).
4.5 Auxiliary products and catalogue access
The catalogue is published in the Flexible Image Transport System (FITS) format at the web pages of the XMM-Newton SSC at IRAP, Toulouse121212http://xmmssc.irap.omp.eu/Catalogue/4XMM-DR9s/4XMM_DR9stack.html, at AIP, Potsdam131313https://xmmssc.aip.de/cms/catalogues/4xmmdr9s/, and at the VizieR ftp archive141414ftp://cdsarc.u-strasbg.fr/pub/cats/J/A+A/TBD/TBD/ (will be added) hosted by the Centre de Données astronomiques de Strasbourg (CDS). Searchable interfaces are provided by VizieR151515https://vizier.u-strasbg.fr/viz-bin/VizieR?-source=IX/TBD (will be added), the XMM-Newton Science Archive (XSA)161616https://www.cosmos.esa.int/web/xmm-newton/xsa, and the HEASARC service171717https://heasarc.gsfc.nasa.gov/W3Browse/xmm-newton/xmmstack.html. The online documentation181818https://xmmssc.aip.de/cms/users-guide/ and the list of observations in FITS format and as an HTML table are available from the IRAP and AIP web pages.
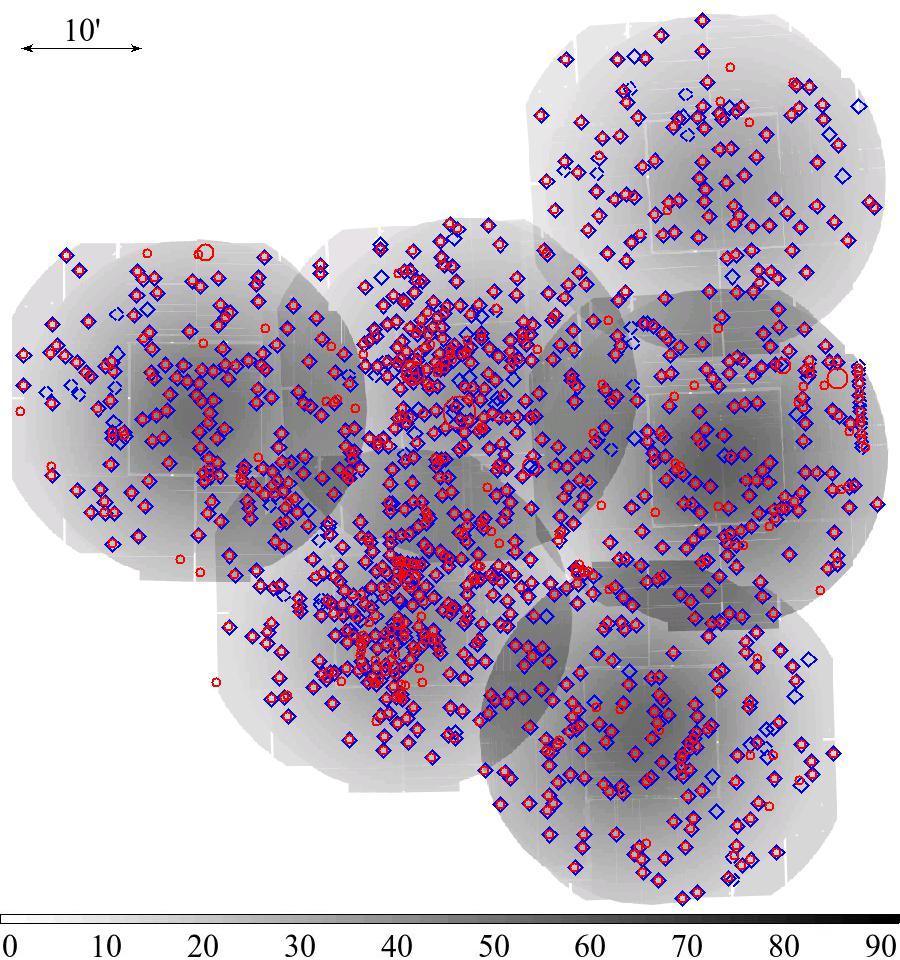
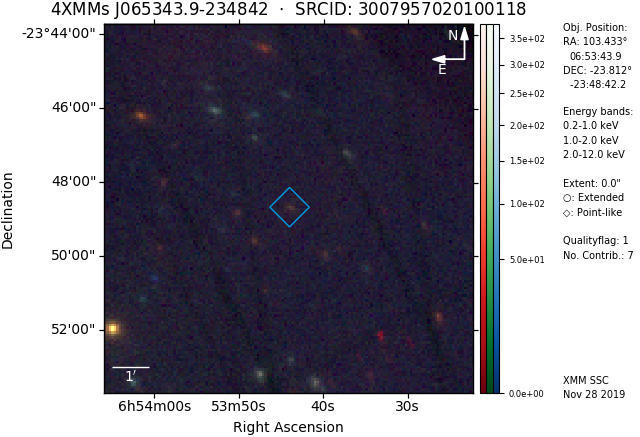
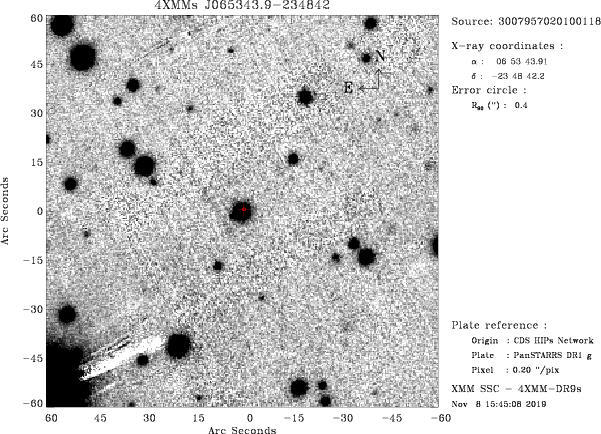
Several auxiliary products are produced alongside the catalogue and published online. For each stack, all-EPIC mosaic images in the five XMM-Newton standard energy bands and in the full 0.212.0 keV energy range, two full-band exposure maps, and three types of coverage maps are published at the AIP web page191919https://xmmssc.aip.de/cms/stacks/. For each catalogue source, three auxiliary images are provided: An 0.212.0 keV full-band X-ray image covering a 10′10′ region centred at the source position, a false-colour X-ray image of the same region, and an optical finding chart covering a 2′2′ region. For each source with at least two observations, an X-ray light curve is provided. All auxiliary images and light-curve plots are available from the XSA interface. Information on their production, the changes for 4XMM-DR9s with respect to the previous versions, and example images are included in Sects. A.1 and A.2 in the Appendix.
Upper flux limits for various high energy missions are provided by the XMM-Newton SOC in an upper-limit service on the XMM-Newton web pages202020http://xmmuls.esac.esa.int/upperlimitserver/. The upper limit to the source flux at a given position is calculated from pipeline processed images, exposure maps, and background maps (König et al. 2020). Stacked data for 4XMM-DR9s have been made available to include upper limit fluxes in overlapping images.
5 Catalogue characterisation and long-term variability of sources
5.1 Astrometric accuracy
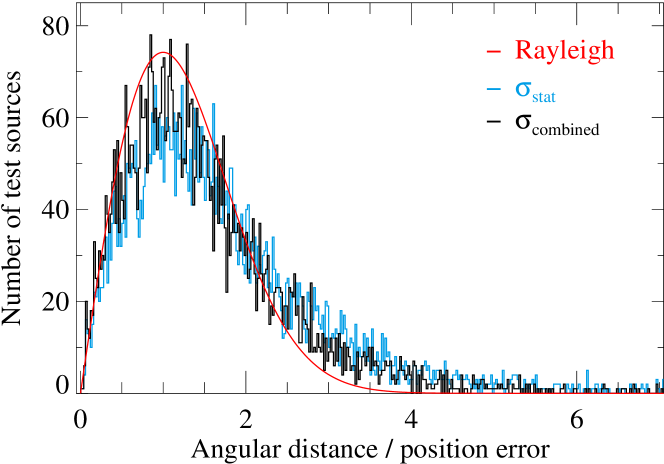
The median statistical position error of 4XMM-DR9s is 0.8″ for point-like sources, 1.6″ for extended sources in overlap areas, and 2.3″ for extended sources in uniquely observed areas. To validate their positional accuracy, we compare them to the better constrained positions of SDSS-DR12 quasars (Alam et al. 2015, for the method cf. Traulsen et al. 2019). From the best matches within a radius of 15″ between all sources in both catalogues, 6 118 spectroscopically confirmed quasars are selected. Their offsets in units of the 1-error are shown in Fig. 14. Ideal positions and position errors are expected to be Rayleigh distributed. Deviations from a Rayleigh distribution indicate that the position errors are not purely statistical, but include systematics for example from uncertainties in the boresight calibration. An additional error component is thus added quadratically to the statistical position errors as and varied to find the best agreement with a Rayleigh distribution. The best fit is achieved with =0.227″. To compare with 3XMM-DR7s, we also determine a linearly added error component . In a slightly poorer fit than the quadratic term, it evaluates to 0.064″. The results are essentially the same when reducing the matching radius to 5″. The error-normalised offsets peak neatly at one, but show similar deviations from an ideal Rayleigh distribution as the other serendipitous catalogues (e.g. Rosen et al. 2016; Webb et al. 2020): a lower maximum and a broader tail, suggesting that part of the EPIC error might be underestimated.
When working with large images in tangential projections, potential distortions have to be taken into account. The catalogue provides the distance of a source to the reference coordinates of the stack in the column DIST_REF. The largest image in the catalogue is almost 10° wide, and the largest offset of a source from the stack centre is 4.8°. Since the PSFs are chosen for azimuth and off-axis angle with respect to the aim point of the individual observation and fitted in sub-images, projection effects are negligible anyway. Source positions in 4XMM-DR9 and DR9s show no systematic deviation from each other. In particular there is no offset as a function of DIST_REF.
5.2 Comparison to 4XMM-DR9
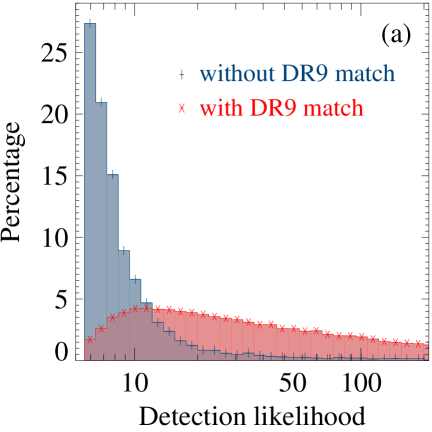
In the observations that were used to compile 4XMM-DR9s, 4XMM-DR9 records 282 804 unique sources212121This number includes 3 192 detections of 1 320 unique sources discovered solely on the central CCD of exposures in small-window mode. These CCDs were discarded from the 4XMM-DR9s processing.. Almost 85 % of the DR9 sources have at least one contributing detection with a good quality flag 0 or 1. Applying the matching strategy of Sect. 4.3, we find DR9 counterparts for 214 170 sources in 4XMM-DR9s. For 193 DR9s sources, more than one DR9 source was located within the matching radius and the closest match chosen. A total of 74 021 4XMM-DR9s sources have no association. Part of this increase is regarded a benefit of the depth of the repeated observations. Another part, typically close to the detection limit, appears as a consequence of the astrometric correction applied prior to stacked source detection and the different image binning. We address these aspects by firstly analysing the source content of the two catalogues in non-overlap areas to then estimate the increase of sources in the overlapping areas thanks to stacking them.
In regions observed only once, DR9s and DR9 represent two source detection runs on the shifted and un-shifted event lists. Out of the 65 307 un-flagged DR9s sources with just one contributing observation, 9 018 were not associated to a 4XMM-DR9 source. 7 620 of them are point-like and 1 758 are extended sources with a larger positional uncertainty than point-like sources. The detection likelihoods and counts of the point-like un-flagged sources are shown in Fig. 15. Most of the non-matches are close to the detection limit with low detection likelihood and few counts: 66 % have detection likelihoods below 10 and 85 % below 20. Close to the detection limit, differences between DR9s and DR9 source lists mainly arise from the astrometric correction, which is applied to the observations before running stacked source detection for DR9s and only after source detection on the individual observations for DR9. The different reference coordinates for the image binning, which are common coordinates for all observations in a stack for DR9s versus the individual aim point of each observation for DR9, may also slightly influence the fit results in particular near the detection limit. Both astrometric correction and reference coordinates alter the centring of the image bins and cause a slightly different distribution of the photons over the pixels. This affects the PSF fit and thus the detection likelihood. Changes in the likelihood can result in gain or loss of sources close to the detection limit.
A further reason for non-matches between DR9 and DR9s lies in the pre-selection of sources before matching them. DR9 sources with a poor quality flag SUM_FLAG2 were not included in the matching exercise described in Sect. 4.3 and thus not listed in 4XMM-DR9s. We investigate the effect of this restriction in a second match between all un-matched DR9s and DR9 sources, now using all DR9 sources irrespective of their quality flag. The distance between matches is now limited to a maximum of 1′ to reduce false associations of sources with large positional errors. More than 80 % of the DR9s-only sources with STACK_FLAG1 are close to a DR9 source with SUM_FLAG2.
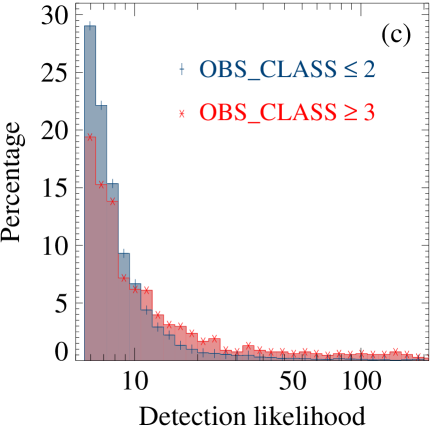
In addition, a significantly higher percentage of un-matched than of matched DR9s sources is subject to source confusion, and many un-matched sources are located in problematic observations for example with high X-ray background, bright single-reflection patterns, or very complex extended structures, where the source position can be determined less precisely. A non-quantified fraction of sources will thus be lost through the matching radius. Figure 15c shows the likelihood distributions for different observation qualities. At detection likelihoods above 20, about 40 % of the un-matched sources are in OBS_CLASS3 observations compared to 9 % of the matched sources. Visual inspection confirms that bright sources without a DR9 association, which can be seen in Fig. 15b, are typically located in such problematic regions, or their potential counterpart in DR9 was flagged with SUM_FLAG2 and therefore not used in the match. Thus, sources in non-overlapping areas come without a DR9 match through various reasons and partly combinations of them: different image binning and the corresponding fitting effects, poor observing conditions, complex X-ray structures, source confusion, asymmetric use of flagged sources in the match not to contaminate DR9s with questionable DR9 associations.
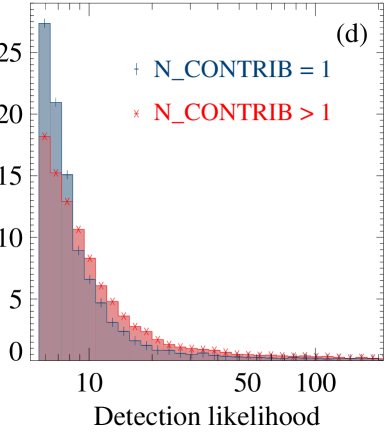
Finally, we investigate the DR9s-only sources in overlap regions (N_CONTRIB1), hence in genuine stacking areas. Compared to non-overlapping areas, the source density is increased thanks to the higher cumulated exposure time (cf. Fig. 10). Through stacked source detection, the source positions are better constrained, which gives more reliable matching results. In those sky areas, about 20 % of the DR9s sources with the best quality flag STACK_FLAG=0 have no counterpart in DR9. The fraction of DR9s-only sources is thus about twice as high in overlapping areas than in non-overlap areas. The un-flagged DR9s-only sources tend to have higher detection likelihoods than in non-overlap areas (Fig. 15d), a larger fraction is found in regions without source confusion, and the fraction of DR9s-only sources in observations with poor OBS_CLASS3 is lower than in non-overlap areas. Eighty-two percent of the DR9s-only sources involve at least one good observation with OBS_CLASS2, compared to 94 % of the sources with a DR9 association. If including 4XMM-DR9 sources in the match which only have detections with problematic quality flags SUM_FLAG as described in the previous paragraph, another 3 426 potential DR9 counterparts to DR9s sources with STACK_FLAG are found, still leaving 18 % of them un-matched (22 % of all DR9s sources and quality flags). The high fraction of DR9s-only sources in overlap areas is thus regarded being mostly an effect of the higher sensitivity through stacking.
5.3 Long-term variability
Variability studies directly from stacked source detection have major advantages over individual detections: Fluxes are determined at the same position in all exposures. The total flux is derived in the simultaneous fit without need to match single detections, which might involve false associations. And lastly, the fluxes are determined for any detection likelihood in the individual observation. About 12 % of the observation-level fluxes in 4XMM-DR9s are derived for a source likelihood below the detection limit, thus for a non-detection in the respective individual observation. Fake variability however can still rarely arise, for example from hot pixels during an observation or spurious detections close to a bright source. Quality filtering based on the flags provided in the catalogue is thus essential and visual inspection of the auxiliary source images delivered with the catalogue is recommended in searches for so far unknown long-term variability between observations.
For each catalogue source with at least two valid measurements, the variability parameters defined by Traulsen et al. (2019) are provided. They are calculated from the stacked and observation-level fluxes in each energy band , where runs from 1 to observations (columns EP__FLUX in the catalogue, ), from the total flux (column EP_FLUX in the catalogue), and from their respective 1 errors: the reduced of long-term flux changes
| (1) |
the associated cumulative chi-square probability of the flux measurements being consistent with constant flux
| (2) |
where smaller values indicate a higher chance that the source is variable and denotes the gamma function, the ratio between the highest and lowest observation-level flux
| (3) |
the associated 1 error
| (4) |
and the largest flux difference between any combination of the observation-level fluxes in terms of
| (5) |
where both and cover the indices of the observations of the source.
For a thorough variability analysis, several variability parameters should be studied jointly. Here, we concentrate on the all-EPIC parameter VAR_PROB only, which is the probability that the mean fluxes per observation are consistent with constant long-term behaviour. 7 182 un-flagged sources are likely long-term variable with (3.75 % of all multiply observed un-flagged sources), and 11 327 (5.91 %) have . Almost 90 % of the variability candidates in 4XMM-DR9s have an association in 4XMM-DR9, but about 20 % of them with only one valid DR9 detection although covered by several observations. For the latter ones, stacked source detection is the only way to investigate the long-term evolution of their fluxes, which are derived for all stacked observations and do not depend on the detectability of a source in the individual observation as in DR9. In DR9, short-term intra-observation variability is determined by means of a variability test on the light curves of a detection in each instrument against the null-hypothesis that the brightness fluctuations are consistent with constant source flux (Rosen et al. 2016; Webb et al. 2020). A source is considered short-term variable if the probability derived from the test is or lower in at least one instrument in at least one observation. The light curves of 26.5 % of the unique 4XMM-DR9 sources have enough good time bins to perform the test. Among the DR9 associations of long-term variable 4XMM-DR9s sources with , 14 % are marked as short-term variable as well, while 54 % show no sign of short-term variability. For the rest, the short-term probability could not be determined.
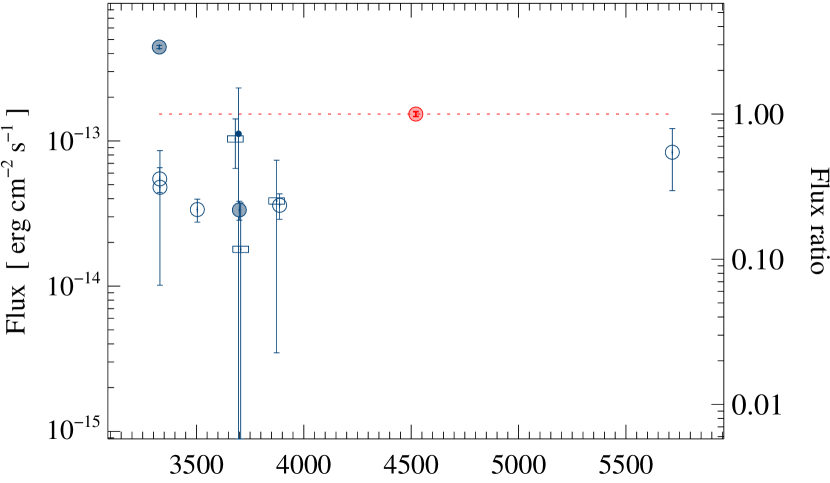
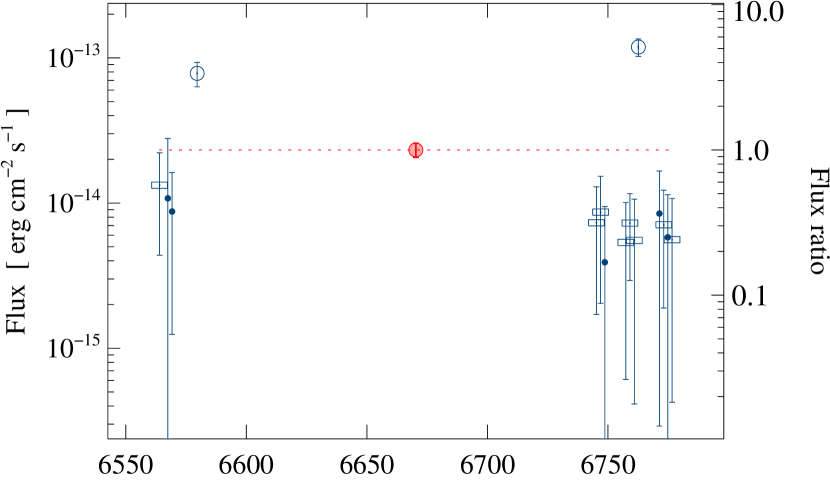
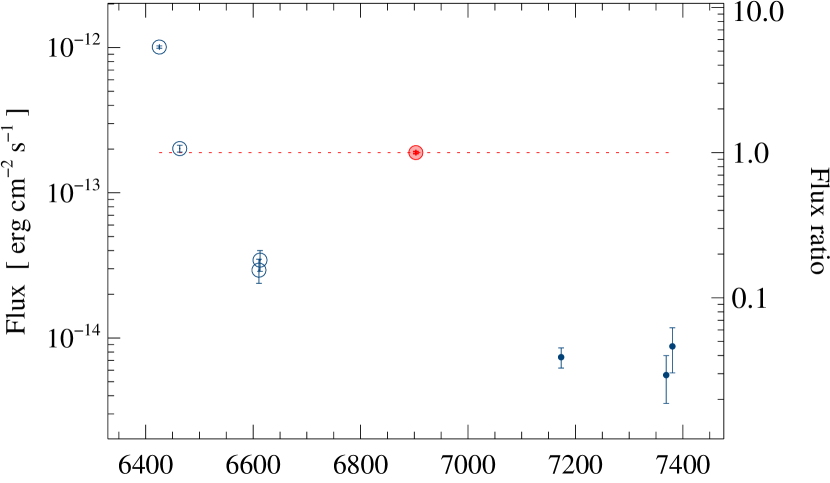
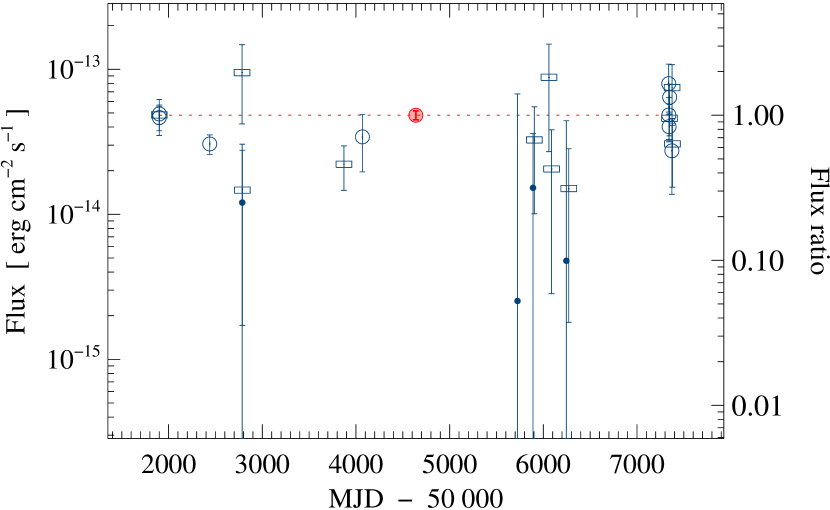
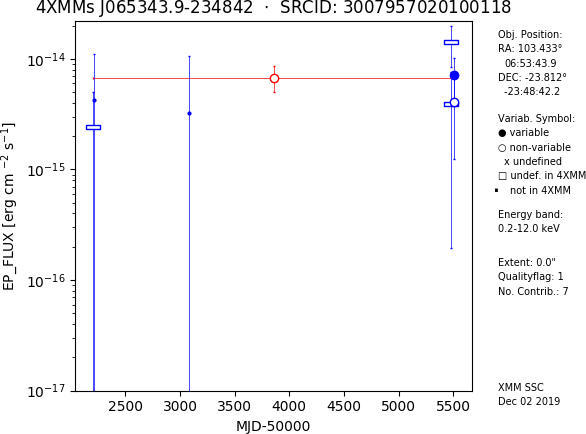
The long-term light curves of the most variable 4XMM-DR9s objects show various kinds of variability: for example flaring or on-off behaviour, flux changes of the order of days, continuous brightening or darkening of sources. Figure 16 includes example light curves from 4XMM-DR9s. In the following subsections, we illustrate the potential of DR9s variability in case studies of object classes and X-ray surveys.
5.3.1 Variability of SIMBAD- and SDSS-classified sources
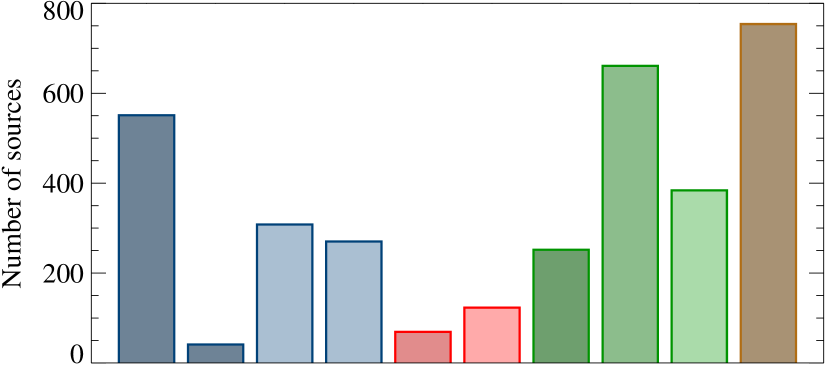
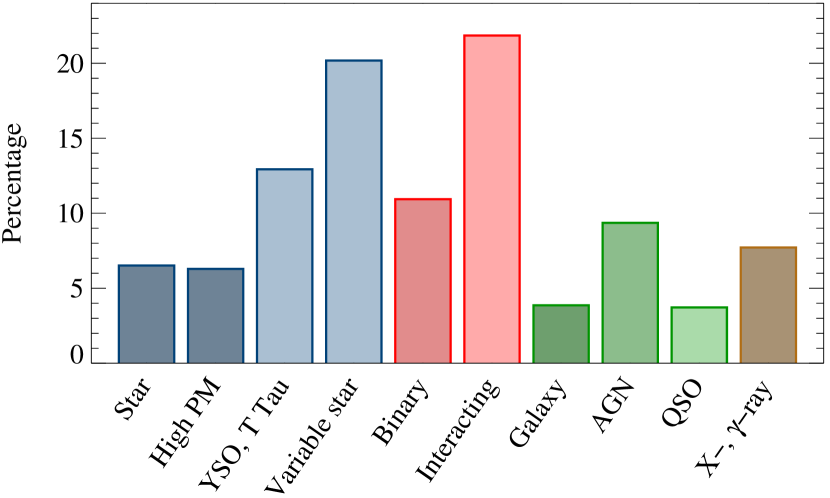
More than 80 000 DR9s un-flagged point sources in 4XMM-DR9s have a tentative counterpart in SIMBAD (Wenger et al. 2000) or SDSS-DR12 (Alam et al. 2015) within 3″. Among them, 3 779 have in 4XMM-DR9s, compared to a total of 7 182 un-flagged variable DR9s sources (Table 1). The pure position match results in about 5 % false associations among the variable sources (for the method cf. Traulsen et al. 2019). We use the matched sources to investigate the variable content of different source classes. For ten source classifications in SIMBAD and – if available – in SDSS, the number of variables and their share among all matched class members are shown in Figure 17: stars without the following sub-categories, high-proper motion stars, young stellar objects and T Tauri stars, non-interacting binaries, interacting binaries, galaxies without AGN and QSOs, AGN without QSOs, QSOs, and un-classified X-ray and -ray sources. In few cases, high-proper motion stars can mimic long-term variability in 4XMM-DR9s, if they are fitted as several detections at different positions. In total, 652 4XMM-DR9s sources are matched with a high-proper motion star in SIMBAD, and 41 have , which is the same proportion as for all stars.
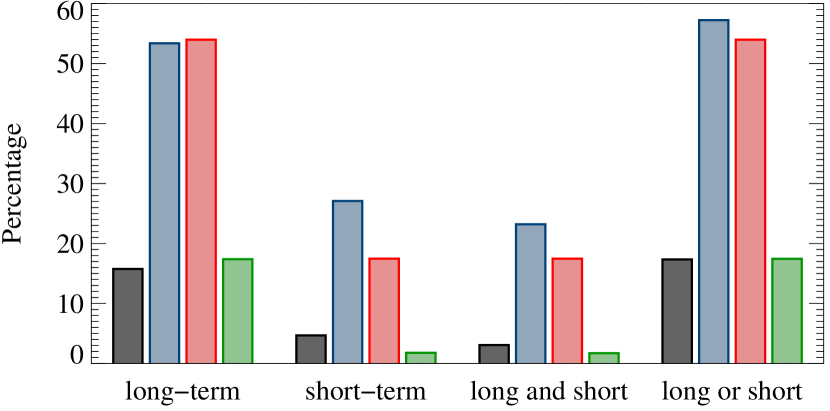
From the matching sample, we select sources with information on long-term and on short-term variability. They have at least three 4XMM-DR9s observations that cover a minimum time span of 30 days and a 4XMM-DR9 association with a sufficient number of counts to determine intra-observation variability. Analogously to 4XMM-DR9, sources are considered short-term variable for and long-term variable for . Figure 18 gives the share of long- and short-term variables among their classes in the subsample. Three source classes are included, which are expected to have different fractions of long- and short-term variable members: stars, which can be variable on all time scales; interacting binaries, for part of which orbital modulations can be recovered within an observation and for part of which long-term flux changes for example due to accretion-rate changes or nova eruptions are detected; and quasars, which are predominantly variable on longer time scales, if at all.
5.3.2 Variable 4XMM-DR9s sources in the XMM-Newton slew and eROSITA surveys
The XMM-Newton slew survey (Freyberg et al. 2006), performed while slewing the telescope between targets, has reached a sky coverage of about 84 % as of March 2017 and an EPIC pn sensitivity of about in the soft energy band222222In the slew catalogue, the soft energy band is defined as 0.22.0 keV, and the hard band as 212 keV. The full band is 0.212.0 keV as in the other catalogues., in the hard energy band, and in total (Saxton et al. 2008; Warwick et al. 2012). To investigate its potential for combined variability studies, we derive the fluxes of the 4XMM-DR9s sources in the slew energy bands and select the bright objects whose soft, hard, or total all-EPIC or instrument-level flux is above the slew sensitivity. For them, slew observations can contribute to the long-term variability information. Among 1 596 bright enough point-like and un-flagged sources, more than 700 are in the footprint of the slew survey and covered up to 13 times by slew exposures. 497 have a tentative counterpart within a 15″ matching radius in the full Slew Survey Source Catalogue XMMSL2 and 444 in its so-called clean edition, from which detections with low detection likelihood and detections with poor quality flags were removed. 358 matches with the full XMMSL2 are located in overlap regions of DR9s and 139 in regions observed once, increasing the pool of sources that can be used in XMM-Newton variability studies. From all DR9s and XMMSL2 fluxes of a source, we derive a combined VAR_PROB_comb that all measurements are consistent with constant flux. Additional 28 sources show signs of long-term variability according to , which are not detected as long-term variable in DR9s alone: 22 with only one DR9s observation and 6 with two DR9s observations, which were taken between one day and 12 years apart from each other.
The Russian-German Spectrum Roentgen Gamma mission (SRG) was launched in July 2019 and surveys the X-ray sky with its two telescopes eROSITA and ART-XC for four years. eROSITA (Merloni et al. 2012) covers a similar energy range as XMM-Newton/EPIC and commenced its survey end of 2019. Synergies with XMM-Newton include in particular analyses of the long-term behaviour of X-ray sources targeted by both missions. To estimate the common source content of 4XMM-DR9s and future eROSITA catalogues, we derive an all-sky sensitivity map from the exposure forecast for eROSITA’s first six-months survey (eRASS:1) and for the total four-year survey (eRASS:8), which are available to the eROSITA consortium. We then compare the EPIC fluxes of each 4XMM-DR9s source to the map values at the source position. Thirty-four percent the sources have a flux above the eRASS:1 limiting sensitivity in total or at least in one contributing observation. The fraction increases to 75 % in eRASS:8 after completing eROSITA’s four-year survey, forming a valuable resource for cross-mission studies.
6 Summary and conclusions
4XMM-DR9s is the second serendipitous source catalogue from overlapping observations, based on the so far largest sample of exposures. They were selected if they overlap by at least 1′ in radius and have a background level below a 92 % Cauchy probability as derived in Sect. 3.1. Thanks to an event-based astrometric correction, which was applied at the beginning of the processing, the positional accuracy of the sources has been clearly improved compared to source detection in the uncorrected observations.
In addition to the automated source flagging by the task dpssflag, the catalogue source lists were screened visually and obviously spurious detections marked manually. Both processes cannot be complete, and an un-flagged catalogue sample cannot be expected to be free from bad detections. But source selection based on the quality flags reduces the spurious content of the catalogue significantly.
From 6 604 observations in 1 329 stacks, 288 191 unique sources were extracted in total, 218 283 of them multiply observed. Additional sources were detected compared to source detection on individual observations, and the source parameters can be better constrained in overlap areas. Long-term inter-observation variability is investigated directly based on the source-detection fit without need to match detections from different observations. Thanks to the simultaneous fit to all observations in a stack, 320 590 new flux determinations and flux errors are available for 106 127 sources with a 4XMM-DR9 association, which could not be detected in part of the individual DR9 observations. 9 912 4XMM-DR9s sources still come without a measurable flux in one or more contributing observations because of zero counts in the fit region. Upper flux limits can be retrieved from the upper-limit server of the SOC.
The flux determinations from the simultaneous source detection fits let us directly derive variability parameters for all catalogue sources with at least two valid measurements. About 6 % of them show signs of at least moderate (VAR_PROB10-3) and 4 % of high (VAR_PROB10-5) long-term variability. Only part of them are known to be short-term variable as well, and about a third have no detection or only one detection in 4XMM-DR9. Their fluxes and long-term variability were measured for the very first time in 4XMM-DR9s. The catalogue from overlapping observations thus serves as a large data base for cross-matching and for long-term studies of X-ray emitting objects, also in the context of new and future missions like eROSITA and Athena, ESA’s proposed future X-ray observatory carrying a high-resolution spectrograph and a wide-field imager, which was selected by ESA within its Cosmic Vision programme (Nandra et al. 2013).
The next catalogue releases in the 4XMM series will concentrate on new public observations. While the standard 4XMM catalogue of detections can be incremented by adding the new detections, a refined strategy is needed for the stacked catalogue. The additional observations may form new stacks which can be included directly, they may become part of existing stacks, or may even combine previously independent stacks. Therefore, source detection will be (re-)run on all old and new observations contributing to the modified sky area of the newly designed stacks. Sources from those sky areas contained in the current catalogue will be replaced with those from the new run. It is foreseen to publish the catalogue updates on an approximately yearly basis.
Acknowledgements.
We thank our anonymous referee for the useful comments. The support of SSC work at AIP by Deutsches Zentrum für Luft- und Raumfahrt (DLR) through grants 50 OX 1701 and 50 OX 1901 is gratefully acknowledged. We particularly appreciate the close collaboration with the colleagues at ESA’s XMM-Newton Science Operations Centre (SOC) and the support by the CDS team. The French teams are grateful to Centre National d’Études Spatiales (CNES) for their outstanding support for the SSC activities. FJC acknowledges financial support through grant AYA2015-64346-C2-1P (MINECO/FEDER). FJC and MTC acknowledges financial support from the Spanish Ministry MCIU under project RTI2018-096686-B-C21 (MCIU/AEI/FEDER/UE), cofunded by FEDER funds and from the Agencia Estatal de Investigación, Unidad de Excelencia María de Maeztu, ref. MDM-2017-0765. This project has made use of CDS services and the SIMBAD database, operated at CDS, Strasbourg, France, of FTOOLS by NASA’s HEASARC (Blackburn 1995), of TOPCAT/STILTS (Taylor 2005), and of SDSS-III. Funding for SDSS-III has been provided by the Alfred P. Sloan Foundation, the Participating Institutions, the National Science Foundation, and the U.S. Department of Energy Office of Science. The SDSS web site is www.sdss.org. SDSS is managed by the Astrophysical Research Consortium for the Participating Institutions of the SDSS Collaboration including the Brazilian Participation Group, the Carnegie Institution for Science, Carnegie Mellon University, the Chilean Participation Group, the French Participation Group, Harvard-Smithsonian Center for Astrophysics, Instituto de Astrofísica de Canarias, The Johns Hopkins University, Kavli Institute for the Physics and Mathematics of the Universe (IPMU) / University of Tokyo, the Korean Participation Group, Lawrence Berkeley National Laboratory, Leibniz Institut für Astrophysik Potsdam (AIP), Max-Planck-Institut für Astronomie (MPIA Heidelberg), Max-Planck-Institut für Astrophysik (MPA Garching), Max-Planck-Institut für Extraterrestrische Physik (MPE), National Astronomical Observatories of China, New Mexico State University, New York University, University of Notre Dame, Observatário Nacional / MCTI, The Ohio State University, Pennsylvania State University, Shanghai Astronomical Observatory, United Kingdom Participation Group, Universidad Nacional Autónoma de México, University of Arizona, University of Colorado Boulder, University of Oxford, University of Portsmouth, University of Utah, University of Virginia, University of Washington, University of Wisconsin, Vanderbilt University, and Yale University.References
- Ahn et al. (2012) Ahn, C. P., Alexandroff, R., Allende Prieto, C., et al. 2012, ApJS, 203, 21
- Alam et al. (2015) Alam, S., Albareti, F. D., Allende Prieto, C., et al. 2015, ApJS, 219, 12
- Blackburn (1995) Blackburn, J. K. 1995, in ASP Conf. Ser. Vol. 77, Astronomical Data Analysis Software and Systems IV, ed. R. A. Shaw, H. E. Payne, & J. J. E. Hayes, 367
- Cash (1979) Cash, W. 1979, ApJ, 228, 939
- Freyberg et al. (2006) Freyberg, M. J., Altieri, B., Bermejo, D., et al. 2006, in ESA Special Publication, Vol. 604, The X-ray Universe 2005, ed. A. Wilson, 913
- Gaia Collaboration et al. (2018) Gaia Collaboration, Brown, A. G. A., Vallenari, A., et al. 2018, A&A, 616, A1
- Jansen et al. (2001) Jansen, F., Lumb, D., Altieri, B., et al. 2001, A&A, 365, L1
- Joye & Mandel (2000) Joye, W. & Mandel, E. 2000, in Astronomical Society of the Pacific Conference Series, Vol. 216, Astronomical Data Analysis Software and Systems IX, ed. N. Manset, C. Veillet, & D. Crabtree, 91
- König et al. (2020) König, O., Saxton, R., Kretschmar, P., et al. 2020, Astron. Comput., in prep.
- Mason et al. (2001) Mason, K. O., Breeveld, A., Much, R., et al. 2001, A&A, 365, L36
- Merloni et al. (2012) Merloni, A., Predehl, P., Becker, W., et al. 2012, arXiv e-prints, arXiv:1209.3114
- Monet et al. (2003) Monet, D. G., Levine, S. E., Canzian, B., et al. 2003, AJ, 125, 984
- Nandra et al. (2013) Nandra, K., Barret, D., Barcons, X., et al. 2013, arXiv e-prints, arXiv:1306.2307
- Page et al. (2012) Page, M. J., Brindle, C., Talavera, A., et al. 2012, MNRAS, 426, 903
- Read et al. (2011) Read, A. M., Rosen, S. R., Saxton, R. D., & Ramirez, J. 2011, A&A, 534, A34
- Rosen et al. (2016) Rosen, S. R., Webb, N. A., Watson, M. G., et al. 2016, A&A, 590, A1
- Saxton et al. (2008) Saxton, R. D., Read, A. M., Esquej, P., et al. 2008, A&A, 480, 611
- Skrutskie et al. (2006) Skrutskie, M. F., Cutri, R. M., Stiening, R., et al. 2006, AJ, 131, 1163
- Strüder et al. (2001) Strüder, L., Briel, U., Dennerl, K., et al. 2001, A&A, 365, L18
- Taylor (2005) Taylor, M. B. 2005, in ASP Conf. Ser. Vol. 347, Astronomical Data Analysis Software and Systems XIV, ed. P. Shopbell, M. Britton, & R. Ebert, 29
- Traulsen et al. (2019) Traulsen, I., Schwope, A. D., Lamer, G., et al. 2019, A&A, 624, A77
- Turner et al. (2001) Turner, M. J. L., Abbey, A., Arnaud, M., et al. 2001, A&A, 365, L27
- Warwick et al. (2012) Warwick, R. S., Saxton, R. D., & Read, A. M. 2012, A&A, 548, A99
- Watson et al. (2001) Watson, M. G., Auguères, J.-L., Ballet, J., et al. 2001, A&A, 365, L51
- Watson et al. (2009) Watson, M. G., Schröder, A. C., Fyfe, D., et al. 2009, A&A, 493, 339
- Webb et al. (2020) Webb, N., Coriat, M., Traulsen, I., et al. 2020, A&A, accepted
- Wenger et al. (2000) Wenger, M., Ochsenbein, F., Egret, D., et al. 2000, A&AS, 143, 9
Appendix A Auxiliary information on the catalogue
A.1 Auxiliary images and light curves
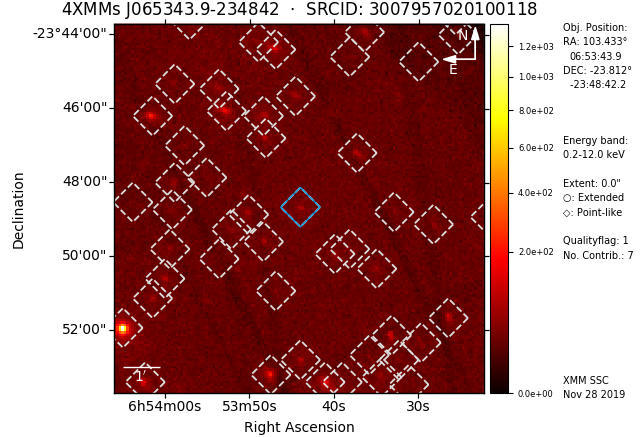
Auxiliary images in PNG format are published for each 4XMM-DR9s source: X-ray images from the 4XMM-DR9s pipeline and an optical finding chart chosen from ESO Online Digitized Sky Survey, Pan-STARRS G, and skyMapper G. An X-ray light-curve plot is published for each multiply observed source. The production of these data is detailed in Traulsen et al. (2019). The following updates were applied for 4XMM-DR9s: The full-band X-ray image now shows all detected sources in the plotted region with dotted white marks in addition to the central source which is marked in blue. As before, diamonds with a fixed size are used for point-like sources and circles with the same radius as the core of the extent model for extended sources. In the light curves, an additional plot symbol has been introduced besides the open circle for sources with a VAR_PROB above 0.01 and a filled circle for VAR_PROB 0.01: If a source was fitted with zero counts for one out of two observations, VAR_PROB remains undefined. The single valid flux value is marked by an x in these cases. If more than two observations are involved, the variability parameters are derived from those with defined fluxes. The flux axis is adjusted to minimum and maximum flux of the source including error bars, covers at least one magnitude, and has an absolute minimum of . Figures 19 and 20 include an example set of the light curves and images that are produced for each 4XMM-DR9s catalogue source and available from the XSA interface (Sect. 4.5).
A.2 Auxiliary data
Our catalogue pipeline generates auxiliary data in FITS format for each 4XMM-DR9s stack, including composite images, exposure maps, and coverage maps of the stack. They are published via xmmssc.aip.de. All-EPIC mosaic images are generated for the five XMM-Newton standard energy bands and for the full 0.212.0 keV band. They are the sum of all observation- and instrument-level images.
Two exposure maps include the total exposure at a given pixel, which is summed over all contributing observations. For each observation, the maximum exposure time of the three EPIC instruments per pixel is chosen. One exposure map gives the total un-vignetted exposure. The other map is created from exposure maps that are multiplied with the respective vignetting factor, which depends on the instrument, the detector coordinates, and the energy band.
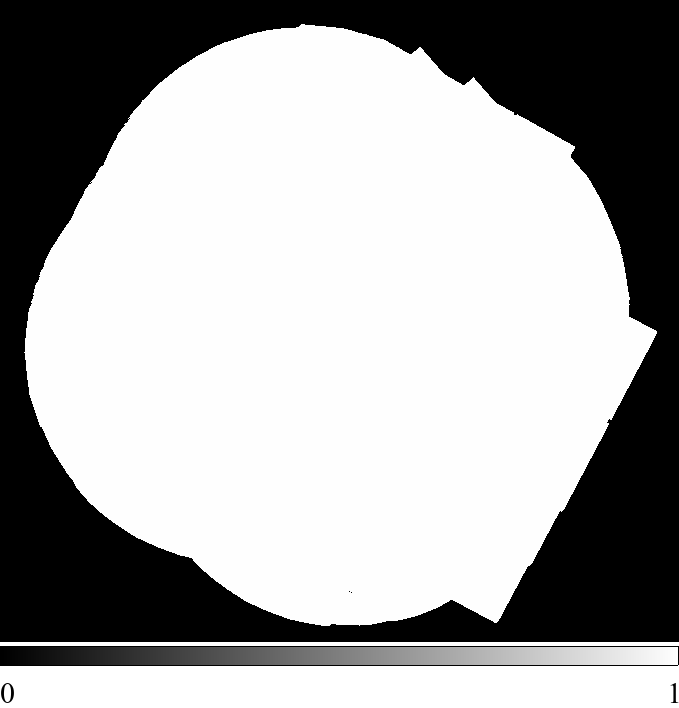
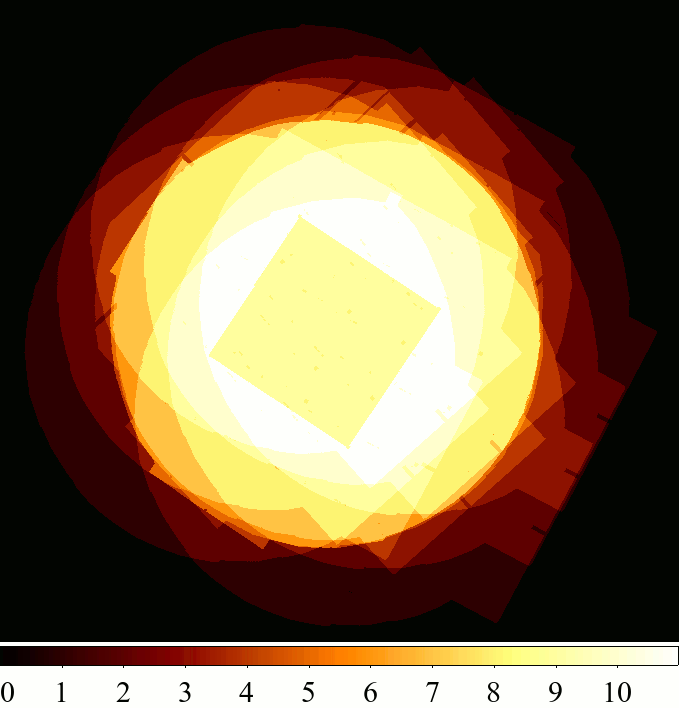
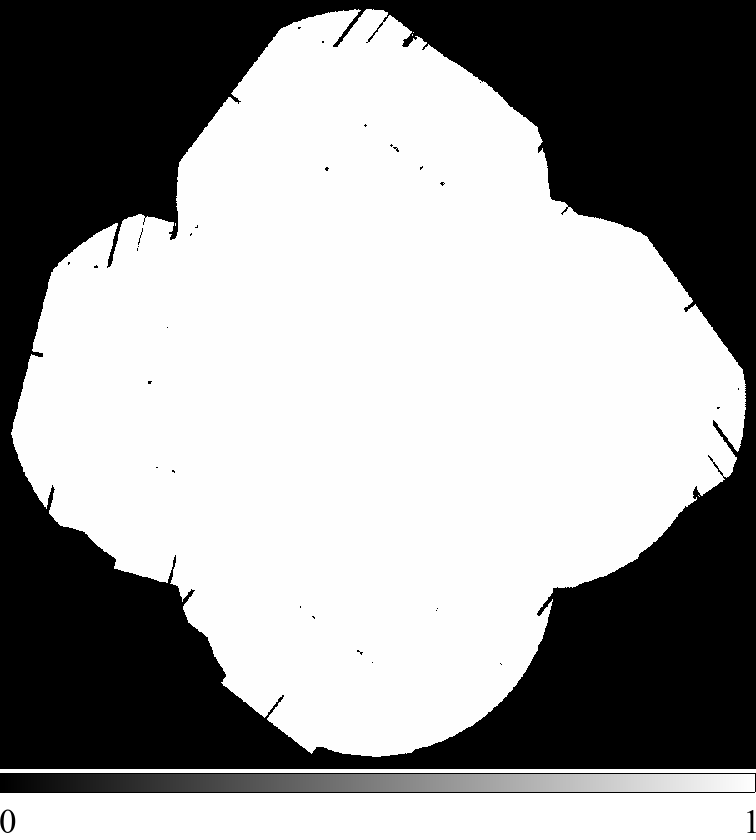
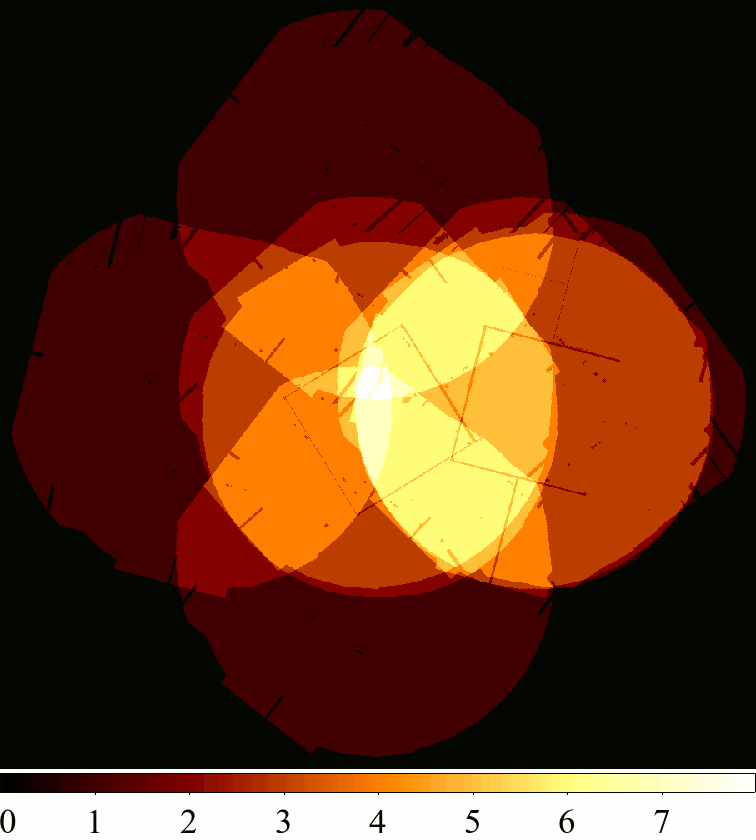
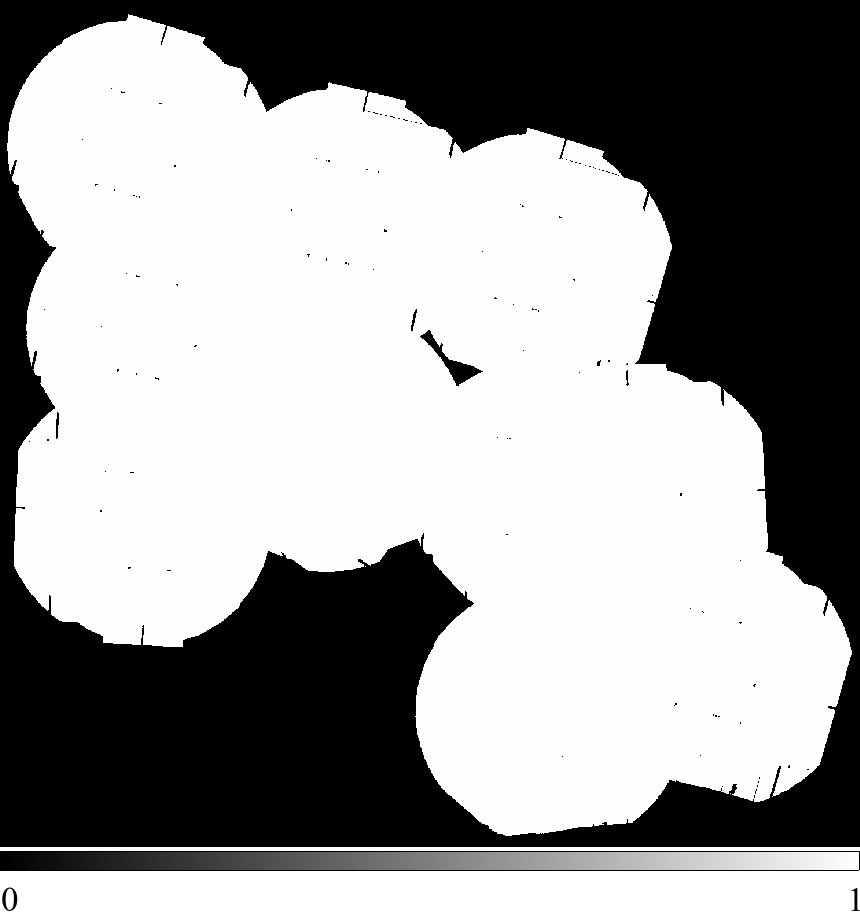
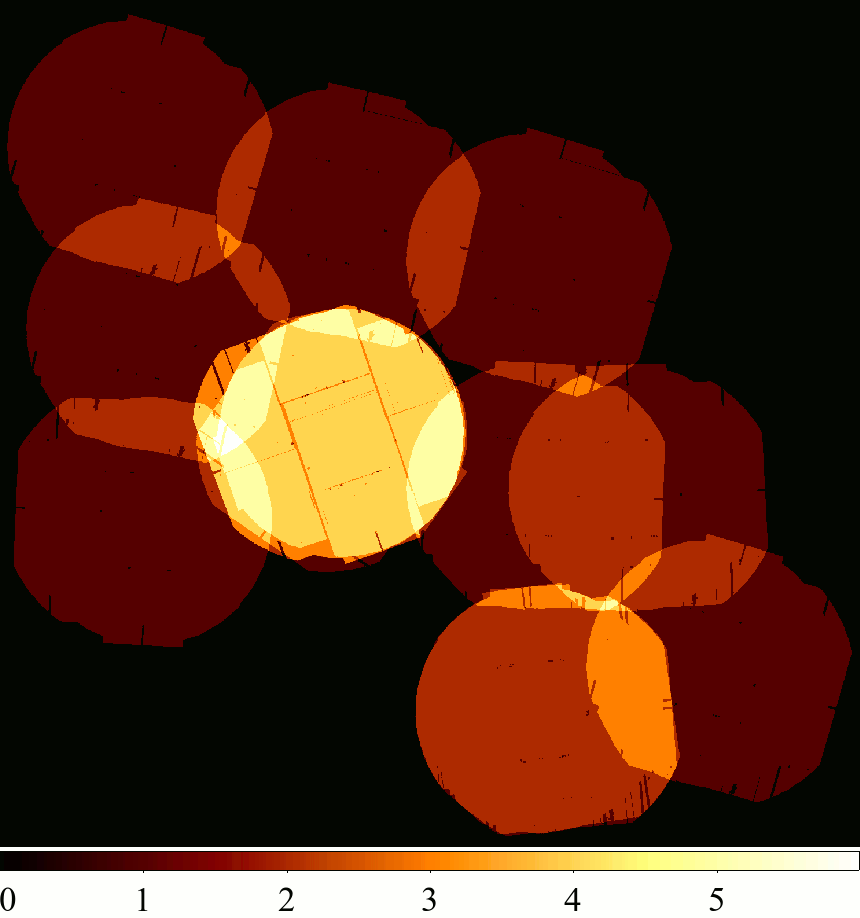
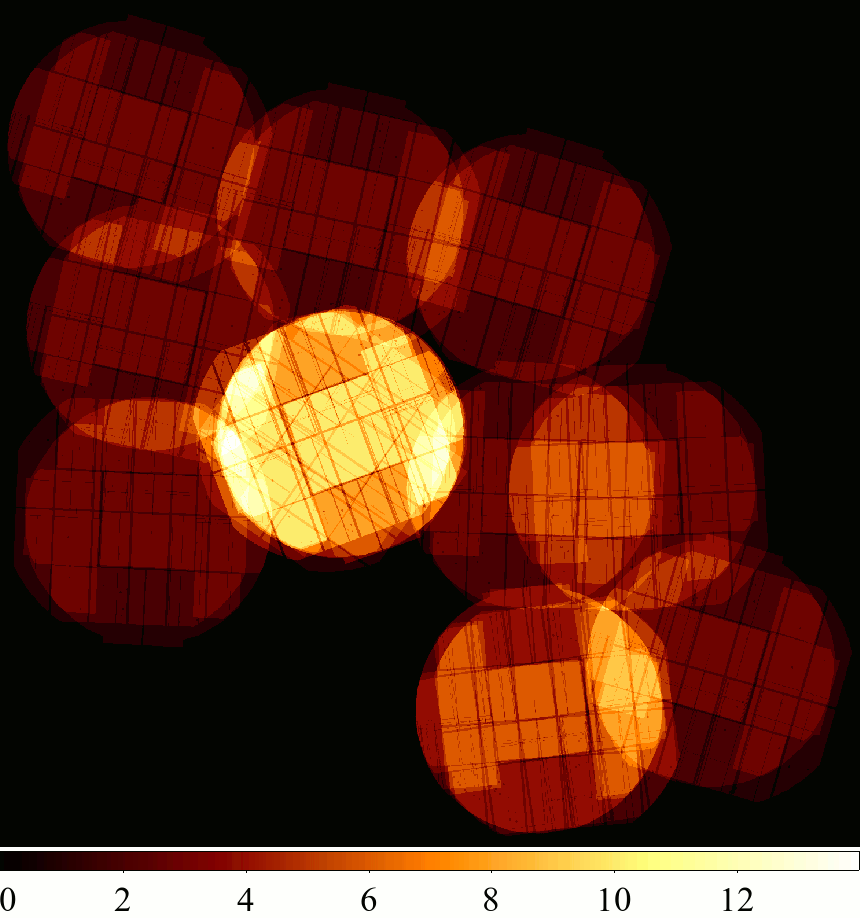
Three coverage maps are created from the detection masks of the individual exposures. The maps named ”cov” show the valid pixels in a stack, ”1” indicating the exposed pixels and ”0” the un-exposed pixels. The maps “nobs” give the number of overlapping observations and “nexp” the number of overlapping exposures in each pixel, respectively. Figure 21 shows three example sets of coverage masks for different patterns of overlaps.
A.3 Catalogue layout
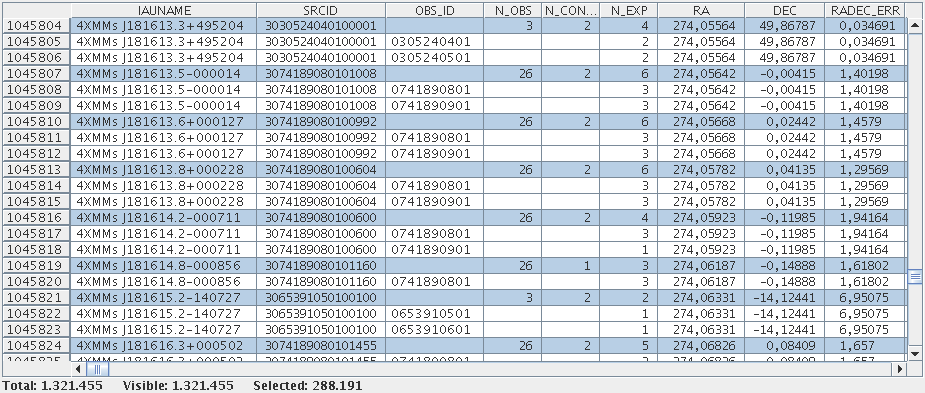
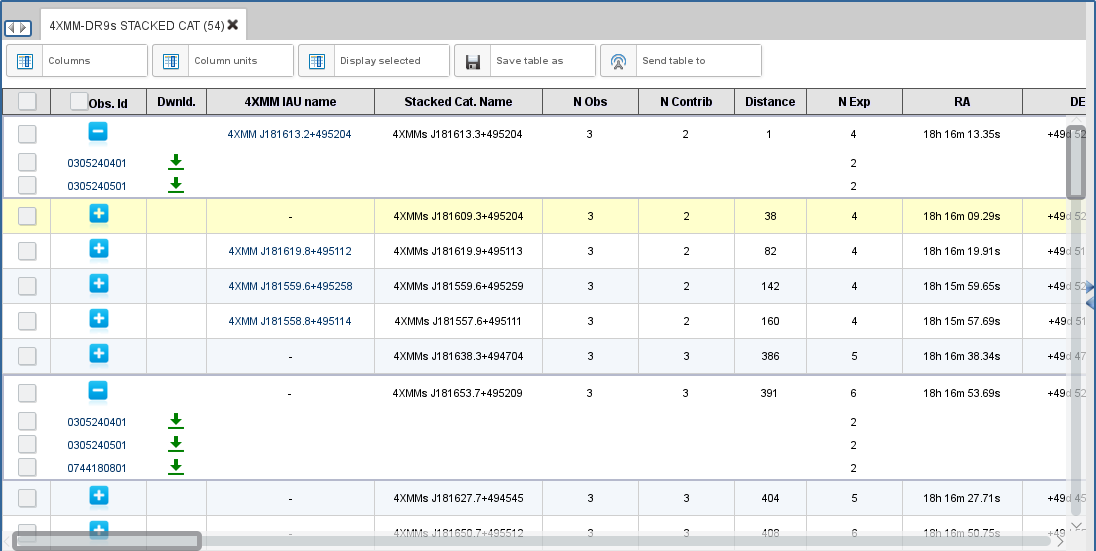
Several sets of source parameters are derived from the simultaneous source-detection fits (Sect. 2). They are listed in the catalogue in 310 parameter columns and in several rows for each detected source. The first row includes the stack summary, i.e. the parameters derived from all images and all observations involved. In the following rows, source parameters are given for each contributing observation that was considered in the fit. They are derived from the subset of images taken during this specific observation. Since some parameter columns are only defined in the stack-summary rows and some only in the observation-level rows, these columns can be used to identify them. Stack-summary rows can be selected for example through their valid N_OBS and N_CONTRIB values. Observation-level rows are identified for example through their OBS_ID and REVOLUT entries. Sources with a match in 4XMM-DR9 are characterised by a valid SRCID_4XMMDR9 or their URL_4XMMDR9. At observation level, they have a valid DETID_4XMMDR9. Figures 22 and 23 show usage examples of the FITS table in a FITS viewer (here: TOPCAT) and of the information in the online interface XSA.
Table LABEL:tab:columns summarises the 310 catalogue columns. Longer descriptions of the columns introduced with 3XMM-DR7s can be found in Traulsen et al. (2019) and of the new and updated 4XMM-DR9s columns in Sect. 4.4 of this paper.
1]
| No | Column name | Units | Format | Description |
|---|---|---|---|---|
| 1 | IAUNAME | string | IAU name of the source | |
| 2 | SRCID | long | Identifier of the source | |
| 3o | OBS_ID | string | XMM-Newton observation identification (observation-specific) | |
| 4s | N_OBS | integer | Number of observations involved in the stack (stack-specific) | |
| 5s | N_CONTRIB | integer | Number of observations in which the source was fitted (stack-specific) | |
| 6 | N_EXP | integer | Number of exposures for which the source was fitted | |
| 7 | RA | deg | double | Right ascension (J2000) |
| 8 | DEC | deg | double | Declination (J2000) |
| 9 | RADEC_ERR | arcsec | float | Square root of squared sum of 1 errors in RA and DEC |
| 10 | LII | deg | double | Galactic longitude |
| 11 | BII | deg | double | Galactic latitude |
| 12 | X_IMA | pixel | float | X image coordinate |
| 13 | X_IMA_ERR | pixel | float | 1 error on X_IMA |
| 14 | Y_IMA | pixel | float | Y image coordinate |
| 15 | Y_IMA_ERR | pixel | float | 1 error on Y_IMA |
| 16 | DIST_NN | arcsec | float | Distance to the nearest neighbouring detection |
| 17 | N_BLEND | integer | Number of simultaneously fitted sources | |
| 18 | IAUNAME_4XMMDR9 | string | IAU name assigned to the nearest unique 4XMM-DR9 source | |
| 19 | SRCID_4XMMDR9 | long | Source identifier of the nearest unique source in 4XMM-DR9 | |
| 20o | DETID_4XMMDR9 | long | Identifier of the associated 4XMM-DR9 detection in this OBS_ID (observation-specific) | |
| 21 | RA_4XMMDR9 | deg | double | Mean right ascension (SC_)RA of the associated 4XMM-DR9 source / detection |
| 22 | DEC_4XMMDR9 | deg | double | Mean declination (SC_)DEC of the associated 4XMM-DR9 source / detection |
| 23 | POSERR_4XMMDR9 | arcsec | float | Statistical and systematic 4XMM-DR9 position error |
| 24 | DIST_4XMMDR9 | arcsec | double | Distance to the associated 4XMM-DR9 source |
| 25s | NDETECT_4XMMDR9 | short | Number of DR9 detections of the associated 4XMM-DR9 source | |
| 26 | EP_FLUX | erg/cm2/s | float | All-EPIC flux |
| 27 | EP_FLUX_ERR | erg/cm2/s | float | 1 error on EP_FLUX |
| 28..37 | EP__FLUX | erg/cm2/s | float | Total flux in energy band |
| EP__FLUX_ERR | erg/cm2/s | float | 1 error on EP__FLUX | |
| 38..73 | _FLUX | erg/cm2/s | float | Total EPIC pn, MOS1, MOS2 flux |
| _FLUX_ERR | erg/cm2/s | float | 1 error on _FLUX | |
| __FLUX | erg/cm2/s | float | EPIC pn, MOS1, MOS flux in energy band | |
| __FLUX_ERR | erg/cm2/s | float | 1 error on __FLUX | |
| 74 | EP_RATE | counts/s | float | All-EPIC count rate |
| 75 | EP_RATE_ERR | counts/s | float | 1 error on EP_RATE |
| 76..111 | _RATE | counts/s | float | Total EPIC pn, MOS1, MOS2 count rate |
| _RATE_ERR | counts/s | float | 1 error on _RATE | |
| __RATE | counts/s | float | EPIC pn, MOS1, MOS2 count rate in energy band | |
| __RATE_ERR | counts/s | float | 1 error on __RATE | |
| 112 | EP_CTS | counts | float | All-EPIC number of counts |
| 113 | EP_CTS_ERR | counts | float | 1 error on EP_CTS |
| 114..119 | _CTS | counts | float | EPIC pn, MOS1, MOS2 number of counts |
| _CTS_ERR | counts | float | 1 error on _CTS | |
| 120 | EP_DET_ML | float | All-EPIC equivalent maximum detection likelihood | |
| 121..138 | _DET_ML | float | EPIC pn, MOS1, MOS2 equivalent maximum detection likelihood | |
| __DET_ML | float | EPIC pn, MOS1, MOS2 detection likelihood in energy band | ||
| 139 | EXTENT | arcsec | float | Extent radius |
| 140 | EXTENT_ERR | arcsec | float | 1 error on EXTENT |
| 141 | EXTENT_ML | float | Likelihood of the detection being extended | |
| 142..149 | EP_HR | float | All-EPIC hardness ratio of energy bands and | |
| EP_HR_ERR | float | 1 error on EP_HR | ||
| 150..173 | _HR | float | EPIC pn, MOS1, MOS2 hardness ratio of energy bands and | |
| _HR_ERR | float | 1 error on _HR | ||
| 232323 denotes one of the EPIC instruments, abbreviated by PN, M1, M2. Energy band numbers run from one to five, from one to four. If a source parameter is defined for part of the rows only, it is indicated in the description and by a superscript ‘s’ to the column number for stack-specific and ‘o’ for observation-specific information. | ||||
| 174..191 | _EXP | s | float | PSF-weighted exposure in EPIC pn, MOS1, MOS2 |
| __EXP | s | float | PSF-weighted exposure in energy band of EPIC pn, MOS1, MOS2 | |
| 192..209 | _BG | counts/pixel | float | EPIC pn, MOS1, MOS2 background map at the source position |
| __BG | counts/pixel | float | EPIC pn, MOS1, MOS2 background map in energy band | |
| 210 | EP_ONTIME | s | float | Total good exposure time all-EPIC |
| 211..213 | _ONTIME | s | float | Total good exposure time in EPIC pn, MOS1, MOS2 |
| 214..216 | _PILEUP | float | Estimate of the pile-up level in EPIC pn, MOS1, MOS2 | |
| 217..219 | _MASKFRAC | float | PSF-weighted detector coverage in EPIC pn, MOS1, MOS2 | |
| 220 | DIST_REF | arcmin | float | Distance to the reference coordinates of the field |
| 221o | EP_OFFAX | arcmin | float | Off-axis angle between source position and aim point all-EPIC (observation-specific) |
| 222..224o | _OFFAX | arcmin | float | Off-axis angle between source position and aim point in EPIC pn, MOS1, MOS2 (observation-specific) |
| 225..239o | __VIG | float | EPIC pn, MOS1, MOS2 vignetting factor in energy band for the observation (observation-specific) | |
| 240 | OVERLAP | boolean | Flag marking repeatedly observed sources | |
| 241 | STACK_FLAG | short | Integer representation of the stack detection flags | |
| 242 | EP_FLAG | string | All-EPIC detection flags | |
| 243..245 | _FLAG | string | EPIC pn, MOS1, MOS2 detection flags | |
| 246 | VAR_CHI2 | float | Reduced of EPIC inter-observation variability | |
| 247..251 | VAR_CHI2_ | float | Reduced of EPIC band inter-observation variability | |
| 252 | VAR_PROB | double | Probability that VAR_CHI2 is consistent with constant EPIC flux | |
| 253..257 | VAR_PROB_ | double | Probability that VAR_CHI2_ is consistent with constant band flux | |
| 258 | FRATIO | float | EPIC flux ratio | |
| 259 | FRATIO_ERR | float | 1 error on FRATIO | |
| 260..269 | FRATIO_ | float | EPIC band flux ratio | |
| FRATIO__ERR | float | 1 error on FRATIO_ | ||
| 270 | FLUXVAR | float | Largest EPIC flux difference in terms of | |
| 271..275 | FLUXVAR_ | float | Largest EPIC band flux difference in terms of | |
| 276 | CHI2PROB_4XMMDR9 | double | Probability of the nearest unique 4XMM-DR9 source to be consistent with constant flux | |
| 277 | FVAR_4XMMDR9 | double | Fractional intra-observation excess variance of the nearest unique 4XMM-DR9 source | |
| 278 | FVARERR_4XMMDR9 | float | 1 error on FVAR_4XMMDR9 | |
| 279 | VAR_FLAG_4XMMDR9 | boolean | Intra-observation variability flag of the associated 4XMM-DR9 source | |
| 280 | SUM_FLAG_4XMMDR9 | short | Summary quality flag of the associated 4XMM-DR9 source / detection | |
| 281s | SUM_FLAG_MIN_4XMMDR9 | short | Best quality flag of the detections of the nearest unique 4XMM-DR9 source (stack-specific) | |
| 282 | MJD_FIRST | days | double | Modified Julian Date JD-2400000.5 of the observation start |
| 283 | MJD_LAST | days | double | Modified Julian Date JD-2400000.5 of the observation end |
| 284o | REVOLUT | orbit | short | XMM-Newton revolution number (observation-specific) |
| 285o | PA_PNT | deg | float | Mean position angle of the spacecraft (observation-specific) |
| 286o | OBS_CLASS | short | Observation quality from 4XMM-DR9 screening (observation-specific) | |
| 287..289o | _SUBMODE | string | EPIC pn, MOS1, MOS2 submode (observation-specific) | |
| 290..292o | _FILTER | string | EPIC pn, MOS1, MOS2 filter (observation-specific) | |
| 293o | ASTCORR | boolean | Flag: observation was astrometrically corrected (observation-specific) | |
| 294o | CC_RAOFFSET | arcsec | double | catcorr shift of the right ascension (observation-specific) |
| 295o | CC_RAOFFERR | arcsec | double | 1 error on CC_RAOFFSET (observation-specific) |
| 296o | CC_DEOFFSET | arcsec | double | catcorr shift of the declination (observation-specific) |
| 297o | CC_DEOFFERR | arcsec | double | 1 error on CC_DEOFFSET (observation-specific) |
| 298o | CC_ROT_CORR | deg | double | catcorr shift of the position angle in the field (observation-specific) |
| 299o | CC_ROT_ERR | deg | double | 1 error on CC_ROT_CORR (observation-specific) |
| 300o | CC_POFFSET | arcsec | double | catcorr total position shift of the field (observation-specific) |
| 301o | CC_POFFERR | arcsec | double | 1 error on CC_POFFSET (observation-specific) |
| 302o | CC_REFCAT | string | catcorr reference catalogue (observation-specific) | |
| 303o | CC_NMATCHES | short | catcorr number of usable matches with the reference catalogue | |
| 304..306o | _BKG_CRAREA | cts/s/arcsec2 | double | EPIC pn, MOS1, MOS2 background rate per area (observation-specific) |
| 307..309o | _BKG_CPROB | double | EPIC pn, MOS1, MOS2 Cauchy probability derived from _BKG_CRAREA (observation-specific) | |
| 310 | URL_4XMMDR9 | string | Web-page URL of the nearest unique 4XMM-DR9 source | |