B\scshapeibTeX
shadows
Making Fair ML Software using Trustworthy Explanation
Abstract.
Machine learning software is being used in many applications (finance, hiring, admissions, criminal justice) having huge social impact. But sometimes the behavior of this software is biased and it shows discrimination based on some sensitive attributes such as sex, race etc. Prior works concentrated on finding and mitigating bias in ML models. A recent trend is using instance-based model-agnostic explanation methods such as LIME(Ribeiro et al., 2016) to find out bias in the model prediction. Our work concentrates on finding shortcomings of current bias measures and explanation methods. We show how our proposed method based on K nearest neighbors can overcome those shortcomings and find the underlying bias of black box models. Our results are more trustworthy and helpful for the practitioners. Finally, We describe our future framework combining explanation and planning to build fair software.
1. Introduction
There are many scenarios where machine learning software has been found to be biased and generating arguably unfair decisions. Sentiment analyzer model from Google which is used to determine positive or negative sentiment gives negative score to some sentences like ‘I am a Jew’ and ‘I am homosexual’ (Goo, 2017). Google translate shows gender bias, when “She is an engineer, He is a nurse” is translated into Turkish and then reverted back into English becomes “He is an engineer, She is a nurse” (Caliskan et al., 2017). Amazon had to scrap an automated recruiting tool that became biased against women (Ama, 2018). A popular recidivism assessment model used by the criminal justice system shows racial discrimination(Mac, 2016). It predicts black defendants as future criminals with higher error rate than white defendants.
Researchers from Software Engineering and Machine Learning community have taken this social discrimination issue seriously and have started working on that. ACM and IEEE have started separate conferences like FAccT(FAT, 2020), FILA(FIL, 2020) for fairness of ML models. ASE 2019 organized EXPLAIN(EXP, 2019) workshop where an important topic was ML software fairness. Big industries such as IBM(AIF, 2018), Microsoft(FAT, 2018), Facebook(Fai, 2018) have started putting efforts into this domain . IEEE(IEE, 2019) and European Union(EU, 2018) published the ethical principles of AI. Fairness has been given special importance there. It is stated that an intelligent system or machine learning software must be fair if it is used in real-life applications.
In the recent SE and ML literature, we see works in mainly three directions - testing ML software to find bias(Galhotra et al., 2017; Aggarwal et al., 2019; Udeshi et al., 2018), mitigating bias in the model behavior(Calmon et al., 2017; Zhang et al., 2018; Chakraborty et al., 2020) and using model-agnostic explanation methods to visualize bias or unfairness(Ribeiro et al., 2016; Lundberg and Lee, 2017). Machine learning fairness is a rapidly evolving research domain. It started gaining attention just ten years before but within this short time period, a huge number of papers have been published. Three years before, there were only five metrics to measure classification model bias where today there are more than seventy different metrics(Cla, 2020). Kleinberg et al. stated that it is impossible to satisfy all the metrics simultaneously(Kleinberg et al., 2016). That means even if based on one metric the model looks fair but some other metrics may still complain. Berk et al. said that accuracy of a model and fairness are competing goals(Berk et al., 2017a). These findings are increasing the ambiguity of ML software fairness and practitioners are getting confused about what to do; which metric to trust; which one to choose between a better predictor and a fair predictor.
Due to these complications, a recent trend in fairness domain is to depend on interpretation or explanation tools. Two such extremely popular explanation tools are- LIME(Ribeiro et al., 2016) and SHAP(Lundberg and Lee, 2017) - they treat complex machine learning models as black-box and generate instance-based explanation in an interpretable manner. As these tools are very easy to use and a user can use these without having any knowledge about the machine learning model, practitioners have started using these to find the underlying bias of ML models(AIF, 2020). However, some recent studies have found out these explanation tools are not trustworthy and should not be used to find bias in ML models(Dimanov et al., 2020; Slack et al., 2019). The main reason is these explanation methods generate samples around the inspecting point by perturbing each feature. While doing that most of the samples generated become far from the original distribution of the training data. Thus, explanation based on those samples is completely misleading and not reliable. In this paper, we, instead of generating samples by random perturbation, use K-nearest neighbor approach to find similar data points from the training data. Our explanation approach is more trustworthy and makes it easier for domain experts to visualize the bias. This paper creates the buildings blocks of combining model fairness and explanation to create fair, trustworthy software. Overall, this paper makes the following contributions:
-
•
We comment on shortcomings of current fairness measures and explanation methods.
-
•
We propose a metric-free, nearest neighbor based approach to overcome those shortcomings.
-
•
We evaluate our approach on a publicly available, widely used dataset.
-
•
Source code is publicly available on GitHub for future researchers111https://github.com/joymallyac/Fair-Knn.
-
•
Finally, we describe our future directions towards generating policies and making plans to build fair & trustworthy ML software.
2. Background & Prior works
A ML software which is used for decision making is said to be unfair or biased if it gives undue advantages (being hired for a job, receiving loan) to a specific group of people (Sex-Male, Race-White) or individuals based on sensitive attributes. Protected attribute is an attribute that divides a population into two groups (privileged & unprivileged) that have a difference in terms of benefits received. For example, in case of credit card application, “Male” is the privileged “sex” & “Female” is the unprivileged. The goal of Group Fairness is based on the protected attribute, privileged and unprivileged groups will be treated similarly. According to IBM AIF360(Cla, 2020), there are seventy different metrics to measure group fairness. Most of them mainly try to balance the True Positive Rate (TPR) and False Positive Rate (FPR) of both groups. Four of the most used group fairness metrics are mentioned here -
-
•
Demographic Parity (DP): The TPR & FPR for both groups should be the same.
-
•
Equal Opportunity (EQ): The TPR for both groups should be the same.
-
•
Equal Accuracy (EA): The classifier accuracy for both groups should be the same.
-
•
Equal Odds (EO): The TPR and TNR for both groups should be the same.
Individual Fairness is the goal of similar individuals receiving similar outcomes. The similarity between individuals is application specific. Most of the time similar individuals are chosen based on some distance metric. The metric for measuring individual fairness is Consistency(Zemel et al., 2013).
| (1) |
Prior works in ML software fairness are of mainly two types -
a¿ Testing ML software to find bias - Galhotra et al. created THEMIS(Galhotra et al., 2017), a testing-based tool to find software discrimination, focusing on causality in discriminatory behavior. Udeshi et al. have developed AEQUITAS(Udeshi et al., 2018) tool that generates discriminatory inputs which find fairness violation. Aggarwal et al. have proposed a new testing method for black-box models(Aggarwal et al., 2019). They combined dynamic symbolic execution and local explanation to generate test cases for non-interpretable models. These are test case generation algorithms which find bias in the model behavior.
b¿ Removing bias - There are numerous algorithms to mitigate bias and achieve group fairness and individual fairness. In the case of group fairness, there are mainly three approaches -
- •
-
•
In-processing algorithms: Here the dataset is divided into three sets - train, validation and test set. After model training, model is optimized on the validation set and finally applied on the test set. Some popular works are - Adversarial debiasing (Zhang et al., 2018), Prejudice Remover (Kamishima et al., 2012)
- •
The concept of individual fairness is “similar individuals should be treated similarly”(Dwork et al., 2011). In most cases, similar individuals are chosen based on some distance metric such as Mahalanobis distance(Gillen et al., 2018). Some popular works to achieve individual fairness are - iFair(Lahoti et al., 2018), Metric-Fair Learning(Rothblum and Yona, 2018), Learning Fair Representations(Zemel et al., 2013)
3. Fairness is hard to achieve
In spite of so much prior works, machine learning fairness is still very ambiguous in nature and hard to achieve. Let’s assume an interesting decision-making scenario. An employer is selecting candidates for interviews. They are using a ML model which uses application information and returns a prediction about whether a candidate would be a good employee or not. It is found that the model is more likely to give positive predictions for one gender (e.g. male) than others (e.g. female). Some Fair-ML technique is then used to prevent this. However, as a result of this bias mitigation, a male applicant is not selected for interview. He complains, pointing to examples of females who were selected despite having qualifications very similar to his. Now what should the employer do? Should the employer continue to interview the female candidates or adjust the model again to ensure that any ‘more qualified’ male get interview calls instead? So, there is conflict between Group Fairness & Individual Fairness(Binns, 2019). If a model is optimized to achieve either of them, the other one may get damaged. Brun et al. mentioned that reducing bias for one attribute (e.g. sex) introduces bias for another attribute (e.g. race)(FAI, 2018). There are many metrics of fairness (e.g. 70 for group fairness(Cla, 2020)). But Berk et al. & Kleinberg et al. mentioned that it is impossible to satisfy all kinds of fairness simultaneously(Berk et al., 2017b; Kleinberg et al., 2016). Chakraborty et al. commented that current fairness metrics depend on absolute values of TPR & FPR and completely ignore the possibility of imbalanced class distribution(Chakraborty et al., 2020). They raised questions about reliability of these metrics in real-world scenario. Thus fairness is very hard to quantify and hence harder to achieve because validation depends on metrics.
In attempt to solve these problems, we say that we should not just depend on some metrics or we should not just optimize ML models based on some metrics. If we can interpret & visualize predicted outcomes generated by a model, then it will be easier for us to find the underlying bias and also rely on the findings. LIME(Ribeiro et al., 2016) & SHAP(Lundberg and Lee, 2017) are two recent extremely popular explanation tools. They provide instance-based explanation for any black box machine learning model. Both of them show the feature importance and feature contribution to the output for a single instance. The authors of these explanation tools claimed that these tools are trustworthy and generate reliable explanations. But recent findings show that these methods can be easily fooled(Slack et al., 2019; Dimanov et al., 2020). Slack et al. used a scaffolding technique to make a fool of LIME & SHAP and found that in some cases when a classifier is completely unfair (makes prediction based on only protected attribute) then also these explanation tools do not complain about model bias(Slack et al., 2019). Since the sample generator within LIME and SHAP presumes a normal distribution for the real data, usually it could generate out-of-distribution (OOD) synthetic data or samples. Thus explanations based on those samples can be not trustworthy and should not be used to find bias in model behavior. Dimanov & other researchers (Dimanov et al., 2020) have reached similar conclusion that we can not trust these explanation methods to find the underlying bias of ML model. So, we think that explanation of model prediction is better way to visualize bias but current explanation methods are not good enough to be trusted. We need a trustworthy explanation strategy - that is where this paper contributes.
| age | workclass | marital-status | occupation | relationship | race | sex | capital- gain | capital- loss | hours-per- week |
| 59 | Self-emp-not-inc | Married-civ-spouse | Sales | Husband | White | Male | 0 | 0 | 40 |
| 31 | Private | Married-civ-spouse | Sales | Husband | White | Male | 0 | 0 | 40 |
| 45 | Self-emp-not-inc | Married-civ-spouse | Prof-specialty | Husband | White | Male | 0 | 0 | 40 |
| 63 | Private | Separated | Prof-specialty | Not-in-family | White | Female | 0 | 0 | 40 |
| 17 | Private | Never-married | Prof-specialty | Own-child | White | Male | 0 | 0 | 40 |
| 42 | Private | Divorced | Adm-clerical | Not-in-family | Black | Female | 0 | 0 | 38 |
4. Dataset
This paper is limited to binary classification models and tabular data (row-column format). We used a real-world, publicly available dataset - “Adult Census Income” which is widely used in Software Fairness domain(Angell et al., [n.d.]; Udeshi et al., 2018). This dataset consists of survey results of the income of 48,842 adults all over the USA(ADU, 1994). The prediction task is to determine whether a person makes over 50K a year. There are two protected attributes - sex & race.
5. Proposed Framework
Here we propose a k-nearest neighbor based explanation method to find bias in a classification model. In our experiment we use logistic regression model. At first, we pre-process the data. For categorical variables, one-hot encoding is used and numeric columns are discretized. In the “Adult” dataset, there are two protected attributes - sex (Male is privileged, Female is unprivileged) & race (White is privileged, Non-white is unprivileged). The last step of pre-processing is normalization. Then we divide the dataset into two parts - training (80%) & testing (20%) with random shuffling. After train-test division, we train the logistic regression model on the train data and test it on the test data. For any test data point, if the logistic regression model predicts negative outcome (Income is ¡=50K per year), we then find K-nearest neighbor data points (nearest to the point being tested) with positive class labels in the training data. Here K is a hyperparameter that can be tuned. We tried with different values such as 5,10,20. Once we get the K-nearest neighbor data points, we see the distribution of those points and compare it with the test data point. If they only differ on protected attributes (sex,race), then we say this data point is unfairly predicted. We raise an alarm. After rerunning the experiments ten times with random shuffling, we say on average 10-17% test data points are unfairly treated for this dataset by logistic regression model.
Table 1 shows an example. The last row is the test data point which has been predicted to have negative outcome by logistic regression model. First five rows are similar data points having positive labels from the training data based on k-nearest neighbor approach. The most important features in this dataset are “capital-gain” and “capital-loss” which are same for all the rows. So, that is not the deciding factor here. For validating, we perturb all the features to see whether prediction changes or not for the last row. When we change the protected attributes (Female to Male & Black to White), the prediction changes to a positive outcome. Thus it is evident that the logistic regression model is discriminating this data point because of the value of protected attributes. This finding is similar with Galhotra et al.(Galhotra et al., 2017). They found that in this “Adult” dataset, 11% of the time, prediction changes when the value of protected attribute is flipped.
We generate this tabular explanation for all test data points which are unfairly treated. A domain expert can easily evaluate our explanations and take decision whether to change the prediction or not. If the expert decides to change the outcome and assign new outcome by majority voting of neighbors, it is a post-processing approach (please see section 2) of bias mitigation. Thus our approach finds the data points which are unfairly treated, gives explanation of the unfairness and also gives a choice of changing the outcome to make the prediction fair. Unlike LIME, SHAP or other currently used explanation methods we do not generate samples randomly. Instead we find similar data points from training data. Thus our explanation is more reliable when it comes to find bias.
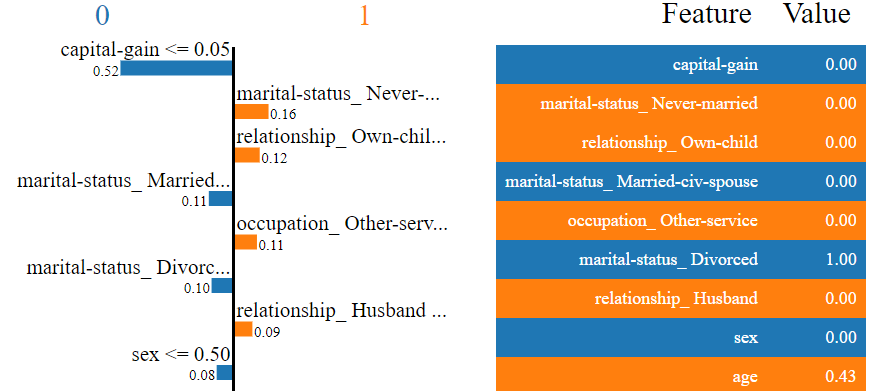
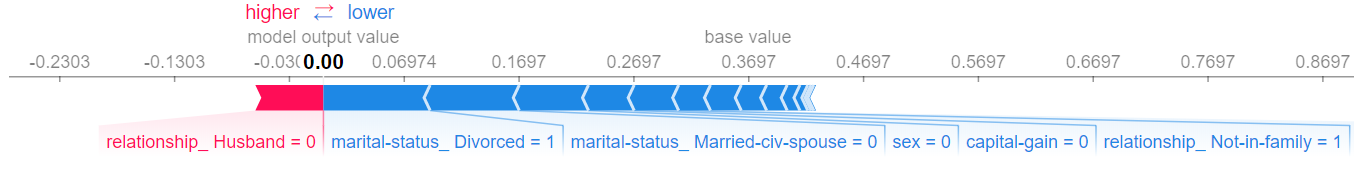
We compared our explanation with LIME and SHAP. Figure 1 and Figure 2 show the explanation provided by LIME and SHAP respectively for the same data point (last row of Table 1). For LIME (Fig 1), the features in “blue” color are responsible for negative outcome and features in “orange” color are responsible for positive outcome. The feature importance chart is showing “capital-gain” is the most important feature which is globally true but not important here as all the nearest data points have the same value of “capital-gain”. LIME has ranked “sex” as the eighth important feature and does not report “race” at all. Seeing this explanation, it is very hard to conclude that this data point is unfairly treated. For SHAP (Fig 2), the features in “blue” color are responsible for negative outcome and features in “red” color are responsible for positive outcome. SHAP explanation is showing that “marital-status” is the feature which is pushing this data point towards the negative outcome. SHAP is complaining about one protected attribute (sex) but is not reporting anything about the other protected attribute (race). Thus SHAP explanation also does not complain about unfair prediction for this particular data point. It is evident that our explanation is more valid in this scenario.
6. Future Direction
We have described a preliminary approach for finding, explaining and mitigating model bias and validated our approach for logistic regression model on a widely used dataset. Our immediate next step will be experimenting with different models and datasets. After that, we have a plan to create a tool for professional usage. We are summarizing our future course of actions to reach that goal:
-
•
In this paper, we are doing explanation based on singular instance (a single data point). But for any organization, making a future plan or creating policies is very difficult based on instance-based explanation. So, our future idea is to do global explanation. That will help an organization to make policies. We will repeat instance-based explanation for all the test data points and summarize the findings. Instead of just showing how an individual can get fair outcome, we will suggest a list of actions (plan) to give fair outcome to every individual. Thus we can combine fairness, explanation and planning.
-
•
Future work will explore different K-nn algorithms such as “ball tree” and distance metrics such as “manhattan”, “chebyshev”, “minkowski”, “wminkowski”. These are hyperparameters which we will optimize based on the application.
-
•
In this work while measuring distance every feature has been given equal importance. Depending upon the application, domain experts can suggest which attributes are more important than other. Important attributes will have higher power while measuring the distance. Thus instead of using default distance metric we need to generate a customized distance metric.
-
•
Instance-based explanation is related with individual fairness. If the same approach is repeated for all the test data points but group wise (such as Male & Female), then it will be applicable for group fairness too.
-
•
One limitation of our approach is the assumption that test data does not have a completely different distribution from training data. If that is the case, then the data points we will find using K-nn as nearest neighbors will not provide an accurate explanation for the discrimination. In that situation, we need to randomly generate samples around the instance by perturbing each feature like LIME. We should mention that this explanation could be unreliable. This is an interesting problem which will motivate future researchers to dig deep.
7. Conclusion
This NIER paper describes the shortcomings of current fairness measures and problems of finding underlying ML model bias using current explanation methods. A metric-free, K-nn based preliminary method is then proposed to explain & visualize bias in the model behavior. Initial results of this approach outperform two state of the art explanation tools - LIME(Ribeiro et al., 2016) & SHAP(Lundberg and Lee, 2017).
Though software engineering community has taken the fairness problem of ML software seriously, we see very few papers are coming out from SE researchers. We hope this paper will motivate current SE community to actively work on this domain and collaborate with ML researchers & industries to solve this problem together.
References
- (1)
- ADU (1994) 1994. UCI:Adult Data Set. (1994). http://mlr.cs.umass.edu/ml/datasets/Adult
- Mac (2016) 2016. Machine Bias. www.propublica.org (May 2016). https://www.propublica.org/article/machine-bias-risk-assessments-in-criminal-sentencing
- Goo (2017) 2017. Google’s Sentiment Analyzer Thinks Being Gay Is Bad. Motherboard (Oct 2017). https://bit.ly/2yMax8V
- AIF (2018) 2018. AI Fairness 360: An Extensible Toolkit for Detecting, Understanding, and Mitigating Unwanted Algorithmic Bias. (10 2018). https://github.com/IBM/AIF360
- Ama (2018) 2018. Amazon scraps secret AI recruiting tool that showed bias against women. (Oct 2018). https://www.reuters.com/article/us-amazon-com-jobs-automation-insight/amazon-scraps-secret-ai-recruiting-tool-that-showed-bias-against-women-idUSKCN1MK08G
- EU (2018) 2018. Ethics Guidelines for Trustworthy Artificial Intelligence. https://ec.europa.eu/digital-single-market/en/news/ethics-guidelines-trustworthy-ai
- Fai (2018) 2018. Facebook says it has a tool to detect bias in its artificial intelligence. (2018). https://qz.com/1268520/facebook-says-it-has-a-tool-to-detect-bias-in-its-artificial-intelligence/
- FAI (2018) 2018. FAIRWARE 2018:International Workshop on Software Fairness. (2018). http://fairware.cs.umass.edu/
- FAT (2018) 2018. FATE: Fairness, Accountability, Transparency, and Ethics in AI. (2018). https://www.microsoft.com/en-us/research/group/fate/
- IEE (2019) 2019. Ethically-Aligned Design: A Vision for Prioritizing Human Well-Begin with Autonomous and Intelligence Systems.
- EXP (2019) 2019. EXPLAIN 2019. (2019). https://2019.ase-conferences.org/home/explain-2019
- FAT (2020) 2020. ACM Conference on Fairness, Accountability, and Transparency (ACM FAT*). (2020). https://fatconference.org/
- Cla (2020) 2020. aif360.metrics.ClassificationMetric. https://aif360.readthedocs.io/en/latest/modules/generated/aif360.metrics.ClassificationMetric.html#aif360.metrics.ClassificationMetric
- FIL (2020) 2020. International Workshop on Fair and Interpretable Learning Algorithms. (2020). http://tiny.cc/FILA
- AIF (2020) 2020. LIME - Local Interpretable Model-Agnostic Explanations can be used with models learnt with the AIF 360 toolkit to generate explanations for model predictions. (2020). https://github.com/IBM/AIF360/blob/master/examples/demo_lime.ipynb
- Aggarwal et al. (2019) Aniya Aggarwal, Pranay Lohia, Seema Nagar, Kuntal Dey, and Diptikalyan Saha. 2019. Black Box Fairness Testing of Machine Learning Models. In Proceedings of the 2019 27th ACM Joint Meeting on European Software Engineering Conference and Symposium on the Foundations of Software Engineering (Tallinn, Estonia) (ESEC/FSE 2019). ACM, New York, NY, USA, 625–635. https://doi.org/10.1145/3338906.3338937
- Angell et al. ([n.d.]) Rico Angell, Brittany Johnson, Yuriy Brun, and Alexandra Meliou. [n.d.]. Themis: Automatically Testing Software for Discrimination (ESEC/FSE 18). 5. https://doi.org/10.1145/3236024.3264590
- Berk et al. (2017a) Richard Berk, Hoda Heidari, Shahin Jabbari, Michael Kearns, and Aaron Roth. 2017a. Fairness in Criminal Justice Risk Assessments: The State of the Art. arXiv:1703.09207 [stat.ML]
- Berk et al. (2017b) Richard Berk, Hoda Heidari, Shahin Jabbari, Michael Kearns, and Aaron Roth. 2017b. Fairness in Criminal Justice Risk Assessments: The State of the Art. Sociological Methods & Research (03 2017). https://doi.org/10.1177/0049124118782533
- Binns (2019) Reuben Binns. 2019. On the Apparent Conflict Between Individual and Group Fairness. arXiv:1912.06883 [cs.LG]
- Caliskan et al. (2017) Aylin Caliskan, Joanna J. Bryson, and Arvind Narayanan. 2017. Semantics derived automatically from language corpora contain human-like biases. Science 356, 6334 (2017), 183–186. https://doi.org/10.1126/science.aal4230 arXiv:https://science.sciencemag.org/content/356/6334/183.full.pdf
- Calmon et al. (2017) Flavio Calmon, Dennis Wei, Bhanukiran Vinzamuri, Karthikeyan Natesan Ramamurthy, and Kush R Varshney. 2017. Optimized Pre-Processing for Discrimination Prevention. In Advances in Neural Information Processing Systems 30, I. Guyon, U. V. Luxburg, S. Bengio, H. Wallach, R. Fergus, S. Vishwanathan, and R. Garnett (Eds.). Curran Associates, Inc., 3992–4001. http://papers.nips.cc/paper/6988-optimized-pre-processing-for-discrimination-prevention.pdf
- Chakraborty et al. (2020) Joymallya Chakraborty, Suvodeep Majumder, Zhe Yu, and Tim Menzies. 2020. Fairway: A Way to Build Fair ML Software. arXiv:2003.10354 [cs.SE]
- Dimanov et al. (2020) Botty Dimanov, Umang Bhatt, Mateja Jamnik, and Adrian Weller. 2020. You Shouldn’t Trust Me: Learning Models Which Conceal Unfairness From Multiple Explanation Methods. In SafeAI@AAAI.
- Dwork et al. (2011) Cynthia Dwork, Moritz Hardt, Toniann Pitassi, Omer Reingold, and Rich Zemel. 2011. Fairness Through Awareness. arXiv:1104.3913 [cs.CC]
- Galhotra et al. (2017) Sainyam Galhotra, Yuriy Brun, and Alexandra Meliou. 2017. Fairness testing: testing software for discrimination. Proceedings of the 2017 11th Joint Meeting on Foundations of Software Engineering - ESEC/FSE 2017 (2017). https://doi.org/10.1145/3106237.3106277
- Gillen et al. (2018) Stephen Gillen, Christopher Jung, Michael Kearns, and Aaron Roth. 2018. Online Learning with an Unknown Fairness Metric. arXiv:1802.06936 [cs.LG]
- Hardt et al. (2016) Moritz Hardt, Eric Price, and Nathan Srebro. 2016. Equality of Opportunity in Supervised Learning. arXiv:1610.02413 [cs.LG]
- Kamiran and Calders (2012) Faisal Kamiran and Toon Calders. 2012. Data preprocessing techniques for classification without discrimination. Knowledge and Information Systems 33, 1 (01 Oct 2012), 1–33. https://doi.org/10.1007/s10115-011-0463-8
- Kamiran et al. (2018) Faisal Kamiran, Sameen Mansha, Asim Karim, and Xiangliang Zhang. 2018. Exploiting Reject Option in Classification for Social Discrimination Control. Inf. Sci. (2018). https://doi.org/10.1016/j.ins.2017.09.064
- Kamishima et al. (2012) Toshihiro Kamishima, Shotaro Akaho, Hideki Asoh, and Jun Sakuma. 2012. Fairness-Aware Classifier with Prejudice Remover Regularizer. In Machine Learning and Knowledge Discovery in Databases, Peter A. Flach, Tijl De Bie, and Nello Cristianini (Eds.). Springer Berlin Heidelberg, Berlin, Heidelberg, 35–50.
- Kleinberg et al. (2016) Jon Kleinberg, Sendhil Mullainathan, and Manish Raghavan. 2016. Inherent Trade-Offs in the Fair Determination of Risk Scores. arXiv:1609.05807 [cs.LG]
- Lahoti et al. (2018) Preethi Lahoti, Krishna P. Gummadi, and Gerhard Weikum. 2018. iFair: Learning Individually Fair Data Representations for Algorithmic Decision Making. arXiv:1806.01059 [cs.LG]
- Lundberg and Lee (2017) Scott M Lundberg and Su-In Lee. 2017. A Unified Approach to Interpreting Model Predictions. In Advances in Neural Information Processing Systems 30, I. Guyon, U. V. Luxburg, S. Bengio, H. Wallach, R. Fergus, S. Vishwanathan, and R. Garnett (Eds.). Curran Associates, Inc., 4765–4774. http://papers.nips.cc/paper/7062-a-unified-approach-to-interpreting-model-predictions.pdf
- Pleiss et al. (2017) Geoff Pleiss, Manish Raghavan, Felix Wu, Jon Kleinberg, and Kilian Q. Weinberger. 2017. On Fairness and Calibration. arXiv:1709.02012 [cs.LG]
- Ribeiro et al. (2016) Marco Tulio Ribeiro, Sameer Singh, and Carlos Guestrin. 2016. “Why Should I Trust You?”: Explaining the Predictions of Any Classifier. In Proceedings of the 22nd ACM SIGKDD International Conference on Knowledge Discovery and Data Mining (San Francisco, California, USA) (KDD ’16). Association for Computing Machinery, New York, NY, USA, 1135–1144. https://doi.org/10.1145/2939672.2939778
- Rothblum and Yona (2018) Guy N. Rothblum and Gal Yona. 2018. Probably Approximately Metric-Fair Learning. arXiv:1803.03242 [cs.LG]
- Slack et al. (2019) Dylan Slack, Sophie Hilgard, Emily Jia, Sameer Singh, and Himabindu Lakkaraju. 2019. Fooling LIME and SHAP: Adversarial Attacks on Post hoc Explanation Methods. arXiv:1911.02508 [cs.LG]
- Udeshi et al. (2018) Sakshi Udeshi, Pryanshu Arora, and Sudipta Chattopadhyay. 2018. Automated directed fairness testing. Proceedings of the 33rd ACM/IEEE International Conference on Automated Software Engineering - ASE 2018 (2018). https://doi.org/10.1145/3238147.3238165
- Zemel et al. (2013) Rich Zemel, Yu Wu, Kevin Swersky, Toni Pitassi, and Cynthia Dwork. 2013. Learning Fair Representations. In Proceedings of the 30th International Conference on Machine Learning (Proceedings of Machine Learning Research), Sanjoy Dasgupta and David McAllester (Eds.), Vol. 28. PMLR, Atlanta, Georgia, USA, 325–333. http://proceedings.mlr.press/v28/zemel13.html
- Zhang et al. (2018) Brian Hu Zhang, Blake Lemoine, and Margaret Mitchell. 2018. Mitigating Unwanted Biases with Adversarial Learning. arXiv:1801.07593 [cs.LG]