11email: paolo.ventura@inaf.it 22institutetext: Konkoly Observatory, Research Centre for Astronomy and Earth Sciences, Konkoly Thege Miklós út 15-17, H-1121 Budapest, Hungary 33institutetext: ELTE Eötv”os Loránd University, Institute of Physics, Budapest 1117, Pázmány Péter sétány 1/A, Hungary 44institutetext: School of Physics and Astronomy, Monash University, VIC 3800, Australia 55institutetext: INAF, Astrophysics and Space Science Observatory, Via Piero Gobetti 93/3, 40129 Bologna, Italy 66institutetext: Dipartimento di Fisica e Astronomia “Galileo Galilei”, Univ. di Padova, Vicolo dell’Osservatorio 3, Padova, IT-35122
Gas and dust from metal-rich AGB stars
Abstract
Context. Stars evolving through the asymptotic giant branch (AGB) phase provide significant feedback to their host system, in form of both gas enriched in nuclear-burning products and dust formed in their winds, which they eject into the interstellar medium. Therefore AGB stars are an essential ingredient for the chemical evolution of the Milky Way and other galaxies.
Aims. We study AGB models with super-solar metallicity, to complete our large database, so far extending from metal-poor to solar chemical compositions. We provide chemical yields for masses in the range and metallicities and . We also study dust production in this metallicity domain.
Methods. We calculated the evolutionary sequences from the pre main sequence through the whole AGB phase. We follow the variation of the surface chemical composition to calculate the chemical yields of the various species and model dust formation in the winds to determine the dust production rate and the total dust mass produced by each star during the AGB phase.
Results. The physical and chemical evolution of the star is sensitive to the initial mass: stars experience hot bottom burning, whereas the surface chemistry of the lower mass counterparts is altered only by third dredge-up. The carbon-star phase is reached by stars of metallicity , whereas all the stars (except the ) remain O-rich for the whole AGB phase. Most of the dust produced by metal-rich AGBs is in the form of silicates particles. The total mass of dust produced increases with the mass of the star, reaching for stars.
Key Words.:
stars: AGB and post-AGB – stars: abundances – stars: evolution – stars: winds and outflows1 Introduction
The recent years have witnessed a growing interest towards stars evolving through the asymptotic giant branch (AGB) phase because they have been recognized to play an important role in several astrophysical contexts, from the interpretation of the chemical patterns traced by Milky Way stars (e.g. Romano et al. 2010), to the formation of multiple population in globular clusters (Ventura et al., 2001; D’Ercole et al., 2008), and the contribution to the overall dust budget in the Local Universe and at high redshift (Valiante et al., 2009). Several groups have modelled this stellar evolutionary phase, characterized by the occurrence of a series of thermal pulses (TP), providing an accurate description of the main evolutionary and structural properties of AGB stars of different mass and metallicity and the chemical yields from these objects, which are essential ingredients to understand the feedback from these stars to the host system (Cristallo et al., 2011, 2015; Karakas, 2010; Karakas & Lattanzio, 2014; Karakas et al., 2018).
Recent models also couple the modelling of the AGB evolution with the description of the dust formation process that takes place in the wind expanding from the central star (e.g., Ventura et al. 2012, 2014b, Nanni et al. 2013, 2014). Our research has been so far mostly focused on metal-poor (Ventura et al., 2012; Di Criscienzo et al., 2013) and sub-solar metallicity (Ventura et al., 2014a) AGB models. The former were used to explore the dust contribution from AGB stars at high redshift and in Local Group galaxies harbouring only metal-poor populations (Dell’Agli et al., 2019); the models were the starting point to characterize the evolved populations of the Magellanic Clouds (Dell’Agli et al., 2014b, 2015a, 2015b). The advent of Gaia pushed the interest towards solar metallicities, which were studied by Di Criscienzo et al. (2016) and Ventura et al. (2018). In this paper we make a step forward, studying the behaviour of AGB stars of super-solar metallicity, and .
The exploration of the super-solar metallicity regime is particularly important given the recent results from Galactic surveys (Casagrande et al., 2011; Bensby et al., 2014), that showed that stars with ages in the range Gyr currently found in the solar neighbourhood span the metallicity range from to solar, which can be interpreted as the effects of migration mechanisms taking place within the Galaxy (Minchev et al., 2013; Kubryk et al., 2015; Spitoni et al., 2015). Furthermore, recent studies showing evidences for a significant fraction of metal-rich stars in the Galactic centre (Schultheis et al., 2019) suggest that this region is characterized by a very high average metallicity, of the order of solar. Thorsbro et al. (2020) analysed a sample of giants in the Galactic centre and found a metallicity distribution extended to FeH. Lastly, we recall recent results selected from LAMOST, combined with Gaia DR2 data, that outline the presence of super metal-rich stars, both with thin disk and thick disk kinematics, which again invoke radial migration. Out of the Milky Way, super metal-rich stars were suggested as possible major component in the nuclear regions of massive elliptical galaxies (Bertola et al., 1995).
While understanding the gas pollution from metal-rich stars is crucial for the studies of the Milky Way and other galaxies, most current grids of stellar yields in literature cover up only to solar metallicity. When the yields are implemented in galactic chemical evolution models, some interpolation is needed between adiacent metallicity grids. Unless the yields vary monotonically with metallicity, this is clearly an unsafe procedure. When the metallicity exceeds solar, the yields are either kept the same as their solar values or extrapolated somehow, with the first choice being the most common one. While this does not affect the results of chemical evolution studies focusing on dwarf galaxies or the external regions of the Milky Way, it might severely affect the predictions about the inner Galaxy evolution, as well as the interpretation of data for massive ellipticals at both low and high redshifts. In fact, when large fractions of super-solar metallicity stars are formed, the adoption of solar-metallicity yields may result in spurious results. As far as AGB stars are concerned, this is especially true for elements such as He, 13C, 14N, and 17O that are produced in significant amounts by intermediate-mass stars.
Models of nucleosynthesis and dust formation for AGB stars of super-solar metallicity are also needed to address the origin of meteoritic stardust grains, the vast majority of which originated from AGB stars (see, e.g., the review by Zinner, 2014). Based on their isotopic anomalies, it has been proposed that a significant fraction of silicon carbide (SiC) grains extracted from meteorites originated from AGB stars of super-solar metallicity (Lugaro et al., 2014, 2018) and that the efficiency of the formation of SiC dust around AGB stars as function of the metallicity may be responsible for the higher than expected number of grains from super-solar metallicity AGB stars (Lewis et al., 2013). Furthermore, SiC grains from such AGB stars of super-solar metallicity are the best candidates to be the mineral carriers responsible for the anomalies in the elements heavier than iron predominant in different Solar System bodies, and provide us information on the evolution of dust in the protosolar disc (Ek et al., 2019). Also to address the problems related to meteoritic stardust, the models of metallicities up to above solar, including both nucleosynthesis and dust formation, represent one of the most promising current tools.
The paper is organised as follows: in Section 2 we discuss the main uncertainties affecting the modelling of the AGB phase; Section 3 presents the numerical and physical ingredients used to model the evolution of the stars and of the dust formation process; the evolution of stars before and during the AGB phase are described in Section 4 and 5, respectively; Section 6 regards the chemical yields of the stars. In Section 7 our results are compared to models of similar metallicity available in the literature; in Section 8 the properties of the dust formed in the wind of AGB stars, in terms of grain size distribution, the dust production rate, and the mass of dust formed, are reported; in Section 9 the conclusions are given.
2 The uncertainties affecting AGB modelling
Before describing the physical and numerical ingredients used in the present investigation, we believe important to stress that the results regarding the AGB modelling are rendered uncertain by the scarse knowledge of two physical mechanisms, relevant for the description of the evolution of these stars, still poorly known from first principles: convection and mass loss (Karakas & Lattanzio, 2014).
The importance of convection on the AGB evolution is twofold, as the description of convective regions concerns both the efficiency of the convective modality of transport of energy and the location of the border of the instability regions, within which mixing of chemicals takes place.
The efficiency of convection reflects into the temperature gradient and is particularly relevant to determine the temperature at the base of the external mantle, which, in turn, is connected with the possible ignition of hot bottom burning (hereinafter HBB), which consists in the activation of proton captures in the most internal regions of the convective envelope, once the temperatures exceed MK (Renzini & Voli, 1981; Blöcker & Schöenberner, 1991; Sackmann & Boothroyd, 1991). Ventura & D’Antona (2005a) showed that the strength of HBB is extremely sensitive to convection modelling and, within the classic mixing length theory schematization, to the choice of the free parameter , giving the mixing length in terms of the local value of the pressure scale height. The AGB phase is the only case, within the stellar astrophysical context, where the choice of the convective model affects not only the external temperature and the colours, but also the physical evolution of the star, namely the luminosity reached and the duration of this peculiar evolutionary phase (Ventura & D’Antona, 2005a).
An important point related to convection is the location of the borders of the instability regions. Within the context of AGB modelling, it is of paramount importance to determine the extent of the third dredge-up (hereinafter TDU). The TDU consists in the inwards penetration of the convective envelope, taking place after each thermal pulse of the He burning shell, down to layers previously affected by nucleosynthesis via the triple-alpha reactions, thus enriched in carbon (Iben, 1974). When the plain Schwartzschild criterion is adopted, with no assumptions regarding possible extra-mixing from the bottom of the convective envelope, the extent of TDU is too small to reproduce the observational evidence, particularly the luminosity function of carbon stars in the Magellanic Clouds (but see Straniero et al. 1997 on the possibility that models without extra-mixing are able to produce a deep TDU). An early algorithm aimed at calculating the extent of the extra-mixed zone was proposed by Lattanzio (1986) and is still used by the team using the MONASH code (Karakas, 2014; Karakas & Lattanzio, 2014; Karakas et al., 2018). Several research groups adopt a velocity profile decaying from the base of the envelope towards the stellar interior, with the e-folding distance of the decay being treated as a free parameter (Herwig, 2000, 2005; Cristallo et al., 2009; Weiss & Ferguson, 2009). We reiterate here that all these treatments require some ad hoc assumptions, because the details of the mixing mechanism, and more generally of the convective phenomenon, close to the borders, is substantially unknown from first principles: the extent of TDU can be empirically determined by fitting the observational scenario, but cannot be found on the basis of solid physical arguments.
The description of mass loss has an extreme importance in the modelling of the AGB phase, comparable to the role played by convection. The rate at which the mass of the envelope of AGB stars is expelled into the interstellar medium affects the duration of the AGB phase and has relevant effects onto the largest luminosity reached, the degree of nucleosynthesis associated to HBB and the amount of carbon that is gradually accumulated in the surface regions via TDU (Ventura & D’Antona, 2005b).
Mass loss is commonly described by analytical relations, that allow the computation of as a function of the main stellar parameters, in particular the radius and the surface gravity.
Several evolutionary codes adopt the classic period - mass loss rate relation by Vassiliadis & Wood (1993), which was calibrated on the basis of Galactic Mira variables and pulsation OH/IR stars in the Galaxy and the Large Magellanic Cloud. The Vassiliadis & Wood (1993) recipe is used both for O-rich and carbon stars (Cristallo et al., 2009; Karakas & Lattanzio, 2014).
Some groups (Weiss & Ferguson, 2009) model mass loss during the O-rich AGB phases via the empirical period - mass loss relation by van Loon et al. (2005), which is based on the observations of dust-enshrouded M-stars in the Magellanic Clouds. One of the most widely used prescriptions for mass loss by M-rich AGBs is the treatment by Blöcker (1995), based on hydrodynamical models of pulsating M-type stars (Karakas et al., 2018; Pignatari et al., 2016).
Regarding the C-rich phase, alternatively to Vassiliadis & Wood (1993), several research teams have based their computations on the theoretical radiation-hydrodynamical models published by the Berlin group (Wachter et al., 2002, 2008), which consider dust production in C-rich winds, and the effects of radiation pressure on the carbonaceous dust particles formed in the circumstellar envelope (Weiss & Ferguson, 2009; Ventura et al., 2018).
The main shortcoming of the use of the above prescriptions is their application to a wide range of mass and metallicities, despite these relationships have been derived on the basis of limited sample of stars, mostly homogeneous in the chemical composition. Furthermore, some of these prescriptions contain free parameters (e.g. the Reimers parameter entering the Blöcker (1995) recipe) than needs further calibration.
The situation is even more complex for C-stars, if we consider that the formulae by Wachter et al. (2002, 2008) do not include any dependence on the actual carbon excess with respect to oxygen, which intuitively should affect the amount of dust formed in the wind of the stars. Wachter et al. (2002) showed that the dependence of the mass loss rate on this quantity is weak enough to be ignored in comparison with all other uncertainties, but this statement was seriously argued by Mattsson et al. (2008), who stressed the decisive role of the carbon excess in the dust formation process and in the determination of the mass loss rate.
3 Physical and numerical input
3.1 Stellar evolution modelling
The models presented in this paper were calculated with the ATON stellar evolution code (Ventura et al., 1998). An exhaustive description of the numerical details of the code and the most recent updates can be found in Ventura et al. (2013). The models span the mass interval . The metallicities used are and and the scaled-solar mixture adopted is taken from Grevesse & Sauval (1998). The initial helium is . The models not undergoing the helium flash were evolved from the pre-main sequence until the almost total consumption of the envelope. Low-mass models () experiencing the helium flash were evolved from the horizontal branch, starting from the total mass, core mass and surface chemical composition calculated until the tip of the red giant branch.
The temperature gradient within regions unstable to convection is calculated via the full spectrum of turbulence (FST) model (Canuto & Mazzitelli, 1991). Overshoot of convective eddies within radiatively stable regions is modeled by assuming that the velocity of convective elements decay exponentially beyond the neutrality point, fixed via the Schwartzschild criterion. The e-folding distance of the velocity decays during the core (hydrogen and helium) burning phases and during the AGB phase is taken as and , respectively. The former was calibrated on the basis of the observed width of the main sequences of open clusters (Ventura et al., 1998), while the latter was found by reproducing the luminosity function of carbon stars in the Magellanic Clouds (Ventura et al., 2014c).
The mass loss rate for oxygen-rich models is determined via the Blöcker (1995) treatment with the parameter entering the Blöcker (1995)’s formula set to , following the calibration given in Ventura et al. (2000). For carbon stars we implemented the description of mass loss from the Berlin group (Wachter et al., 2002, 2008).
The radiative opacities are calculated according to the OPAL release, in the version documented by Iglesias & Rogers (1996). The molecular opacities in the low-temperature regime ( K) are calculated with the AESOPUS tool (Marigo & Aringer, 2009). The opacities are constructed self-consistently, by following the changes in the chemical composition of the envelope, particularly of the individual abundances of carbon, nitrogen, and oxygen.
3.2 Dust production
The formation and growth of dust particles in the wind of AGB stars is described according to the schematization proposed by the Heidelberg group (Ferrarotti & Gail, 2006), previously used by our team (Ventura et al., 2012, 2014b, 2015, 2016) and in a series of papers by the Padua group (Nanni et al., 2013, 2014, 2016, 2018, 2019, 2020). All the relevant equations can be found in Ventura et al. (2012). Here we only provide a brief description of the methodology.
Dust particles are assumed to form and grow in the wind, which expands isotropically from the central star. The dynamics of the wind is described by the momentum equation, where the acceleration is determined by the balance between gravity and radiation pressure acting on the newly formed dust grains. The coupling between grain growth and wind dynamics is given by the extinction coefficients, describing absorption and scattering of the radiation by dust particles. The evolution with time of dust grains is determined by the balance between the growth and the vaporization rate. The former is given by the gas molecules hitting the already formed grains and the latter is related to the vapour pressure of gaseous molecules over the solid compounds. Regarding the dust species formed, in oxygen-rich environments the most stable compounds are considered: silicates, alumina dust (Al2O3) and solid iron. In the winds of carbon stars the species considered are silicon carbide (SiC), solid carbon and solid iron. This description allows the determination of the surface fraction of gaseous silicon, aluminium, iron, and carbon condensed into dust particles (see eq. 20-23 and 34-35 in Ferrarotti & Gail 2006) and the dust production rate for each dust species, which depends on the gas rate of mass loss, the surface mass fractions of the afore mentioned chemical elements, and the fraction of the latter species condensed into dust (see Section 5.2 in Ferrarotti & Gail 2006).
| MM⊙ | MM⊙ | MM⊙ | CO | ||||||
|---|---|---|---|---|---|---|---|---|---|
| 1.00 | 1.14(10) | 8.65(7) | 2.76(7) | 7.57(5) | 0.538 | 0.560 | 4.86(3) | 2.24(6) | 0.38 |
| 1.25 | 4.91(9) | 1.12(8) | 1.73(7) | 1.14(6) | 0.539 | 0.582 | 6.30(3) | 2.98(6) | 0.38 |
| 1.50 | 2.77(9) | 1.09(8) | 2.90(7) | 1.16(6) | 0.551 | 0.615 | 8.17(3) | 3.68(6) | 0.34 |
| 2.00 | 1.20(9) | 1.51(8) | 1.93(7) | 2.34(6) | 0.530 | 0.653 | 1.12(4) | 6.73(6) | 1.03 |
| 2.50 | 6.35(8) | 2.11(8) | 2.16(7) | 2.61(6) | 0.527 | 0.688 | 1.45(4) | 1.35(7) | 1.08 |
| 3.00 | 3.83(8) | 1.11(8) | 1.20(7) | 1.71(6) | 0.575 | 0.699 | 1.56(4) | 2.15(7) | 1.27 |
| 3.50 | 2.52(8) | 6.38(7) | 6.41(6) | 9.77(5) | 0.662 | 0.786 | 2.20(4) | 5.45(7) | 1.09 |
| 4.00 | 1.76(8) | 3.92(7) | 3.73(6) | 4.12(5) | 0.766 | 0.849 | 2.89(4) | 7.55(7) | 0.018 |
| 4.50 | 1.30(8) | 2.67(7) | 2.22(6) | 2.35(5) | 0.837 | 0.893 | 3.72(4) | 8.09(7) | 0.075 |
| 5.00 | 9.94(7) | 1.89(7) | 1.53(6) | 2.02(5) | 0.869 | 0.922 | 4.37(4) | 8.28(7) | 0.065 |
| 5.50 | 7.89(7) | 1.45(7) | 1.01(6) | 1.65(5) | 0.905 | 0.951 | 5.13(4) | 8.51(7) | 0.031 |
| 6.00 | 6.42(7) | 1.09(7) | 7.38(5) | 1.35(5) | 0.940 | 0.972 | 6.10(4) | 8.75(7) | 0.032 |
| 6.50 | 5.36(7) | 8.74(6) | 5.11(5) | 1.01(5) | 0.990 | 1.022 | 7.06(4) | 9.06(7) | 0.030 |
| 7.00 | 4.53(7) | 7.59(6) | 3.11(5) | 8.39(4) | 1.095 | 1.052 | 8.04(4) | 9.38(7) | 0.033 |
| 8.00 | 3.42(7) | 5.34(6) | 1.99(5) | 4.32(4) | 0.000 | 1.210 | 9.57(4) | 9.91(7) | 0.048 |
| 1.00 | 1.35(10) | 1.31(8) | 1.82(7) | 6.92(5) | 0.540 | 0.560 | 4.74(3) | 2.26(6) | 0.38 |
| 1.25 | 5.73(9) | 1.21(8) | 1.91(7) | 1.03(6) | 0.551 | 0.578 | 5.98(3) | 2.92(6) | 0.38 |
| 1.50 | 3.19(9) | 1.28(8) | 1.56(7) | 1.37(6) | 0.550 | 0.608 | 7.87(3) | 3.73(6) | 0.35 |
| 2.00 | 1.38(9) | 1.52(8) | 2.30(7) | 2.12(6) | 0.538 | 0.666 | 1.14(4) | 6.08(6) | 0.59 |
| 2.50 | 7.07(8) | 2.32(8) | 2.39(7) | 2.58(6) | 0.543 | 0.699 | 1.40(4) | 1.13(7) | 1.08 |
| 3.00 | 4.21(8) | 1.19(8) | 1.41(7) | 2.02(6) | 0.574 | 0.732 | 1.67(4) | 2.06(7) | 0.83 |
| 3.50 | 2.73(8) | 6.89(7) | 7.73(6) | 1.18(6) | 0.648 | 0.769 | 2.00(4) | 4.79(7) | 0.88 |
| 4.00 | 1.90(8) | 4.31(7) | 4.47(6) | 5.02(5) | 0.744 | 0.839 | 2.84(4) | 7.10(7) | 0.017 |
| 4.50 | 1.39(8) | 2.93(7) | 2.81(6) | 2.54(5) | 0.834 | 0.882 | 3.65(4) | 7.80(7) | 0.019 |
| 5.00 | 1.05(8) | 2.12(7) | 1.86(6) | 2.18(5) | 0.866 | 0.908 | 4.26(4) | 8.05(7) | 0.022 |
| 5.50 | 8.27(7) | 1.48(7) | 1.29(6) | 1.71(5) | 0.900 | 0.946 | 5.04(4) | 8.17(7) | 0.021 |
| 6.00 | 6.71(7) | 1.18(7) | 9.43(5) | 1.53(5) | 0.928 | 0.957 | 5.82(4) | 8.45(7) | 0.022 |
| 6.50 | 5.56(7) | 9.30(6) | 6.72(5) | 1.33(5) | 0.968 | 1.023 | 6.76(4) | 8.63(7) | 0.027 |
| 7.00 | 4.67(7) | 7.43(6) | 5.09(5) | 9.88(4) | 1.010 | 1.031 | 7.53(4) | 8.73(7) | 0.028 |
| 8.00 | 3.49(7) | 5.06(6) | 2.87(5) | 4.31(4) | 0.000 | 1.180 | 8.53(4) | 8.93(7) | 0.031 |
4 The evolutionary phases before the AGB
The and evolutionary sequences discussed in the present investigation were calculated from the pre-MS phase until the almost complete ejection of the external mantle. A summary of the main properties of the models presented here, regarding the core hydrogen and helium burning phases and the AGB evolution, are reported in Table 1.
Before the beginning of the AGB phase the stars experience two episodes during which the surface convection penetrates inwards, until reaching zones of the star previously contaminated by nuclear activity: the first dredge-up episode takes place during the ascending of the red giant branch, while the second dredge-up occurs after the core helium burning phase, before the ignition of the first TP. These mixing events are extremely important, as they determine the surface chemical composition of the star at the beginning of the AGB phase. While the first dredge-up changes the surface chemical composition of all stars, the second dredge-up, in the metallicity domain investigated here, is experienced only by stars. This second dredge-up event is relevant for the subsequent evolution of the stars during the AGB phase, as is causes a significant decrease in the core mass of the star, which will affect the main properties of the AGB evolution.
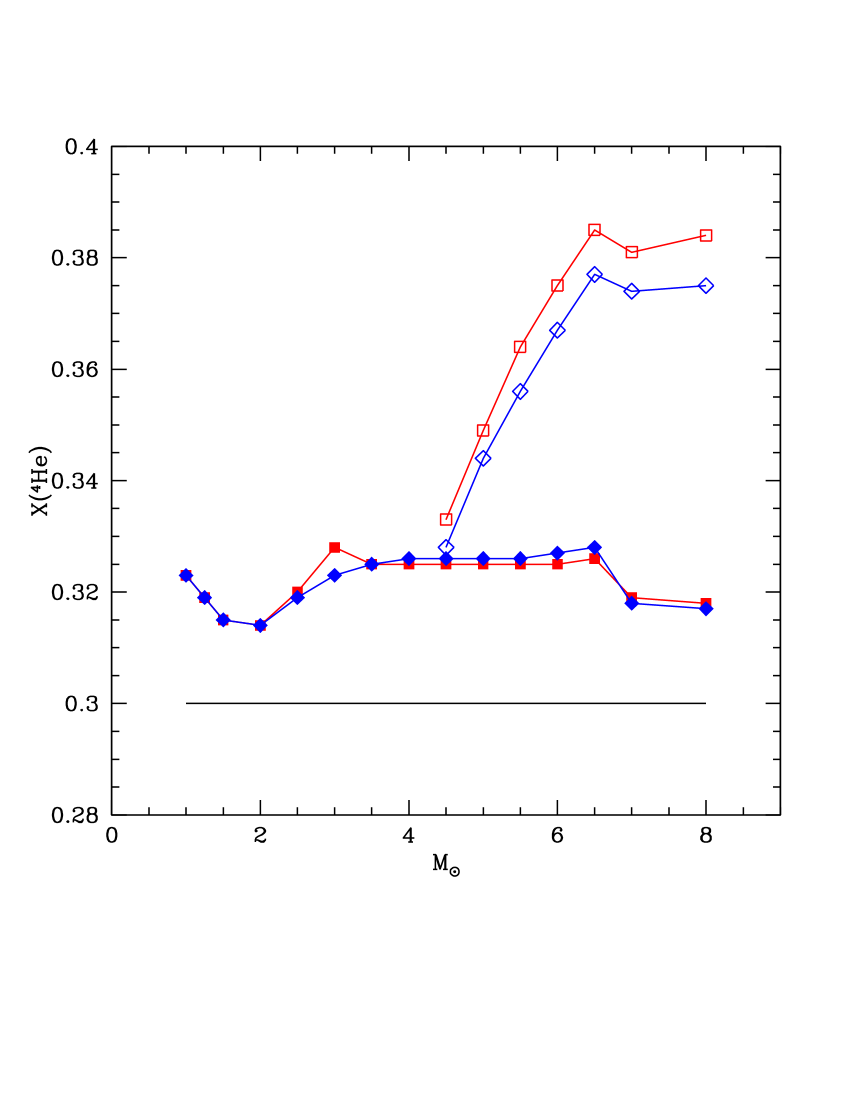
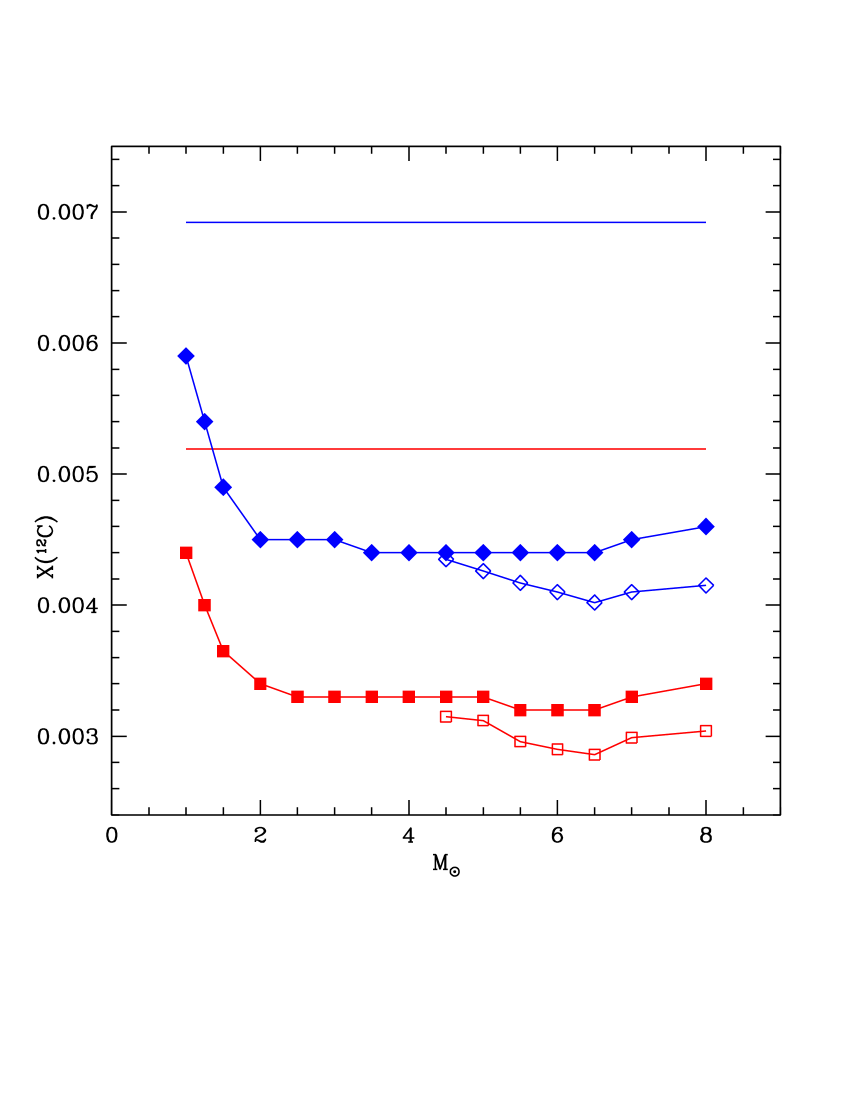
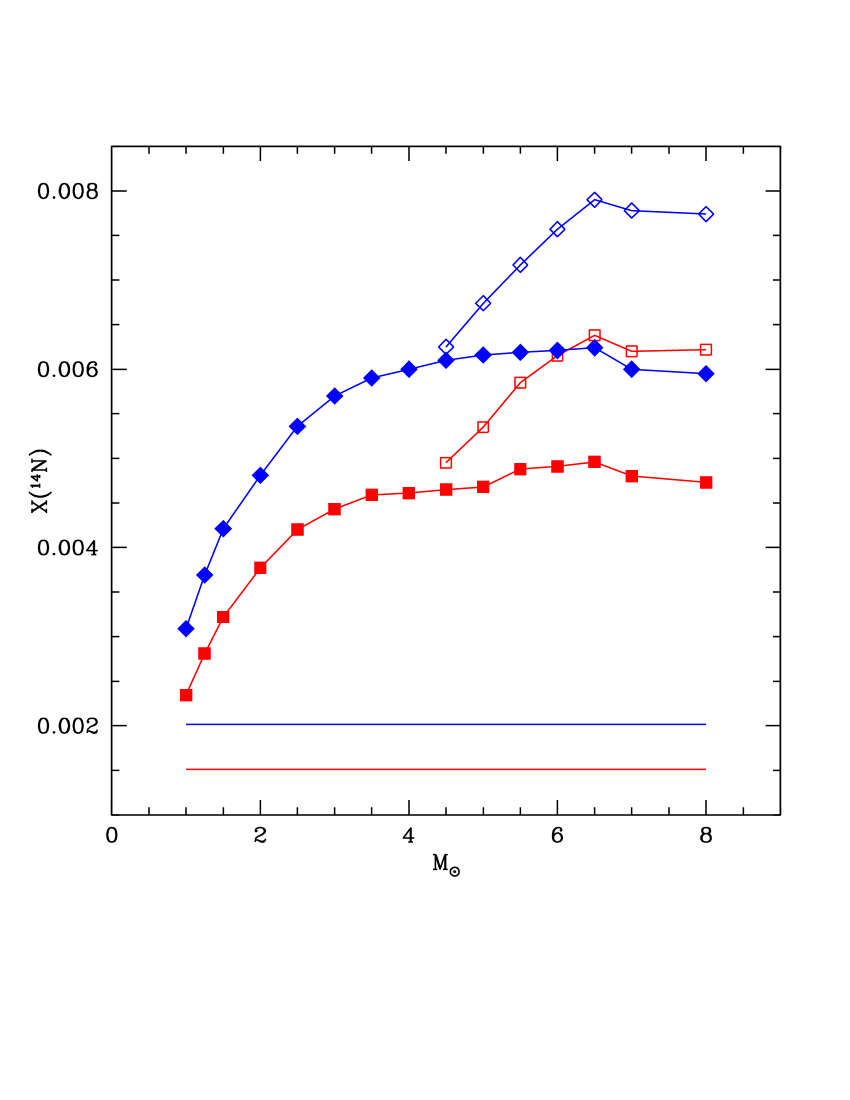
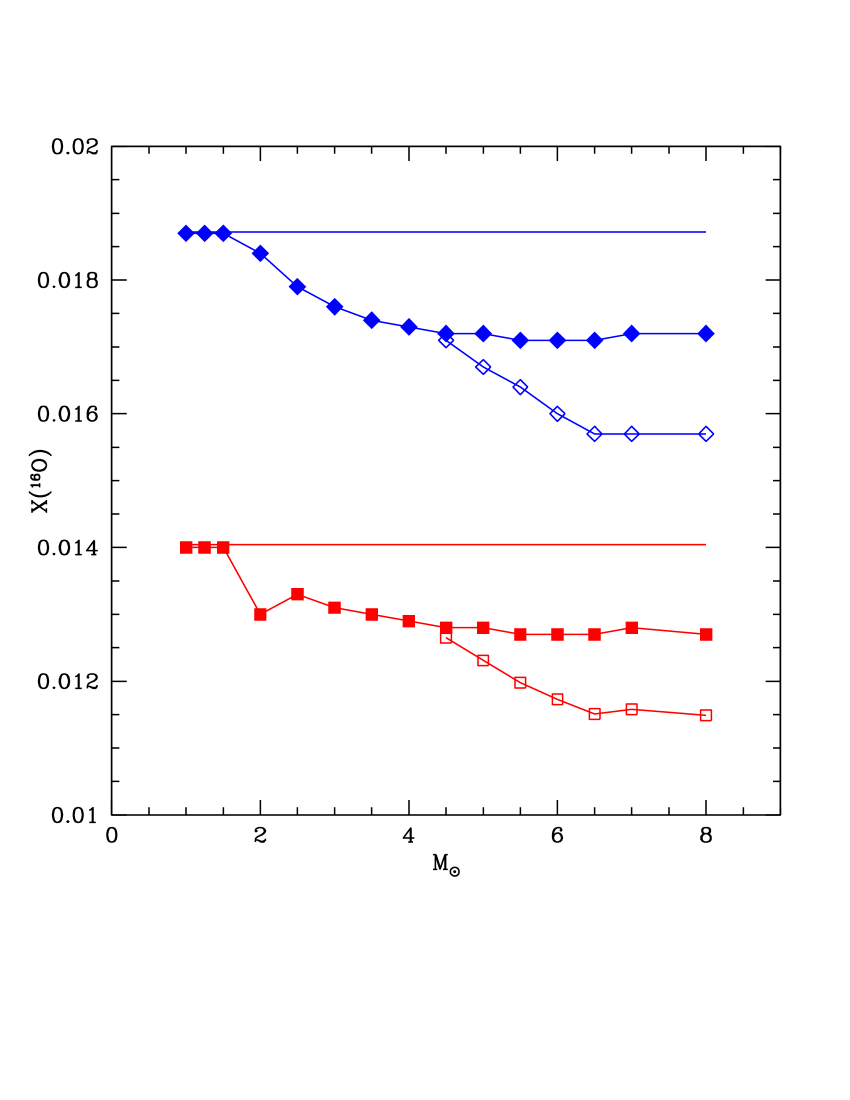
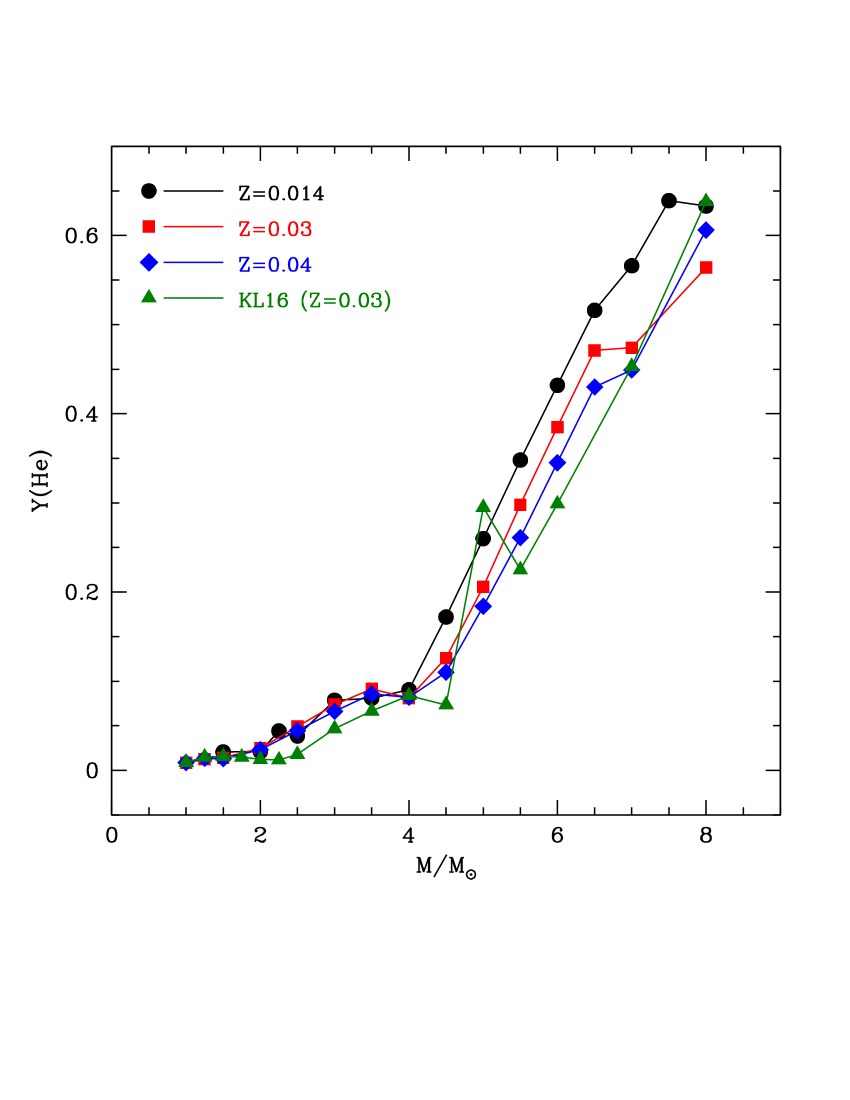
Fig. 1 shows the changes in the surface mass fractions of helium and of the most relevant CNO isotopes determined by the two dredge-up events.
The first dredge-up favours the rise in the surface helium content, which on the average increases by , although in the stars of mass close to is limited to . A well known consequence of the first dredge-up is the drop in the surface mass fraction of 12C, which we find to be between , and the rise in the nitrogen content; the latter quantity is sensitive to the mass of the star, the percentage increase ranging from , for solar mass stars, to a factor , in stars. The surface content of 16O decreases by less than , the largest depletion taking place in the interior of stars. In stars of initial mass above the base of the envelope reaches regions where sodium was produced by 22Nep,Na reactions: in this mass domain the surface sodium increases by .
The extent of the changes of the mass fractions of the various species given above must be considered as lower limits, because the present results have bee obtained by considering only convective mixing, without considering additional effects, such as thermohaline or rotation-induced mixing, that might trigger further changes in the chemical composition of the surface regions (Pinsonneault, 1997; Charbonnel & Lagarde, 2010; Lagarde et al., 2012).
In the discussion of the effects of the second dredge-up we will focus on stars of mass above , as in lower mass objects the inwards penetration of the convective envelope following the end of the core helium burning phase is not sufficiently deep to reach regions previously site of nuclear activity.
As discussed previously, one of the most important effect of the second dredge-up is the decrease in the core mass, which is highly sensitive to the initial mass of the star: in stars , while in stars .
The decrease in core mass is related to the capability of the external mantle to penetrate inwards, past the H-He discontinuity; this process, which is made easier by the temporary extinction of the H-burning shell, favours the transportation of helium-rich material towards the surface layers, which become more and more enriched in helium (Boothroyd & Sackmann, 1999). This effect is stronger the higher the mass of the star (Ventura, 2010): the helium enrichment spans the range from , for stars, to , for stars.
Additional consequences of the occurrence of the second dredge-up are a further reduction of the surface mass fractions of 12C and 16O and the increase in the surface 14N. For all these chemical species, similar to helium, the extent of the change in the surface content increases with the mass of the star, being almost null in stars of mass around and reaching a maximum extent in stars. These results are shown in Fig. 1.
| MM⊙ | MM⊙ | MM⊙ | (C-O)f | |||
|---|---|---|---|---|---|---|
| 1.00 | - | - | - | - | - | - |
| 1.25 | 0.57 | - | - | - | - | 0.03 |
| 1.50 | 0.60 | - | - | - | - | 0.05 |
| 2.00 | 0.58 | 0.65 | 1.08(4) | 1.1 | 7.63 | 0.50 |
| 2.50 | 0.59 | 0.68 | 1.36(4) | 0.8 | 8.16 | 0.58 |
| 3.00 | 0.60 | 0.69 | 1.44(4) | 7 | 8.56 | 0.60 |
| 3.50 | 0.68 | 0.74 | 2.00(4) | 10 | 8.08 | 0.57 |
| 4.00 | 0.83 | - | - | - | - | 0.25 |
| 4.50 | 0.87 | - | - | - | - | 0.20 |
| 5.00 | 0.89 | - | - | - | - | 0.15 |
| 5.50 | 0.92 | - | - | - | - | 0.10 |
| 6.00 | 0.95 | - | - | - | - | 0.05 |
| 6.50 | 0.99 | - | - | - | - | - |
| 7.00 | - | - | - | - | - | - |
| 8.00 | - | - | - | - | - | - |
| 1.00 | - | - | - | - | - | - |
| 1.25 | 0.56 | - | - | - | - | 0.02 |
| 1.50 | 0.59 | - | - | - | - | 0.05 |
| 2.00 | 0.60 | - | - | - | - | 0.15 |
| 2.50 | 0.60 | 0.69 | 1.39e4 | - | 8.23 | 0.40 |
| 3.00 | 0.61 | - | - | - | - | 0.45 |
| 3.50 | 0.66 | - | - | - | - | 0.48 |
| 4.00 | 0.81 | - | - | - | - | 0.15 |
| 4.50 | 0.86 | - | - | - | - | 0.10 |
| 5.00 | 0.89 | - | - | - | - | 0.07 |
| 5.50 | 0.91 | - | - | - | - | 0.05 |
| 6.00 | 0.93 | - | - | - | - | 0.05 |
| 6.50 | 0.94 | - | - | - | - | 0.04 |
| 7.00 | - | - | - | - | - | - |
| 8.00 | - | - | - | - | - | - |
5 The AGB phase of metal-rich stars
After the end of the core helium burning phase the stars of mass mass develop a core composed of carbon and oxygen, which evolves under conditions of electron degeneracy. The only exceptions to this general behaviour are the stars of mass , that experience off-center carbon burning and develop a convective flame that moves inwards, forming a zone enriched in oxygen and neon close to the stellar centre. The subsequent evolution is commonly referred to as ”super-AGB” (e.g., Garcia-Berro & Iben 1994, Siess 2007).
The energy supply is provided for of the time by a CNO burning shell; periodically a helium-rich region just above the core is ignited in conditions of thermal instability (Schwarzschild & Härm, 1965), which explains the use of the terminology ”thermal pulse” to refer to these episodes. The inter-shell zone between the He-rich buffer where the TPs develop and the CNO burning shell is composed essentially by helium, carbon, oxygen and neon, with mass fractions (He,C,O,Ne). This distribution, which is relevant for the s-process nucleosynthesis and the relative surface enrichment, is extremely sensitive to the treatment of convective borders and to the assumption of extra-mixing from the base of the pulse driven convective shell.
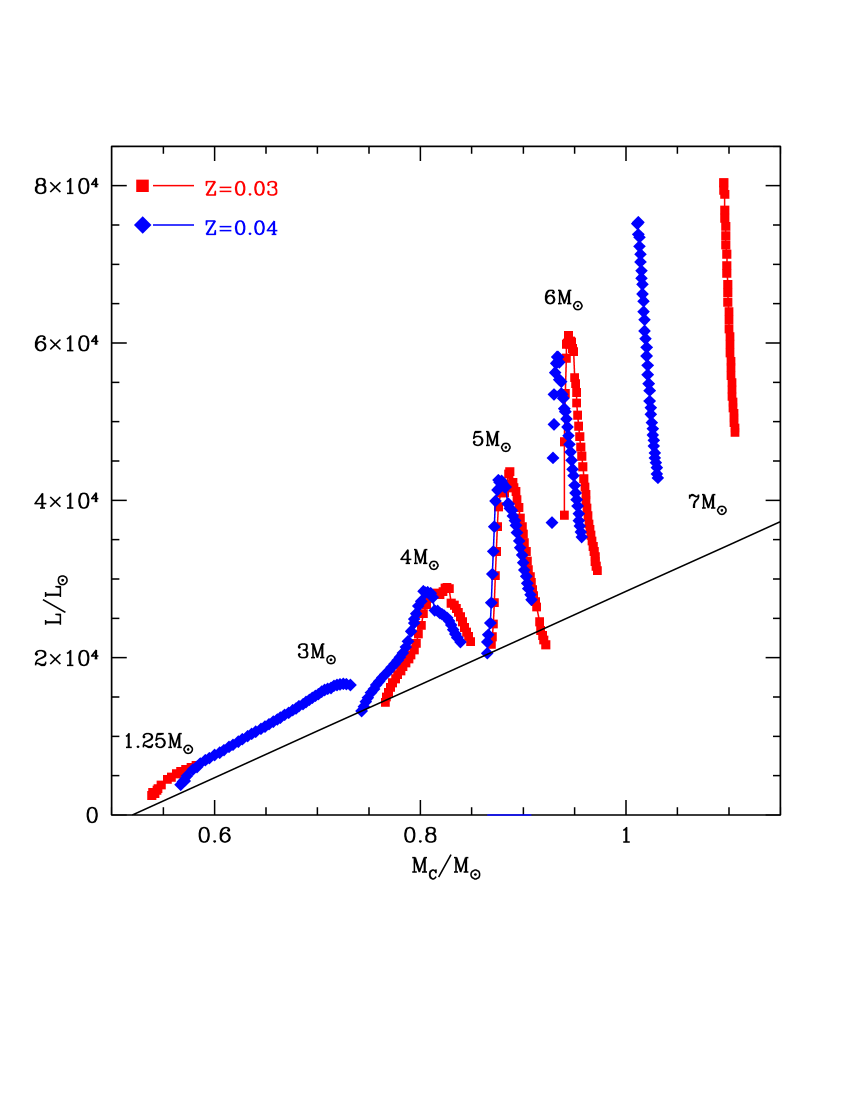
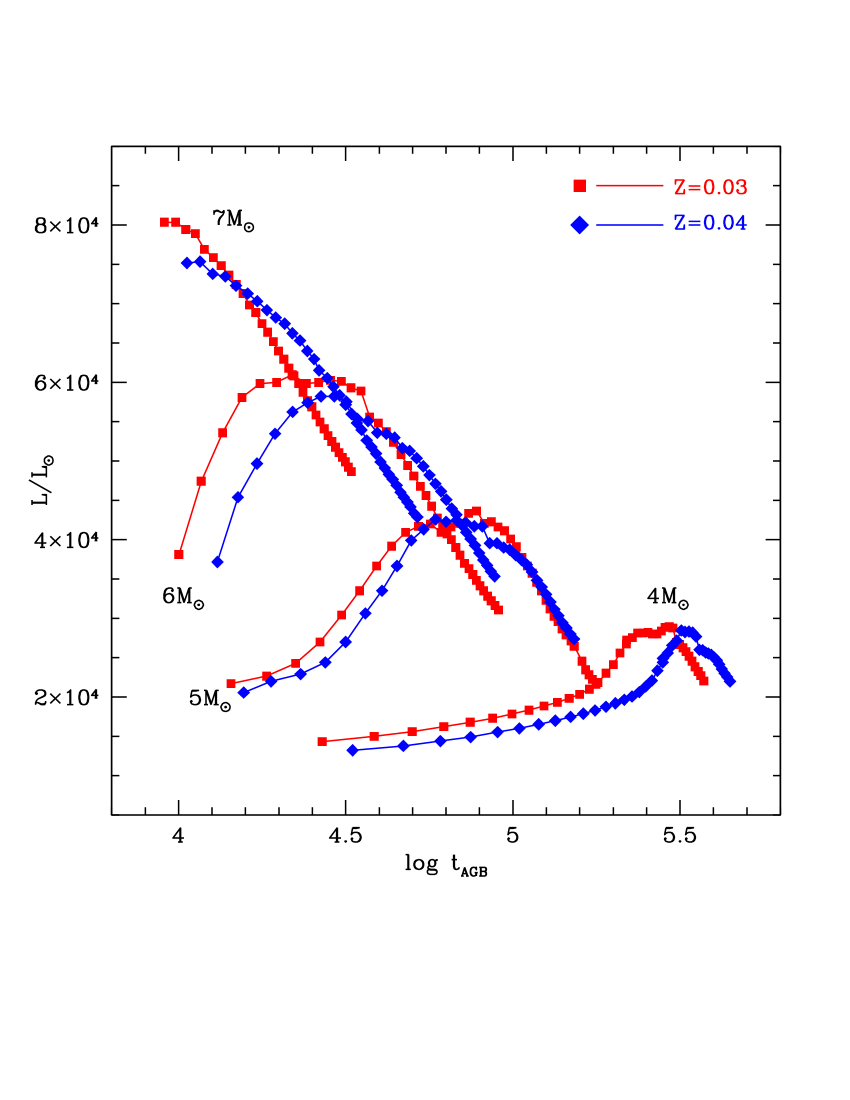
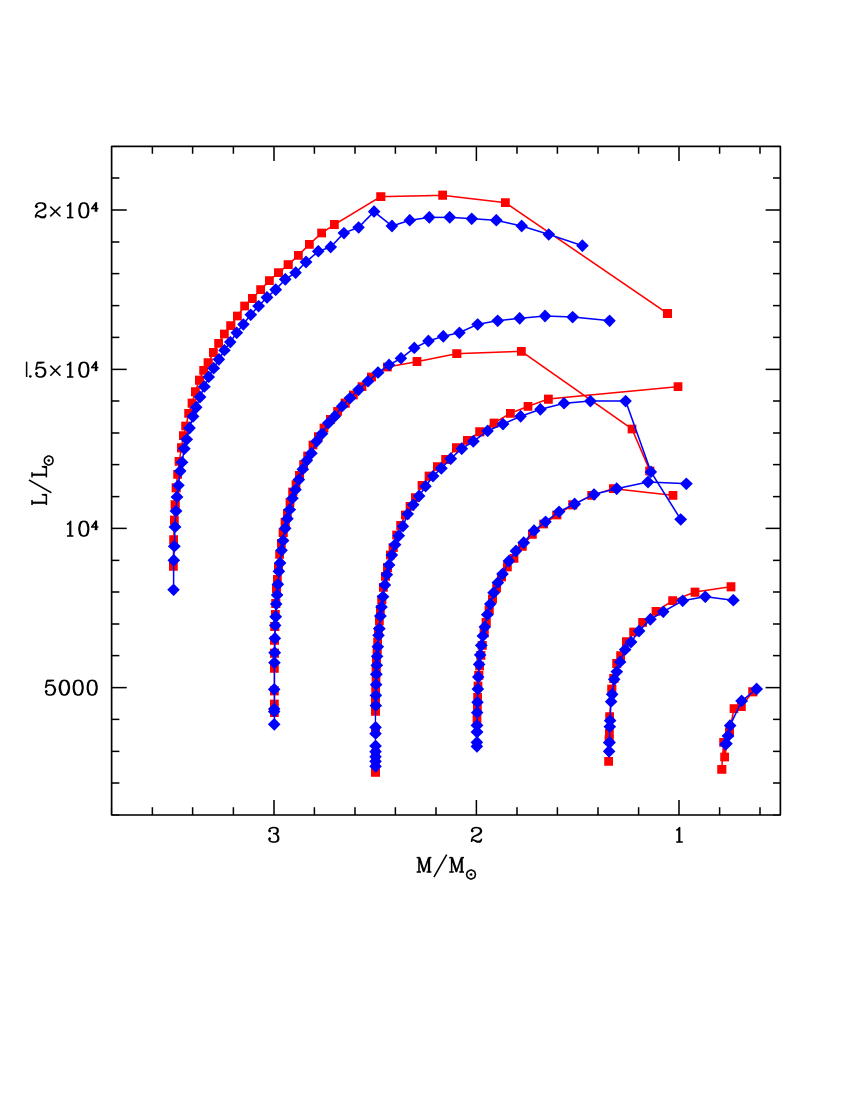
The core mass is the key factor of the AGB evolution: the higher the core mass the higher the degree of degeneracy in the internal regions, which reflects into larger pressures and temperatures within the CNO burning shell, which supports these structures on the energetic side for most of the time. This is the reason of the tight relationship between core mass and luminosity of AGB stars, initially predicted in a classic paper by Paczyński (1970). The core mass -luminosity trend for some of the stars considered here is shown in Fig. 2; the evolutionary sequences in this plane are similar to those published in Karakas & Lattanzio (2014, see their figure 18).
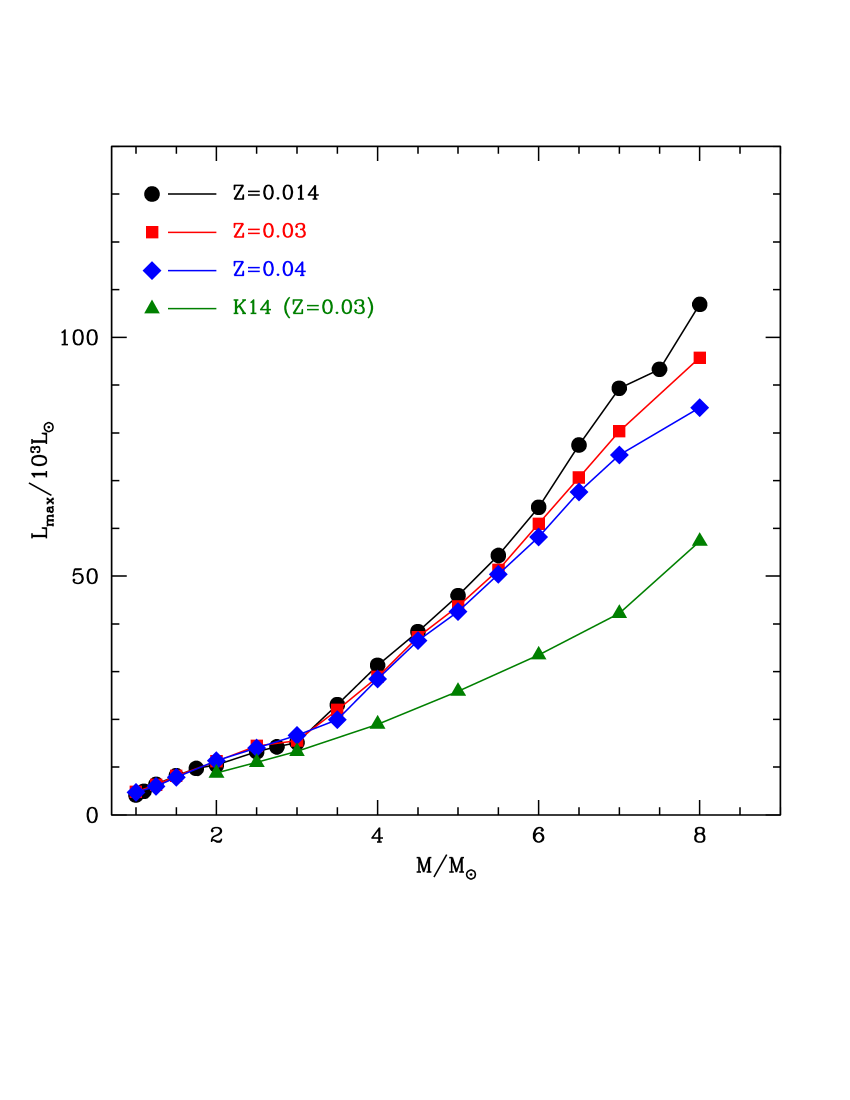
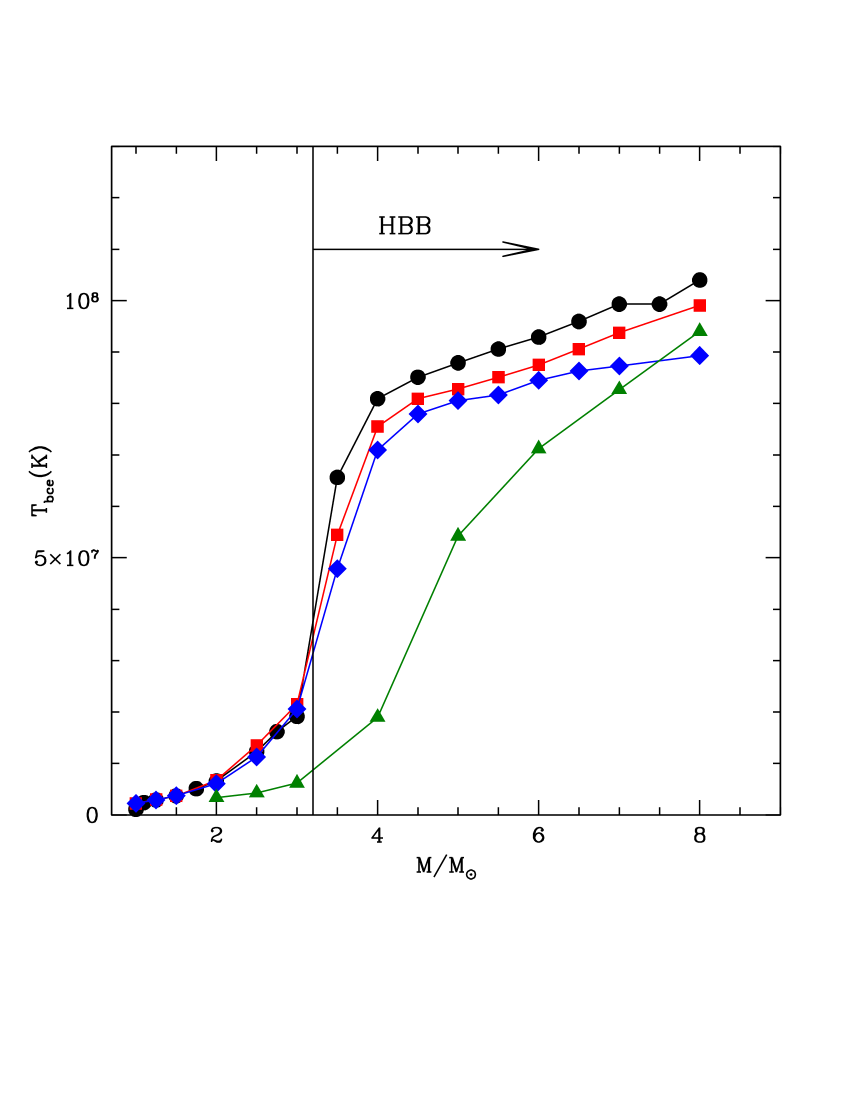
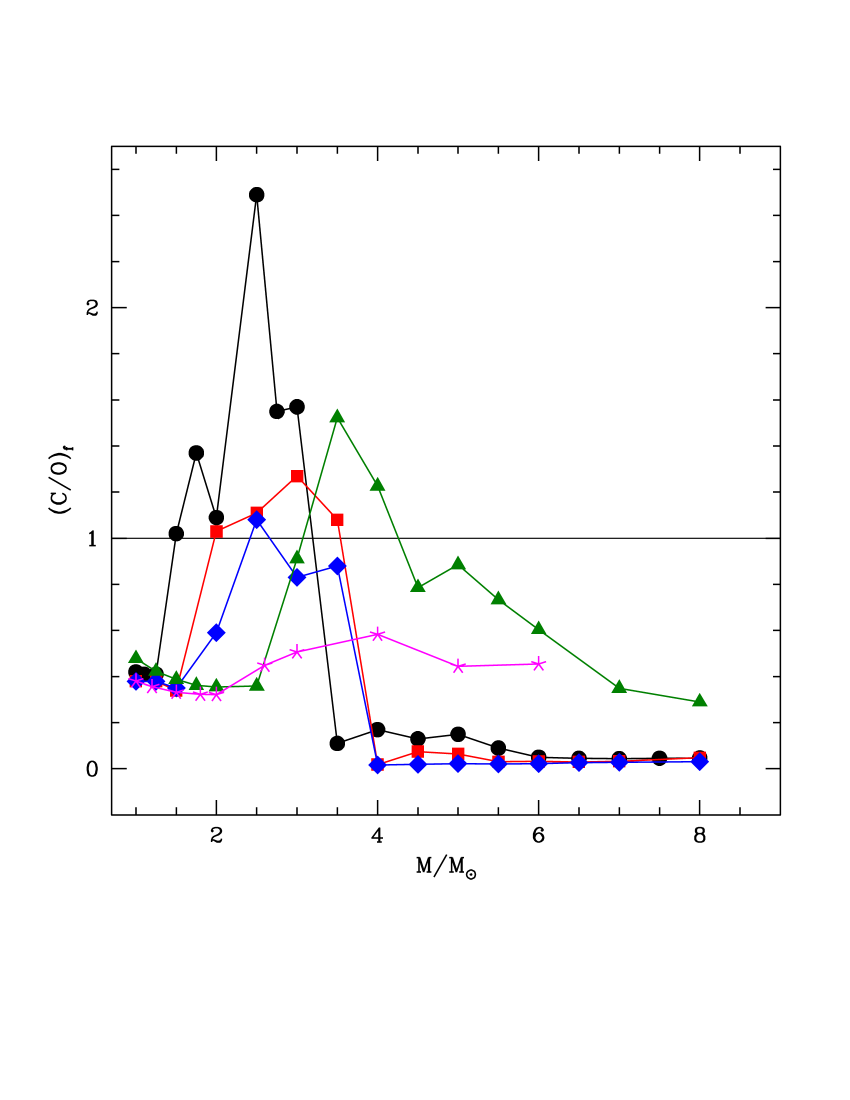
The top panels of Fig. 3 shows the highest luminosity and temperature at the base of the envelope attained during the AGB phase. To understand the trend with metallicity we also show the solar metallicity models published in Ventura et al. (2018). These plots highlight the difference between the evolution of the stars with initial mass and their lower-mass counterparts, which evolve to much lower luminosities and temperatures. The sudden drop of Tbce occurring around is clearly visible. This behaviour is related to the ignition of HBB, which requires core masses of the order of (Ventura et al., 2013) and strongly affects the surface chemistry. The results reported in the bottom, right panel of Fig. 3 show the significant effect of HBB on the final CO surface ratio, defined as the ratio of the sum of the surface number densities of the carbon isotopes, divided by the sum of the number densities of oxygen isotopes: at the base of the convective envelope 12C nuclei are exposed to p-capture reactions, which decrease the surface carbon content and the CO ratio.
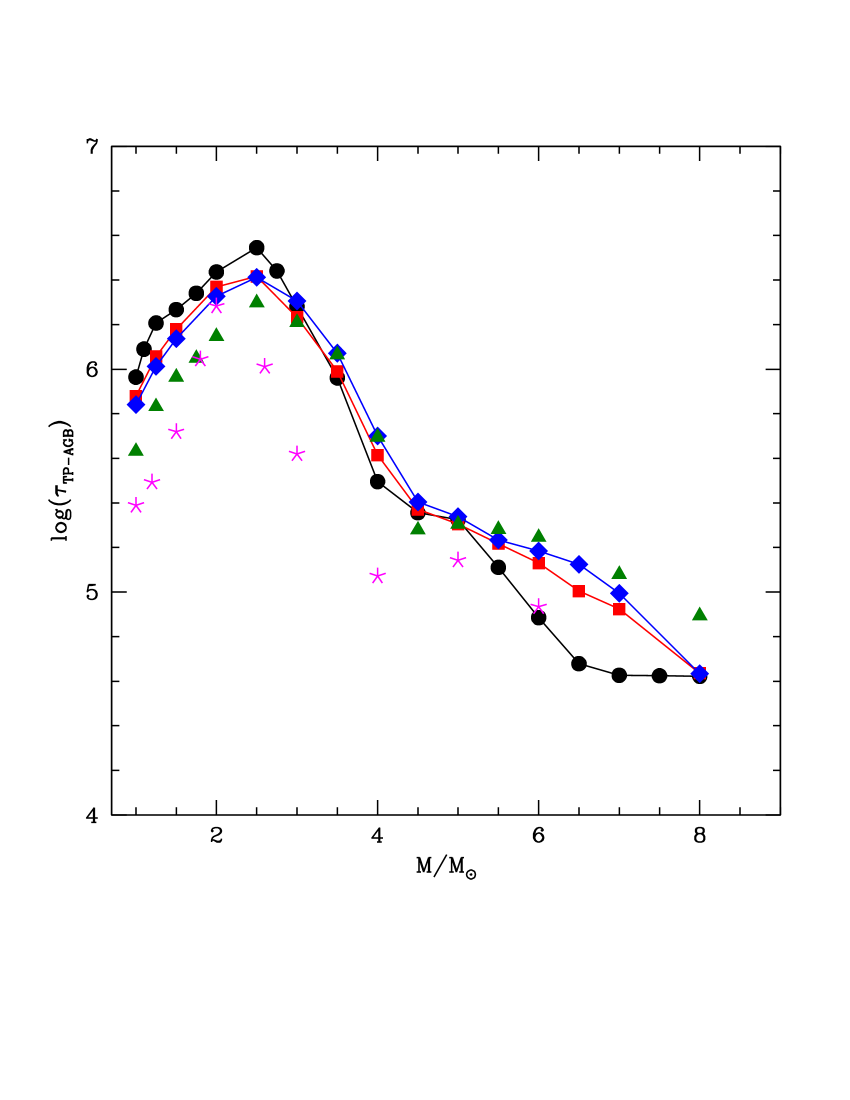
The ignition of HBB has also profound effects on the physical evolution of AGB stars: it results in a fast rise of the luminosity (Blöcker & Schöenberner, 1991), with significant deviations (see Fig. 2) from the core mass - luminosity relationship predicted by Paczyński (1970). This is accompanied by the increase in the rate of mass loss, which shortens the duration of the AGB phase. This is shown in the bottom, left panel of Fig. 3, where the time scale of the AGB phase of stars is on average more than one order of magnitude shorter than for the lower masses. Specifically, in the low-mass domain the behaviour of the duration of the TP-AGB phase, , is not monotonically related to the initial mass of the star. In the range increases with the initial mass, because the higher the mass, the larger the number of TPs experienced before the entire envelope is lost, which makes the AGB phase longer (see bottom, left panel of Fig. 3). For stars of higher mass the most relevant point to is that the core mass, hence the luminosities, are larger, which leads to shorter time scales. In the low-mass domain the stars evolving faster along the AGB phase, with Myr, are the and stars; the stars with the longest AGB life, of the order of Myr, are those with initial mass (see Column 5 of Table 1).
The comparison between the present models and those by Ventura et al. (2013, 2014a, 2018) indicates that the threshold mass at which the ignition of HBB occurs is in the range for all the metallicities . The trends with metallicity illustrated in Fig. 3 reflect a well established property of AGB stars: the lower the metallicity, the larger is the temperatures at the base of the envelope () and, as a consequence, the luminosity (Ventura et al., 2013). This is particularly important in the domain, where the degree of the p-capture nucleosynthesis due to HBB is extremely sensitive to (Dell’Agli et al., 2018). The metallicity effect on the evolutionary time scales for the stars experiencing HBB is straightforward: the higher the metallicity, the lower is the luminosity, and the longer the duration of the AGB phase. In the low-mass domain the behaviour is the opposite: stars of higher metallicity evolve at lower effective temperatures and larger radii, thus experience higher rates of mass loss, which shorten the AGB phase.
Besides HBB the surface chemical composition of AGB stars can be modified by the occurence of third dredge-up (hereinafter TDU), which consists in the inwards penetration of the convective envelope, taking place after each thermal pulse (TP) of the He burning shell, down to layers previously affected by nucleosynthesis via the triple-alpha reactions, thus enriched in carbon (Iben, 1974). The alteration determined by TDU is significantly different than HBB: in this case the main effect is the gradual increase in the surface carbon, which can lead to the formation of a carbon star, once the number density of carbon atoms exceeds the number density of oxygen. The efficiency of each TDU event is commonly described by , defined as the ratio between the decrease in the core mass favoured by TDU and the increase in the core mass occurred since the previous TP, during the quiescent CNO burning phase.
In Table 2 we report for each stellar mass and for the two metallicities discussed here, the relevant information describing the occurrence and the effects of TDU, i.e. the core masses of the star when the first TDU takes place, the core mass and luminosity when the C-star stage is reached, the duration of the C-star phase and the maximum experienced.
Given the significant difference in their evolution, we describe separately the stars in the low-mass domain () and the higher-mass stars that experience HBB.
5.1 The evolution of massive AGB stars
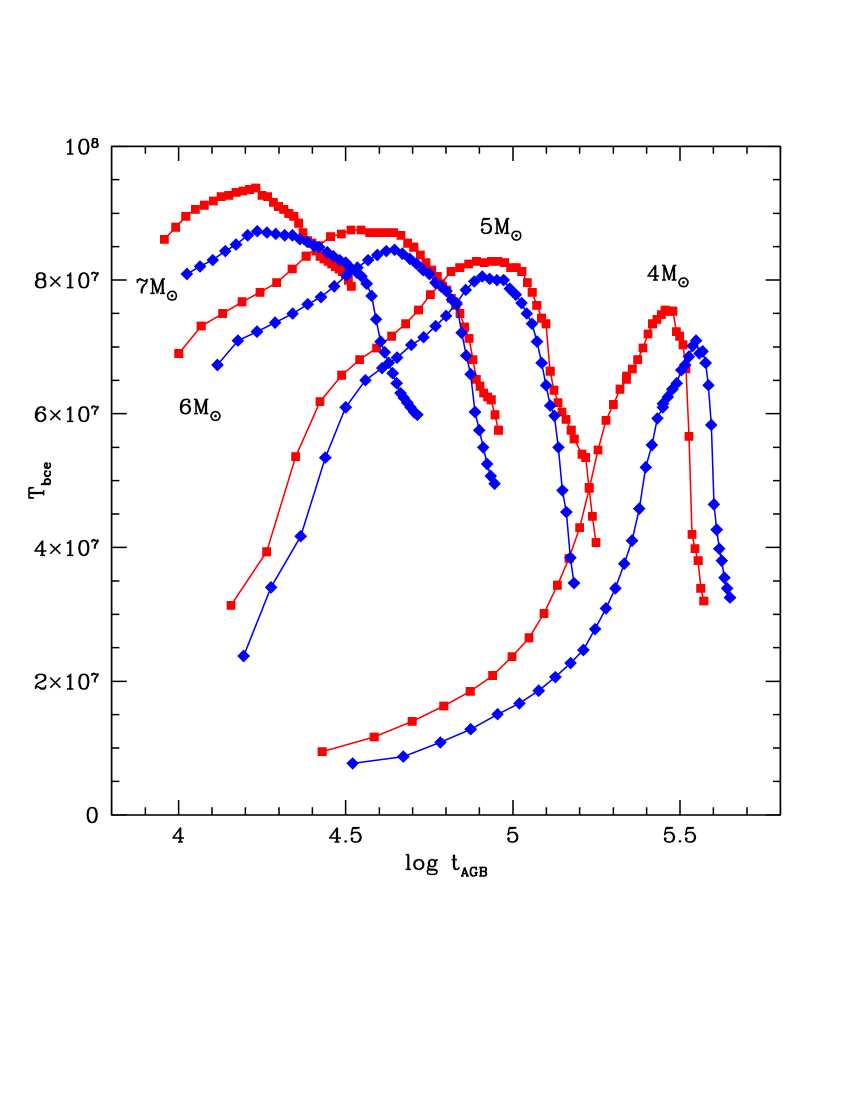
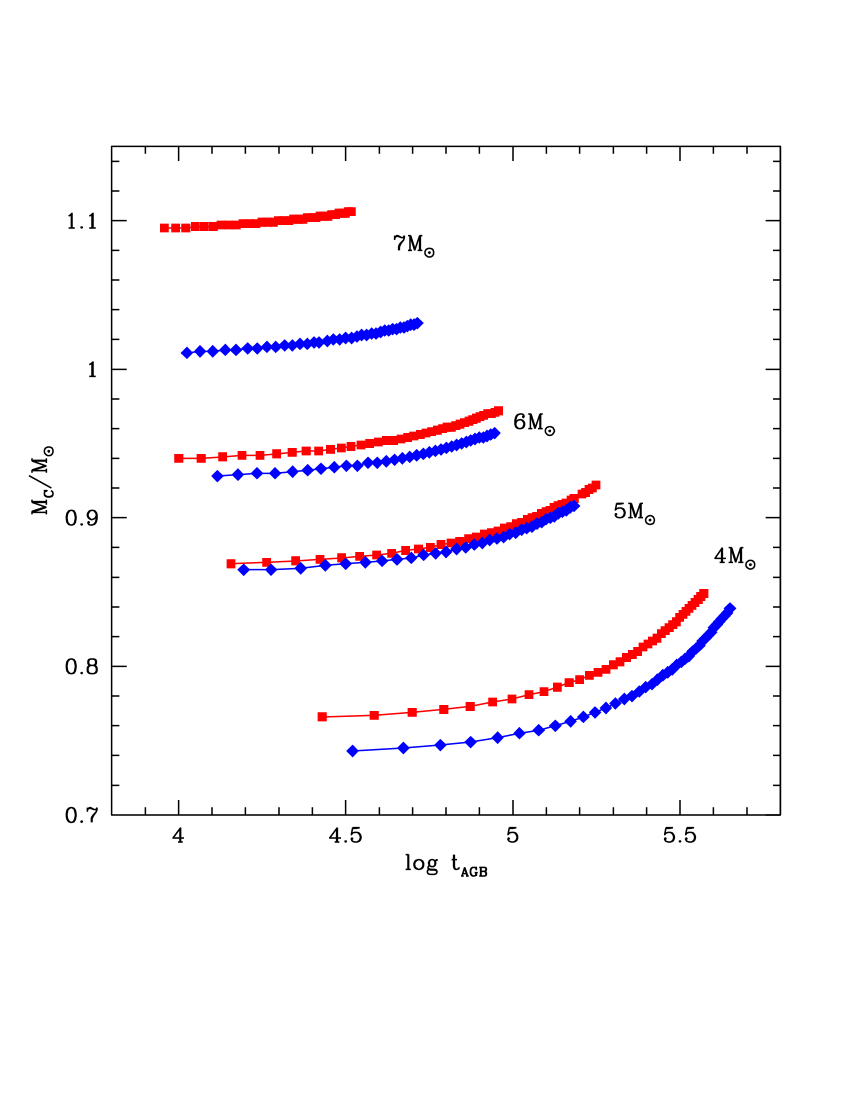
The variation with time of the main physical properties of metal-rich, massive AGB stars are shown in Fig. 4. These stars experience an initial phase during which the luminosity and Tbce increase (see top panels of Fig. 4), owing to the gradual rise in the mass of the core (bottom, left panel of Fig. 4); both quantities decline in the final AGB phases, after a significant fraction of the envelope is lost. The mass loss rate, shown in the bottom, right panel of Fig. 4, follows a similar trend, considering the link between mass loss and luminosity, which is expected on general grounds, and is particularly tight according to the Blöcker (1995) treatment of mass loss adopted in the present investigation. The effective temperature of the stars decreases trend during the AGB life, with K during the initial TPs, and K during the final AGB phases; this behaviour is substantially independent of the initial mass of the star. stars follow a similar decreasing trend, the difference with respect to the case being that the effective temperatures are K cooler.
Both the average and the peak luminosity (the latter in the range ) are strongly sensitive to the initial stellar mass. The differences in the luminosity among stars of different mass reflect on the duration of the AGB phase, which varies from yr, for stars, to yr, for stars. The luminosities and temperatures reached by the stars are generally higher than their counterparts, the differences being below in all cases.
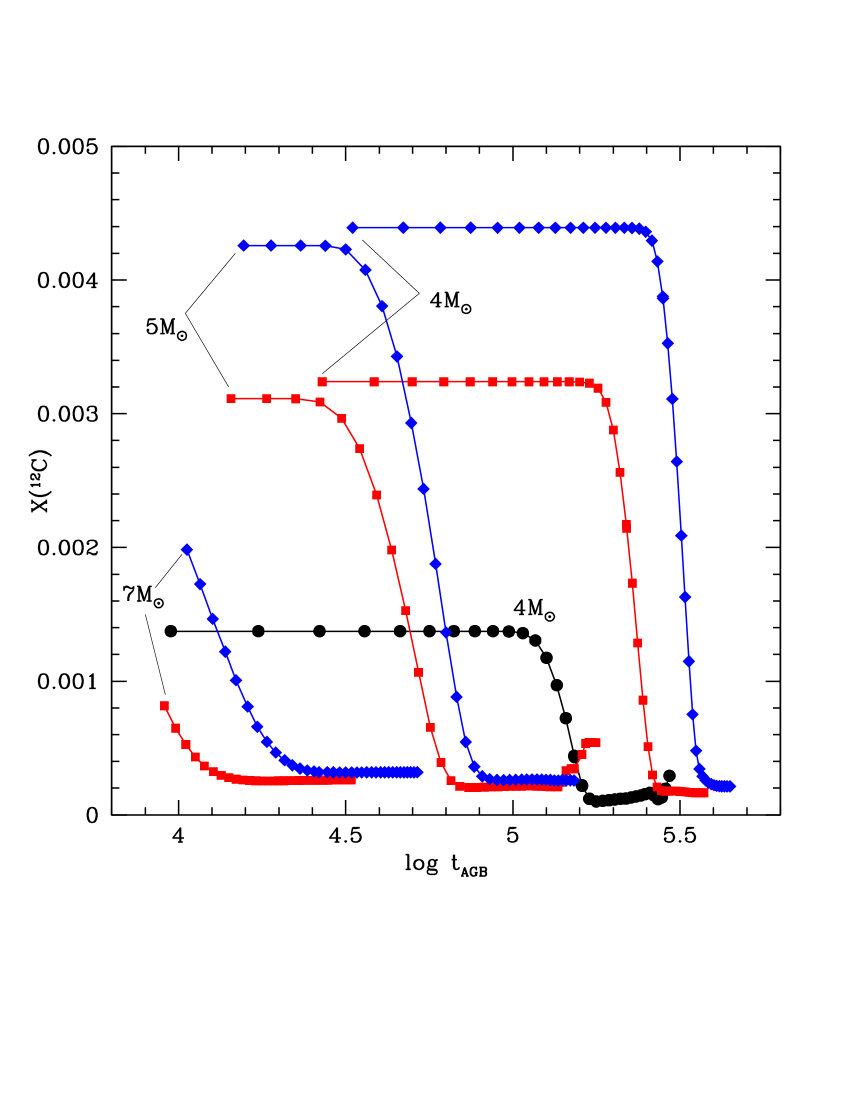
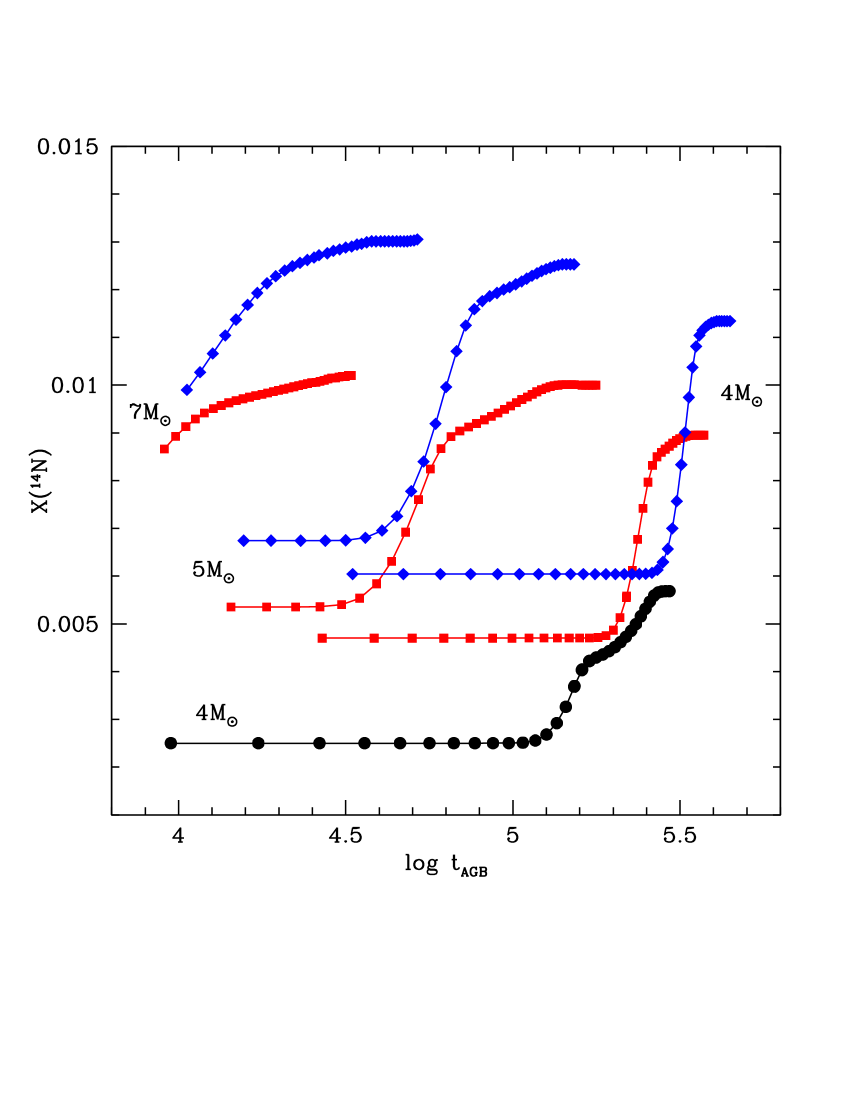
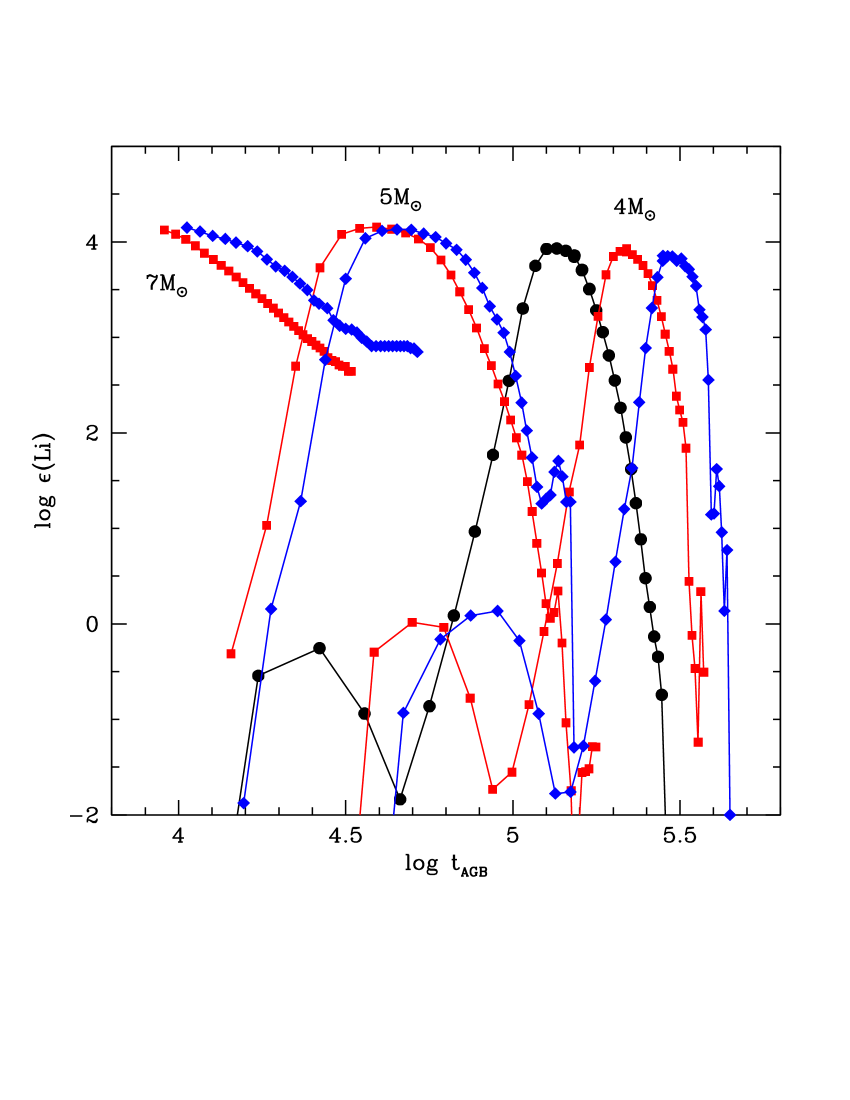
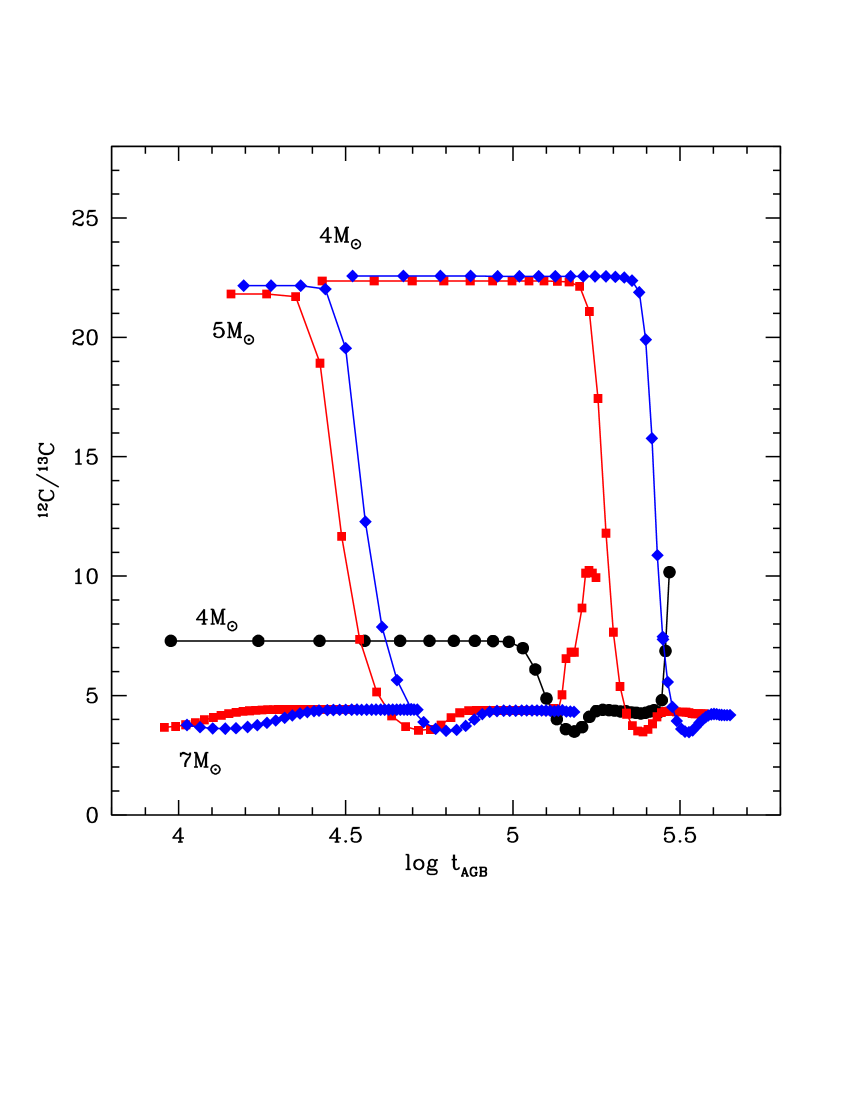
Fig. 5 shows the variation of the surface chemical composition of the stars reported in Fig. 4. The alteration of the surface chemistry is mostly due to HBB, because the efficiency of TDU is low in this mass domain. On general grounds, this behaviour is associated to the strength of TPs, which is weaker than in the lower-mass counterparts; a further effect, particularly relevant when convection is described by means of the FST, is related to the strong HBB experienced, which accelerates the AGB evolution, in such a way that the external mantle is lost before deep TDU events take place. As reported in Table 2, the TDU efficiency is for the stars experiencing HBB. A similar behaviour was found in the solar metallicity models discussed in Ventura et al. (2018).
The ignition of HBB triggers the reduction of the surface carbon: the final surface 12C is depleted by a factor 15 (20) in () stars (see top, left panel of Fig. 5); the final 12CC reaches the equilibrium value of in all cases. This is consistent with the results shown in the bottom, right panel of Fig. 3, where we see that the final CO is below in the high-mass domain. The initial mass affects the timing when the modification of the surface chemistry occurs: while in the stars of higher mass carbon depletion starts since the very first thermal pulses, in the case this takes place only after the star has experienced several TPs. This is consistent with the evolution of the of stars of different mass, shown in the right panel of Fig. 4.
In this metallicity domain the surface oxygen is only scarcely affected by HBB. This is consistent with the results by Ventura et al. (2018), who found that oxygen destruction is negligible in massive AGB stars of solar metallicity. Therefore, the nucleosynthesis experienced at the base of the envelope is essentially pure CN cycling, which results in a direct relationship between the number of 12C nuclei destroyed and the number of 14N synthesized (see top, right panel of Fig. 5). The nitrogen abundance is higher in stars compared to , due to the larger initial abundance of 12C.
While HBB is potentially able to activate all the p-capture channels, until the synthesis of silicon, we find that in the stars discussed here the Mg-Al chain is not activated; this is related to the temperatures attained at the bottom of the convective envelope (see Fig. 4), below K, the threshold required to ignite the fist reaction of the chain, i.e. proton capture by 24Mg nuclei. This is consistent with the analysis by Dell’Agli et al. (2018), focused on the temperatures at the base of the external mantle required to activate the different nuclear channels, and the largest degree of nucleosynthesis activated in massive AGB stars of different metallicity.
The temperatures at the base of the convective envelope (Fig. 4) are above MK, which is the threshold required to activate the series of reactions that leads to the synthesis of lithium (Cameron & Fowler, 1971). As shown in the bottom, left panel of Fig. 5, the stars evolve as lithium-rich for a significant fraction of the AGB phase; this is different from the behaviour of their lower metallicity counterparts, where the survival of lithium in the surface regions, particularly in the most massive stars, is limited to a very few TPs (Ventura et al., 2000). The long duration of the Li-rich phase is due to the trend with metallicity of the temperatures at the bottom of the envelope, discussed above: in metal-rich stars the Tbce are lower than in solar and sub-solar AGBs, which allows a longer survival of 3He, the essential ingredient to lithium production (Sackmann & Boothroyd, 1992). While lithium production by massive AGB stars is larger in the high metallicity domain, the overall lithium expelled by AGB stars is not sufficient to explain the lithium vs. metallicity trend exhibited by Milky Way stars (Romano et al., 2001), which suggests that other sources must be responsible for the lithium enrichment of the interstellar medium.
5.2 Low mass AGB stars
Stars of initial mass do not experience HBB. The variation of their surface chemical composition during the AGB life is only driven by TDU. In this section we include stars of initial mass , because they experience such weak HBB that the TDU plays the dominant role in the modification of their surface chemistry.
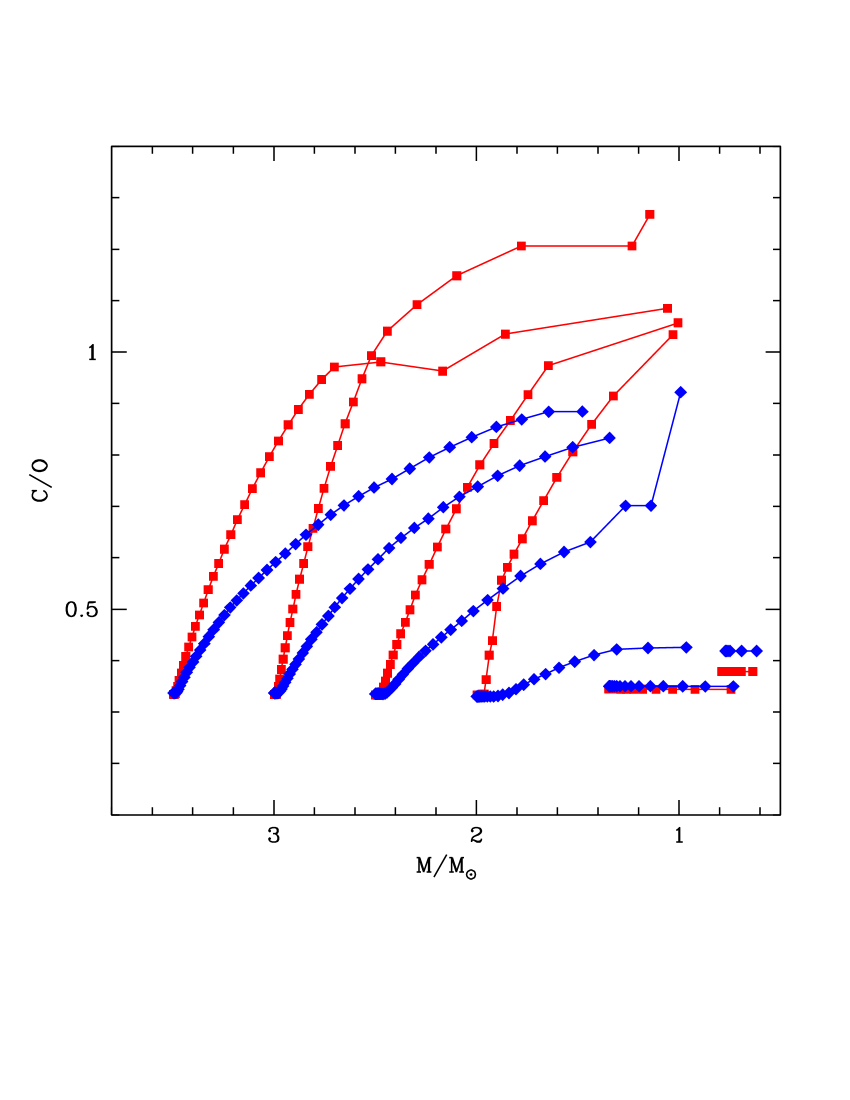
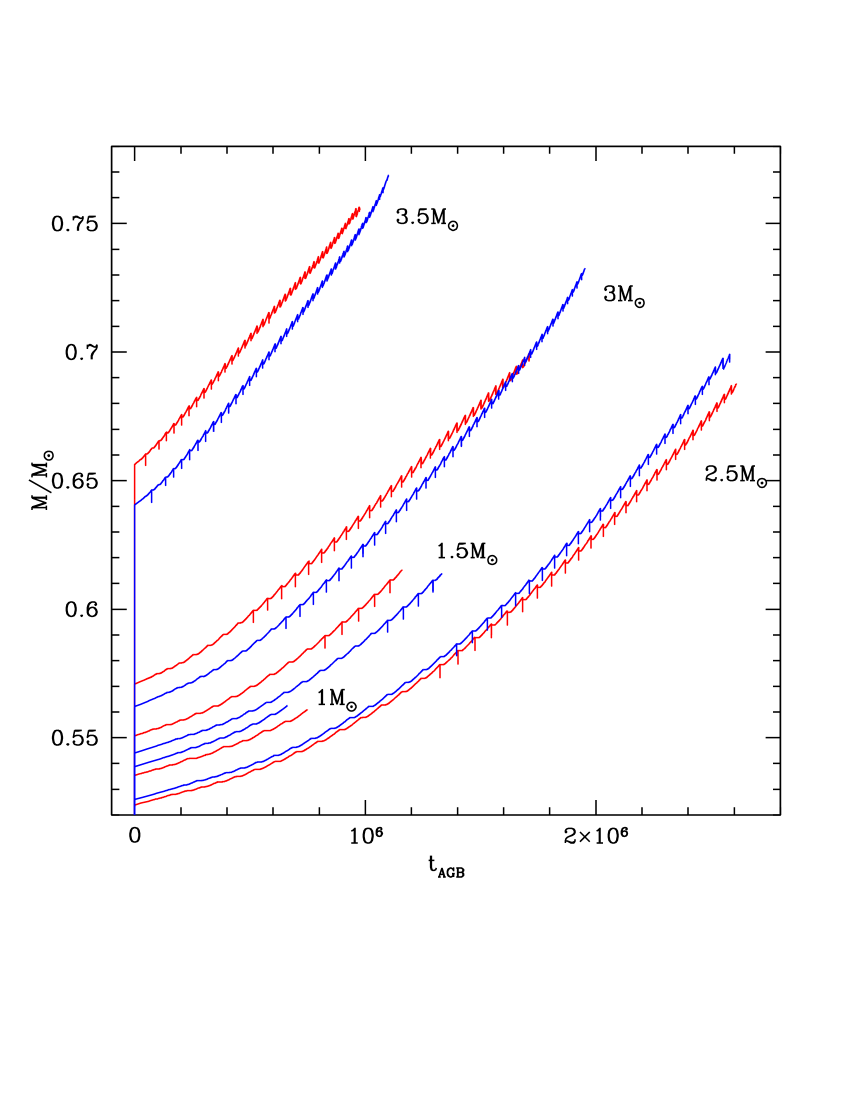
Fig. 6 shows the variation of the luminosity and of the surface CO ratio as a function of the current mass of the star. We report the evolution of all the stars with initial mass in the range , with the exception of the model, omitted for readability. The variation with time of the core mass and the rate of mass loss of AGB stars beloning to the low-mass domain are shown in Fig. 7. The gradual increase in the luminosity is determined by the growth of the core mass. The maximum luminosity reached correlates with the initial mass of the star; also, the larger is the initial mass the higher the number of TPs experienced before the envelope is lost, and the larger is the final core mass. The efficiency of TDU increases as more and more TPs are experienced; consequently, the stars undergoing the deepest TDU events are those of initial mass around , for which during the final part of the AGB phase (see Table 2). This can be seen in the left panel of Fig. 7.
Similarly to their higher mass counterparts, the external regions of the star become cooler and cooler during the AGB, with the effective temperatures spanning the same range (2500-3500 K) given in section 5.1. The only exceptions to this common behaviour are the models, whose effective temperatures during the final AGB phase are K, and the of metallicity , which after becoming carbon star readjust on a largely expanded configuration, with K.
The variations of the surface chemistry reflect the effect of the recurrent TDU events, which results in the gradual increase of the surface carbon and the consequent rise of the CO ratio. The accumulation of the surface carbon increases with the initial mass of the star, because of the higher number of TDU episodes experienced. We find that at only models of initial mass in the range become C-stars in the very final evolutionary phases. The present computations show that formation of C-stars is not expected for metallicities , except in the case of the star of .
6 The stellar yields
Observations of chemical abundances and abundance ratios can be used to constrain the timescales of galaxy formation (Matteucci, 2012), as well as to pin down the shape of the stellar initial mass function (IMF) in galaxies where direct measurements are unfeasible (Romano et al. 2017, 2019; Zhang et al. 2018, and references therein). To interpret the observations, galactic chemical evolution models are needed, which require as input stellar yields from stellar evolution calculations. As highlighted in the introduction, it is crucial to provide grids of stellar yields that cover the whole range of metallicities spanned by the observations.
Here we follow the classical definition of the stellar yield, i.e., the yield of a given element is the net amount of newly-produced element that is ejected in the interstellar medium by a star during its life:
The integral is calculated over the entire stellar lifetime, is the mass fraction of species at the beginning of the evolution, and is the mass lost rate. If the element is destroyed in the stellar interior, then the yield is negative.
| MM⊙ | H | He | 7Li | 12C | 13C | 14N | 16O | 17O | 18O | 22Ne | 23Na |
|---|---|---|---|---|---|---|---|---|---|---|---|
| Z=0.03 | |||||||||||
| 1.00 | -8.43(-3) | 8.34(-3) | -4-40(-9) | -5.28(-4) | 4.41(-5) | 5.71(-4) | 0.00(-0) | 9.46(-8) | -8.36(-7) | 0.00(+0) | 0.00(+0) |
| 1.25 | -1.28(-2) | 1.27(-2) | -6-68(-9) | -8.01(-4) | 6.76(-5) | 8.65(-4) | 0.00(-0) | 9.48(-7) | -2.54(-6) | 0.00(+0) | 0.00(+0) |
| 1.50 | -1.45(-2) | 1.42(-2) | -8.85(-9) | -1.39(-4) | 8.61(-5) | 1.52(-3) | -1.01(-5) | 5.66(-6) | -5.04(-6) | 0.00(+0) | 0.00(+0) |
| 2.00 | -2.85(-2) | 2.48(-2) | -1.35(-8) | 5.33(-4) | 1.24(-4) | 3.02(-3) | -1.61(-4) | 7.08(-5) | -9.56(-6) | -6.61(-6) | 7.58(-6) |
| 2.50 | -6.13(-2) | 4.91(-2) | -1.81(-8) | 6.79(-3) | 1.67(-4) | 4.84(-3) | -9.41(-4) | 7.16(-5) | -1.45(-5) | -1.61(-5) | 2.34(-5) |
| 3.00 | -9.46(-2) | 7.38(-2) | -2.30(-8) | 1.32(-2) | 2.14(-4) | 6.63(-3) | -1.53(-3) | 6.00(-5) | -1.92(-5) | -2.61(-5) | 3.91(-5) |
| 3.50 | -1.17(-1) | 9.13(-2) | -2.14(-8) | 1.15(-2) | 2.97(-3) | 1.04(-2) | -1.74(-3) | 4.95(-5) | -5.92(-5) | -4.23(-5) | 5.40(-5) |
| 4.00 | -8.29(-2) | 8.11(-2) | -9.21(-9) | -1.43(-2) | 1.57(-4) | 2.09(-2) | -4.88(-3) | 5.77(-5) | -8.68(-5) | -5.41(-4) | 5.73(-4) |
| 4.50 | -1.28(-1) | 1.26(-1) | -7.17(-9) | -1.68(-2) | 1.24(-4) | 2.65(-2) | -7.49(-3) | 7.88(-5) | -1.03(-4) | -6.81(-4) | 7.18(-4) |
| 5.00 | -2.09(-1) | 2.06(-1) | -1.16(-8) | -1.92(-2) | 1.27(-4) | 3.18(-2) | -1.04(-2) | 9.58(-5) | -1.18(-4) | -8.71(-4) | 9.19(-4) |
| 5.50 | -3.00(-1) | 2.98(-1) | 8.10(-10) | -2.18(-2) | 1.39(-4) | 3.69(-2) | -1.31(-2) | 1.17(-4) | -1.32(-4) | -1.02(-3) | 1.08(-3) |
| 6.00 | -3.87(-1) | 3.85(-1) | 1.41(-8) | -2.40(-2) | 1.91(-4) | 4.14(-2) | -1.54(-2) | 1.39(-4) | -1.46(-4) | -1.07(-3) | 1.13(-3) |
| 6.50 | -4.74(-1) | 4.71(-1) | 2.89(-8) | -2.62(-2) | 2.35(-4) | 4.57(-2) | -1.76(-2) | 1.67(-4) | -1.60(-4) | -1.16(-3) | 1.21(-3) |
| 7.00 | -4.76(-1) | 4.74(-1) | 7.05(-8) | -2.76(-2) | 3.74(-4) | 4.73(-2) | -1.77(-2) | 2.33(-4) | -1.71(-4) | -1.24(-3) | 1.30(-3) |
| 8.00 | -5.64(-1) | 5.64(-1) | 1.03(-7) | -2.91(-2) | 9.67(-4) | 4.96(-2) | -1.90(-2) | 3.09(-4) | -1.92(-4) | -1.34(-3) | 1.38(-3) |
| Z=0.04 | |||||||||||
| 1.00 | -8.55(-3) | 8.78(-3) | -4.42(-9) | -7.28(-4) | 6.42(-5) | 7.21(-4) | 0.00(-0) | 7.37(-8) | -7.28(-8) | 0.00(+0) | 0.00(+0) |
| 1.25 | -1.35(-2) | 1.34(-2) | -6.72(-9) | -1.04(-3) | 8.98(-5) | 1.11(-3) | 0.00(-0) | 9.07(-7) | -3.22(-7) | 0.00(+0) | 0.00(+0) |
| 1.50 | -1.36(-2) | 1.33(-2) | -8.92(-9) | -1.78(-3) | 1.16(-4) | 1.95(-3) | -3.57(-6) | 1.05(-6) | -1.08(-6) | 0.00(+0) | 0.00(+0) |
| 2.00 | -3.63(-2) | 2.31(-2) | -1.33(-8) | 3.56(-3) | 1.82(-4) | 7.59(-4) | -4.40(-4) | 1.04(-4) | -2.25(-6) | -6.61(-6) | 7.58(-6) |
| 2.50 | -5.47(-2) | 4.46(-2) | -1.88(-8) | 3.62(-3) | 2.27(-4) | 6.00(-3) | -1.22(-3) | 1.14(-4) | -1.84(-5) | -1.61(-5) | 2.34(-5) |
| 3.00 | -7.98(-2) | 6.61(-2) | -2.26(-8) | 5.47(-3) | 2.88(-4) | 8.23(-3) | -2.38(-3) | 9.88(-5) | -2.37(-5) | -2.61(-5) | 3.91(-5) |
| 3.50 | -1.04(-1) | 8.56(-2) | -2.64(-8) | 8.09(-3) | 6.56(-4) | 1.05(-2) | -3.09(-3) | 8.48(-5) | -3.29(-5) | -4.23(-5) | 5.40(-5) |
| 4.00 | -8.44(-2) | 8.20(-2) | -5.61(-9) | -1.84(-2) | 3.34(-4) | 2.55(-2) | -4.96(-3) | 7.18(-5) | -1.13(-4) | -6.41(-4) | 6.73(-4) |
| 4.50 | -1.13(-1) | 1.10(-1) | 2.32(-9) | -2.25(-2) | 2.57(-4) | 3.27(-2) | -7.63(-3) | 9.98(-5) | -1.38(-4) | -7.98(-4) | 9.18(-4) |
| 5.00 | -1.87(-1) | 1.84(-1) | 5.08(-9) | -2.57(-2) | 2.77(-4) | 3.94(-2) | -1.10(-2) | 1.21(-4) | -1.57(-4) | -1.01(-3) | 1.11(-3) |
| 5.50 | -2.64(-1) | 2.61(-1) | 1.28(-8) | -2.88(-2) | 2.94(-4) | 4.56(-2) | -1.40(-2) | 1.45(-4) | -1.76(-4) | -1.12(-3) | 1.27(-3) |
| 6.00 | -3.49(-1) | 3.45(-1) | 2.28(-8) | -3.17(-2) | 3.58(-4) | 5.17(-2) | -1.72(-2) | 1.73(-4) | -1.95(-4) | -1.30(-3) | 1.43(-3) |
| 6.50 | -4.33(-1) | 4.30(-1) | 3.27(-8) | -3.45(-2) | 4.37(-4) | 5.75(-2) | -2.01(-2) | 2.03(-4) | -2.13(-4) | -1.40(-3) | 1.52(-3) |
| 7.00 | -4.52(-1) | 4.49(-1) | 1.17(-7) | -3.72(-2) | 5.34(-4) | 6.11(-2) | -2.09(-2) | 2.78(-4) | -2.31(-4) | -1.68(-3) | 1.80(-3) |
| 8.00 | -6.10(-1) | 6.06(-1) | 1.44(-7) | -4.25(-2) | 5.76(-4) | 7.32(-2) | -2.76(-2) | 3.09(-4) | -2.63(-4) | -1.84(-3) | 1.96(-3) |
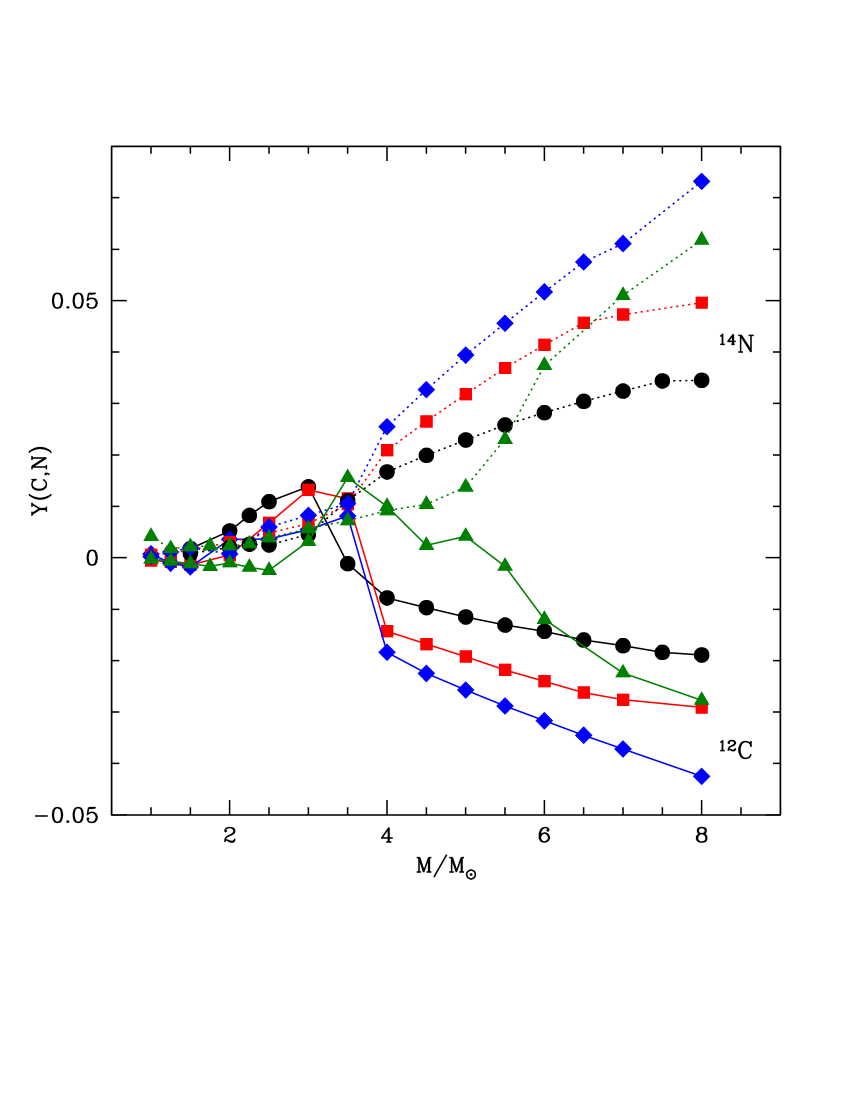
Fig. 8 shows the yields of helium and of the CNO elements of the high-metallicity models discussed in the present work. The helium yield increases with mass, ranging from almost null at the lowest masses, and reaching values of the order of for . The change in the slope of the YHe vs mass relationship is due to the onset of the second dredge-up, occurring after the exhaustion of the core helium in stars of mass above , which results in a significant increase in the surface helium. The trend with mass is positive, because the higher is the mass of the star, the larger the extent of the inwards penetration of the convective envelope taking place during the second dredge-up (Ventura, 2010). Since the second dredge-up occurs before the beginning of the TP-AGB phase, its results are more robust that those related to nucleosynthesis and mixing during the TP-AGB phase, whose description is affected by several uncertainties in the physical ingredients adopted (Karakas & Lattanzio, 2014). The 12C yields are positive in the low-mass domain, owing to the effect of the TDU, which results in the increase of the surface carbon (see right panel of Fig.6). The largest yields of 12C, of the order of , are produced by stars. Massive AGB stars destroy carbon via HBB (see top, left panel of Fig. 5), which is why they produce negative carbon yields. The 16O yields (not shown) are negative for , owing to the effects of HBB. However, even in the most extreme cases, i.e., the stars, the yields are not smaller than ; this is because the HBB experienced by stars of the metallicities discussed here is not efficient enough to significantly deplete the surface oxygen abundance.
The nitrogen yields are always positive. In the low-mass domain this is due to the effects of the first dredge-up, which increases the surface N abundance. No significant, further rise in the nitrogen content of the envelope is expected during the TP-AGB phase. The N yields of massive AGB stars reflect the effects of HBB: independently on whether the sole CN or the full CNO cycle is activated, the outcome is the synthesis of significant quantities of nitrogen. The N yields increase with the mass of the star, reaching in the most massive cases.
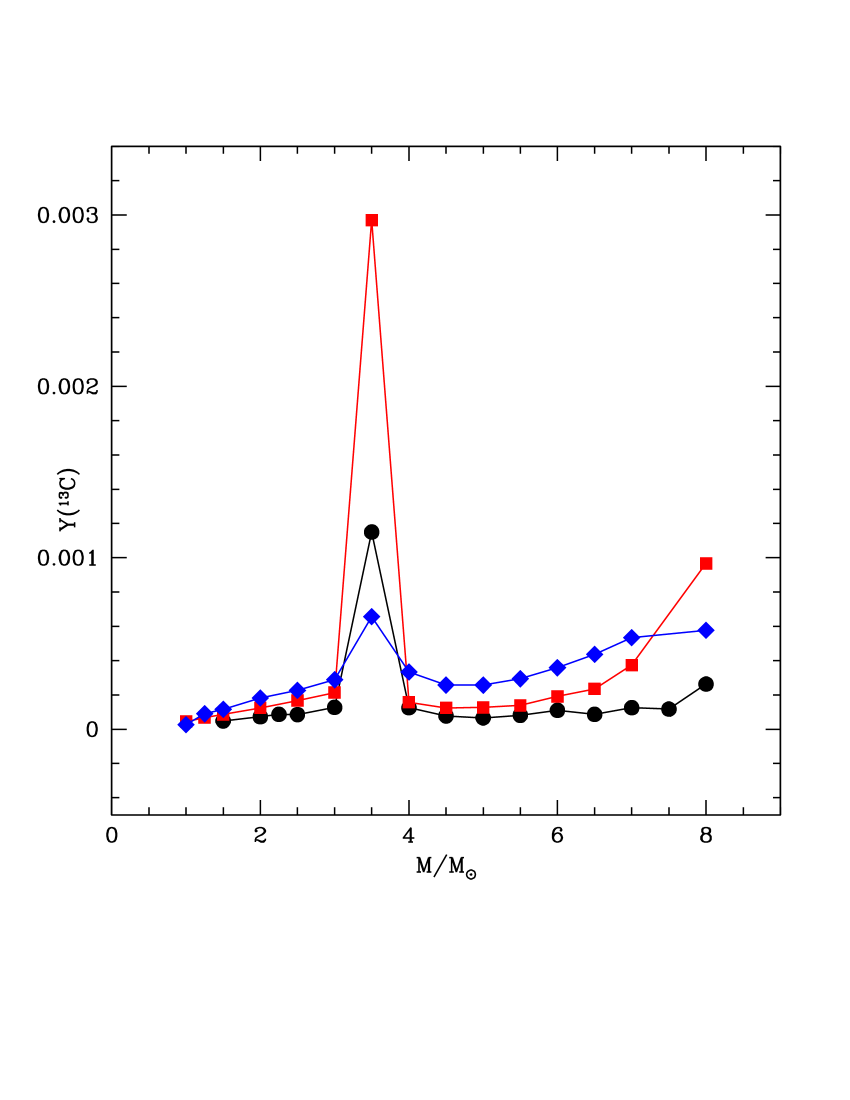
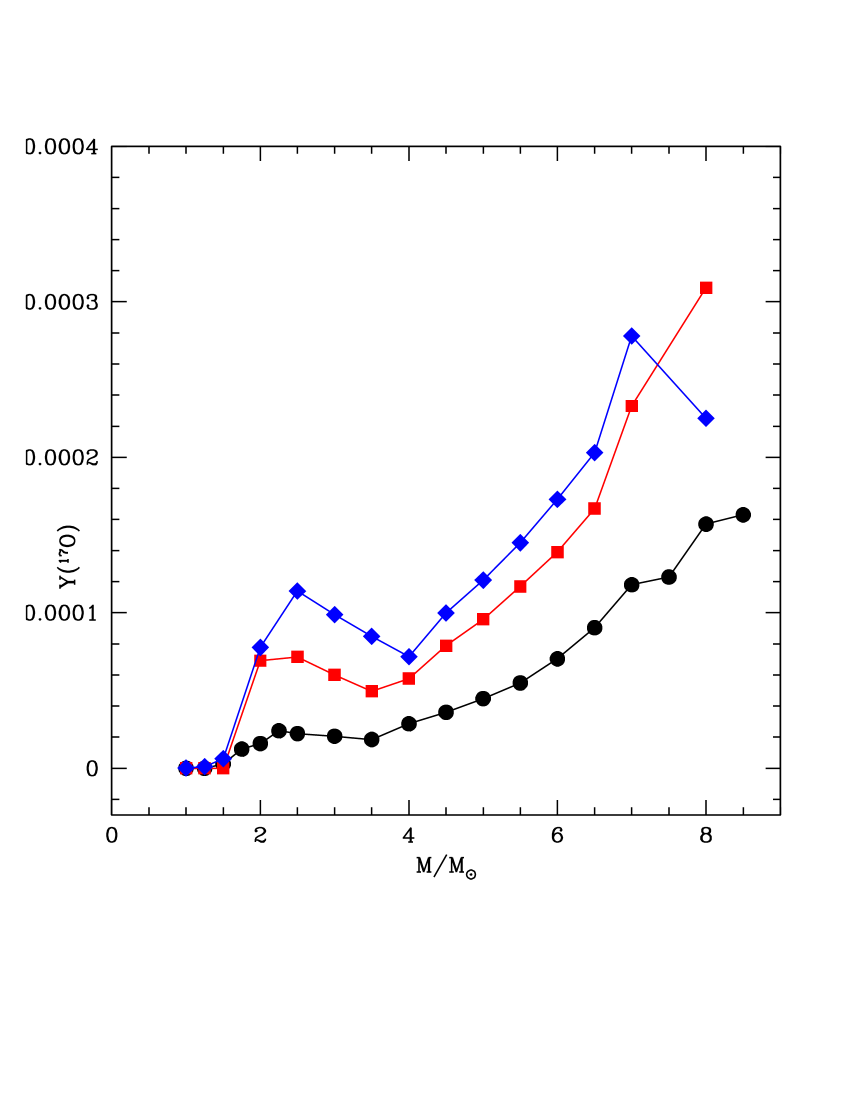
The yields of the minor isotopes 13C and 17O are found to increase almost monotonically as a function of both stellar mass and metallicity. They increase with the initial mass and metallicity of the star, with the exception of a spike in 13C (17O) production occurring around (Fig. 8, left- and right-handed lower panels, respectively). The prominent peak in the 13C yield is related to the combined effects of TDU and HBB in stars, the former mechanism favouring the increase in the surface 12C, later converted into 13C by proton captures. It has been recently pointed out (Romano et al., 2017, 2019; Zhang et al., 2018) that the CNO isotopic ratios may be used to probe the shape of the galaxy-wide IMF in high-redshift, massive dusty starbursts where direct measurements are unfeasible. These objects are thought to host a non-negligible fraction of super-solar metallicity stars (see, e.g., Johansson et al. 2012). Grids of super-solar metallicity yields as those presented in this study, therefore, will be extremely useful to spot IMF variations in extreme environments. Future implementation of our grids of super-solar metallicity stars into chemical evolution models for massive dusty starbursts will allow more robust predictions.
7 Comparison to other studies
Super-solar metallicity models were published by Karakas (2014a, hereinafter K14) and Weiss & Ferguson (2009).
k14 models with metallicity were calculated by means of the MONASH code. The authors present an exhaustive discussion on the efficiency of the TDU in the high-metallicity domain and how the initial mass and helium affect the AGB evolution. In a subsequent paper, Karakas & Lugaro (2016, hereainfter KL16) presented the gas yields of K14 models, which we compare with the results presented in Section 6.
Because the evolution of AGB stars is driven by the mass of the degenerate core we check for consistency between the K14 core masses and ours at the beginning of the AGB phase. The core masses reported in Column 6 of Table 1 are similar to those by K14 for stars. In the larger-mass domain our core masses are slightly higher than K14, with a shift in the initial mass versus core mass relationship.
The structure differences between our models and those published by K14 can be seen in the two panels of Fig. 3, where the peak luminosities and the hottest temperatures reached during the AGB phase are shown. A remarkable difference is that our massive AGB models are brighter and hotter than those of K14, with larger discrepancy for higher initial masses. These differences tend to vanish in the domain.
Similar differences between ours and MONASH models were found for solar (Ventura et al., 2018) and sub-solar metallicities (Ventura et al., 2015). The main reason for the dissimilarities is the treatment of turbulent convection: we calculate the temperature gradient within regions unstable to convection motions via the FST model (see Section 3.1), whereas K14 uses the mixing length theory (Vitense, 1953). As discussed in Section 2, the treatment of convection in the envelope deeply affects the physical behaviour of AGB stars, particularly under HBB conditions: Ventura & D’Antona (2005a) showed that FST modelling favours a more efficient nucleosynthesis in the internal regions of the envelope than in the MLT case, which leads to higher luminosities and rates of mass loss.
The difference with K14 are particularly evident in stars of mass corresponding to the minimum threshold required to activate HBB, which is in the present analysis, and in K14. This discrepancy is entirely due to the treatment of convection; we rule out that dissimilarities in the core mass play a role here, because our values (Column 6 of Table 1) are the same within as those by K14 in the same mass range.
The bottom, left panel of Fig. 3 shows the overall duration of the TP-AGB phase. The results presented here and those by K14 are similar in the domain, despite the large difference in the luminosity, which should make the duration of the AGB phase of our models much shorter than that of K14. Ventura et al. (2018) found that at solar metallicity the time scale of the AGB phase calculated with the ATON code is between 2 and 3 times shorter than the Monash models of the same mass. The reasons for this is in the treatment of mass loss. ATON uses the description by Blöcker (1995), according to which is strongly dependent on the luminosity. The K14 computations instead are based on the Vassiliadis & Wood (1993) treatment, where the rate of the mass loss is set to increase with the period of the star. In AGB stars of lower metallicity than presented in this paper the Blöcker (1995) description leads to higher because of the large luminosities typical of the stars experiencing HBB; in this case, the differences between ATON and MONASH models is enhanced by the larger luminosities attained by ATON models. For the higher metallicities presented in this paper the situation is different because: a) HBB is weaker than at lower metallicity, thus the luminosities are smaller (compare the and lines in the top, left panel of Fig. 3); b) metal-rich stars evolve to larger radii, which result in generally longer periods. Consequently, at , the mass-loss rate of Vassiliadis & Wood (1993) is more efficient than that of Blöcker (1995). In massive AGB stars, these effects partly counterbalance those related to the higher luminosities experienced by the ATON models calculated with the FST convection description, making the duration of the whole TP-AGB phase of the present models similar to K14. The higher rates of mass loss predicted by the Vassiliadis & Wood (1993) treatment is the reason why also in the low-mass domain the duration of K14 models is shorter than in our models.
The KL16 yields are compared to ours in Fig. 8. The helium yields are similar, with a shift related to the differences in the core masses outlined at the beginning of this section, and to the fact that most of the surface helium enrichment occurs during the second dredge-up, for which the results presented by different research groups are in strong agreement (Ventura, 2010). The carbon and nitrogen yields present significant differences, related to the different physical behaviour discussed above. The carbon yields presented here are significantly smaller than KL16 for stars, owing to the much more efficient HBB nucleosynthesis experienced. This is particularly evident in the mass range, which exhibits the largest differences in the temperatures at the bottom of the envelope, as shown in the right panel of Fig. 3. The models experience a much stronger HBB than KL16, thus produce more nitrogen via 12C proton capture reactions: this is the reason for the differences in the N yields in the right panel of Fig. 8.
The models by Weiss & Ferguson (2009) are compared to ours and to K14 in Fig. 3. The comparison is limited to the duration of the AGB phase and to the final CO, because neither the largest luminosity and temperature at the base of the envelope nor the chemical yields are given in Weiss & Ferguson (2009).
For stars of mass below the final carbon-to-oxygen ratio by Weiss & Ferguson (2009) is practically the same as the results presented here and by K14, indicating that the efficiencies of TDU are similar in the three cases. For stars of higher mass the results by Weiss & Ferguson (2009) are somewhat intermediate between the final CO found in the present work and those by K14, suggesting that: a) the HBB experienced is weaker than in our case; b) the TDU efficiency is smaller than in K14. While the weaker HBB is explained by the difference in convection modelling, point (b) above is related to the description of convective borders adopted (as discussed in Section 2, K14 results are based on the algorithm proposed by Lattanzio (1986), whereas Weiss & Ferguson (2009) impose an exponential decay of velocities from the border of all the convective regions formed)
The results shown in the bottom, left panel of Fig. 3 indicate that the AGB evolution predicted by Weiss & Ferguson (2009) is faster than in the present study and in K14, for almost all the masses considered. This is due to the treatment of mass loss, because the fitting formula by van Loon et al. (2005) leads to mass loss rates times higher than the predictions based on the Blöcker (1995) and Vassiliadis & Wood (1993) formulae in the super-solar metallicity domain.
8 Dust production

The amount and mineralogy of the dust formed in the circumstellar envelope of AGB stars are determined by the surface chemical composition and by global physical parameters, in particular by a) the rate of the mass loss, which determines the density of the wind, and in turn the number of gaseous molecules available to condensation; b) the luminosity of the star, which affects the radiation pressure acting on the newly formed dust grains; and c) the effective temperature, which sets the location of the condensation zone (Ferrarotti & Gail, 2006). Among the various species, those most thermodynamically stable are alumina dust and SiC, for oxygen-rich AGBs and carbon stars, respectively. The condensation zone of these compounds is more internal than that of silicates and solid carbon, which are characterized by higher extinction coefficients (Ferrarotti & Gail, 2006).
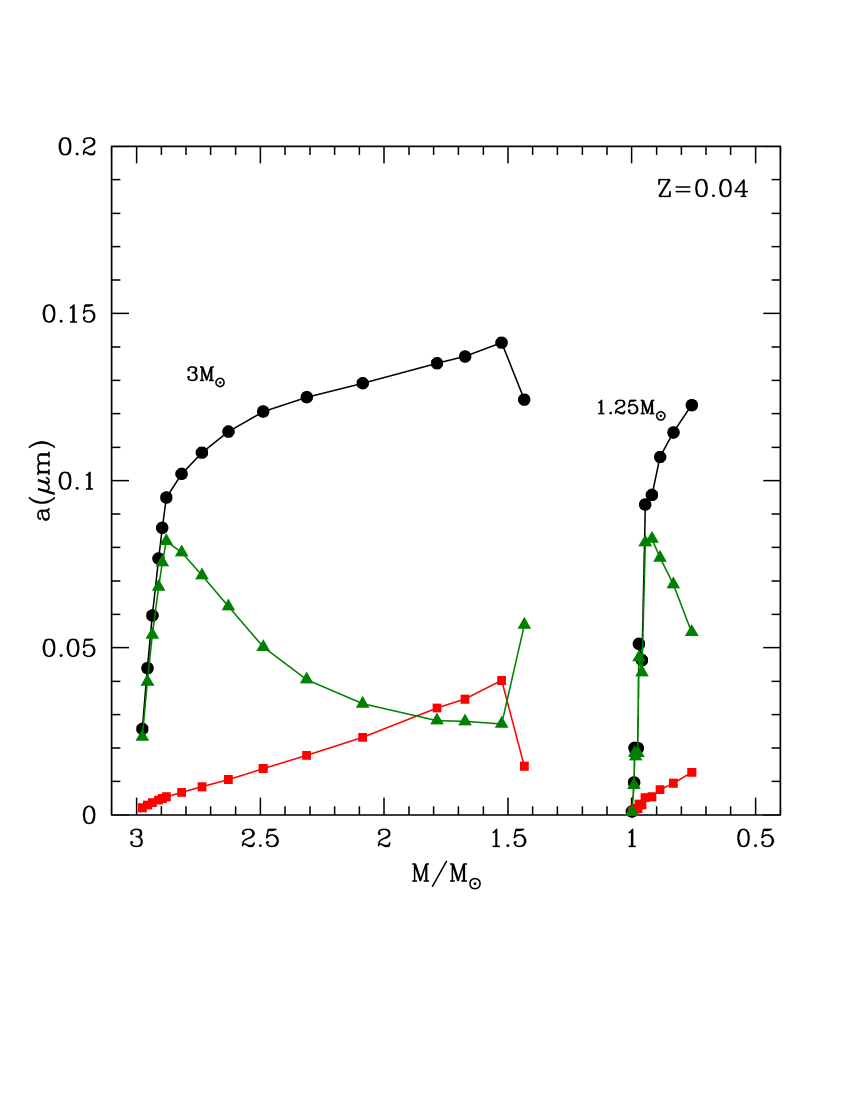
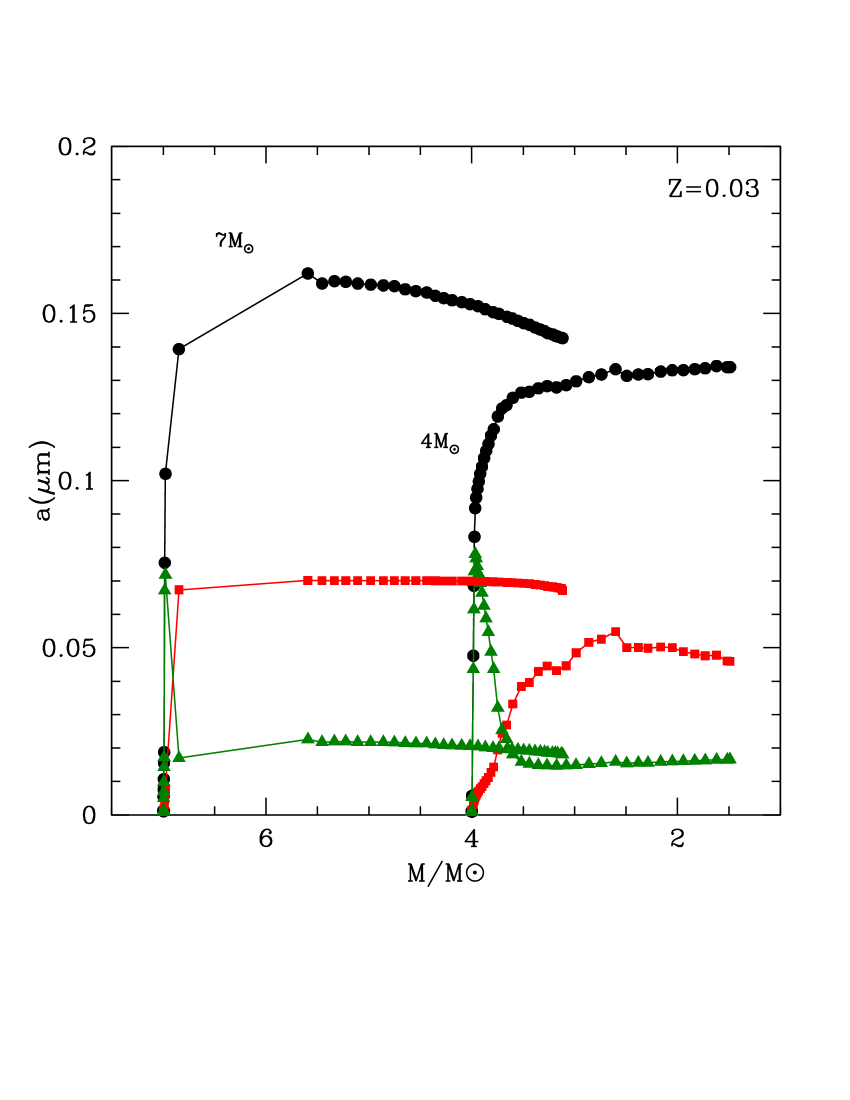
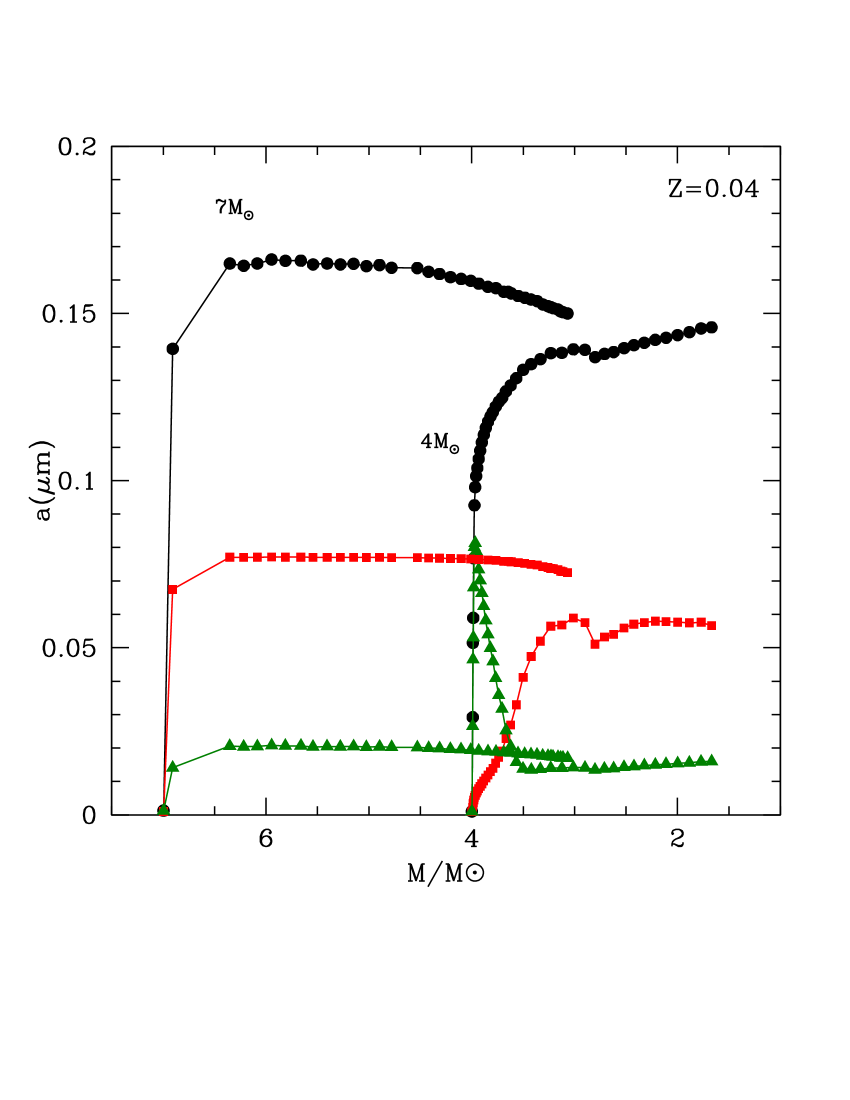
In the schematization adopted here the dust grains of the different species form in the condensation zone and grow from nano-size dimensions until they reach an asymptotic size when the gas densities drop below the level at which the rate of growth becomes much smaller than the velocity with which the wind moves outwards. It is to this asymptotic dimension that we refer to in the following discussion and in Fig. 9 showing the size of the grains of the considered dust species, formed in the wind of stars of different mass.
Before starting the discussion of the results obtained in the present investigation, we believe important to underline that the modelling of dust formation used here, mostly based on the schematization proposed by the Heidelberg group, is a simplified description of a much more complex situation, where the combination of shocks and pulsation effects carry gas molecules into more external and cooler regions of the circumstellar envelope, where dust formation may occur in conditions substantially different than those found in the static wind proposed here. The most serious limitation in the present description is that mass loss is assumed apriori, whereas it should be the outcome of a self-consistent treatment of the wind dynamics, in agreement with the studies by Mattsson et al. (2008) and the most recent investigations by Bladh et al. (2019a, b). The results in terms of dust production presented here must be taken with some caution, particularly for what attains the production of carbonaceous species. Indeed the present findings are based on the rate of mass loss calculated by means of the Wachter et al. (2002, 2008) works, which, as discussed in section 2, neglects any role of the carbon excess: this assumption may lead to an overestimation of the ’s found here (Bladh et al., 2019b), considering that in the few models that reach the C-star stage the carbon excess is small, owing to the large oxygen content of the surface regions of the star. It goes without saying that the growth of dust particles, particularly of the carbon grains, might be overestimated as well.
Table 4 reports the mass of the total and the different species of dust produced by our models of different mass during the AGB life. Given the significant differences in the evolution properties of AGB stars of different masses, we divide the description below in three mass ranges.
8.1 Production of silicates in low-mass AGB stars ()
The models shown in Fig. 6 represent the low-mass AGB stars with initial mass below that experience only a few () TPs before to loose the entire envelope. Considering the small number of TDU events, these stars do not reach the C-star phase and evolve as O-rich stars for the whole AGB (right panel of Fig. 6). Based on the previous discussion, the dust formed in their envelope is composed of silicates, alumina dust, and solid iron, with no traces of carbonaceous particles.
The dominant contribution to the dust budget is provided by silicates, particularly by olivine grains, whose size increases steadily during the AGB phase until it reaches dimensions of the order of m towards the final evolutionary stages, when the percentage of silicon locked into dust particles approaches . Negligible quantities of alumina dust are formed, owing to the low rates of mass loss experienced below yr. We see in Fig. 9 that the size of the solid iron particles formed is anticorrelated with olivine; this is because the iron dust formation layer is more external than that of silicates, thus a significant production of the latter results in a significant wind acceleration, which favours the drop in the gas density and the decrease of the rate of growth of iron grains. During the first TPs almost of gaseous iron is condensed into dust grains of size slightly below m; the size of iron particles drops to m during the final AGB stages, when silicates form in significant quantities, with the fraction of iron locked into dust being below .
The metallicity has some effects on the dust formed by low-mass AGBs, the , star produces more dust than its counterpart, owing to the higher quantities of silicon, aluminium and iron in the surface layers, and to the higher rates of mass loss experienced; however, as shown in Fig. 9, the differences in the size of the particles formed are within .
8.2 Dust production by stars close to the mass threshold to activate HBB ()
Stars of initial mass close to experience several TPs and TDU episodes, with the consequent increase in the surface carbon. These stars are represented by the models in Fig. 9. A distinction based on metallicity is mandatory here, because, as discussed in Section 5.2, the stars in this mass domain reach the C-star stage, whereas most of the stars evolve as O-rich (see right panel of Fig. 6).
We start from the case, which is similar to the lower-mass stars discussed in Section 8.1. The dust formed in the wind has a dominant contribution from silicates and the amounts of iron dust and silicates are anti-correlated. The size of the silicates grains formed is m, with of silicon locked into dust. The production of silicates is more efficient than in the case, because the rate of the mass loss reaches higher values, up to yr in the final evolutionary phases. An additional difference, also due the higher rate of mass loss, is that the formation of alumina dust is not negligible in this case: during the final phases the fraction of aliminium condensed into alumina dust is and the size of Al2O3 grains is m (see the red squares in the top, right panel of Fig. 9, which represent the size of Al2O3 grains). According to the present modelling the C-star stage is reached only by stars of initial mass , during the very final AGB phases: however, the carbon excess to oxygen is very small, thus the formation of carbonaceous dust particles is negligible.
The behaviour of the star of metallicity is qualitatively different, because it becomes a C-star during the final (in time) of the AGB evolution. Note that although the duration of the phase during which the star is O-rich is much longer than the C-star phase, of the mass is lost after the star becomes a C-star (see right panel of Fig. 6): the dust produced by these stars is therefore dominated by carbonaceous particles and solid iron. The amount of silicates produced is smaller than in the higher metallicity star and the formation of alumina dust is negligible: this is because the production of these species is limited to the first part of the AGB phase, when the rate of mass loss is below a few yr.
During the C-star phase the dust mineralogy is dominated by SiC and solid iron, due to the low surface C excess, with C/O ratio below for a significant fraction of the C-rich phase. The SiC grains reach dimensions m, whereas the size of solid carbon particles is below m. The results reported in the top, left panel of Fig. 9 indicate that the size of SiC grains keeps constant during the whole AGB phase: this is a saturation effect due to the fact that all the residual silicon not already locked into SiS molecules, i.e., of the original silicon abundance, is condensed into dust. Conversely, only of carbon is locked into solid particles. The consumption of gaseous silicon by formation of SiC dust was explored in AGB stars of sub-solar metallicity by Ventura et al. (2014b).
These conditions prove extremely favourable to the formation of large amounts of solid iron; we see in Fig. 9 that during the phases just before and immediately after the star becomes C-star, solid iron is the dominant species, the grain size reaching m, with almost half of gaseous iron condensed into dust. The formation of solid iron grains is partly due to the large availability of iron in the surface regions of high-metallicity stars. Furthermore, compared to lower metallicity stars, the low C excess affects the efficiency of the growth of solid carbon grains and favours the formation of solid iron grains, which is otherwise inhibited by the fast acceleration of the wind triggered by the large extinction coefficients of solid carbon particles.
During the latest evolutionary phases, after more carbon is accumulated in the surface regions via the recurrent TDU events, and the surface CO exceeds , the size of carbon grains formed reaches m, with of carbon condensed into dust. The amount of carbon dust exceeds SiC only during these late phases.
The extinction properties of solid carbon grains favour the acceleration of the wind, which in the star shown in the top, left panel of Fig. 9, reaches velocities slightly below 30 Km/s. These results indicate that the winds of carbon stars in the super-solar metallicity domain are slower than in the lower metallicity case, owing to the smaller values of the carbon excess in the surface regions. In the stars of initial mass and we find smaller velocities during the C-star phase, in the range 20-30 Km/s. These results must be taken with some caution, because the analysis by Wachter et al. (2002, 2008), used in the present investigation to derive the mass loss rates, holds for values of the carbon excess above 8.2, whereas in these stars, as reported in Table 2, we find .
Ventura et al. (2012) warned that the model predictions for the production of silicates during part of the O-rich phase of low-mass stars are not robust. This is due to the fact that the wind is not accelerated, which renders the results sensitive to the assumed velocity with which the wind enters the condensation zone. We stress here that in all the cases discussed here so far of dust production in low-mass AGB stars and the formation of silicates during the O-rich AGB phases of the star of metallicity , the wind is accelerated after the formation of dust, until reaching velocities of the order of 10 Km/s. This result is due to the large amounts of silicon and aluminium available in the envelope of super-solar metallicity stars, and renders the present findings more robust than for stars of lower metallicity, as they are independent on the assumptions regarding the initial velocity (Ventura et al., 2012).
8.3 HBB and dust formation ()
One of the most significant differences between the evolution of low-mass and massive AGB stars is the overall energy release: comparing the results in the left panel of Fig. 4 and in the left panel of Fig. 6 it is clear that while the luminosities of low-mass AGBs are in the range , the stars experiencing HBB evolve at higher luminosities . This difference affects the rate of mass loss, when considering the high sensitivity of the mass loss description by Blöcker (1995) to the luminosity.
In fact, massive AGB stars experience rates of mass loss in the range yr, significantly larger than those experienced by their lower mass counterparts. These large rates of mass loss favour high wind densities, which trigger the production of large quantities of dust (Ventura et al., 2012). The bottom panels of Fig. 9 show that the dimension of olivine, alumina dust, and solid iron grains are generally higher than in the low-mass domain, shown in the top panels of the same figure. The trends with mass, mostly due to the behaviour of luminosity and mass loss rate, are clear in Fig. 9: the size of olivine grains slightly increases from m, for the star, to m, in the case. The fraction of silicon condensed into dust is in the range . The rates of mass loss experienced by massive AGB stars are sufficiently large to favour copious production of alumina dust; the Al2O3 grains formed reach dimensions ranging from m () to m (). The percentage of aluminium locked into Al2O3 is generally above . In the models of higher mass we see in Fig. 9 that the size of alumina dust particles, m, are unchanged during the AGB phase; this is due to the saturation effect, first described in massive AGB stars of solar chemical composition by Dell’Agli et al. (2014a), with almost all the gaseous aluminium available locked into dust grains. The formation of silicates enhances the effects of radiation pressure, acting on dust grains. For the stars experiencing HBB we find that the final wind velocities are slightly in excess of 20 Km/s. This results is very similar to the velocities found by Ventura et al. (2018) for solar metallicity stars: the latter models produce lower amounts of silicates (see Fig. 11) than their higher-metallicity counterparts, but this is compensated by the larger luminosities (see Fig. 3), which increase the effects of radiation pressure on the acceleration of the wind.
We note some metallicity effects, where the higher-metallicity stars form dust particles of slightly larger size, though the differences are within .
| MC | MSiC | |||||
|---|---|---|---|---|---|---|
| 1.00 | 2.00(-4) | 1.44(-4) | 1.15(-7) | 5.34(-5) | - | - |
| 1.25 | 4.38(-4) | 3.45(-4) | 5.45(-7) | 8.85(-5) | - | - |
| 1.50 | 8.42(-4) | 6.99(-4) | 2.40(-5) | 1.13(-4) | - | - |
| 2.00 | 1.37(-3) | 1.15(-3) | 4.12(-6) | 2.08(-4) | - | - |
| 2.50 | 1.91(-3) | 3.57(-4) | 4.34(-7) | 8.72(-4) | 3.33(-5) | 6.34(-4) |
| 3.00 | 2.82(-3) | 1.16(-4) | 3.88(-8) | 4.14(-4) | 1.33(-3) | 9.44(-4) |
| 3.50 | 3.17(-3) | 3.32(-4) | 8.63(-7) | 2.51(-3) | 7.76(-5) | 2.36(-4) |
| 4.00 | 4.34(-3) | 4.09(-3) | 1.61(-4) | 8.59(-5) | - | - |
| 5.00 | 6.13(-3) | 5.69(-3) | 3.98(-4) | 3.71(-5) | - | - |
| 5.50 | 7.38(-3) | 6.78(-3) | 5.60(-4) | 3.63(-5) | - | - |
| 6.00 | 8.59(-3) | 7.86(-3) | 6.92(-4) | 3.93(-5) | - | - |
| 6.50 | 9.56(-3) | 8.63(-3) | 8.90(-4) | 4.37(-5) | - | - |
| 7.00 | 1.22(-2) | 1.11(-2) | 1.07(-3) | 5.85(-5) | - | - |
| 8.00 | 8.15(-3) | 3.92(-3) | 7.70(-7) | 3.85(-3) | - | - |
| 1.00 | 2.35(-4) | 1.80(-4) | 1.76(-7) | 5.25(-5) | - | - |
| 1.25 | 4.67(-4) | 3.96(-4) | 9.64(-7) | 6.70(-5) | - | - |
| 1.50 | 1.03(-3) | 9.23(-4) | 4.62(-6) | 9.75(-5) | - | - |
| 2.00 | 1.86(-3) | 1.69(-3) | 1.12(-5) | 1.56(-4) | - | - |
| 2.50 | 2.28(-3) | 1.86(-3) | 1.30(-5) | 3.96(-4) | - | - |
| 3.00 | 3.06(-3) | 2.76(-3) | 1.95(-5) | 2.75(-4) | - | - |
| 3.50 | 3.75(-3) | 2.95(-3) | 6.08(-5) | 7.29(-4) | - | - |
| 4.00 | 6.88(-3) | 6.38(-3) | 3.98(-4) | 1.01(-4) | - | - |
| 4.50 | 6.87(-3) | 6.30(-3) | 5.33(-4) | 3.89(-5) | - | - |
| 5.00 | 8.08(-3) | 7.33(-3) | 7.05(-4) | 3.80(-5) | - | - |
| 5.50 | 9.17(-3) | 8.30(-3) | 8.36(-4) | 3.60(-5) | - | - |
| 6.00 | 1.10(-2) | 9.87(-3) | 1.09(-3) | 4.10(-5) | - | - |
| 6.50 | 1.15(-2) | 1.03(-2) | 1.15(-3) | 3.92(-5) | - | - |
| 7.00 | 1.37(-2) | 1.23(-2) | 1.36(-3) | 5.04(-5) | - | - |
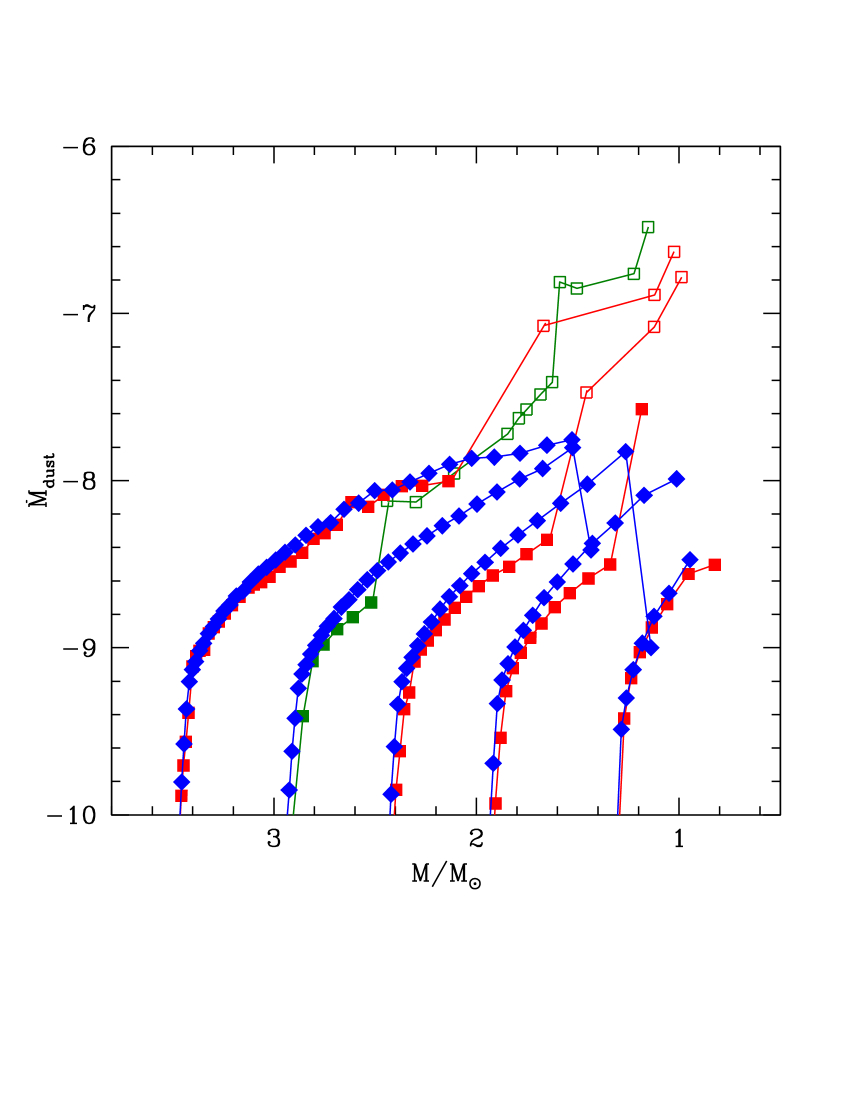
8.4 The dust production rate
To understand the feedback from AGB stars to the cycle of matter of the host system, we discuss the rate at which AGB stars eject dust in the interstellar medium, i.e., the dust production rate (DPR). The determination of the DPR is crucial not only to understand how dust is produced in single galaxies (Srinivasan et al., 2009, 2016; Schneider et al., 2014; Dell’Agli et al., 2016, 2018, 2019), but also, on more general grounds, to assess whether the dust produced by stars is able to reproduce interstellar dust abundances (Zhukovska et al., 2008).
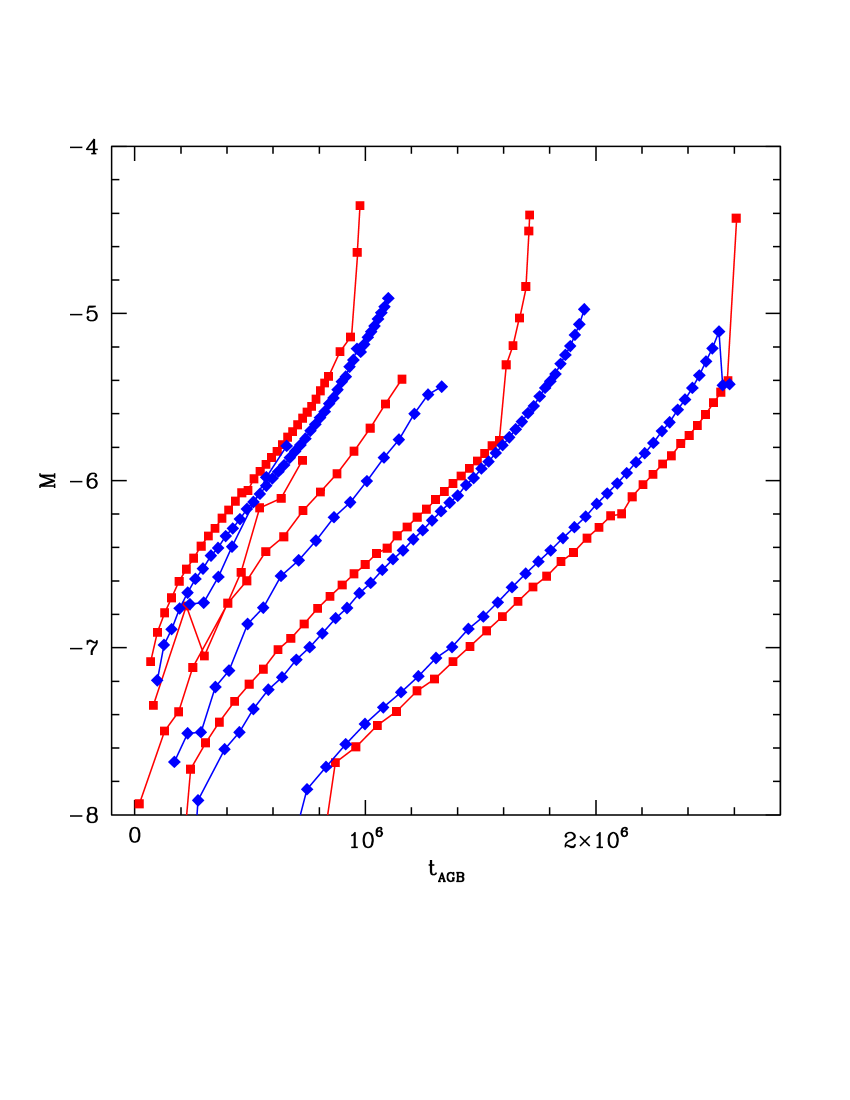
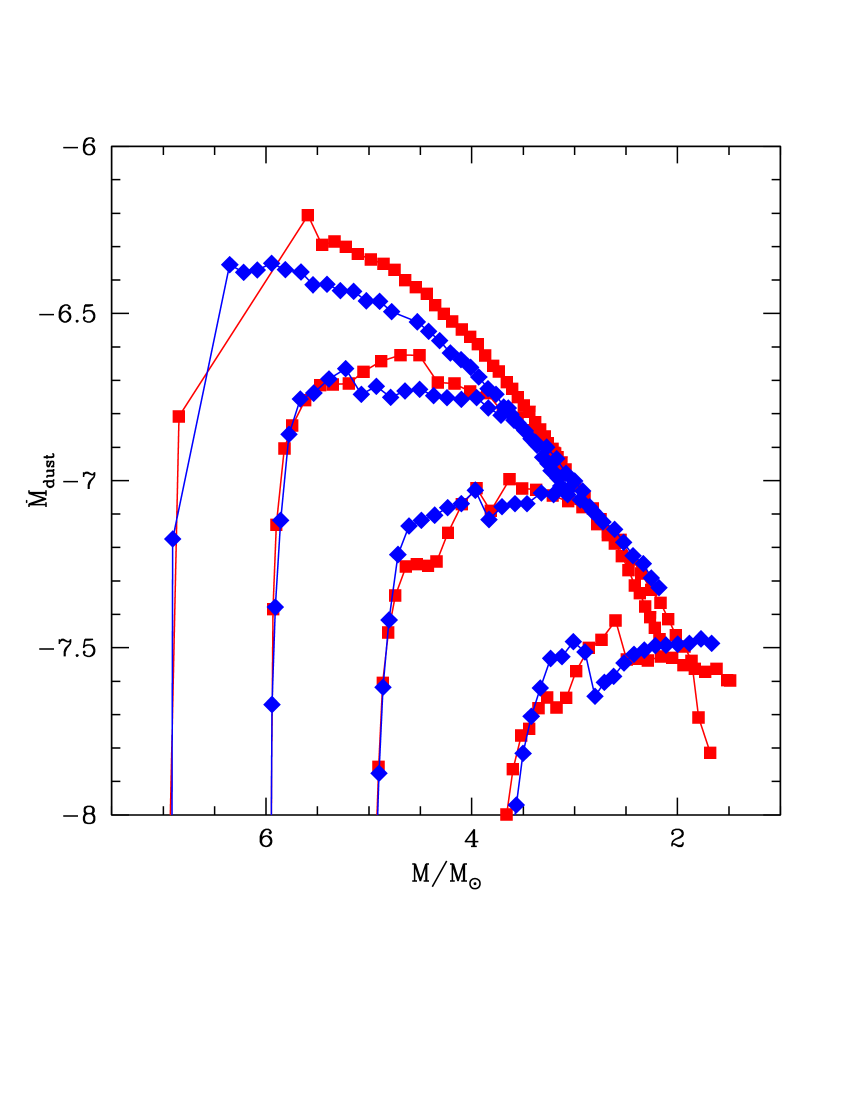
In Fig.10 we show the variation of the DPR of the same models shown in Fig. 4 and 6 during the AGB life. The lines represent the overall DPR at each evolutionary stage obtained by summing up the contributions from all the individual dust species.
The DPR of low-mass stars increases during the AGB phase, consistently with the earlier discussion and the results shown in the top panels of Fig. 9. The DPR are generally in the range yr and the main contribution is provided by silicates. The sole exceptions to this general behaviour are given by stars of metallicity : these stars become carbon stars and during the C-star phase they form dust with rates up to yr in the final evolutionary stages.
Massive AGB stars (right panel of Fig.10) behave differently: the trend of DPR follows the variation of the luminosity because the dust production is strictly connected with the efficiency of HBB, as it is the overall energy flux. The DPR is higher during the initial AGB phases, when the luminosities and the temperatures at the base of the convective envelope are higher (see Fig. 4), then decreases towards the end of the AGB evolution. A trend of DPR with mass is clearly visible in Fig. 10: the largest DPR grows from a few yr, in the stars of mass , up to yr in the case.
8.5 The overall dust mass by super-solar metallicity AGB stars
The amounts of dust produced by our models of different mass during the AGB life are summarised in Fig.11, where we also show for comparison the dust masses for solar metallicity models of Ventura et al. (2018), the results at and of Ferrarotti & Gail (2006) and the models by Nanni et al. (2014).
The mass of dust increases with the initial mass of the star, spanning the range for and for . Most of the dust is under the form silicates, with the exception of the stars with initial mass , which produce mostly carbonaceous dust; this is consistent with the earlier study by Nanni et al. (2014). On the average, the amount of dust produced is higher than in solar metallicity AGB stars. A striking difference between stars of different metallicity is the behaviour of the stars of solar metallicity, which produce large amount of carbon dust, of the order , comparable with those of the most massive AGB stars. This important difference is due to the higher carbon excess reached by solar metallicity stars with respect to the counterparts studied here.
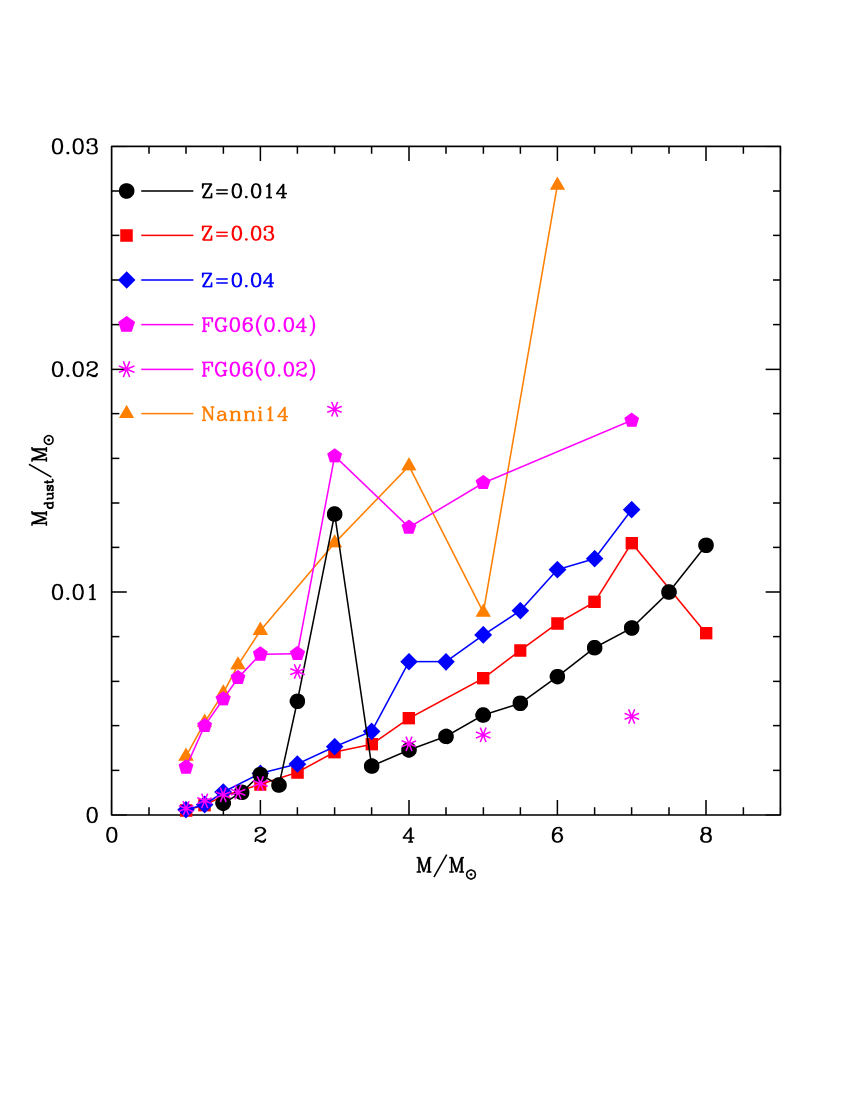
Our results are on average a factor lower than those of Ferrarotti & Gail (2006). This difference is due to the adopted description of the mass loss. While we use the treatment by Blöcker (1995), Ferrarotti & Gail (2006), like K14, adopted the mass loss versus period relationship by Vassiliadis & Wood (1993). As discussed in Section 7, in metal-rich AGB models the mass loss rates determined by applying the Vassiliadis & Wood (1993) are generally higher than Blöcker (1995), which leads to higher rates of dust production in the wind.
The difference in the total dust produced during the AGB life is particularly relevant in the low-mass domain, where the dust masses by Ferrarotti & Gail (2006) are times higher than those calculated here. The difference is smaller for the stars experiencing HBB, as the present models experience stronger HBB conditions and evolve at larger luminosities compared to Ferrarotti & Gail (2006).
The dust masses found by Nanni et al. (2014), indicated with orange triangles in Fig. 11, are similar to those by Ferrarotti & Gail (2006) in the low- and intermediate-mass domain. For stars of mass the amount of dust by Nanni et al. (2014) are substantially higher; this is connected with the formation reaction for silicates used by Nanni et al. (2014), discussed in Nanni et al. (2013), which makes the formation of silicates to take place at temperatures of the order of 1400 K, closer to the stellar surface than in the present and in Ferrarotti & Gail (2006) models.
9 Conclusions
We studied the evolution through the AGB phase of stars of super-solar metallicities, and . We find that stars of mass above experience HBB at the base of the convective mantle. These objects evolve at luminosities during the AGB phase, with time scales ranging from Myr, for stars, to yr, for . The surface chemical composition is driven by proton captures in the internal regions of the convective envelope, with the destruction of the surface 12C and the synthesis of large quantities of 14N. Significant amounts of lithium and sodium are produced, whereas the destruction of the surface 16O is modest.
Low-mass stars not exposed to HBB experience several TDU events, which gradually increase the surface carbon. The C-star stage is reached only by stars of metallicity , with the surface CO reaching a maximum of . It is not expected that C-stars are formed at .
Dust production at super-solar metallicity is dominated by the formation of silicates particles, mostly olivine, with a contribution of alumina dust and solid iron. The only exception is represented by stars of metallicity , whose dust production is dominated by the carbonaceous species, silicon carbide and solid carbon, formed during the final AGB phases. The total mass of dust formed depends on the initial mass of the star, ranging from , for stars of mass , to , for .
Regarding the gas pollution, our new models extend the available grids of stellar yields to super-solar metallicity. Nearly 70% of solar 14N is synthesised in AGB stars, according to recent chemical evolution model results (Romano et al., 2019). This number is expected to be even higher in the inner disc of the Galaxy. Since the 14N yield continues to increase with stellar metallicity (see Fig 8), with the highest yields found for the most metal-rich stars, stellar yields from super-solar metallicity models are required in chemical evolution studies to properly assess the 14N enrichment in the most evolved environments. Another example is 12C, whose yields are also dependent on metallicity. Carbon is observed in massive local ellipticals, as well as in their dust-obscured progenitors at high redshifts, and can be used to constrain the timescales of formation of these systems (e.g. Johansson et al. 2012). A meaningful quantification of the timescale for the most massive ellipticals require the adoption of stellar yields computed for super-solar metallicity stars. Finally, as mentioned in Section 4, the adoption of super-solar metallicity yields of 13C and 17O derived from self-consistent low- and intermediate-mass star models is mandatory for improving the modeling of dusty starburst galaxies at high redshifts and, consequently, the derivation of their galaxy-wide stellar IMF (see Romano et al. 2017; Zhang et al. 2018).
Future work also involves comparison of the nucleosynthetic predictions from the ATON AGB models to the isotopic composition of meteoritic stardust grains. For ATON such comparison has the advantage, with respect to those performed using other codes, of also being able to predict the expected types, amounts, and sizes of the dust produced by the potential AGB parent stars of the meteoritic grains. Such comprehensive, comparative investigation should include both carbonaceous and oxide dust, and both the light elements and those heavier than iron, which are produced in AGB stars by neutron captures. For the latter, an initial application of this innovative approach of combining AGB nucleosynthesis and dust formation predictions has been presented in relation to large (m-sized) SiC grains by Lugaro et al. (2020, submitted), who concluded that these large grains originated from AGB stars of super-solar metallicity and that the initial number of dust seeds should decrease with increasing metallicity. However, such work combined neutron-capture nucleosynthesis predictions from the MONASH models and dust formation predictions from the ATON models. As the development of tools that allow predictions for neutron-capture nucleosynthesis using ATON are almost completed (Yague et al., in preparation), in the near future a more self-consistent approach will be possible.
Acknowledgements.
P.V. and D.R. benefited from the International Space Science Institute (ISSI, Bern, CH, and ISSI-BJ, Beijing, CN) thanks to the funding of the team ”Chemical abundances in the ISM: the litmus test of stellar IMF variations in galaxies across cosmic time”. M.L. acknowledges the financial support of the Hungarian National Research, Development and Innovation Office (NKFI), grant KH_18 130405 and the Lendület grant (LP17-2014) of the Hungarian Academy of Sciences.References
- Bensby et al. (2014) Bensby, T., Feltzing, S., Oey, M. S. 2014, A&A, 562, A71
- Bertola et al. (1995) Bertola, F., Bressan, A., Burstein, D., et al. 1995, ApJ, 438, 680
- Bladh et al. (2019a) Bladh, S., Eriksson, K., Marigo, P., et al. 2019a, A&A, 623, A119
- Bladh et al. (2019b) Bladh, S., Liljegren, S., Höfner, S., et al. 2019b, A&A, 626, A100
- Blöcker (1995) Blöcker, T., 1995, A&A, 297, 727
- Blöcker & Schöenberner (1991) Blöcker, T., & Schöenberner, D. 1991, A&A, 244, L43
- Boothroyd & Sackmann (1999) Boothroyd, A. I., & Sackmann, I.-J. 1999, ApJ, 510, 232
- Cameron & Fowler (1971) Cameron, A. G. W., & Fowler, W. A., 1971, ApJ, 164, 111
- Canuto & Mazzitelli (1991) Canuto V. M. C., & Mazzitelli, I., 1991, ApJ, 370, 295
- Casagrande et al. (2011) Casagrande, L., Schönrich, R., Asplund, M., et al. 2011, A&A, 530, A138
- Charbonnel & Lagarde (2010) Charbonnel, C., & Lagarde, N. 2010, A&A, 522, A10
- Chen et al. (2019) Chen, Y. Q., Zhao, G., Zhao, J. K., et al. 2019, AJ, 158, 249
- Cox (1980) Cox, J. P. 1980, Theory of Stellar Pulsation (Princeton University Press, Princeton) 165
- Cox (1969) Cox, A. N.,& Stewart, J. N. 1969, Academia Nauk, Scientific Information 15, 1
- Cristallo et al. (2009) Cristallo, S., Straniero, O., Gallino, R., et al. 2009, ApJ, 696, 797
- Cristallo et al. (2011) Cristallo, S., Piersanti, L., Straniero, O., et al. 2011, ApJS, 197, 17
- Cristallo et al. (2015) Cristallo, S., Straniero, O., Piersanti, L., et al. 2015, ApJS, 219, 40
- D’Ercole et al. (2008) D’Ercole, A., Vesperini, E., D’Antona, F., et al. 2008, MNRAS, 391, 825
- Ek et al. (2019) Ek, M., Hunt, A. C., Lugaro, M., et al. 2019, Nature Astronomy, 4, 273
- Dell’Agli et al. (2014a) Dell’Agli, F., García-Hernández, D. A., Rossi, C., et al. 2014a, MNRAS, 441, 1115
- Dell’Agli et al. (2014b) Dell’Agli, F., Ventura, P., Garcia Hernandez, D. A., et al. 2014b, MNRAS, 442, L38
- Dell’Agli et al. (2015a) Dell’Agli, F., Ventura, P., Schneider, R., et al. 2015a, MNRAS, 447, 2992
- Dell’Agli et al. (2015b) Dell’Agli, F., García-Hernández, D. A., Ventura, P., et al. 2015b, MNRAS, 454, 4235
- Dell’Agli et al. (2016) Dell’Agli, F., Di Criscienzo, M., Boyer, M. L., et al. 2016, MNRAS, 460, 4230
- Dell’Agli et al. (2018) Dell’Agli, F., García-Hernández, D. A., Ventura, P., et al. 2018, MNRAS, 475, 2282
- Dell’Agli et al. (2019) Dell’Agli, F., Di Criscienzo, M., García-Hernández, D. A., et al. 2019, MNRAS, 482, 4733
- Di Criscienzo et al. (2013) Di Criscienzo, M., Dell’Agli, F., Ventura, P., et al. 2013, MNRAS, 433, 313
- Di Criscienzo et al. (2016) Di Criscienzo, M., Ventura, P., García-Hernández, D. A., et al. 2016, MNRAS, 462, 395
- Ferrarotti & Gail (2006) Ferrarotti, A. S., & Gail, H.-P. 2006, A&A, 447, 553
- Garcia-Berro & Iben (1994) Garcia-Berro, E., & Iben, I. 1994, ApJ, 434, 306
- Grevesse & Sauval (1998) Grevesse, N., & Sauval, A. J 1998, SSrv, 8 5, 161
- Herwig (2000) Herwig, F. 2000, A&A, 360, 952
- Herwig (2005) Herwig, F. 2005, ARA&A, 43, 435
- Iben (1974) Iben, I. Jr. 1974, ARA&A, 12, 215
- Iglesias & Rogers (1996) Iglesias, C. A., & Rogers, F. J. 1996, ApJ, 464, 943
- Johansson et al. (2012) Johansson, J., Thomas, D., Maraston, C., 2012, MNRAS, 421, 1908
- Karakas (2010) Karakas, A. I. 2010, MNRAS, 403, 1413
- Karakas (2014) Karakas, A. I. 2014a, MNRAS, 445, 347
- Karakas & Lattanzio (2014) Karakas, A. I., & Lattanzio J. C. 2014b, PASA, 31, e030
- Karakas & Lugaro (2016) Karakas, A. I., & Lugaro, M. 2016, ApJ, 825, 26
- Karakas et al. (2018) Karakas, A. I., Lugaro, M., Carlos, M., et al. 2018, MNRAS, 477, 421
- Kubryk et al. (2015) Kubryk, M., Prantzos, N., Athanassoula, E., 2015, A&A, 580, A126
- Lagarde et al. (2012) Lagarde, N., Decressin, T., Charbonnel, C., et al. 2012, A&A, 543, A108
- Lattanzio (1986) Lattanzio, J. C. 1986, ApJ, 311, 708
- Lewis et al. (2013) Lewis, K. M., Lugaro, M., Gibson, B. K., et al. 2013, ApJ, 768, L19
- Lugaro et al. (2014) Lugaro, M., Tagliente, G., Karakas, A. I., et al. 2014, ApJ, 780, 95
- Lugaro et al. (2018) Lugaro, M., Karakas, A. I., Pető, M., et al. 2018, Geochim. Cosmochim. Acta., 221, 6
- Marigo & Aringer (2009) Marigo, P., & Aringer, B., 2009, A&A, 508, 1538
- Matteucci (2012) Matteucci, F., 2012, Chemical Evolution of Galaxies (Berlin Heidelberg: Springer-Verlag)
- Mattsson et al. (2008) Mattsson, L., Wahlin, R., Höfner, S., Eriksson, K. 2008, A&A, 484, L5
- Minchev et al. (2013) Minchev, I., Chiappini, C., Martig, M., 2013, A&A, 558, A9
- Nanni et al. (2013) Nanni, A., Bressan, A., Marigo, P., et al. 2013, MNRAS, 434, 2390
- Nanni et al. (2014) Nanni, A., Bressan, A., Marigo, P., et al. 2014, MNRAS, 438, 2328
- Nanni et al. (2016) Nanni, A., Marigo, P., Groenewegen, M. A. T., et al. 2016, MNRAS, 462, 1215
- Nanni et al. (2018) Nanni, A., Marigo, P., Girardi, L., et al. 2018, MNRAS, 473, 5492
- Nanni et al. (2019) Nanni, A., Groenewegen, M. A. T., Aringer, B., et al. 2019, MNRAS, 487, 502
- Nanni et al. (2020) Nanni, A., Marigo, P., Groenewegen, M. A. T., et al. 2020, IAU General Assembly, 405
- Paczyński (1970) Paczyński, B. 1970, Acta Astron., 20, 287
- Pignatari et al. (2016) Pignatari, M., et al. 2016, ApJS, 225, 24
- Pinsonneault (1997) Pinsonneault, M. 1997, ARA&A, 35, 557
- Renzini & Voli (1981) Renzini, A., Voli, M. 1981, A&A, 500, 221
- Romano et al. (2001) Romano, D., Matteucci, F., Ventura, P., et al. 2001, A&A, 374, 646
- Romano et al. (2010) Romano, D., Karakas, A. I., Tosi, M., et al. 2010, A&A, 522, A32
- Romano et al. (2017) Romano, D., Matteucci, F., Zhang, Z.-Y., et al. 2017, MNRAS, 470, 401
- Romano et al. (2019) Romano, D., Matteucci, F., Zhang, Z.-Y., et al. 2019, MNRAS, 490, 2838
- Sackmann & Boothroyd (1991) Sackmann, I.-J., & Boothroyd, A. I. 1991, ApJ, 366, 529
- Sackmann & Boothroyd (1992) Sackmann, I.-J., & Boothroyd, A. I., 1992, ApJL, 392, L71
- Schneider et al. (2014) Schneider, R., Valiante, R., Ventura, P., et al. 2014, MNRAS, 442, 1440
- Schultheis et al. (2019) Schultheis, M., Rich, R. M., Origlia, L., et al. 2019, A&A, 627, A152
- Schwarzschild & Härm (1965) Schwarzschild, M., & Härm, R. 1965, ApJ, 142, 855
- Siess (2007) Siess, L. 2007, A&A, 476, 893
- Spitoni et al. (2015) Spitoni, E., Romano, D., Matteucci, F., et al. 2015, ApJ, 802, 129
- Srinivasan et al. (2009) Srinivasan, S., Meixner, M., Leitherer, C., et al. 2009, AJ, 137, 4810
- Srinivasan et al. (2016) Srinivasan, S., Boyer, M. L., Kemper, F., et al. 2016, MNRAS, 457, 2814
- Straniero et al. (1997) Straniero, O., Chieffi, A., Limongi, M., et al. 1997, ApJ, 478, 332
- Thorsbro et al. (2020) Thorsbro, B., Ryde, N., Rich, R. M., et al. 2020, arXiv e-prints, arXiv:2003.11085
- Valiante et al. (2009) Valiante, R., Schneider, R., Bianchi, S., et al. 2009, MNRAS, 397, 1661
- van Loon et al. (2005) van Loon, J., Cioni, M.-R., Zijlstra, A., Loup, C. 2005, A&A, 438, 273
- Vassiliadis & Wood (1993) Vassiliadis, E., Wood, P. R. 1993, ApJ, 413, 641
- Ventura et al. (1998) Ventura, P., Zeppieri, A., Mazzitelli, I., D’Antona, F., 1998, A&A, 334, 953
- Ventura et al. (2000) Ventura, P., D’Antona, F., Mazzitelli, I. 2000, A&A, 363, 605
- Ventura et al. (2001) Ventura, P., D’Antona, F., Mazzitelli, I., et al. 2001, ApJ, 550, L65
- Ventura & D’Antona (2005a) Ventura, P., & D’Antona, F. 2005a, A&A, 431, 279
- Ventura & D’Antona (2005b) Ventura, P., & D’Antona, F. 2005b, A&A, 439, 1075
- Ventura (2010) Ventura, P. 2010, Light Elements in the Universe, 147
- Ventura et al. (2012) Ventura, P., Di Criscienzo, M., Schneider, R., et al. 2012, MNRAS, 420, 1442
- Ventura et al. (2013) Ventura, P., Di Criscienzo, M., Carini, R., D’Antona, F., 2013, MNRAS, 431, 3642
- Ventura et al. (2014a) Ventura, P., Di Criscienzo, M., D’Antona, F., Vesperini, E., Tailo, M., Dell’Agli, F, D’Ercole, A., 2014a, MNRAS, 437, 3274
- Ventura et al. (2014b) Ventura, P., Dell’Agli, F., Schneider, R., et al. 2014b, MNRAS, 439, 977
- Ventura et al. (2014c) Ventura, P., Dell’Agli, F., Di Criscienzo, M., et al. 2014c, MNRAS, 439, 977
- Ventura et al. (2015) Ventura, P., Karakas, A. I., Dell’Agli, F., et al. 2015, MNRAS, 450, 3181
- Ventura et al. (2016) Ventura, P., Karakas, A. I., Dell’Agli, F., et al. 2016, MNRAS, 457, 1456
- Ventura et al. (2018) Ventura, P., Karakas, A., Dell’Agli, F., García-Hernández, D. A.,Guzman-Ramirez, L. 2018, MNRAS, 475, 2282
- Vitense (1953) Vitense, E. 1953, ZAp, 32, 135
- Wachter et al. (2002) Wachter, A., Schröder, K. P., Winters, J. M., Arndt, T. U., Sedlmayr, E., 2002, A&A, 384, 452
- Wachter et al. (2008) Wachter, A., Winters, J. M., Schröder, K. P., Sedlmayr, E., 2008, A&A, 486, 497
- Wegg et al. (2019) Wegg, C., Rojas-Arriagada, A., Schultheis, M., et al. 2019, A&A, 632, A121
- Weiss & Ferguson (2009) Weiss, A., & Ferguson, J. W. 2009, A&A, 508, 1343
- Zhang et al. (2018) Zhang, Z.-Y., Romano, D., Ivison, R. J., et al. 2018, Nature, 558, 260
- Zheng (1997) Zheng, W., Davidsen, A. F., Tytler, D., Kriss, G. A. 1997, preprint
- Zhukovska et al. (2008) Zhukovska, S., Gail, H.-P., Trieloff, M. 2008, A&A, 479, 453
- Zinner (2014) Zinner, E. 2014, Meteorites and Cosmochemical Processes, 181