Scenarios for a post-COVID-19 world airline network
Abstract
The airline industry was severely hit by the COVID-19 crisis with an average demand decrease of about (IATA, April 2020) which triggered already several bankruptcies of airline companies all over the world. While the robustness of the world airline network (WAN) was mostly studied as an homogeneous network, we introduce a new tool for analyzing the impact of a company failure: the ‘airline company network’ where two airlines are connected if they share at least one route segment. Using this tool, we observe that the failure of companies well connected with others has the largest impact on the connectivity of the WAN. We then explore how the global demand reduction affects airlines differently, and provide an analysis of different scenarios if its stays low and does not come back to its pre-crisis level. Using traffic data from the Official Aviation Guide (OAG) and simple assumptions about customer’s airline choice strategies, we find that the local effective demand can be much lower than the average one, especially for companies that are not monopolistic and share their segments with larger companies. Even if the average demand comes back to of the total capacity, we find that between and of the companies could experience a reduction of more than of their traffic, depending on the type of competitive advantage that drives customer’s airline choice. These results highlight how the complex competitive structure of the WAN weakens its robustness when facing such a large crisis.
I Introduction
We see only the beginning of the socio-economic impact of the coronavirus pandemic (COVID-19) that spread over the whole world in the first semester of 2020. All sectors, agriculture, manufacturing industry, and of course the tertiary sector will be strongly affected by this crisis nicola2020socio , and our way of life could deeply change. In particular, the airline industry was severely hit with many governments that enforced both domestic and international travel restrictions at various degrees. Some countries restricted the flights from severely affected areas while others even cancelled almost all flights. These travel restrictions did delay or interrupt the further transmission of the COVID-19 chinazzi2020effect , but also caused great damage to the world airline network (WAN) suzumura2020impact , the most important travel network in today’s world and one of the key infrastructures of today’s global economy.
More precisely, the COVID-19 outbreak caused a decline from segments in the period 1-7 January 2020 to in the period 19-25 April 2020 (representing a decrease of ), thus impacting a large number of companies. In order to visualize this variation, we average over a 7-day time window the capacity (given by the number of seats for all flights) for each company and plot the result on Fig. 1. In particular, we show the capacity for the three biggest airline companies in China (Air China, China Southern Airlines and China Eastern Airlines) and how their capacity dropped around the beginning of February.
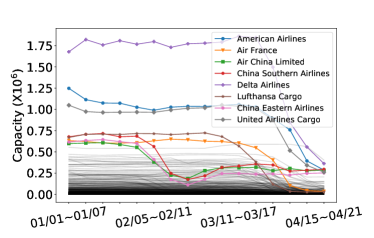
Many other airline companies also faced the decrease of capacity later with the epidemic spreading over the whole world, including Lufthansa Cargo at the end of February and Delta Airlines, American Airlines, United Airlines Cargo and Air France during the middle of March.
This is not the first time that the WAN suffered large-scale disruptions. For example the eruption of the volcano Eyjafjallajokull in 2010 not only threatened the safety of local residents, but also seriously affected the air traffic in Europe, by causing the cancellation of flights, disrupting the travel plans of million passengers and costing the airline industry in excess of billion in lost revenue budd2011fiasco ; brooker2010fear . There are, however, differences with these rare events, which brought massive losses for the air industry, and the current crisis. First, it remains unclear how long this pandemic will last. Since effect of high temperature and high humidity on COVID-19 seems to be limited wang2020high , most experts do not expect that the epidemic will naturally come to an end in the summer 2020. As a consequence, governments may have to maintain the travel restrictions, which is definitely a strike to the whole air industry. Second, it remains unclear how the demand will resume back to normal, if it does so. An analysis of the Boston Consulting Group BCG proposed various scenarios for the evolution of the air travel demand, the most probable one being a gradual recovery stretching into 2021 (‘prolonged U-shape’). This is motivated by the fact that international travel is discouraged and that borders will slowly reopen leading to a slow return of the consumer confidence. The economic recession and the failure of travel distributors will enhance this drop of air travel demand. This situation could thus last a while, and has already provoked the bankruptcies of more than 20 airlines so far allplane ; BI such as Air Italy (Italy), Flybe (UK) which was the largest independent regional airline in Europe, Trans States Airlines (US), Compass Airlines (US), Virgin Australia (Australia), Avianca (Colombia), etc. Other major airlines called for multibillion bailout in order to survive Guardian .
There are of course different reasons why an airline goes bankrupt SF , but it ultimately boils down to the lack of cash to cover the airline’s liabilities. An important ingredient is then the structure of the WAN and in particular how the different airlines, which compose it, are superimposed and interact with each other. Another crucial ingredient is how customers will choose an airline rather than another one, and it is in these extreme cases that a competitive advantage will prove to be fundamental. In this work, we will address two aspects. First, we will analyze the robustness of the WAN against the bankruptcy of different airlines, and which failures are the most dangerous for its connectivity. In this part we will also study how the traffic can reorganize itself. In a second part, we will consider how the global traffic demand reduction will affect different airlines, and for this we will test various strategies of how customers choose their airline company. For these studies, we will use real traffic data from the Official Aviation Guide (OAG) for the WAN (see Material and Methods).
II The effect of bankruptcies on the world airline network
II.1 Robustness and the ‘airline company network’
Usually, the WAN is defined as the network composed of nodes that are airports and links that represent direct flights between two airports barrat2004architecture ; guimera2005worldwide ; zanin2013modelling . An obvious fact but often ignored in many studies about the WAN is that it results in fact from the superimposition of routes belonging to different airlines, leading to the well-known emergent hub-and-spoke structure bryan1999hub . Each airline optimizes its own profit and the WAN can thus be seen as the emerging network resulting from the choices of all these operators. Despite this important aspect, the structure and the robustness of the WAN have mostly been studied from a topological point of view, with a focus on the effect on the giant connected component of node or link removal dall2006vulnerability ; lordan2014robustness ; verma2014revealing . However, as noted above, describing the WAN as a simple topological network might be oversimplified, and in order to reach realistic conclusions, it seems necessary to take into account other aspects of this network (for a review and research agenda about the robustness of this network, see lordan2014study ). In particular, some works studied this important airline aspect, and considered the WAN as a multilayer network where each layer is a different airline company zanin2013modelling ; boccaletti2014structure ; kivela2014multilayer ; cardillo2013modeling . We note that in cardillo2013modeling the authors considered an interesting study of re-scheduling of passengers after the failure of a given segment.
Here, we will analyze the robustness of the WAN when facing airline bankruptcies. This is different from the usual robustness study where nodes/links are removed. Instead, the removal of an airline implies the removal of possibly many segments, and/or the decrease of capacity if the segment is shared with another company, or the complete removal of the link if the airline was the only one operating on it. We first construct the WAN based on the data provided by the OAG for the period 1st January - 25th April 2019 (see Material and Methods for details). In order to analyze the robustness of this multilayer network from this point of view, we then construct what we call here the ‘airline company network’ (ACN) where nodes represent airline companies (the number of nodes is here ), and two nodes in this network are connected if the corresponding companies share at least a segment. Obviously, two airline companies can share more than one segment and it is natural to define the weight of a link in the ACN as the segment overlap given by
| (1) |
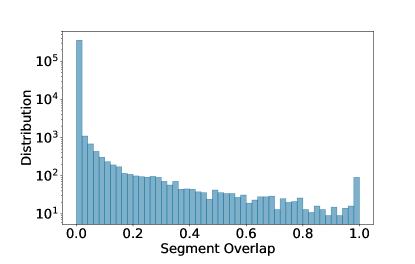
where is the set of segments operated by company , is the capacity of company on segment (averaged over days) and is the total capacity of company . This segment overlap captures the similarity between two airline companies and its distribution is shown in Fig. S1 in the appendix. We observe a wide range of this overlap and while most of the companies do not share segments with each other, nearly 100 pairs of companies display an overlap equal to 1, indicating that either one is included in the other, or that they are proposing exactly the same set of segments and are thus in direct competition.
The study of this weighted ACN allows us to have a better view of how the different airlines interact with each other. In particular, it will help us to understand how robust the WAN is when airlines are failing. In general, when studying the robustness of the WAN, different link or node removal strategies are adopted dall2006vulnerability ; lordan2014robustness . Removing a link implies that all companies operating on this segment stopped simultaneously, which is unlikely to occur in general, except in cases of airport closures which happened for example during the eruption of the volcano Eyjafjallajokull. Here, we will consider the specific situation where many airlines can fail. The bankruptcy of an airline does not imply, however, that one or more segments in the WAN will disappear, but just that its capacity will be reduced.
Based on the segment overlap, it is natural to define the average segment overlap of a company with its ‘neighbours’ as
| (2) |
where is the set of companies sharing at least one segment with company and represents the number of corresponding companies. A large average segment overlap indicates that the corresponding airline company shares many segments with others and is thus in direct competition with them. In contrast, a small overlap indicates a company that operates alone on some segments and does not suffer any competition there. It is then tempting to think that the average segment overlap can serve as an indicator for identifying ‘critical’ companies, whose bankruptcy will induce the isolation of certain airports and cities and cause a great damage to the connectivity of the WAN.
Classically, when ignoring the structure in terms of airline companies, the most effective strategy to destroy the connectivity of the WAN is to remove the most central nodes (i.e. nodes with highest betweenness centrality, see dall2006vulnerability ; lordan2014robustness ) or the links with the lowest traffic verma2014revealing . As already mentioned above, these results do not provide much information about the impact of airline bankruptcies and the partial reduction in traffic capacity for certain segments. In order to test this influence, we first consider the robustness of the WAN for four different removal strategies: (i) random removal of airline companies; (ii) removal of airline companies with the largest passenger capacity ; (iii) removal of airline companies with the largest betweenness centrality computed in the weighted ACN; (iv) removal of airline companies with the largest average segment overlap . We note that for strategy (iii), the calculation of the betweenness centrality in the weighted ACN relies on the shortest path between two nodes such that the sum of weights (here the segment overlap ) is maximal among all connective paths. As most robustness analysis do, we choose the size of the giant component (i.e. the connected subgraph with the largest number of nodes), as the measure of the connectivity of the WAN.
We show in Fig. 2 the size of the giant component of the WAN as a function of the fraction of the cumulative passenger capacity of removed companies (which implies that the intervals along the x-axis between dots are not uniform due to the diversity of the companies’ capacities).
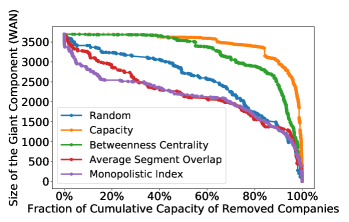
For the strategy (ii), where we remove companies according to their passenger capacity (from the largest to the smallest), the variation over the x-axis is large but the impact on the WAN is small. Sorting and removing companies according to their betweenness centrality in the ACN is also not very effective. Compared to these cases, removing airline companies in a random order has actually a larger impact on the WAN structure. However, we observe that the last strategy (iv) is very effective: removing companies according to their integration with other companies seems to have the largest impact on the WAN’s connectivity, suggesting that crucial paths in the WAN are shared by the same set of companies. More generally, this is a sign that in order to understand the robustness of the WAN and the impact of the failure of an airline company, we need to take into account its interaction with the other companies.
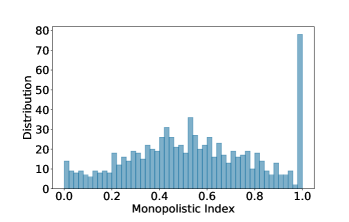
This discussion shows that not all airlines are equivalent and that their bankruptcy can display a large variety of consequences. In particular, the location of the airline in the ACN, or in other words, how it is coupled to other companies, seems to be a crucial ingredient for understanding the impact of its bankruptcy. This leads us to quantify how much a company has the monopoly over its different segments and we define the monopolistic index as
| (3) |
where is the total number of segments serviced by company . This index is equal or close to 1 if most the segments of company are dominated by . The distribution of shown in Fig. 3 indicates that there is a large variety of companies with various degree of monopoly, demonstrating the large diversity of the airlines companies. The peak at indicates that there are about 80 companies which are totally monopolistic: all their segments are not shared with another company.
The importance of this feature can be checked with our robustness test: we remove companies according to their monopolistic index and obtain the result shown in Fig. 2. The rapid decrease of the WAN connectivity with this strategy confirms our conclusion about the importance of airlines interactions for understanding the structure of the WAN and its robustness.
II.2 Rerouting after bankruptcy
An important process not considered in the robustness analysis above is the direct consequence on passengers of an airline company bankruptcy. These passengers have to be rerouted and need to choose flights of other companies (when it is possible), putting extra stress on some flights. In some cases even, the bankruptcy of companies can isolate some cities leaving no other choices for the passengers to find another transportation mode. In this section, we will simulate this process for various level of demand decrease, starting from the real data, in order to understand the possible post-COVID-19 scenarios for the WAN.
We denote by the average demand/load ratio for all flights. We consider here the uniform case (see the next section for other assumptions), where the actual number of passengers for airline company on segment is then , where the capacity is . If the company fails, its passengers have to be rerouted for each of its segment . We assume here that passengers always choose the shortest path with less transfers as possible. If for the segment , there are other direct flights provided by other companies, some lucky passengers can take them (which will be possible with ). Once the flights of current shortest path are fully occupied, the rest of the passengers will be rerouted over the second shortest path, and so on. If all the rerouted passengers can reach their final destinations, we compute the average number of additional transfers and the average additional distance as the ‘cost’ of the airline’s bankruptcy. For example, if a passenger wanted to fly from city to at first, now he/she has to transfer in city . In this case, his/her number of additional transfers is 1 and the additional distance is , where is the distance between city and . In the less favorable case where some passengers cannot reach their destination which can happen if all flights are fully booked, the WAN fails and we compute the number of these stranded passengers.
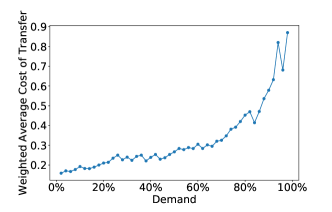
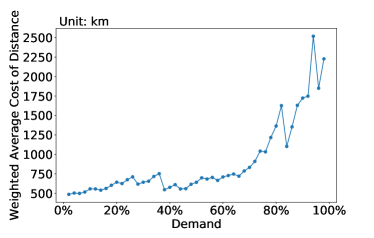
We test the bankruptcy of each airline company in the database, and use the rerouting process as described above. We show in Fig. S2 the weighted average cost of additional transfers with weight equal to the capacity of companies not inducing stranded passengers (see Fig. S2(a) for the additional distance). For a low global demand, passengers can always be rerouted without too many problems, but with increasing , passengers need to make always more transfers and at the cost of a larger distance.
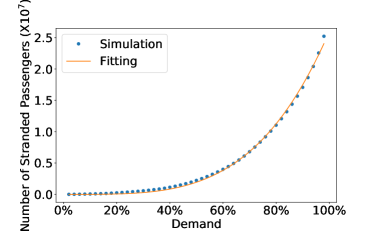
We also consider the total number of passengers stranded due to the bankruptcies of airlines if they cannot be successfully rerouted (Fig. S2(b)). As an indication, we fit the result with a power law function and obtain the large exponent value of , indicating a rapid increase with of the number of stranded passengers: when is of the order of , there is a significative number of stranded passengers of about 2.5 millions.
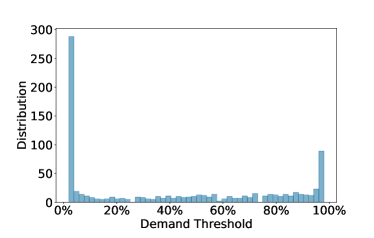
The existence of stranded passengers depends on a critical point of demand for each airline company (denoted by for company ) above which its passengers cannot transfer successfully after its bankruptcy, or in other words: bankruptcy of company leads to stranded passengers only for . The distribution of this demand threshold is shown in Fig. S2(c). We observe a roughly uniform distribution for all values of and a peak at which corresponds to the case of cities served by a single company. When these companies go bankrupt, passengers have no other means to reach their destination (this is the case for approximately 300 companies). We also observe a peak around signaling the existence of very robust situation for which their bankruptcy almost never lead to stranded passengers.
III The effect of a lower demand and customer’s airline choice strategies
When the global demand decreases, we have assumed so far that all segments and all companies are affected in the same, uniform manner. This is, however, not true in general, and we have to test various customer’s strategies for choosing a company. A reduction in the global demand can thus have different local consequences and lead to very low passenger traffic demand for some companies. These are obviously the companies that will be the most at risk and it is the focus of this part to identify them.
We first focus on one segment shared by multiple companies. Before the crisis, each company has its capacity on this segment and the total number of seats is . We assume that the global demand is still described by for all segments (for further studies, we could assume some geographical dependence), the actual number of passengers on this segment is . The question is then how we remove the passengers on this segment , or equivalently, how the remaining passengers choose their airlines. There are many factors influencing the decision for choosing a specific airlines, including the frequency, reliability, price, etc. (see for example the study dolnicar2011key ). We decided here to focus on two main aspects: the capacity of an airline and its rank. A large capacity usually goes together with a large frequency and reliability, and for the rank we use the rank list of world’s top 100 Airlines 2019 provided by Skytrax skytrax .
We thus consider the following 6 strategies so that all passengers find their seats on the flights among these companies: (i) The first ‘Uniform’ Strategy (UN) used as a reference: Each company receives a number of passengers proportional to its capacity. This random case ignores all competitive avantage but provides a benchmark for assessing the effect of other strategies. (ii) The ‘Biggest First’ Strategy (BF): Passengers are assumed to always give preference to the company with the largest capacity (and then to the second largest one, etc.); (iii) ‘One-Uniform’ Strategy (1UN): Passengers are assumed to choose first the company with the highest rank (provided by skytrax ). If no companies on the rank list operate on this segment, a random company will be chosen first. After flights of the first-choice company are fully occupied, the other companies receive a number of passengers proportional to their capacities; (iv) ‘One-Biggest First’ (1BF): Passengers are assumed to choose the company with the highest rank first. If no companies on the rank list are available for this segment, a random company will be chosen. After flights of the first-choice company are full, passengers give then their preference to the company with the largest capacity; (v) ‘Rank-Uniform’ (RUN): Passengers are assumed to choose companies according to the rank list. If flights of companies on the list are occupied, the other companies receive a number of passengers proportional to their capacities; (vi) ‘Rank-Biggest First’ (RBF): Passengers are assumed to choose companies according to the rank list. If flights of companies on the list are full, passengers give then their preference to the company with the largest capacity.
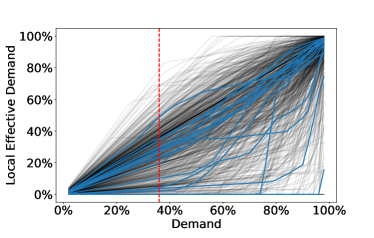
Considering all the segments for each company , for a given strategy and for a given value of , we denote the actual number of passengers for company by . The local effective demand for company (and for strategy ) is then given by
| (4) |
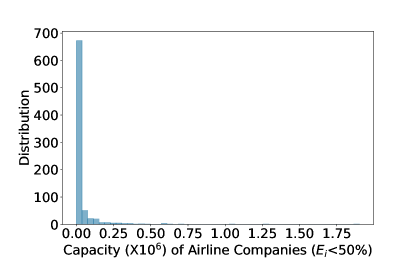
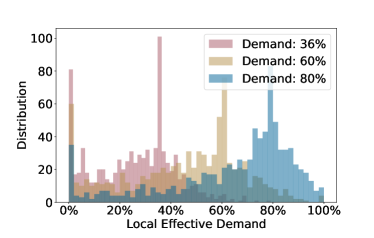
Companies with a large value of the local effective demand will have enough passengers to function normally, while those with a low local effective demand can be considered at risk of bankruptcy. For the strategy of ‘Biggest First’, we show the change of local effective demand for all companies (Fig. 5(a)), and its distribution when is equal to (the estimated value of demand in April 2020 according to IATA IATA ), and in Fig. 5(b). Even if most companies have a local effective demand around , there are about companies without any passengers. For the 23 companies that went bankrupt so far, their local effective demand was in the range , consistently with the idea that a company with demand less than is in financial danger.
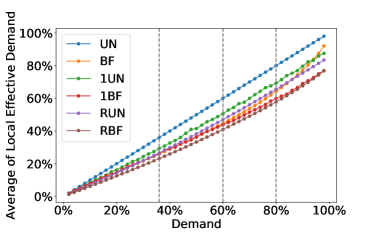
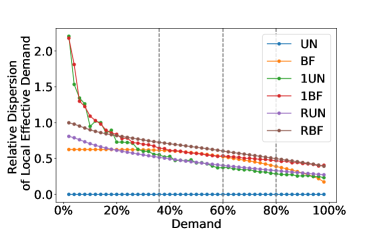
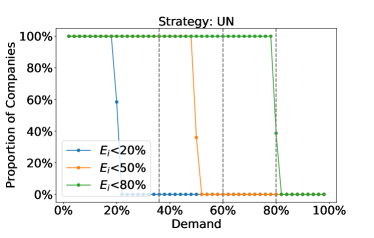
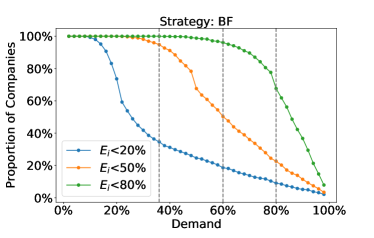
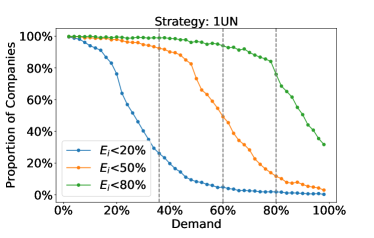
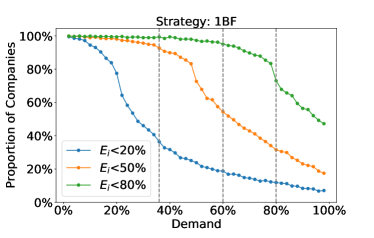
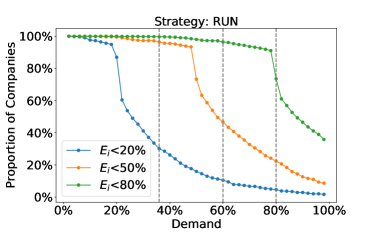
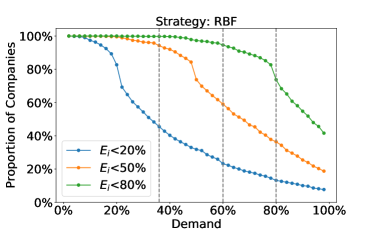
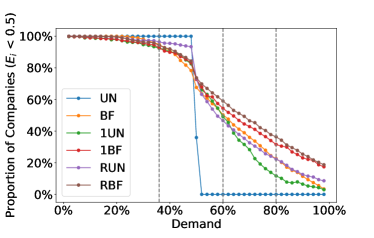
In order to compare quantitatively these different strategies, we show the local effective demand averaged over all companies and its relative dispersion (equal to the ratio of dispersion to average) in Fig. 6(a,b). For the uniform case, where airlines are chosen completely at random, the local effective demand of each company is, as expected, identically equal to (). All other strategies produce important variations: from Fig. 6(a) we can roughly estimate that for a demand of , certain companies can experience a local reduction of demand as low as about or even less if we take into account the dispersion which cannot be neglected (the relative dispersion is always of order 1 - see Fig. 6(b)). Even for a global demand of , all these strategies (except for the purely random case) predict that most companies will experience a decrease of or more of their traffic. In order to highlight this local heterogeneity effect, we plot in Fig. 7 the proportion of companies with local effective demand less than (We choose here as this seems an already drastic reduction of the demand that can be barely sustainable for most companies. Results for other values of the local reduction give similar results, see Fig. S4). Except for the uniform strategy, Fig. 7 shows that for the current state of air travel demand , more than of companies will see an actual number of passengers less than half of their capacity in the pre-crisis state. Even if the global demand is back to , then between and of the companies will have an actual number of passengers less than half of their capacity in the pre-crisis state. In the unlikely event that it will go back in a near future to , we still see from to of companies with half of their regular traffic.
IV Discussion
The results in this paper are twofold. First, the impact on the WAN connectivity of an airline company failure depends on its coupling with other companies. If the company shares many segments with others, its failure will more strongly affect the WAN structure. This shows that the impact of a bankrupted airline cannot be discussed independently from the other companies, and that it is necessary to take into account the whole structure of the coupling between companies - which is encoded in the ACN introduced here. Next, we showed that the global demand reduction can hide large heterogeneities in its impact at the airline level. More precisely, we have found that, depending on the customer choice strategy, the local reduction of demand can be extremely different from its average value, in particular in the presence of a competitive advantage. This shows that more companies than we can expect from a simple demand reduction argument could be strongly affected by this crisis. In the reasonable scenario where the global demand is back to of its total capacity, our analysis suggests that roughly half of the companies will see their traffic divided by two. These results need naturally to be enriched by many other details about companies, but we believe that they pave the way for constructing a robust tool allowing us to understand and predict the future of the WAN.
V Material and methods
V.1 Data availability
The data that support the findings of this study were purchased at OAG https://www.oag.com/.
V.2 Data
The Official Aviation Guide (OAG), one of the largest global travel data providers, provides the detailed information of every scheduled flight including the operating airline company, origin/destination airport, aircraft type, number of seats, departure date, etc.
We focus on the nonstop flights during the period from 1st January to 25th April 2020 for understanding the variation of global air traffic caused by COVID-19 and the corresponding period 1st January – 26th April 2019 for constructing the world airline network (WAN) in ‘normal state’. In the WAN, nodes represent cities and links denote existence of direct flights. Considering all the flights during 1st January to 26th April 2019, there are cities serving as origins/destinations and different segments connecting these cities. As the comparison, there are cities and segments during the period 1st January to 25th April 2020. We define the weight of link as the everyday capacity (number of seats) of flights between cities, i.e.,
| (5) |
where is the total capacity of flights from city to city on day , and is the length of time range.
References
- (1) Maria Nicola, Zaid Alsafi, Catrin Sohrabi, Ahmed Kerwan, Ahmed Al-Jabir, Christos Iosifidis, Maliha Agha, and Riaz Agha. The socio-economic implications of the coronavirus pandemic (covid-19): A review. International Journal of Surgery (London, England), 78:185, 2020.
- (2) Matteo Chinazzi, Jessica T Davis, Marco Ajelli, Corrado Gioannini, Maria Litvinova, Stefano Merler, Ana Pastore y Piontti, Kunpeng Mu, Luca Rossi, Kaiyuan Sun, et al. The effect of travel restrictions on the spread of the 2019 novel coronavirus (covid-19) outbreak. Science, 368(6489):395–400, 2020.
- (3) Toyotaro Suzumura, Hiroki Kanezashi, Mishal Dholakia, Euma Ishii, Sergio Alvarez Napagao, Raquel Pérez-Arnal, and Dario Garcia-Gasulla. The impact of covid-19 on flight networks. arXiv preprint arXiv:2006.02950, 2020.
- (4) Lucy Budd, Steven Griggs, David Howarth, and Stephen Ison. A fiasco of volcanic proportions? eyjafjallajökull and the closure of european airspace. Mobilities, 6(1):31–40, 2011.
- (5) Peter Brooker. Fear in a handful of dust: aviation and the icelandic volcano. Significance, 7(3):112–115, 2010.
- (6) Jingyuan Wang, Ke Tang, Kai Feng, and Weifeng Lv. High temperature and high humidity reduce the transmission of covid-19. Available at SSRN 3551767, 2020.
- (7) Boston Consulting Group. The post-covid-19 flight plan for airlines (accessed 2020-06-29). https://www.bcg.com/fr-fr/publications/2020/post-covid-airline-industry-strategy.aspx.
- (8) Miquel Ros. The 2020 airline bankruptcy list is open (accessed 2020-06-29). https://allplane.tv/blog/2020/1/17/airlines-that-stopped-flying-in-2020.
- (9) David Slotnik. Some of the world’s airlines could go bankrupt because of the covid-19 crisis, according to an aviation consultancy (accessed 2020-05-12). https://www.businessinsider.fr/us/coronavirus-airlines-that-failed-bankrupt-covid19-pandemic-2020-3, 2020.
- (10) Rupert Jones. Uk airlines call for multibillion bailout to survive covid-19 crisis (accessed 2020-03-15). https://www.theguardian.com/world/2020/mar/15/uk-airlines-call-for-multibillion-bailout-to-survive-covid-19-crisis, 2020.
- (11) Karol Ciesluk. What causes an airline to go bankrupt? (accessed 2020-04-26). https://simpleflying.com/airline-bankruptcy/, 2020.
- (12) Alain Barrat, Marc Barthelemy, Romualdo Pastor-Satorras, and Alessandro Vespignani. The architecture of complex weighted networks. Proceedings of the national academy of sciences, 101(11):3747–3752, 2004.
- (13) Roger Guimera, Stefano Mossa, Adrian Turtschi, and LA Nunes Amaral. The worldwide air transportation network: Anomalous centrality, community structure, and cities’ global roles. Proceedings of the National Academy of Sciences, 102(22):7794–7799, 2005.
- (14) Massimiliano Zanin and Fabrizio Lillo. Modelling the air transport with complex networks: A short review. The European Physical Journal Special Topics, 215(1):5–21, 2013.
- (15) Deborah L Bryan and Morton E O’kelly. Hub-and-spoke networks in air transportation: an analytical review. Journal of regional science, 39(2):275–295, 1999.
- (16) Luca Dall’Asta, Alain Barrat, Marc Barthelemy, and Alessandro Vespignani. Vulnerability of weighted networks. Journal of Statistical Mechanics: Theory and Experiment, 2006(04):P04006, 2006.
- (17) Oriol Lordan, Jose M Sallan, Pep Simo, and David Gonzalez-Prieto. Robustness of the air transport network. Transportation Research Part E: Logistics and Transportation Review, 68:155–163, 2014.
- (18) Trivik Verma, Nuno AM Araújo, and Hans J Herrmann. Revealing the structure of the world airline network. Scientific reports, 4(1):1–6, 2014.
- (19) Oriol Lordan, Jose M Sallan, and Pep Simo. Study of the topology and robustness of airline route networks from the complex network approach: a survey and research agenda. Journal of Transport Geography, 37:112–120, 2014.
- (20) Stefano Boccaletti, Ginestra Bianconi, Regino Criado, Charo I Del Genio, Jesús Gómez-Gardenes, Miguel Romance, Irene Sendina-Nadal, Zhen Wang, and Massimiliano Zanin. The structure and dynamics of multilayer networks. Physics Reports, 544(1):1–122, 2014.
- (21) Mikko Kivelä, Alex Arenas, Marc Barthelemy, James P Gleeson, Yamir Moreno, and Mason A Porter. Multilayer networks. Journal of complex networks, 2(3):203–271, 2014.
- (22) Alessio Cardillo, Massimiliano Zanin, Jesús Gómez-Gardenes, Miguel Romance, Alejandro J García del Amo, and Stefano Boccaletti. Modeling the multi-layer nature of the european air transport network: Resilience and passengers re-scheduling under random failures. The European Physical Journal Special Topics, 215(1):23–33, 2013.
- (23) Sara Dolnicar, Klaus Grabler, Bettina Grün, and Anna Kulnig. Key drivers of airline loyalty. Tourism Management, 32(5):1020–1026, 2011.
- (24) World’s top 100 airlines 2019 (accessed 2020/06/29). http:///www.worldairlineawards.com/worlds-top-100-airlines-2019.
- (25) After april passenger demand trough, first signals of uptick (accessed 2020-06-29). https://www.iata.org/en/pressroom/pr/2020-06-03-01/.
Appendix A Segment overlap distribution
For the airline company network (ACN), we define the segment overlap between companies as
| (S1) |
where is the set of segments operated by company , is the capacity of company on segment (averaged over days) and is the total capacity of company . This quantity captures the similarity of segments operated by two different companies. The segment overlap equal to 1 implies that either the set of segments of one company is included in the set of the other one, or that they operate on exactly the same segments. A value equal to 0 means that the corresponding companies operate over completely different sets of segments.
The distribution of segment overlap is shown in Fig. S1, and displays a wide range of values distributed in . We also observe that while the majority of the companies do not share any segments with each other (the highest peak with segment overlap equal to 0), nearly 100 pairs of companies have an overlap equal to 1, meaning that they operate over the same set of segments (or the set of segments of a company is included in the set of the other one), indicating that these companies are in direct competition.
Appendix B Rerouting after bankruptcy
For a given value of the demand , we compute the effect of rerouting the passengers. In particular, we estimate the additional distance experienced by all the rerouted passengers (the difference of distance between new and original routes), and count the number of stranded passengers.
For companies whose bankruptcy does not induce stranded passengers, we observe that passengers have to take always more transfers and have to travel over longer distance with the increase of . Fig. S2(a) shows the additional distance travelers take in order to reach their destination. When , passengers have to travel more than a total of 1000 kilometers when transferring (results averaged over companies not inducing stranded passengers with weight given by the capacity).
For companies whose bankruptcy leads to stranded passengers, the total number of stranded passengers (denoted by ) is shown in Fig. S2(b). When is of order of , there is a significative number of passengers stranded of about 2.5 million. The exponent of the power law function fitting () indicates the rapid growth of the number of stranded passengers with .
In Fig. S2(c), we show the distribution of the critical demand threshold (for each company) above which there is a non zero number of stranded passengers. The two peaks of the demand threshold in Fig. S2(c) correspond to two extremal types of airline companies: Companies with dominate the segments for at least one city and its bankruptcy will cause the isolation of the corresponding cities, while companies with have only a few passengers and their passengers will never experience difficulties to be rerouted after their bankruptcy.
Appendix C Local Effective Demand
The local effective demand is defined as
| (S2) |
where represents the actual number of passengers for company when passengers follow the airline choice strategy . Small values of this quantity allow us to identify companies at risk of bankruptcy.
We first show in Fig. S3, for the strategy of ‘Biggest First’, the distribution of the capacity of the airlines companies with local effective demand less than (computed for the global demand which is the estimated value of real demand in April 2020 by IATA). We see that even if most companies meeting this condition have a small capacity, there are however a few large ones.
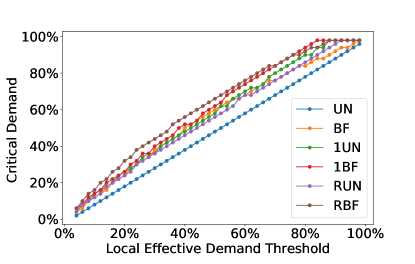
For each strategy, we compare the proportion of companies with local effective demand less than a value equal to different thresholds , or (Fig. S4). We observe a similar behavior for all these different thresholds. In addition, for a given threshold, there is a critical point for , below which the proportion of companies is above . In other words, for less than this critical point, the proportion of companies with local effective demand less than the threshold is larger than , while for larger than the critical point, the proportion of companies with local effective demand less than the threshold is less than . We show the value of the critical point of demand as a function of the demand threshold and for different strategies in Fig. S5. We observe that this critical point is always larger than the threshold, meaning that in general the local effective demand is always smaller than the global one.