Joint galaxy-galaxy lensing and clustering constraints on galaxy formation
Abstract
We compare predictions for galaxy-galaxy lensing profiles and clustering from the Henriques et al. (2015) public version of the Munich semi-analytical model of galaxy formation (SAM) and the IllustrisTNG suite, primarily TNG300, with observations from KiDS+GAMA and SDSS-DR7 using four different selection functions for the lenses (stellar mass, stellar mass and group membership, stellar mass and isolation criteria, stellar mass and colour). We find that this version of the SAM does not agree well with the current data for stellar mass-only lenses with . By decreasing the merger time for satellite galaxies as well as reducing the radio-mode AGN accretion efficiency in the SAM, we obtain better agreement, both for the lensing and the clustering, at the high mass end. We show that the new model is consistent with the signals for central galaxies presented in Velliscig et al. (2017). Turning to the hydrodynamical simulation, TNG300 produces good lensing predictions, both for stellar mass-only ( compared to for the SAM), and locally brightest galaxies samples ( compared to ). With added dust corrections to the colours it matches the SDSS clustering signal well for red low mass galaxies. We find that both the SAMs and TNG300 predict excessive lensing signals for intermediate mass red galaxies with at , which require further theoretical development.
keywords:
gravitational lensing: weak – galaxies: evolution – galaxies: haloes – cosmology: theory – methods: numerical1 Introduction
The next generation of large scale structure surveys, such as Euclid (Laureijs et al., 2011), WFIRST (Spergel et al., 2015) and LSST (Ivezić et al., 2008), will cover a wide range of scales in the cosmic web with unprecedented precision. Weak gravitational lensing, specifically galaxy-galaxy lensing (GGL, see e.g. Bartelmann & Schneider, 2001), and galaxy clustering are two promising diagnostics of structure growth that in combination can be used to constrain the matter fraction , the amplitude of matter density fluctuations , and the galaxy bias , which are all of interest to cosmologists. From the perspective of astrophysicists, these probes offer the opportunity to constrain galaxy evolution processes that determine which classes of galaxies reside in what types of dark matter haloes and the spatial distribution of the halo material.
Modelling the signals on small scales beyond the validity limit of perturbation theory requires empirical or computational approaches. Examples of the former are halo occupation models (HODs) (e.g. Peacock & Smith, 2000; Seljak, 2000; Berlind & Weinberg, 2002; Cooray & Sheth, 2002; Leauthaud et al., 2011; Leauthaud et al., 2012; Zu & Mandelbaum, 2015, 2016), which give the probability distribution of galaxies satisfying some criteria, such as a stellar mass cut, conditioned on a property of the host haloes, like their masses. Advances have made possible construction of HODs using additional secondary properties such as halo concentration (e.g. Hearin et al., 2016) as well as boosting their statistical input by accounting for the incompleteness of stellar mass selected samples (Zu & Mandelbaum, 2015, 2016). This has allowed the construction of fast engines for 2-pt statistics predictions over a wide redshift range (e.g. Behroozi et al., 2019; Nishimichi et al., 2019). However, these approaches have difficulty in including many secondary parameters and lack the connection between these and the governing physical processes.
Semi-analytical models (SAMs) (White & Frenk, 1991; Kauffmann et al., 1999; Springel et al., 2001; Bower et al., 2006; De Lucia & Blaizot, 2007; Guo et al., 2011; Henriques et al., 2013, 2015) and hydrodynamical simulations such as Illustris (Vogelsberger et al., 2014a, b; Genel et al., 2014), EAGLE (Schaye et al., 2015; Crain et al., 2015) and IllustrisTNG (see e.g. Weinberger et al., 2017; Pillepich et al., 2018a; Springel et al., 2018; Naiman et al., 2018; Pillepich et al., 2018b; Marinacci et al., 2018; Nelson et al., 2018, for methods and introductory publications) are examples of methods in which haloes are instead populated with galaxies through modelling of the relevant physical mechanisms. Hydrodynamical simulations such as IllustrisTNG invest effort in consistently modelling and tracking the evolution of gas cells with subgrid recipes for star formation and regulating feedback. Thanks to its large volume, one is able to compute cosmological statistics, such as galaxy clustering, in TNG300 as was done in Springel et al. (2018) out to comparably large radial scales with similar statistics as for the SAMs. This is in contrast to previous studies of clustering (e.g. Artale et al., 2017) restricted to EAGLE and Illustris, which have smaller volumes, and with higher resolution than simulations run in even larger volumes such as the BAHAMAS suite (McCarthy et al., 2017; McCarthy et al., 2018). This large scale analysis is not restricted to the clustering of galaxies; one can also probe the spatial distribution of neutral hydrogen to gain insight into the physics of reionisation (e.g. Villaescusa-Navarro et al., 2018). The small-scale lensing predictions for these types of simulations have previously been partly explored for different datasets (see e.g. Leauthaud et al., 2017; Velliscig et al., 2017; Gouin et al., 2019). The stellar mass functions and colour distributions for the different box sizes of the IllustrisTNG suite have been presented in Pillepich et al. (2018b); Nelson et al. (2018), and halo-occupation distribution prescriptions for the galaxy-halo relation in Bose et al. (2019); Hadzhiyska et al. (2020). This Paper continues to address this issue, e.g. if state-of-the-art SAMs and hydrodynamical simulations yield consistent predictions when compared to the best current observational constraints. We use the TNG suite to probe the impact of baryons, expanding on the work of Lange et al. (2019) who compared Illustris and TNG300, and are thus able to answer how the signal from the SAM galaxies should be altered to account for this.
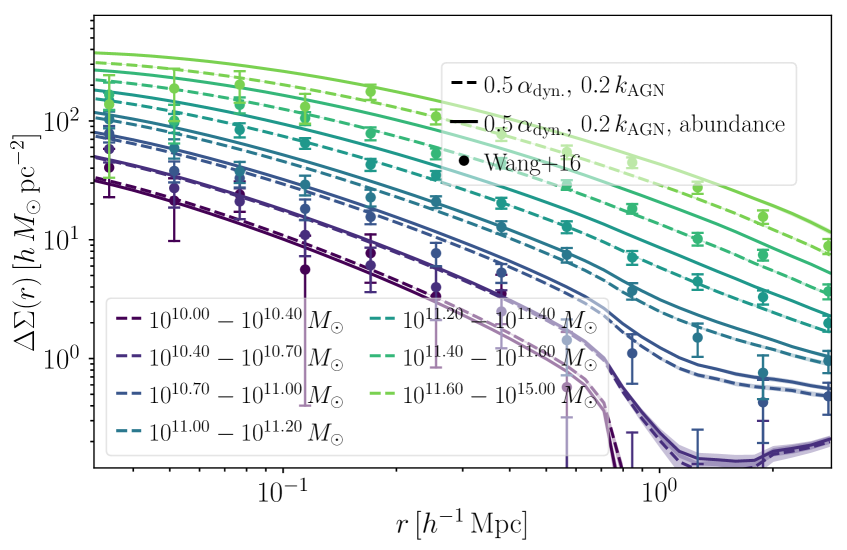
Thanks to the low computational cost of the SAMs, it is possible to explore the parameter space of the underlying physical models using Monte Carlo Markov chains (MCMC) (Henriques et al., 2009; Henriques et al., 2013, 2015), with observational constraints such as the stellar mass function (SMF) and the red fraction of galaxies () (1-pt functions). The parameters of a hydrodynamical simulation are usually calibrated in small test boxes and are then fixed at runtime, which does not allow for the same flexibility. In van Daalen et al. (2016) it was shown that the introduction of galaxy clustering constraints (2-pt functions) in the SAM MCMC sampling provide additional insights into the formation physics. In this Paper, we focus on the public version of the Munich semi-analytical model L-Galaxies released in 2015 (Henriques et al., 2015), henceforth H15, for a Planck 2014 cosmology (Planck Collaboration, 2014), and show how lensing complemented by clustering signals can inform on the parameter choices for the feedback processes. Recently, a newer version of the model, presented in Henriques et al. (2020), became available. The improvements introduced there primarily concerns the ability to provide predictions for discretised gas distributions in radial rings, which have negligible to small impact on galaxy clustering and lensing signals. Moreover, Ayromlou et al. (2020) have conducted a study where they compare general properties of galaxies in TNG100 and TNG300 with L-Galaxies, apart from lensing and clustering predictions, which this analysis complements. Wang et al. (2016) found that the H15 model predicts an excessive lensing signal around Sloan Digital Sky Survey (SDSS) locally brightest galaxies, LBGs (Planck Collaboration, 2013; Anderson et al., 2015). By enforcing a stellar mass correction based on abundance matching to SDSS via the fitting function in Li & White (2009), a better agreement was reached. The motivation for this correction was that if the model stellar masses were adjusted so that the SMFs traced the observed data, the lensing signals should agree better with the observed lensing data by default. The version with the smallest necessary abundance correction was the Guo et al. (2011) model, henceforth G11, adapted for the Planck 2014 cosmology, owing to the MCMC tuning to low redshift observations. This model also passed a more stringent test in Mandelbaum et al. (2016) with a separation of the lensing signal for red and blue LBGs. Still, due to the low redshift tuning, this version has difficulties in making predictions for future deep surveys, such as the Hyper Suprime-Cam SSP Survey (HSC) (Aihara et al., 2018) and the Euclid mission, where the signal will be measured for lens systems beyond . In addition, it does not feature recent developments to improve the modelling of low mass galaxies, where H15 has reduced the over-abundance of systems at as well as the excessive fraction of red dwarf galaxies at low redshift. Our task here is to see if we can alter the H15 model sufficiently to match the low redshift lensing signals while retaining the higher- SMF agreement, and see how it fares against other datasets.
We focus on selections based on stellar mass, joint stellar mass and colour and joint stellar mass and isolation/group membership criteria. The latter is especially important for upcoming group and cluster finders, where lensing can be used to validate models of feedback from active galactic nuclei (AGN) (e.g. McCarthy et al., 2010; Viola et al., 2015). Colour bimodality can inform models for quenching mechanisms of star formation and their relations to the host halo mass (e.g. Zu & Mandelbaum, 2016; Mandelbaum et al., 2016). With respect to Wang et al. (2016); Mandelbaum et al. (2016), we both consider the locally brightest galaxies and the full galaxy distribution. For lensing observations, we consider a deeper field from the equatorial overlap of the KiDS+GAMA surveys (Liske et al., 2015; Kuijken et al., 2015) with data from van Uitert et al. (2016) and Velliscig et al. (2017) and a shallow field (SDSS-DR7) (Wang et al., 2016; Mandelbaum et al., 2016; Zu & Mandelbaum, 2016) to illustrate how different surveys and redshifts affect the lensing profiles. We also compare predictions from the HOD models of Zu & Mandelbaum (iHODS, 2016) to illustrate how well the different frameworks with increasingly granular levels of model sophistication can capture the signal. For the SAM, we use the LBG and stellar mass only samples to constrain the model parameters and then use the group lens samples from Velliscig et al. (2017) as validation cases for the new models.
The purpose of our study is three-fold: (i) Investigate if L-Galaxies fits current observational constraints from galaxy-galaxy lensing and clustering, and (ii) Examine if modest changes to a few model parameters can bring about better agreement. (iii) Assess the agreement of the IllustrisTNG hydrodynamical simulation with observations and explore differences with respect to the SAM.
This Paper is organised as follows: We introduce our observables in Section 2, the simulations as well as review the physical recipes of the feedback processes in L-Galaxies in Section 3. The different datasets we use to gauge the performance of the models, as well as their colour distributions, are given in Section 4. In Section 5 we present our methodology to match the simulations with the different datasets. In Section 6, we show our results for the modified galaxy formation models for the stellar mass functions (Section 6.1), stellar mass-selected lenses (Section 6.2) followed by the implications of cosmology (Section 6.2.2) and baryons (Section 6.2.3), colour-selected lenses (Section 6.3), LBGs (Section 6.4.1 and Section 6.4.2) and galaxy clustering (Section 6.5). Finally, we conclude with computing the predictions for a few of our models for the KiDS+GAMA group lens sample in Section 6.6.
2 Galaxy-galaxy lensing and clustering
Under the assumption of statistical isotropy, the spatial two-point correlation functions
| (1) |
with i g for the galaxy field with itself (galaxy clustering) and i m for the galaxy field with the matter field (galaxy-galaxy lensing) can be inferred by their projections integrated along the line-of-sight ,
| (2) | ||||
| (3) |
where is the average matter density, evaluated at the projected radius with as the projected clustering correlation function and as the projected surface mass density. This latter quantity can be used to construct a differential excess surface mass density related to the observed tangential shear of background galaxies around foreground matter overdensities as the difference between the average projected mass inside a circular aperture with radius and a boundary term evaluated in a thin cylindrical shell by
| (4) |
where is a geometric pre-factor containing the angular diameter distances of the lenses , sources and the relative distance between them , and the gravitational constant and the speed of light . We estimate the autocorrelation function using pair counts according to the standard definition as
| (5) |
where as the total number of galaxies in the snapshot, the total volume, and and the volume and number of galaxies per cylindrical shell with radius around each galaxy. Effectively, the integration for in Eq. (2) is carried out to a maximal distance to account for the uncertainty in determining galaxy redshifts. We set following Zu & Mandelbaum (2016). However, this choice primarily influences the clustering 2-halo term. For the lensing signal we integrate along the entire simulation box length .
We denote the central galaxy lensing signal as , taken to be the same as the friends-of-friends group signal, and as the satellite signal. The joint central-satellite signal is calculated as a sum where these contributions are weighted with and , the satellite fraction, respectively. The central signal is effectively the lensing of the host haloes, whereas the satellite signal features a central sharpening from the presence of the subhalo which decreases radially until the contribution from the central host halo kicks in as a central bump. The radial distance between these two features reflects the average projected distance between the satellites and their centrals.
3 Simulations
We list the different simulations used in this study below, all with flat CDM universes. Subhaloes are identified using Subfind (Springel et al., 2001) in every friends-of-friends (FOF) group constructed with a halo finder (Davis et al., 1985). For the merger trees for the galaxy formation models, subhaloes with more than twenty bound particles are linked uniquely to descendants in the subsequent snapshots following Springel et al. (2005) with merger trees built with the LHaloTree algorithm.
3.1 IllustrisTNG
IllustrisTNG is the next generation of the Illustris simulation suite, also run with the moving mesh-code AREPO (Springel, 2010) with an updated galaxy formation model (Weinberger et al., 2017; Pillepich et al., 2018a) extending the original Illustris model (Vogelsberger et al., 2013; Torrey et al., 2014), assuming a Planck 2016 cosmology (Planck Collaboration, 2016). The two main changes from the fiducial Illustris implementation concern black holes and supernova-driven winds (Weinberger et al., 2017; Pillepich et al., 2018b), which include a new AGN feedback model for the low accretion state of the black holes, and changes to the stellar feedback winds. This decreases the stellar-to-halo mass ratio for massive central galaxies while retaining more gas in the inner parts of the haloes and significantly improves the stellar masses and colours of galaxies below the knee. Box lengths and particle numbers are with particles (TNG100, with the same phases as Illustris in the initial conditions, which enables object-by-object comparisons) and with particles (TNG300) for the highest resolution runs. Particle masses are and (TNG100) and and (TNG300). For the gravity-only runs, the corresponding particle masses are (TNG100-DMO) and (TNG300-DMO). The maximum softening lengths are (TNG100) and (TNG300) for the dark matter and stars, with a minimum adaptive gas cell softening of (TNG100) and (TNG300). Results for the stellar and halo mass functions, galaxy colours, clustering and matter power spectra, magnetic fields and chemical evolution have been presented in Pillepich et al. (2018b); Nelson et al. (2018); Springel et al. (2018); Marinacci et al. (2018); Naiman et al. (2018). These two simulations have recently been publicly released111Available at: www.tng-project.org., as described in Nelson et al. (2019). We primarily use TNG300 to obtain comparable statistics as for the Millennium simulation. We also enforce the resolution correction from the appendices of Pillepich et al. (2018b) for TNG300, called ’rTNG300’ for some comparisons. This correction brings the stellar-to-halo mass relation, as well as the stellar mass function, in line with that of TNG100 and observations, as numerical convergence results in higher stellar masses and star formation rates with increasing resolution. Specifically, one uses the differences between the higher resolved TNG100-1 simulation and its lower resolution companion TNG100-2, which has the same resolution as TNG300-1 (which we refer to as TNG300), to determine the correction.
3.2 Millennium and Millennium-II
For the L-Galaxies comparisons to observations we primarily use the Millennium suite simulations. Millennium (MR) (Springel et al., 2005) and Millennium-II (MRII) (Boylan-Kolchin et al., 2009) are cold dark matter-only simulations performed using Gadget-2 and Gadget-3 (Springel, 2005), respectively, with particles with masses and , respectively, with a WMAP1 cosmology (Spergel et al., 2003) and box lengths of and . The Plummer-equivalent softening lengths are and , respectively. We primarily use rescaled versions of these simulations with a Planck 2014 cosmology (Planck Collaboration, 2014) applying the techniques of Angulo & White (2010); Angulo & Hilbert (2015) with and box lengths of and , and particle masses (MRscPlanck) and (MRIIscPlanck). Cosmological rescaling is an established technique to match the linear growth and the fluctuations of the matter power spectrum scales over scales corresponding to a range of halo masses one seeks to match in a target cosmology using a simulation with a different fiducial cosmology (see e.g. Angulo & White, 2010; Angulo & Hilbert, 2015; Renneby et al., 2018; Zennaro et al., 2019). Renneby et al. (2018) showed that it is possible to predict and correct for the bias in the lensing signal in such rescaled cosmologies using linear theory and fits to the concentration-mass-redshift relation. Here the correction is negligible and thus we ignore it. SAM lensing comparisons to direct simulations with different cosmological parameters were already carried out in Wang et al. (2016). Some of these galaxy formation models as well as the merger trees and halo catalogues are accessible through the Virgo Millennium database (Lemson & Virgo Consortium, 2006).
3.3 L-Galaxies
The seventeen free parameters in L-Galaxies have been calibrated against the stellar mass function (SMF) at and the red fraction of galaxies . These parameters cover star formation, feedback from supernovae and active galactic nuclei, metal yields and galaxy merger criteria. The H15 model is described in full in the Supplementary Material of that publication. The choices from the MCMC fit do not necessarily provide the best match to the SMF at low redshifts, since stress is put on obtaining good predictions at higher redshifts as well. As there are many free parameters, as well as degeneracies between the impact of different physical processes in the observables one attempts to match, the model is the output of an exploration of a very high-dimensional parameter space. In this Paper, we investigate the H15 model222Public release available at: http://galformod.mpa-garching.mpg.de/public/LGalaxies/index.html. and a subsection of model alterations to see if they can provide better fits to 2-pt statistics. The idea is that clustering and lensing observations could break some of the model degeneracies, and possibly be able to rule out the model in certain regimes.
We investigate the 2-pt statistics predictions from the existing H15 model and alterations of it where we restrict the modifications to values of three parameters, , and , which govern the stellar-to-halo mass relation and the satellite fraction. The benefit here is to see whether it is possible to change the model marginally with the variables which we deem most liable in determining the lensing signal, while keeping the other model variables fixed, avoiding a full new MCMC search. Lensing predictions are more computationally intense to obtain than clustering signals, and this analysis serves to prove whether such constraints are useful, or if all relevant information is already contained in the SMF. The clustering observations primary purpose is to illustrate that the new models work for them as well, i.e. that they provide consistent predictions for the galaxy and matter fields. This is in contrast to a constraint analysis performed by van Daalen et al. (2016), which focuses on galaxy clustering observations using an older version of the model. Below we review the parts of the H15 model where the relevant parameters for the lensing signals occur.
3.3.1 - AGN feedback efficiency regulator
From the peak of star formation efficiency for Milky Way class galaxies, the lower mass end is regulated by supernovae (SN) and galactic wind feedback and the high mass end by AGN feedback (see abundance matching results in e.g. Moster et al., 2010; Behroozi et al., 2010); although recent studies hint that AGN feedback could also play an important role for less massive systems (e.g. Kaviraj et al., 2019). Hence, these two processes are a natural starting point for modifications to alter the lensing predictions. Since the lensing signals for the H15 model in Wang et al. (2016) were too high, it means that one could attempt lower each or both efficiencies for these processes to increase the stellar-to-halo mass ratio for the galaxies. In H15, AGN feedback is implemented with a radio mode accretion model (Croton et al., 2006) normalised to the expansion rate of the Universe , which increases the accretion at lower redshifts,
| (6) |
where is the accretion rate, is a free parameter that regulates the efficiency of the accretion (in units of ), and and are the masses of the hot gas halo and the supermassive black hole (SMBH), respectively. This accretion then impedes the cooling flow onto the cold disc as it is accompanied by depositing energy into the hot gas halo. With respect to previous versions of the SAM, is assumed to be fixed across all redshifts. This change was introduced to make certain that galaxies with stellar masses around the knee of the SMF were sufficiently quenched at .
3.3.2 - supernovae gas reheating efficiency
For SN feedback, the H15 model has two regulators. The one which is relevant here sets the fraction of this energy for the reheating of cold gas and the subsequent injection into the hot gas atmosphere. The mass of cold gas reheated due to star formation is set to be proportional to the amount of stars formed (see e.g. Martin, 1999)
| (7) |
where is the mass of stars in the galaxy disc and is
| (8) |
where is the efficiency, the maximum circular velocity and and parameters determining the normalisation and slope of the feedback, respectively. In this study we keep these two parameters fixed to the fiducial H15 values.
3.3.3 - dynamic friction multiplier
Another way to increase the stellar masses is to modify processes governing the merging of systems. In SAMs, a subhalo of a satellite galaxy can be disrupted and the satellite shortly lives on as an orphan galaxy before falling into the central galaxy due to dynamical friction. The time between disruption and accretion, , is fixed by a merging timescale (see e.g. Binney & Tremaine, 1987) as
| (9) |
where is the total mass of the satellite, the radius of the satellite orbit, and the mass and circular velocity of the friends-of-friends host halo, the gravitational constant and a merger time multiplier. This value was set to by De Lucia & Blaizot (2007) to conform with the bright end of the luminosity function at . This choice was later found to be consistent with direct numerical simulation inferences (Boylan-Kolchin et al., 2008; De Lucia et al., 2010). Intuitively, decreasing lowers and boosts the stellar mass of central galaxies which dominate the high mass end of the SMF as mergers are associated with starbursts. However, a short merger timescale implies that one overall ends up with fewer massive systems. One can decrease the efficiency of the feedback process to increase this number, which means that these two simultaneous modifications produce indistinguishable333This does not guarantee that other observables, such as radial profiles, agree, which influence the lensing and clustering predictions under certain selection functions. SMFs.
| Model | |||
|---|---|---|---|
| G11 | 6.5 | 2.0 | |
| H15 |
| 1.67 | |||
| 2.62 | |||
| 38.89 | |||
| 3.14 | |||
| 18.91 | |||
| 2.21 | |||
| 4.23 | |||
| 6.44 | |||
| 2.05 | |||
| 3.72 | |||
| 5.53 | |||
| 1.90 | |||
| 3.32 | |||
| 4.86 | |||
| 6.48 | |||
| 7.91 | |||
| 3.96 | |||
| 9.58 |
3.3.4 Model variations and picking the best SAM
We list the fiducial values of these parameters in Table 1 and the variations in Table 2. The extreme models with 10 % of the fiducial model parameter values mainly serve as test cases. In the G11 version of the model, has a marginally lower value and in van Daalen et al. (2016), a 40 % to 50 % lower value was required to match clustering observations. Hence we are focusing on derivative models with a lower and lower than in the fiducial H15 model. H15 also found that boosting was necessary for a better clustering agreement. In the H15 model this value is already fixed to a much higher value so we just modify the efficiency. With respect to observations, this SN mass loading factor was found to be on the high end in H15 and this motivates the decrease.
We quantify the best SAMs under each selection function for the lensing and clustering observables through a figure-of-merit:
| (10) |
where goes over all overlapping data points , where we linearly interpolate the model between the bins and is the reported variance of the observations. To reduce this to a scalar for the different mass bins for a given dataset, we effectively compute the average for the dataset, but write for brevity.
4 Data
In this Section we describe the different lensing and clustering datasets used in this study.
4.1 KiDS+GAMA: Data selections
We compare the predicted lensing signals to observational results from the KiDS shear catalogues and GAMA foreground lens sample in the equatorial regions (fields G09, G12 and G15) using the published data in van Uitert et al. (2016) for the partly overlapping region (75.1 deg2) with an effective source density of 5.98 arcmin-2 (Kuijken et al., 2015). For the sample, we consider all galaxies which satisfy the stellar mass criteria, based on the stellar mass information in Taylor et al. (2011). Error bars incorporate the effect of cosmic variance. This dataset serves as our principal lensing observations, since it has the simplest selection function. The average redshifts range from to from the lowest to the highest mass bins.
We also make use of observations presented in Velliscig et al. (2017), which were compared to the EAGLE hydrodynamical simulation with satisfactory agreement in the same publication. This study considered measurements which satisfy stellar mass criteria and consist of galaxy groups with at least five members from the GAMA group catalogue G3Cv7 (Robotham et al., 2011). Galaxies in this group catalogue are linked via friends-of-friends based on their line-of-sight and projected distances and the catalogue has been calibrated against the Millennium simulation with SAMs (Bower et al., 2006). For groups with more than five members, galaxies are reliably classified as centrals/satellites above the completeness limit of GAMA which is . The field overlap is 180 deg2.
4.2 SDSS: Data selections
Locally brightest galaxies, LBGs, are found with the following procedure: A cylinder with radius in physical coordinates spanning in redshift is constructed around each galaxy and if the galaxy has the brightest absolute band magnitude with dust extinction in this cylinder it is considered an LBG. For the observational LBGs, we use the lensing measurements in Wang et al. (2016) (all) and in Mandelbaum et al. (2016) (red and blue). The source catalogue is described in Reyes et al. (2012) and the effective source density is 1.2 arcmin-2.
For the stellar mass only clustering, we use the observations from G11, which have appeared for comparisons with H15 in Henriques et al. (2017) and with TNG100 and TNG300 in Springel et al. (2018).
We use the SDSS-DR7 (Abazajian et al., 2009) lens and clustering sample from Zu & Mandelbaum (2016) as well as the all main SDSS-DR7 lensing sample from Mandelbaum et al. (2016). Red and blue galaxies are separated according to the following colour cut (with filter magnitudes computed in rest-frame wavebands blueshifted to ),
| (11) |
with as the galaxy stellar mass. For the SDSS LBGs in Mandelbaum et al. (2016), we separate red and blue according to
| (12) |
We first -correct our magnitudes and convert this cut into a separation for magnitudes in rest-frame wavebands at using the empirical filter conversion formulae of Blanton & Roweis (2007). Transformed to the filters, this cut is similar to the one used by Springel et al. (2018) and Henriques et al. (2017) and it reasonably follows the depth of the green valley in L-Galaxies as well as in TNG300. We see negligible differences in the colour distributions at the high mass end between the colours with and without dust extinction added, but there is a shift for low mass galaxies around with blue galaxies being misclassified as red, which leads to a slight blurring of the green valley. The Pillepich et al. (2018b) stellar mass resolution correction for TNG300, which produces rTNG300, does not take into account the differences in the colour distributions between TNG100 and TNG300, which primarily affects galaxies with in the range of stellar masses we are probing. The consequence of this correction is that the red sequence in rTNG300 is shifted into the blue by about 0.1 mag for , with a slightly smaller shift for higher masses. This is one example of a relation which the resolution correction affects, implying that one should proceed with caution as consistency conditions of the simulation are altered. However, we are mainly interested in the stellar mass-halo mass relation for lensing, and since the correction brings (r)TNG300 in line with observations, it is still a meriting case to examine. We discuss how satellite fractions are affected in Section 6.2.3.
5 Method
In this Section we outline how we model the different lensing and clustering datasets under different selection functions.
5.1 Background cosmology, box size and hydrodynamics
Apart from differences in galaxy formation physics, the galaxy-galaxy lensing and clustering signals are also influenced by cosmological parameters. To illustrate this we also compute the SAM lensing predictions for the fiducial H15 model in the fiducial Millennium WMAP1 cosmology, which has a lower matter fraction and greater than the Planck 2014 cosmology. We have run the L-Galaxies SAM on TNG100-DMO and TNG300-DMO, the gravity-only versions of IllustrisTNG boxes. In these simulations, the background cosmology, Planck 2016 (Planck Collaboration, 2016), is close to the adopted Planck 2014 cosmology, which means that the model parameters chosen should be fairly optimal.
We have compared the halo mass functions, which are what the rescaling algorithm is designed to match, for the central galaxies for the H15 model run on top of the rescaled MR and MRII runs as well as the gravity-only runs of TNG100 and TNG300 and note negligible differences. This, however, does not necessarily translate to good agreement in the SMFs, for the rescaled MRII whose SMF deviates from the TNG100-DMO results above . We attribute this mass bias to small number statistics and potential biases in how the SAM assigns galaxies to the rescaled merger trees. Because of this issue, and in order to conform with the number of objects and simulation volume for EAGLE in the Velliscig et al. (2017) study, we carry out the group lensing comparison with the SAM derivatives run on the gravity-only TNG100-DMO simulation.
In the IllustrisTNG suite, the lensing signal is affected by the hydrodynamics. To gauge the impact we compare the lensing signal around matched subhaloes in the full physics and gravity-only runs. This matching is bijective and based on the particle IDs in the structures. We also compare the TNG results to its predecessor Illustris and the EAGLE simulation. The matched EAGLE catalogues we use are built using a matching of the 50 most bound particles of the substructures (see e.g. Schaller et al., 2015). For the central (sub-)haloes studied in this analysis, there should be negligible differences between the matching techniques, but we note potential differences for satellite galaxies (see Section 6.6.2).
5.2 Simulation mocks
To produce lensing predictions from simulations, we bin particles and tessellation elements in concentric cylindrical shells around the structures of interest using the full distributions in a given simulation snapshot with average redshift close to the average lens redshift. We use this method rather than computing full lightcones as it is simpler and yields comparable results. The signal is computed as the average of the projection along the three spatial axes. Theoretical error bars for the lensing are computed using hundred bootstrap samplings of the signal, where we treat each component in the full physics run separately, with replacements with the 95 % percentiles shown. We do not account for this model spread in the -computations, as it is typically small. For galaxy clustering we measure the signal in 40 log-equidistant bins between and and for lensing 40 log-equidistant bins between and (KiDS+GAMA) and and (SDSS-DR7). Hence we probe the 1-halo and 2-halo terms for the clustering and mainly the 1-halo term for galaxy-galaxy lensing. For the clustering data points without error bars, we use estimates for the variance which correspond to the smallest quoted errors. We make some of these profiles publicly available at the TNG website, including a library of object-by-object component-wise lensing profiles for galaxies with from TNG300 and their dark matter-only counterparts in TNG300-DMO at . We also make profiles for galaxies from TNG100 and TNG100-DMO passing this stellar mass cut at available.
For the van Uitert et al. (2016) stellar mass-only comparison, our baseline model test data, we measure the signal444We have performed the same analysis at for a few of the SAMs and note negligible differences. Hence we use the same snapshot for all mass bins. at in the rescaled MR and MRII runs which is reasonably close to the average redshift of . We also show the corresponding predictions from the TNG300, TNG100 and Illustris simulations at . For the EAGLE simulation we use the snapshot. For the SDSS comparisons, we use the snapshot for TNG300 to boost the statistical signal and the snapshot for the MR run, but we have checked that there are negligible differences at such low redshifts. For the galaxy group lensing sample from Velliscig et al. (2017), we show predictions from the different SAMs run on TNG100-DMO at . We also compute the corresponding predictions from TNG100, TNG300 and Illustris at this redshift.
The samples in Zu & Mandelbaum (2016) and Zu & Mandelbaum (2015) are approximately volume complete until an imposed limit in stellar mass which gives the maximum redshift a galaxy with a given stellar mass could be observed at as a sensitivity function. This sensitivity function can be incorporated into the differential comoving volume element , which can be used to set the relative weight of the different simulation snapshots for each stellar mass bin . Such a setup effectively down-weights the contribution from the highest redshift snapshots. Below the mass limit , the sensitivity is considered to be full and we use the ordinary differential comoving volume element to define that volume. Each individual stellar mass lensing sample is thus constructed from the list of available snapshots with individual weights set by their fractional contribution to the total comoving volume. We have verified that there are negligible differences in the host halo masses for centrals and satellites for samples defined using this technique with respect to using a single snapshot at to define the sample, although the satellite fraction changes on the order of for the H15 model. Hence, we use the snapshot for our mocks.
For the KiDS+GAMA group lens sample, we introduce a minimal stellar mass following Velliscig et al. (2017) from which we start counting group members. This mass is set such that the satellite fraction for galaxies in the GAMA fields is matched for a given stellar mass bin. Increasing this mass leads to an almost monotonic increase in , depending on the sample size, as the number of group central galaxies decreases whereas the number of satellite galaxies is almost constant for a given stellar mass bin.
5.3 Locally brightest galaxies - LBGs
We select the mock LBGs, which were investigated in previous comparisons (see e.g. Wang et al., 2016; Mandelbaum et al., 2016) by matching the observational criteria as adopted by Planck Collaboration (2013). At the high mass end, identification rates for LBGs exceed for central galaxies – i.e. the fraction of central galaxies which are also LBGs – but less luminous red galaxies are excluded to a greater extent than blue centrals since red centrals live in denser and thus more clustered environments, although this effect is of the order of . All distances quoted are in comoving units, except for the LBG selection cylinder which has a radius in physical Mpc.
5.4 Galaxy classification and stellar masses
Galaxies in the SAMs are classified as centrals, satellites or orphans in their host haloes depending on whether their associated subhaloes are central, satellite, or stripped. In IllustrisTNG there are only central and satellite subhalo hosts. In the SAM the stellar mass is given as the combined mass in stars in the bulge and disk, where the intracluster light (ICL) component is neglected (this primarily affects the high mass end). For IllustrisTNG and the other hydrodynamical simulations we use the bound stellar masses to be in line with EAGLE (Velliscig et al., 2017). We have also conducted the analysis with 30 pkpc (physical kpc) aperture masses to conform with previous studies which have compared SAMs and results from the EAGLE simulation (Guo et al., 2016; Mitchell et al., 2018), and we achieve comparable results. For the clustering signals we show results with these 30 pkpc aperture masses; the bound mass results have already been presented in Springel et al. (2018). We use the simulation specific values to convert between stellar masses.
As we are primarily interested in looking at predictions from the largest boxes, this limits the lowest allowed stellar masses due to resolution effects. Hence we consider only galaxies with in accordance with Henriques et al. (2017).
5.5 Colours and dust
The division of galaxies into red and blue can be affected by the dust model used, especially for dusty star-forming galaxies. This in turn can influence the predicted clustering and lensing signals. To illustrate this we perform the analysis with and without dust extinction for the derivative H15 models as well as the IllustrisTNG suite. The main difference in the dust treatment between the G11 and H15 versions is a stronger scaling with redshift in the latter for the extinction by the interstellar medium in galactic discs555The total dust model is separated into an ISM treatment and one for the molecular birth clouds of stars following De Lucia & Blaizot (2007).. This should have a minor impact since we only probe colours at .
For IllustrisTNG, we use the fiducial dust model from Nelson et al. (2018), which describes technical details, with resolved dust attenuation following the simulated distribution of neutral gas and metals. This model depends on the viewing angle and we use the median magnitudes of the twelve angles provided. The dust attenuation in this model has a weak redshift scaling and is almost negligible close to . More recent models can have stronger redshift dependencies (as investigated in e.g. Vogelsberger et al., 2019, 2020), with the new model described in McKinnon et al. (2016, 2017, 2018), but this is of limited importance in the local Universe and thus we do not investigate the impact of different dust models. For the uncorrected colours we sum the magnitudes of all the individual bound star particles per subhalo, which are assigned using the Bruzual & Charlot (2003) stellar synthesis models assuming a Chabrier IMF.
6 Results
In the following Sections we present and discuss our results for the different datasets, starting with the SMFs and the predictions for the different galaxy-galaxy lensing datasets, followed by the galaxy clustering results and lastly by the galaxy group lensing signals.
6.1 Stellar mass functions
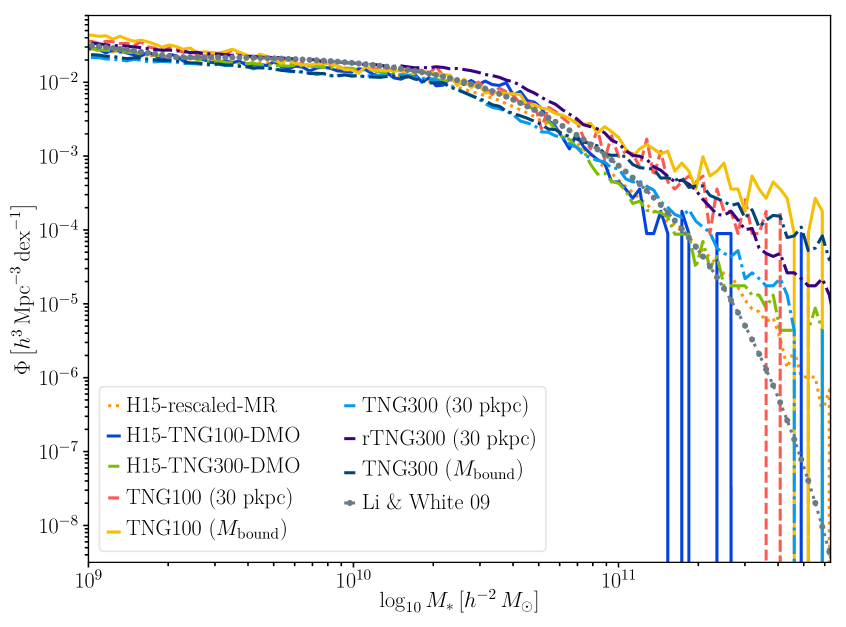
The stellar mass functions and the stellar-to-halo mass relations for the IllustrisTNG suite have been extensively covered in Pillepich et al. (2018b). For accessibility we plot the curves for TNG300, TNG100 and the H15 model run on the gravity-only versions of these simulations as well as the rescaled MR simulation in Fig. 1. We see that the DMO-curves and the rescaled MR results are consistent with one another. Here we show the results for two different stellar mass definitions for the hydrodynamical simulations, that contained in a 30 pkpc aperture and the total bound subhalo stellar mass, . This choice especially matters beyond the knee of the SMF, as the apertures cannot capture all bound star particles. We note that both TNG100 and TNG300 favour a higher signal in Fig. 1 in this regime than the H15 model, especially if one considers bound stellar masses. We will show that this results in a better agreement with observational lensing data in the upcoming Sections. Note that the SMFs for TNG100 and TNG300 are more similar at the high mass end than the 30 pkpc SMFs, where the resolution corrected rTNG300 SMF nicely traces the TNG100 curve.
Due to difficulties in properly integrating the sizes of the galaxies, as well as accounting for the ICL, and flux corrections, stellar masses at the massive end can be under-estimated by up to 0.3 dex (D’Souza et al., 2015). Thus all these curves are in agreement with observations and there is still room for the modifications of the SAM parameters in Table 2 while being consistent with the data.
6.1.1 SMFs and abundance corrections for SAMs
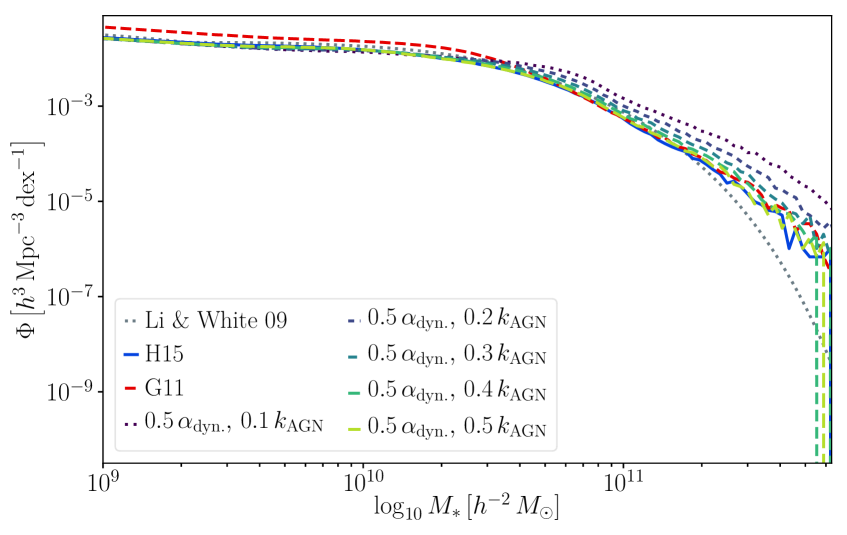
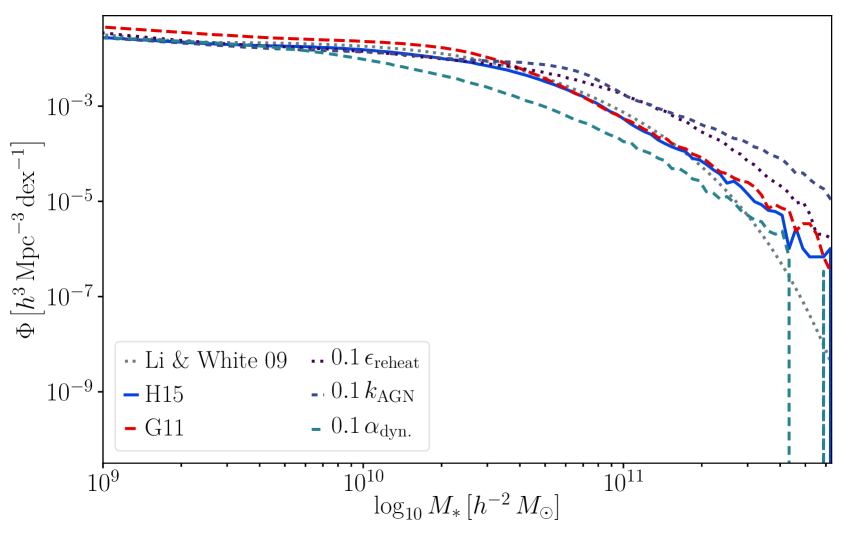
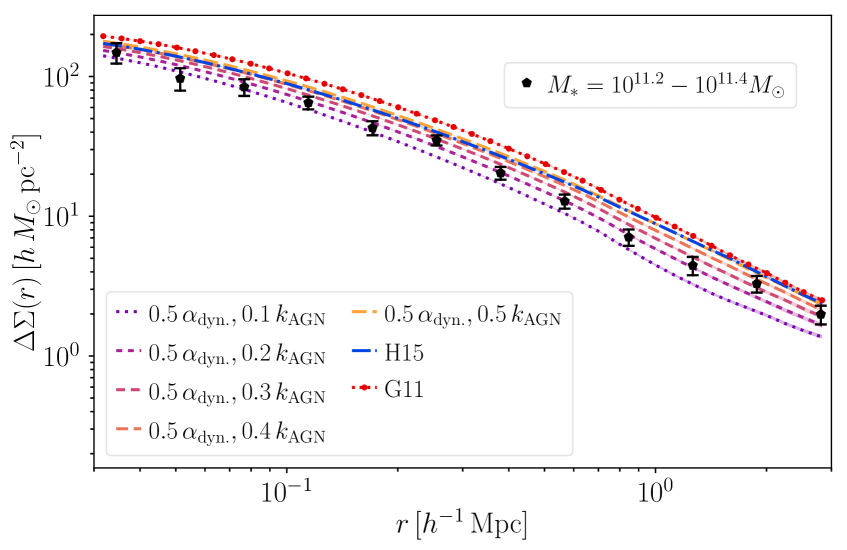
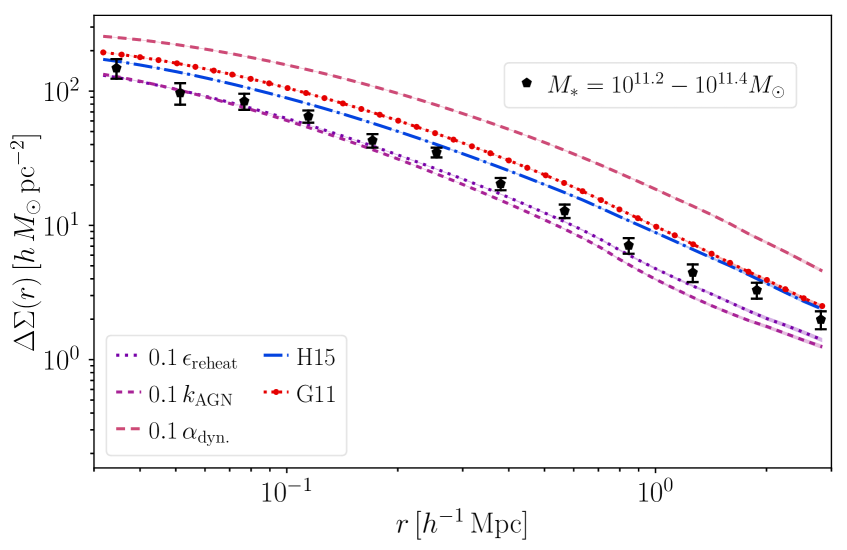
In Fig. 2 we show the SMFs at compared to the fitting function in Li & White (2009) for a few of the different SAMs at fixed and the two fiducial models (left), as well as the effect of the most extreme parameter choices from Table 2 in (right). Here we have not convolved the masses with any observational error estimate but this has a minor effect below and only affects the massive end. We find that the SMF of the model closely resembles the H15 result, indicating that reducing the dynamical friction time while simultaneously reducing the AGN efficiency introduces an SMF degeneracy with the model run with the fiducial parameter values. The more extreme AGN feedback choices produce deviations away from the fitting function starting at . Hence, we determine that these modifications are allowed by the observational constraints as discussed in Section 6.1. The and models lie on the extreme end of what is allowed whereas the model is ruled out. Compared to the TNG suite predictions in Fig. 1, these model derivatives reflect those results above .
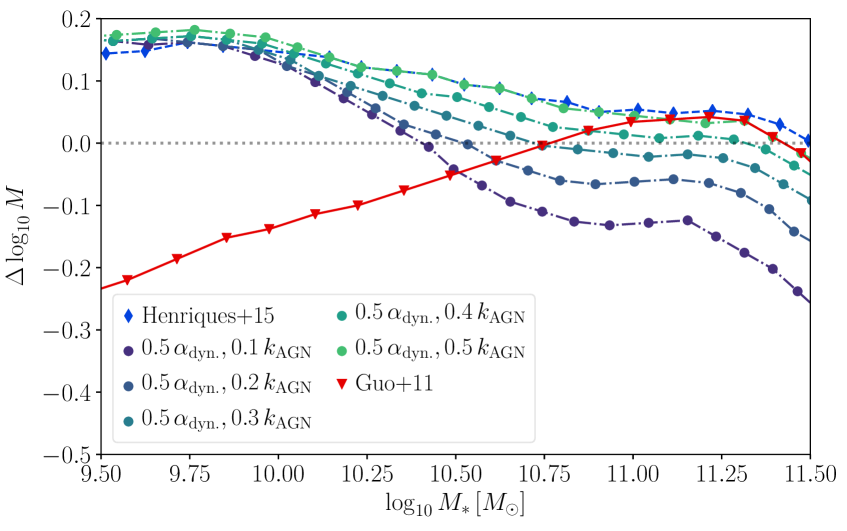
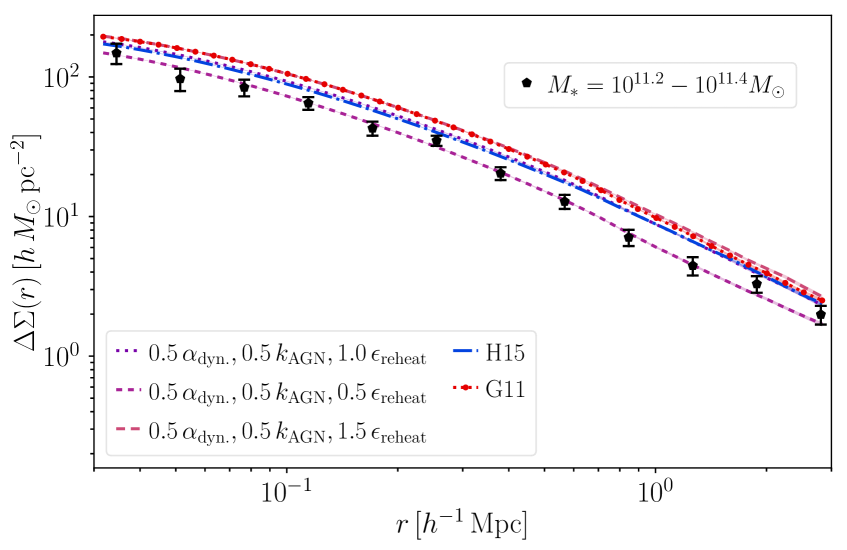
We quantify the deviations of the SAMs from the ’local SMF’ by computing the necessary stellar mass correction to bring about agreement with the Li & White (2009) fitting formula for SDSS following Wang et al. (2016), i.e. abundance correcting the stellar masses. These abundance corrections are illustrated in Fig. 3 with the mass correction in dex on the axis for a given stellar mass on the axis. All derivative models of H15 have a positive correction for low stellar masses whereas it is negative for the G11 model with approximately the same magnitude. These two models have a similar correction for stellar masses around . The model with reduced and AGN feedback efficiency , , needs a similar correction as H15 as seen in Fig. 3. At fixed , altering has the net effect of gradually decreasing the correction for high stellar masses, but the effect is small for dwarf galaxies with a congruence towards the fiducial solution. As we shall see in the following Sections, the model will give the best LBG and good clustering results, and we find that it comes with a small correction (left). Fixing and changing gradually offsets the solution similarly across the whole range of stellar masses, although the effect is slightly larger around . Lastly, varying the SN feedback produces concave and convex curves around the fiducial valued model for , with a congruence at , with yielding a similar curve to . Simultaneously decreasing and produces a smoother transition around the knee than solely decreasing the AGN feedback efficiency. The extreme solutions with 10 % of the fiducial H15 values for the AGN feedback and SN feedback are similar to the low solutions, where the model lacks the plateau feature around . The solution is ruled out and remains positive across the whole mass range.
6.2 Stellar mass selection: KiDS+GAMA
We begin by investigating the lensing signal for L-Galaxies for stellar mass-only samples to match the observations from the KiDS+GAMA fields at for the van Uitert et al. (2016) datasets, quantify the cosmological dependency, and then proceed to compute the same signals for TNG300 and use that simulation, as well as TNG100, Illustris and EAGLE, to measure the baryonic effects on the signal. As already mentioned, this dataset has the simplest selection function of those covered in this analysis, and thus it serves as the principal benchmark for the SAM and TNG predictions.
6.2.1 L-Galaxies and variations
| Stellar mass lensing | Fiducial | Abundance corrected | ||
|---|---|---|---|---|
| First | 1.67 | H15 | 5.95 | |
| Second | 1.90 | 6.32 | ||
| Third | 2.05 | 6.66 | ||
| … | … | … | ||
| - | G11 | 14.53 | 10.23 | |
| - | 18.91 | 11.45 | ||
| - | 38.89 | G11 | 15.67 |
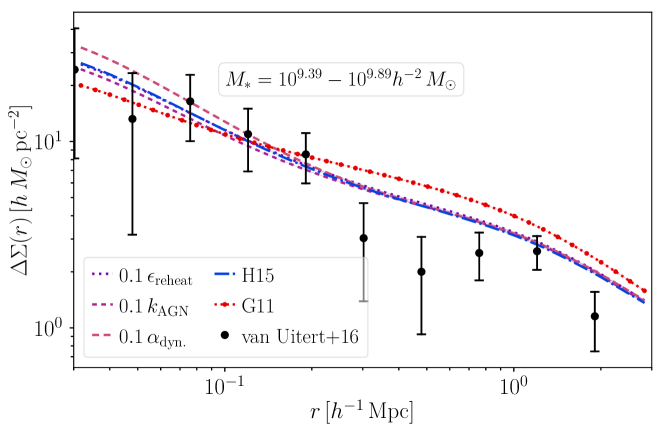
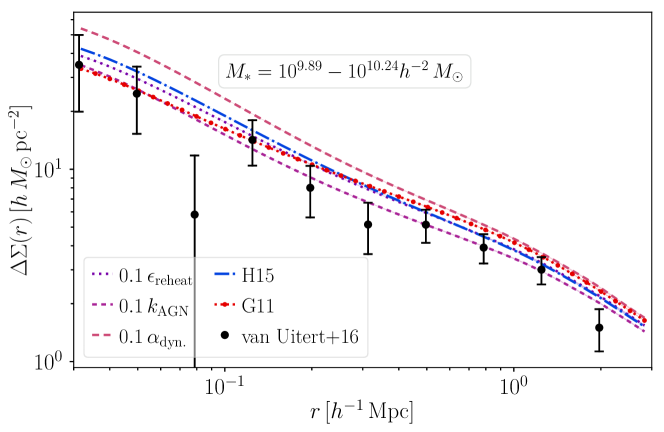
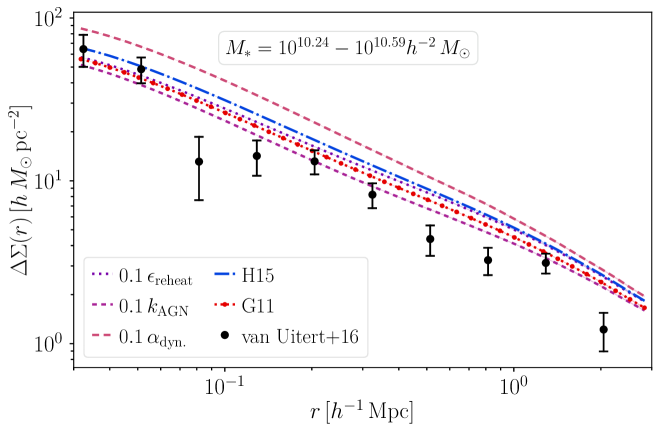
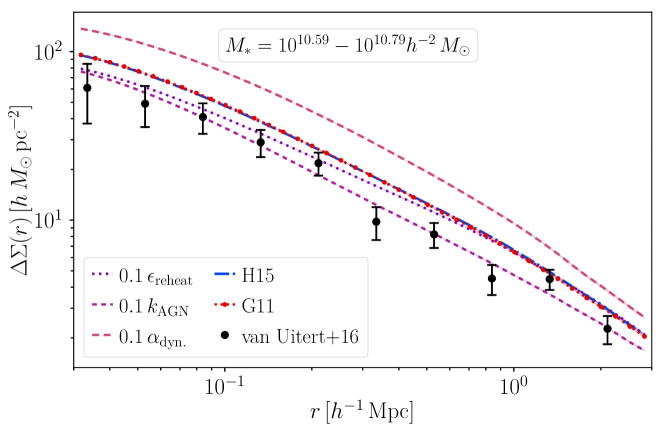
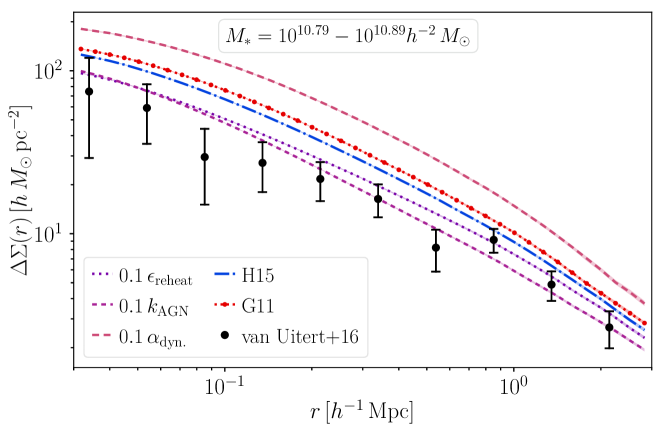
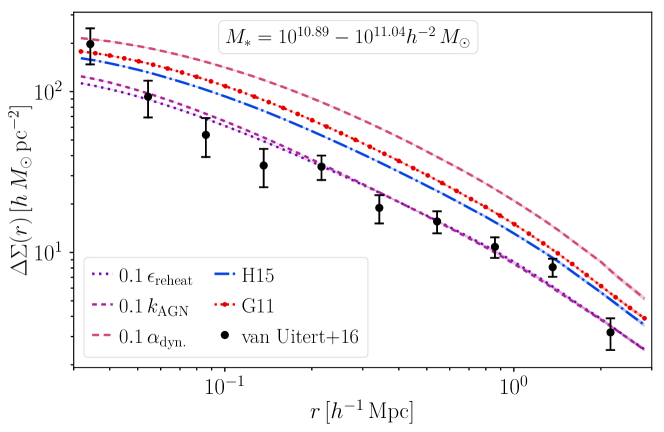
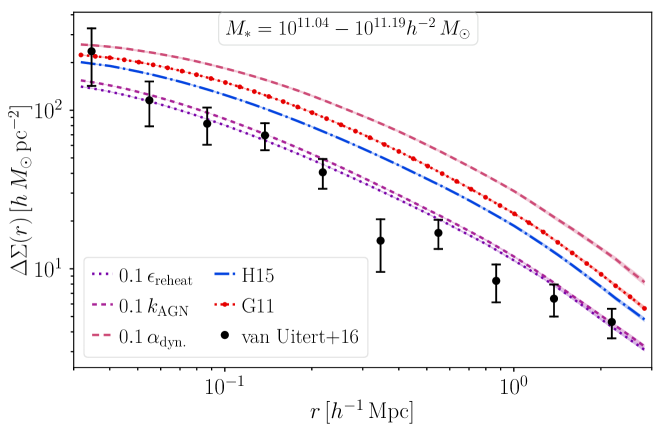
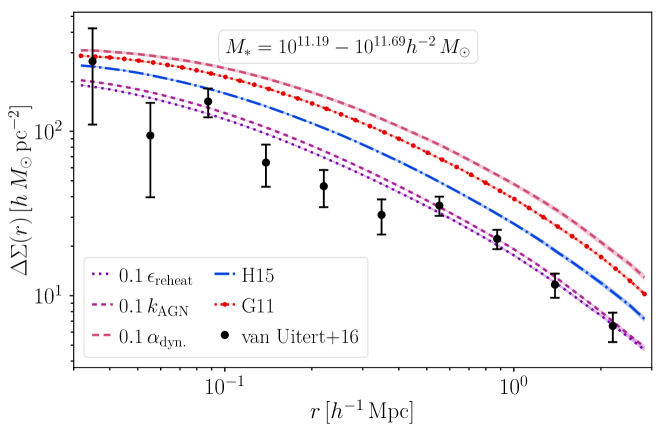
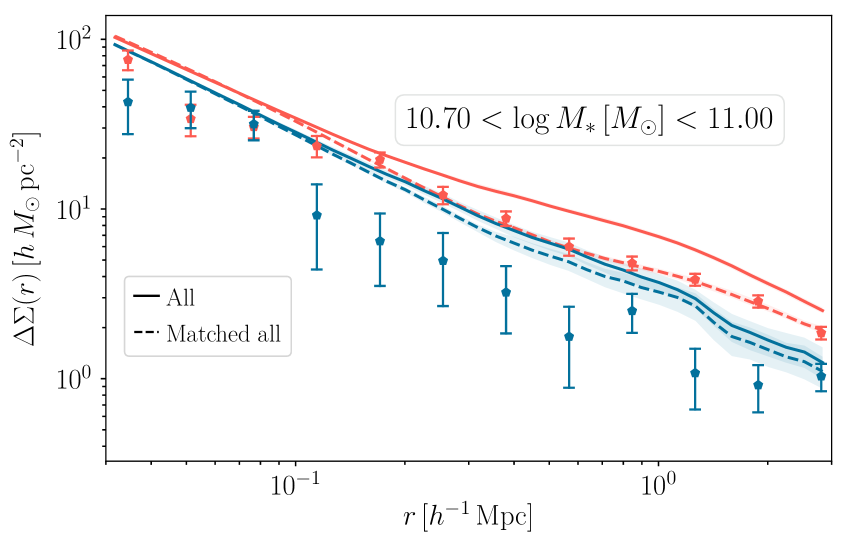
Starting with L-Galaxies, the fiducial SAMs, both the H15 and G11 models, predict an excessive signal around all galaxies for masses approximately ranging from to a factor of two above the data points at (and approximately the same discrepancy at for the two most massive bins for the H15 model) with a median excess exceeding 30 % from the upper quoted observational errors. The H15 predictions also eclipse this 30 % bar for the bin. However, the median excess for the H15 model are within of the upper quoted errors for all mass bins. These profiles are shown in Fig. 4 where we illustrate the fiducial model predictions together with the results for the extreme models. We have also investigated the effect of gradually lowering the AGN feedback efficiency on the produced lensing profiles. At the high mass end, predictions for the model are similar to the results. It is the favoured solution from upwards, and the intermediate models do better for the and mass bins. Decreasing the feedback efficiency lowers the signal step-by-step, except for the least massive bin where there are only small differences between the models, which we could also infer from the convergence of the abundance corrections in Fig. 3. H15 predicts a lower lensing signal than G11 from this mass onward. For the least massive bins, the G11 model yields a smaller signal in the centre, but more pronounced central bumps owing to its high satellite fractions. Such a signal is disfavoured by the observations, leading us to conclude that the H15 model has the best fiducial performance. We have also computed the result for moderate changes in , where simultaneously lowering and and help to mitigate the tension with observations. This model performs well except in the two most massive stellar mass bins, and comes with a smaller discrepancy for the SMF at the high mass end than models with lower only. For small variations in while is fixed, the resulting lensing profiles change only marginally.
Previous studies (e.g. Saghiha et al., 2017) have not recorded a similar tension for the H15 model using stellar mass-only selections. Saghiha et al. (2017) compared the model predictions for , cf. Eq. (4), to CFHTLenS observations, with photometric redshifts for the lenses. They have one mass bin in the regime which is twice as broad as the two bins here with a good agreement between H15 and the data. The reasons causing this conundrum could be multiple; the more precise spectroscopic redshifts for the lenses in the GAMA survey could play a role as well as the width of the mass bins and the background cosmology (Saghiha et al., 2017, assume the fiducial MR WMAP1 cosmology which can decrease the signal by shown in Fig. 5).
In the lowest mass bin we have roughly 1 million galaxies in the fiducial H15 model and its derivatives and million for the G11 model and approximately galaxies in the most massive bin, which means that we are analysing robust statistical averages. For low masses, all models perform approximately equally well, but the more extreme choices with low supernovae and/or low AGN efficiency are able to capture the signal across the whole mass range. As is visible in Fig. 4, we can lower either (or both, not shown) of the AGN or supernovae efficiencies to obtain better agreement with data. These two extremes produce equivalent predictions for , but at lower masses the model suggests a lower lensing signal from outwards for which starts already at the centre for lower mass bins. This difference could be driven by the stronger relative strength of the AGN feedback modification for the SMF and also the higher satellite fraction of the model (by about with respect to the fiducial H15 model). The satellite fraction for this model is higher as the lower SN feedback boosts star formation in centrals and satellites alike, whereas the AGN feedback modification mainly concerns the centrals.
However, these signals feature degenerate effects from the host halo masses and the satellite fractions , which complicates the modelling interpretations. Still, the discrepancies shown are too large to be a product of these factors alone for the SAMs. We have computed the predicted satellite fractions for the different mass bins for all models in our comparison and find that they lie within the allowed range from the lensing observations and trace the GAMA group results well. Intuitively, the satellite fractions are lower for the models with low as satellite galaxies merge faster. Most models trace a degenerate solution close to the fiducial H15 model (which starts at for low mass objects, drops at the knee of the SMF and ends up at at the high mass end) and the G11 model predicts more low mass satellites by about . Although the two extreme feedback models and predict similar lensing signals in Fig. 4, especially at the high mass end, the model predicts more satellites. We shall see in Section 6.5 that this influences the clustering signal at .
In Table 3, we list the SAMs which perform best according to the mean figure-of-merit from all lensing mass bins with and without abundance corrected stellar masses, as well as the worst. We present a full list for the -values of the uncorrected profiles in Table 2. The lensing data favour low AGN feedback, with a preference for the fiducial dynamical friction parameter or large fractions of it. If we perform the same test with post-abundance corrected stellar masses, the fiducial H15 model comes out on top followed by the low SN feedback efficiency models. These models lie in the mid-range of the ranked uncorrected predictions. The corrected H15 profiles lie closer to the data than the corrected and (uncorrected) G11 model predictions, even if there is a very modest preference for the H15 model with G11 parameter values for the uncorrected profiles () with respect to H15 at .
If we account for these abundance corrections, how much are the lensing profiles altered? In Wang et al. (2016), such corrections were able to reconcile the discrepancies for the H15 model for LBG lenses. We investigate if these modifications are potent enough to mitigate the large deviations observed in Fig. 4 for a more general lens sample. Since we do not have a fitting function for the SMF at , we perform the corrections and measurements for the sample and we assume that the GAMA SMF is similar to the SDSS SMF which has been shown to be the case (e.g. Weigel et al., 2016). While the correction for the H15 model serves to mitigate the tension, lowering the signal by for with a slight percentage level boost for the most massive bin, it is not enough to solve it, as is indicated by the relatively high -value.
In addition, we convolve the stellar masses with a Gaussian in with width following H15. We refer to H15 for the motivation of this choice in an observational context. We have performed this comparison at and and note that the effect is slightly more pronounced at the higher redshift due to the redshift dependence of the convolution. We have computed the result for the H15 model and find that the effect is negligible for the low mass signal, but can amount to at the high mass end, peaking at the knee of the SMF. The impact is model specific, with effects for the and derivatives, whereas the result for the G11 model is similar to H15. These errors lower the lensing signal as abundant lower stellar mass galaxies, generally residing in less massive host haloes, are upscattered to a more massive bin. Alone, it is not enough to explain the observed discrepancy. Moreover, the observational error bars should already account for these stellar mass errors, which means that this is a conservative estimate.
6.2.2 Cosmological impact
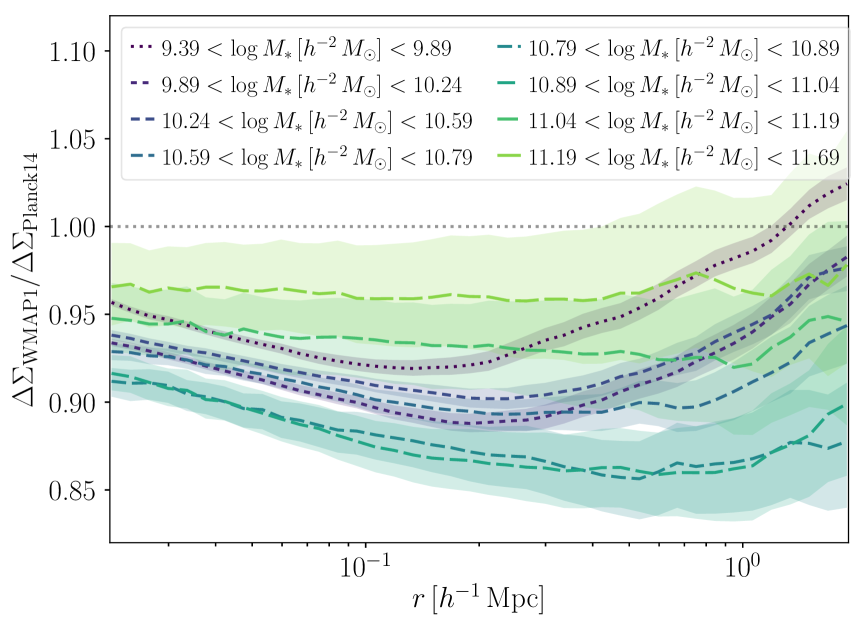
To gauge the impact of a different background cosmology we plot the predictions for H15 model run on top of the unscaled, fiducial MR simulation. We see in Fig. 5 that the predictions are slightly lower by about than for the Planck cosmology but not sufficient to explain the observational difference. This suppression has a flat radial evolution for the highest mass bins which are central-galaxy dominated, whereas there is a radial difference for the satellite population which dominates the lowest mass bins. The largest effect is recorded around the knee of the SMF, which is to be expected since it is most subject to calibration. A fairer comparison from the perspective of the galaxy formation model, would be to retune a few model parameters to account for this change, which leads us to conclude that the results in Fig. 5 are upper conservative estimates of the cosmological impact. In Wang et al. (2016), predictions from the G11 model were compared across three different cosmologies (WMAP1, WMAP7 and Planck 2014) for LBG profiles and the WMAP1 curves were notably higher for the two most massive bins w.r.t. the other cosmologies, which means that one cannot draw a general conclusion on the sign of the impact as a function of background cosmology for all formation models.
6.2.3 TNG and baryonic effects
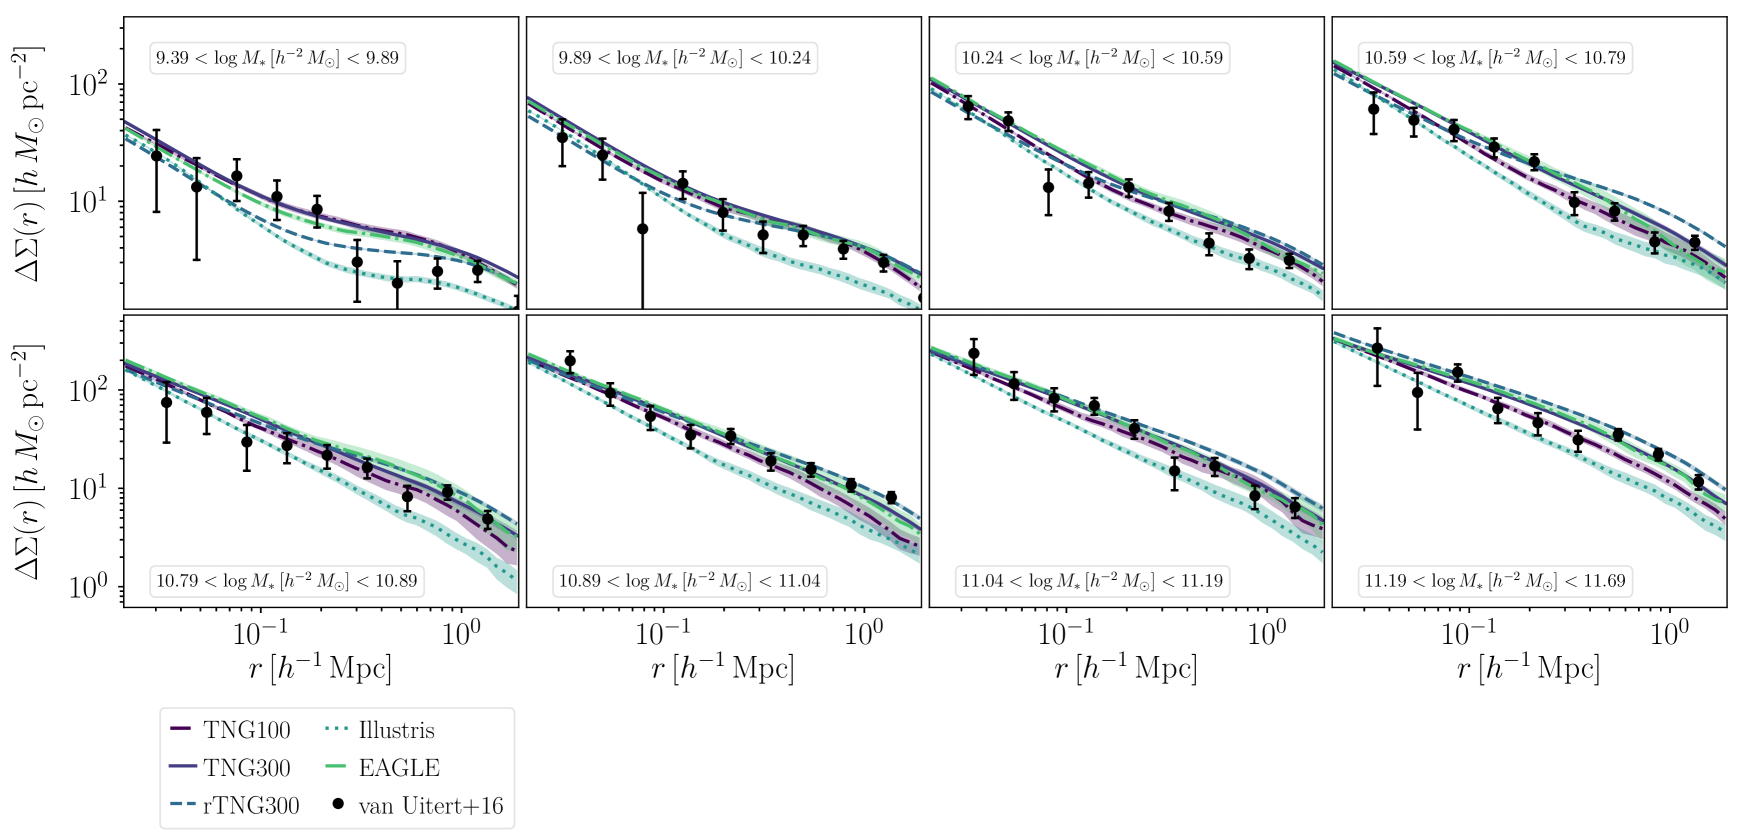
In Fig. 6, we show the predictions from the TNG300 simulation at with respect to the van Uitert et al. (2016) observations. We have also computed the same stellar mass only predictions for some other hydrodynamical simulations, which are shown for comparison. These simulations have already been compared with respect to the power spectrum (Springel et al., 2018; Chisari et al., 2018). TNG100 and EAGLE perform equally well as TNG300 with respect to the data, whereas the Illustris signal is too low. Compared to the two fiducial SAM models, the curves do not persistently lie above the data points, with a similar excellent performance as the model for the most massive stellar mass bins, and the results are overall more consistent across the whole stellar mass range. Even though we obtain deficient statistics at the high mass end beyond , the models, apart from Illustris, agree well with the data. It is interesting and a milestone that EAGLE and IllustrisTNG produce very similar lensing predictions, despite the different physical prescriptions used, and that they also agree with observations. However, this very nice agreement, as we shall see in Section 6.3, does not guarantee conforming results for the colour-separated signal for TNG300 and TNG100 with respect to SDSS-DR7. If we turn to the -values, again using Eq. (10), we find that the data mildly prefer TNG100 () and TNG300 () over EAGLE (), with values comparable to the low-feedback SAM variations. The resolution corrected TNG300, rTNG300 with 30 pkpc masses, fares slightly worse () and Illustris () is the worst hydrodynamical model, but still better than the H15 model at .
We can compare the TNG100 and TNG300 signals to get a handle on how the simulation volume affects the signal. In the centres, TNG300 is boosted by about 0-10 % where the increase is largest for the least massive bins compared to TNG100; and this increase can amount to for . Also this increase is tightly connected to the chosen stellar masses, with the largest effects for the bin. For the least massive bin with there is a very slight suppression for TNG300 with respect to TNG100 for scales . We also show results for the resolution corrected stellar masses, rTNG300, but with a 30 pkpc mass aperture. Its signals are similar to TNG300 with bound masses, but there is a suppression in the centres by about for the two least massive bins followed by a continuum upwards towards a slight boost for the two most massive bins with a few percent. At scales , rTNG300 lies around 25-30 % above TNG300 for . Still, part of this increase should be attributed to the different mass definitions. We have computed this effect for TNG100, and there the 30 pkpc signal is boosted with respect to the bound mass signal with more than 50 % for the most massive bin and around 30-40 % for (the effect is smaller for the less massive bins). Hence, there is considerable flexibility in the predicted signal depending on the stellar mass definition, but the variations are allowed within the current data error bars.
The resolution corrected rTNG300 satellite fractions are excessive around the knee of the SMF compared to TNG300 and TNG100, and the different SAMs ( with respect to for the other models). This issue and proposed corrections have been covered by Engler et al. (2020). For TNG300, the satellite fractions trace the TNG100 solution.
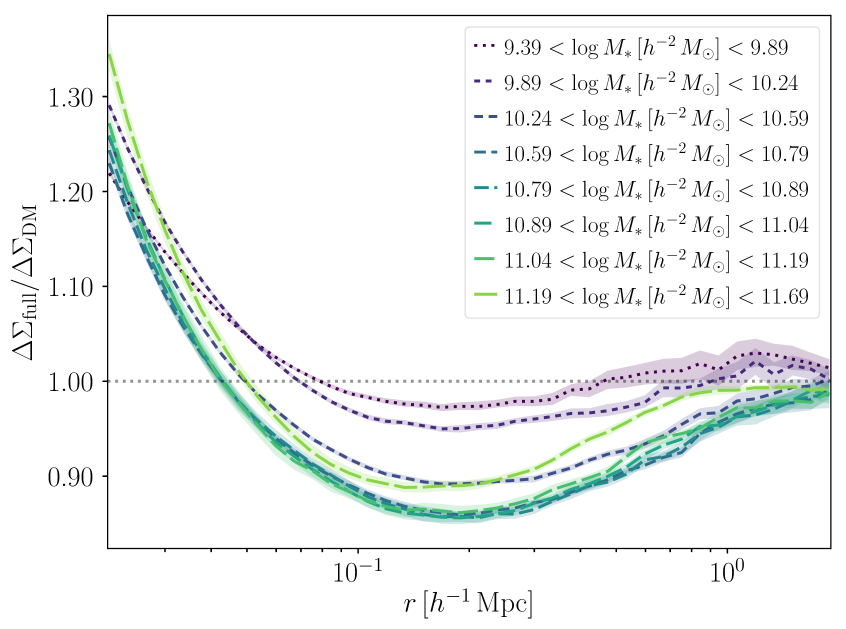
By matching subhaloes in the baryonic runs with their dark matter-only counterparts through their particle IDs using the publicly available catalogues (see Nelson et al., 2015, 2019), we can obtain an estimate of the impact of baryonic feedback processes on the profiles. This works particularly well for central galaxies and we will use this matched central galaxy signal to estimate the baryonic deformation of the profiles using the TNG300 simulation. We discuss the issues with matching satellite galaxies in Section 6.6. The result for the central galaxies satisfying the stellar mass criteria of van Uitert et al. (2016) is given in Fig. 7. As already found in the literature (e.g. Schaller et al., 2015; Leauthaud et al., 2017; Lange et al., 2019), the baryons enhance the profiles close to the central galaxy due to the presence of additional cooling from the stellar component and the associated adiabatic contraction of the dark matter, induce a suppression of the profiles from to which then converge (at where ) at larger scales since the same projected mass is contained inside the aperture. This is what we observe in Fig. 7 (left) where the suppression increases with increasing stellar mass until and is self-similar for the four subsequent mass bins with deviations for the most massive bin. Note that the satellite fraction is high for the lower stellar mass bins which means that the baryonic effect measured here is not a good proxy for the observational signal. The maximum suppression amounts to attained at and the central enhancement is roughly for the scales probed here, depending on the stellar mass and radial bin. Except for the two least massive bins, a good convergence is reached at with the dark matter-only run. We note that the maximum suppression at intermediate radial scales is reached for the two stellar mass bins, and that the signal gradually rises for the most massive bins. This is expected as the mean host halo mass increases and the deep gravitational potential wells of clusters are efficient at holding material, even in the presence of AGN feedback.
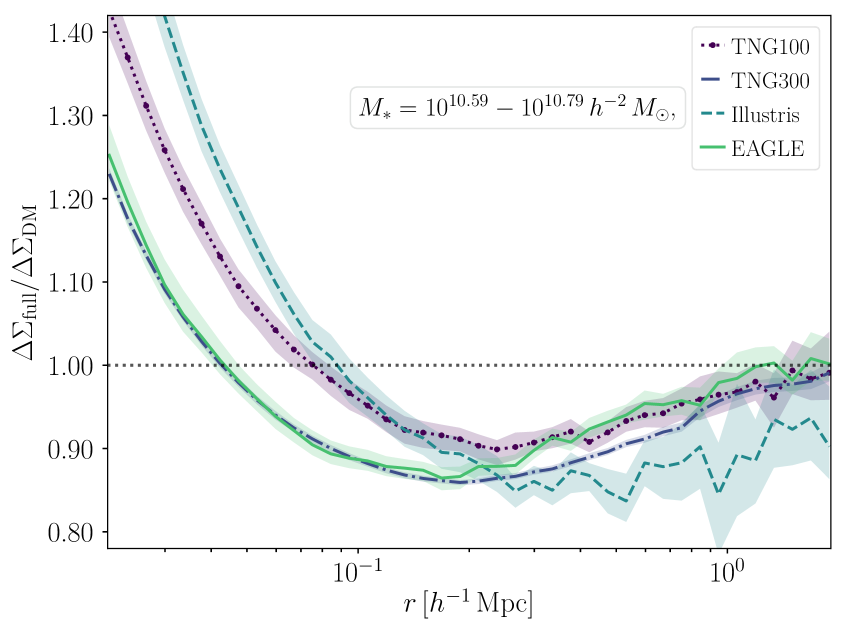
We also note that the baryonic imprint does not necessarily have to be the same as in TNG300 for the physical recipes used in the SAMs. Thus we also perform a comparison between Illustris, EAGLE and TNG300, as well as the smaller TNG100, with their gravity-only companion simulations across the different stellar mass bins. Here we also use the bound stellar masses (we have verified that the results hold for the 30 pkpc masses as well), restrict ourselves once more to central galaxies and present a representative mass bin in Fig. 7 (right). We expect that the small redshift difference () between the EAGLE and the other simulation snapshots has a negligible impact on the results. The same deformation trends already observed in the left figure hold for all mass bins except for the least massive one, where the stellar term differs by for the different models (with Illustris up from the TNG300 values in the left figure of Fig. 7, TNG100 agreeing with TNG300 and EAGLE down). In addition, the deformation in the EAGLE simulation crosses one at , earlier than for the other simulations. This could be attributed to differences in the SN feedback implementation for low-mass centrals, but as the satellite fractions are for this low-mass sample, it is not clear how this would contribute to the joint total signal, and we do not have a representative group lens sample for such objects.
For the representative mass bin, EAGLE and TNG300 produce similar signals. The results from these two simulations are more similar than those from TNG100 and TNG300. Potentially the similar effective resolution could play a role, but it could also be incidental. This model conformance holds for , with more scatter from for EAGLE with less deformation than TNG300 from 666There is a marginal shift between the two models for the second most massive bin, but they still agree within error bars.. We also note that there are differences between TNG100 and TNG300, except for the least massive bin where they are in agreement. We have checked that this is independent of the resolution-correction (although this alters the TNG300 results slightly for the least massive and the two most massive bins), and is likely a consequence of the larger volume of the TNG300 simulation, with more massive host haloes present. Apart from differences in the stellar term, the biggest impact on scales where the lensing signal is usually measured is that the deformation in TNG300 amounts to , whereas it is for TNG100. Convergence between the two models is typically attained at , with some scatter for TNG100. Hence, for future comparisons and calibrations of SAMs to account for baryons one must carefully take into account volume differences. One positive note is that the outer deformation convergence radius for TNG300 and TNG100, as well as EAGLE, is roughly the same across the different mass bins at , which bodes well for cosmological analyses, whereas the convergence radii for Illustris extends to , reflecting its stronger AGN feedback; and the deformation stays at till . In Section 6.6, we show that this model does not produce good central lensing signals for galaxy groups. This model has the largest contribution from the stellar term across all mass bins covered here, followed by TNG100. Compared to TNG300, where the crossing from positive to negative deformation is more mass-dependent, the Illustris signal makes the crossing at roughly for bins with , and thereafter it gradually decreases to for the most massive bin. Regarding TNG100, its stellar term lies between Illustris and TNG300 for all mass bins.
We note that the baryonic effects are smaller than the measured deviations for the two fiducial SAMs with respect to the data, in e.g. Fig. 4, implying that a better assignment scheme between galaxies and subhaloes is required and their parameters have to be re-tuned for better lensing agreement.
6.3 SDSS lensing with colour split
In this Section we show a few comparisons between the lensing signal separated according to colour and corresponding observations from SDSS-DR7, with the Zu & Mandelbaum (2016) selections imposed, and compare the SAMs, TNG300 and TNG100 to the quoted integrated, empirical HOD predictions from that publication. We also attempt to fit the total signal from all main SDSS-DR7 galaxies from Mandelbaum et al. (2016). As implied by the small difference in the colour cuts and the volume-selection arguments brought forth in Section 5.2, there are only minor differences between these observations and those of Zu & Mandelbaum (2016); and these have a simpler selection function. We have verified that these datasets produce consistent lensing profiles for the overlapping stellar mass range. These are the hardest datasets which we consider in this Paper; since the models both have to account for potential differences in the satellite fractions as well as the colour distribution, including dust modelling, of the observed samples.
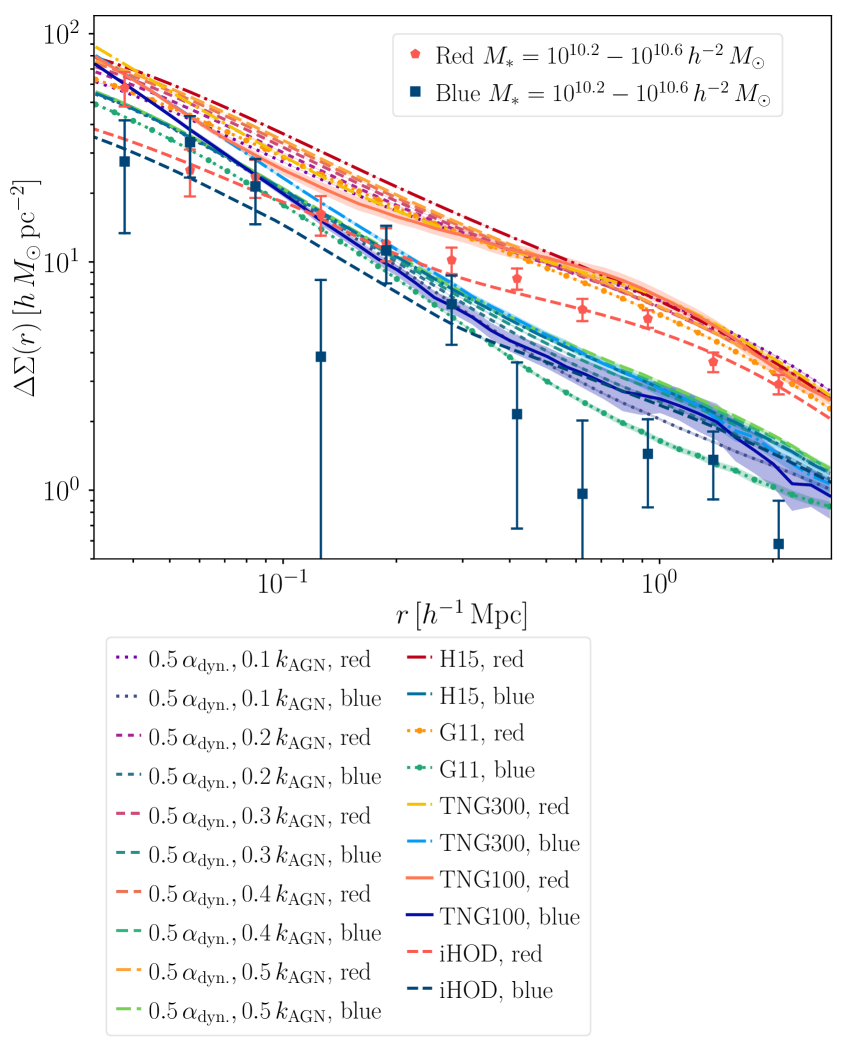
For low mass galaxies with , the SAMs perform on par with the iHODs (and TNG100 and TNG300 for blue galaxies and in the centres below for red galaxies), although there is considerable scatter in the data. Especially the two fiducial SAMs, G11 and H15 do well in this mass range for red galaxies (the constraints on the blue lensing signals are weaker due to scatter in the data; most models are in agreement), as well as and . The predictions from TNG300 are elevated with respect to the data with at most a factor of two (for the lowest mass bin) and typically around 50 % for , but better agreement is reached in the central region. This could possibly be amended with an improved colour assignment scheme, as the model underpredicts the red fractions w.r.t. SDSS (35 % and 50 % compared to 44 % and 59 % in the data, respectively), and the blue lensing signal is typically lower. This is in line with the underpredicted quenched fraction of satellite galaxies in low mass host haloes for TNG300 with respect to SDSS (Donnari et al., 2020). This problem persists in TNG100 where the model was run at target resolution; the model is for instance 75 % above the red lensing data ( above the upper error bar) at for the mass bin whereas TNG300 is 42 % above ( above the upper error bar). Weakening the AGN feedback has the net effect for models with of increasing the amplitude of the central bump on scales for the SAM derivatives, which means that the red lensing signal can be used to constrain this combination, although it is sensitive to the colour assignment scheme and dust model.
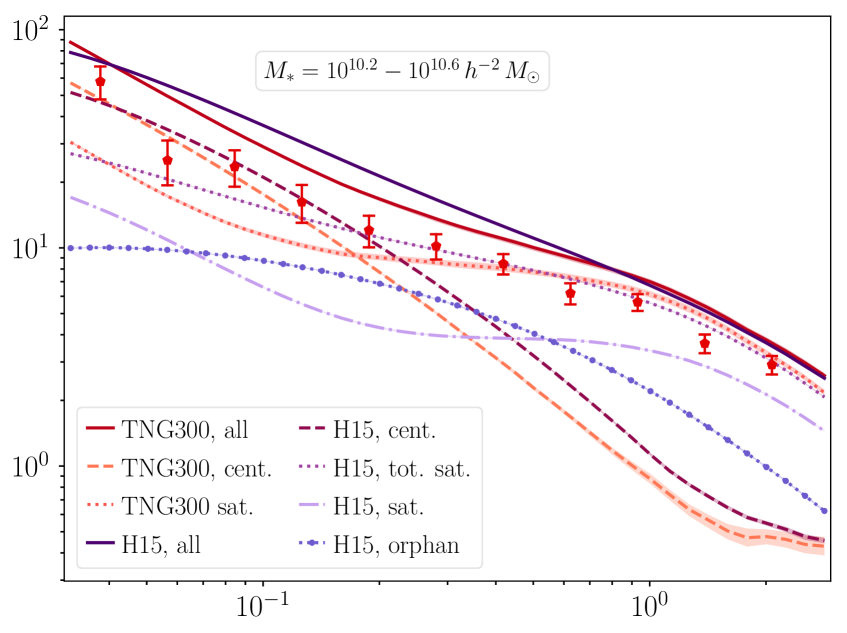
Analysing the higher mass bins, we find that the SAMs and TNG300, as well as TNG100, systematically overpredict the red lensing signal for , see example bins in Figs. 8, 9 and 10. For more massive bins, the weak feedback models and TNG300 are once again in agreement with observations, reflecting the results in Section 6.2. The results from TNG100 and TNG300 are similar across this stellar mass range, but the TNG100 profiles lie marginally below the data for for the red mass bin; and marginally below the TNG300 profiles for the two most massive bins. Hence, we restrict parts of the analysis to TNG300 because of its greater volume. This red lensing signal tension exists for all SAMs, and none of the model variations listed in Table 2 produce acceptable solutions for this intermediate mass range, with the G11 model performing the best. We also have issues with matching the blue lensing signals for in TNG300, but achieve acceptable results for some SAMs, such as the G11 model. The error bars are larger for the blue data than for the red, allowing for more model variation, and at the high mass end the analysis is obstructed by poor statistics. Hence, we primarily focus on the red signal. This red lensing signal mismatch can be caused by problems matching the stellar masses in SDSS and enforcing the proper colour separation, as we compare to Fig. 4 for the stellar mass-only sample from van Uitert et al. (2016) where both the and the models are able to match the lensing signal at the high mass end; and where all hydrodynamical simulations, except for Illustris, agree with the observations across the whole mass range (Fig. 6). With respect to the quoted satellite fractions for the samples listed in Zu & Mandelbaum (2015), the two fiducial SAMs are only a few percent off777For the bin, the quoted , and we measure and for the G11 and H15 models. The reported average host halo mass is and we find and , respectively. In Zu & Mandelbaum (2016), a red fraction for this mass bin is given, whereas we find and . Hence, we have more red galaxies, but for the H15 model the difference should be negligible.. In addition, the average host halo masses only differ by about 0.1 dex. These differences are too small to drive the large biases we observe. Although we have no information on the satellite fractions from the observations separated according to colour, we can perform the signal decomposition in our models. This is shown in Fig. 9 for the red lensing signal compared to Zu & Mandelbaum (2016) data for TNG300 and the H15 model. Both models suggest similar satellite fractions ( for TNG300 and , with an orphan fraction for H15). In the outer region at , the satellite lensing signal constitute the bulk of the total signal and is similar between the two models (the predicted share is even larger for lower mass bins in this regime). If it is decreased a better agreement with the observations could be reached, assuming the model satellite fractions reflect the observations. More centrally at , a combination of lowering the host halo masses for the satellites and lowering the central host halo masses could yield a better match.
We have computed estimates for how much the dust extinction affects the signal amplitude for the two fiducial SAMs for the Zu & Mandelbaum (2016) selection function. At the high mass end for for the G11 model there are only small differences for the red signal with and without dust whereas the dusty red signal is suppressed for all masses for H15 with at most for the mass bin, closely followed by the effects for the mass bin. Not surprisingly, the dust correction thus works in the opposite direction to reconcile the tension for the red lensing signal. For the blue signal, the dust extinction boosts the predictions by about a factor of 2 and 1.5 for the most massive bins where there are many red galaxies and few blue, with smaller effects for lower masses. For low mass systems below in the H15 model, there is a suppression for the central bump by about in the dust extinct signal. We attribute this effect to dusty blue galaxies residing in less massive haloes, which are able to keep more dust than their massive counterparts (e.g. Bekki, 2013; Popping et al., 2017), and thus a lower central signal.
We have also performed a crude comparison between the van Uitert et al. (2016) dataset and the Zu & Mandelbaum (2016) dataset using their quoted red fractions and they agree very well in the overlapping mass range, except possibly for the mass bin where the Zu & Mandelbaum (2016) data points lie higher by approximately a factor of two for , suggesting that the local lensing signal is fairly constant.
We have compared the stellar mass-only lensing predictions from TNG300 at and to see if we could gain some insights. The signal is boosted with respect to the signal, but the boost is not universally radially. We compared the boosts at and at , and while the central boosts lie around , the outer boost lies at around for (for the lowest mass bin, the signal increases by in the outer range). For , the boost is more universal across the whole radial range () at . As the outer boost is measured in the regime where the central host halo contribution term appears for the satellite lensing signal, the model might overestimate the evolution of this term which does not appear to evolve in the data. A redshift boost in general seems to be disfavoured by the data, except for the least massive bin, where TNG300 predicts a similar evolution as hinted at in our crude data comparison. If we decompose the signal into central and satellite contributions (and assume that the satellite fractions agree with the data sample), we see that the satellite signal evolves towards and dominates the total signal in this radial range .
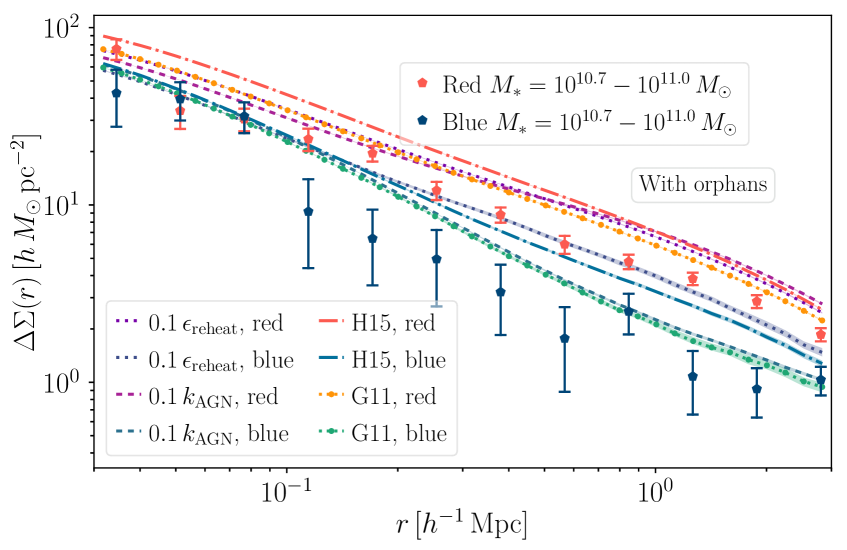
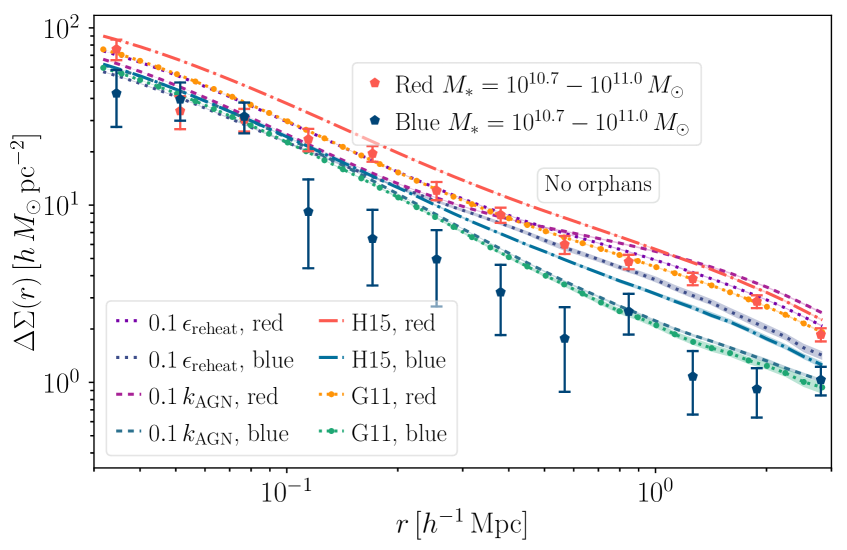
A connected interesting observation is shown in Fig. 10 where we plot the predicted signals from the SAMs and TNG300 with and without orphan galaxies and with and without unmatched subhaloes, respectively, with respect to lensing observations from the all main SDSS-DR7 sample (Mandelbaum et al., 2016). By removing the orphan galaxies in the SAMs, the tension for the red galaxies is reduced and the corresponding satellite fraction drops by about . If we just examine the orphan galaxy signal, see Fig. 9, we find that it is similar to a massive central term as the orphans reside close to the halo centres. At lower masses the large abundance of low mass haloes hosting central galaxies offsets the imprint of this signal and gives agreement with observations. We find a corresponding effect for TNG300 for the same observations when we remove all subhaloes which lack a match in the gravity-only run and compare the lensing signal to the full physics predictions. If we restrict ourselves to matched substructures, much better agreement with data is obtained. We note that the satellite fractions are comparable for the red and blue signals, implying that the colour of a satellite galaxy is not a good predictor for the likelihood of its host substructure to still be present in the gravity-only run. Restricting the signal to matched substructures has thus the effect of reducing the satellite fraction by a similar amount for the blue and the red signal, although the impact on the red lensing signal is more considerable as the amplitude of the central host halo term drops for the satellite signal. This can be caused by substructures merging and getting disrupted more quickly in more massive host haloes, where galaxies on average are redder and objects are excluded to a higher degree by the matching criterion. If we look at more massive red galaxies, TNG300 is in agreement with observations for , also for scales around . For these masses the signal is dominated by centrals, which are well-matched as we shall see in the following Section.
Our tentative conclusion is that galaxy formation recipes, both SAMs and hydrodynamical simulations, which preferentially place quenched, red satellites galaxies in massive host haloes have to be redefined such that the lensing signals are matched. For TNG300, this seems to work fine at , but the model suggests a redshift evolution which does not seem to appear in the data. This better matching could be achieved by, for instance, strengthening the gas stripping of satellites in group-scale haloes. Hence empirical models such as HODs still outperform physical modelling for this type of observational dataset.
6.4 Lensing of locally brightest galaxies
By limiting our selection to LBGs, which by construction are mostly central galaxies, the predicted lensing signals drop and are more compatible with the data for all models, both for the SAMs and TNG300. This has been established in previous studies (see e.g. Wang et al., 2016; Mandelbaum et al., 2016). Hydrodynamical simulations have not been compared to this type of data, and we are interested to see if the SAM variations which were preferred by the stellar mass-only lensing KiDS+GAMA observations in Section 6.2.1 also perform well against these datasets. Here we first study the predictions regardless of galaxy colour and then split the signals into red and blue, starting with the SAMs and then proceeding to the TNG300 results.
6.4.1 LBG lensing for the SAMs
| LBG (fiducial) | All | Red | Blue | |||
|---|---|---|---|---|---|---|
| First | 1.59 | 1.12 | 1.67 | |||
| Second | 1.67 | 1.23 | 1.76 | |||
| Third | 1.67 | 1.23 | 1.76 | |||
| LBG (abundance) | All | Red | Blue | |||
| First | H15 | 2.89 | 2.16 | 1.75 | ||
| Second | 3.40 | H15 | 2.36 | 1.87 | ||
| Third | 3.63 | 2.36 | H15 | 1.90 |
In Figs. 11 and 12, we show the SAM LBG lensing results from an assorted model collection with stellar mass and stellar mass + colour selection functions, respectively. In the first three figures in Fig. 11, we show how different model variations affect the signal for one mass bin with and in the last, the predictions from our best fit model across all mass bins. Number-wise, we have roughly galaxies in the least massive bin per axis for the SAMs run on the rescaled MR and systems in TNG300 for the stellar mass only selection. We stress that the drop in the signal for the lowest mass bins around is a consequence of the LBG selection function. This is less of a problem for the SAMs run on the rescaled MR simulation due to the improved statistical averages. We find that the predictions from the H15 model tend to agree better with observations than the G11 curves, especially for , as seen in Fig. 11. We are able to reproduce the results in Wang et al. (2016) by running the H15 model with the G11 parameter inputs, which features a couple of improvements from the fiducial version published in G11. This hybrid-model finishes on tenth place for the LBG lensing (), whereas the G11 model () and the H15 model () do considerably worse.
For intermediate stellar masses, fixing and varying has little to no effect on the profiles except for the transition regime between the 1-halo and 2-halo terms at where a weaker yields a lower signal. Still, the variance of the observations is quite large for these scales for low stellar masses. If we move to higher stellar masses beyond the knee, the different feedback prescriptions start to have an effect, see Fig. 11. We have excluded that this result is contaminated by the presence of satellites and orphan galaxies in the sample, owing to the high central purity of the signals ( depending on the stellar mass bin and the examined model, lowest at , and similarly for TNG300 with the lowest purity at at approximately the same mass).
For the stellar mass only selection, setting and solves the tension for group scale lenses, although the produced signals are too low for systems – see the upper right subfigure of Fig. 11. For intermediate and high masses, simultaneously reducing and improves the agreement as seen in the lower left figure, although there is still tension for LBGs with . Hence, this model class is disfavoured by these lensing observations as we use all stellar mass bins to construct our model ranking.
In Table 4, we list the best ranked models for the LBG sample with and without abundance matching stellar mass corrections. Similarly as for the stellar mass-only sample, the lensing data prefer a low AGN feedback efficiency, although here the intermediate model is the best. We infer that this shift is caused by the investigation of the signals from central-dominated samples, where the model produces fewer galaxies, but they are also more isolated due to the shorter merger timescale. At second place, we find the model, which also has more isolated centrals due to the low . The signals for these two models are slightly elevated with respect to the data beyond for the stellar mass only selection. For the van Uitert et al. (2016) comparison these two models are thus only ranked seven and six, respectively. The results after the abundance correction are similar to the stellar mass-only lensing comparison with the fiducial H15 model with the best performance followed by the low SN feedback efficiencies. We show the results for the best model in the lower right figure in Fig. 11.
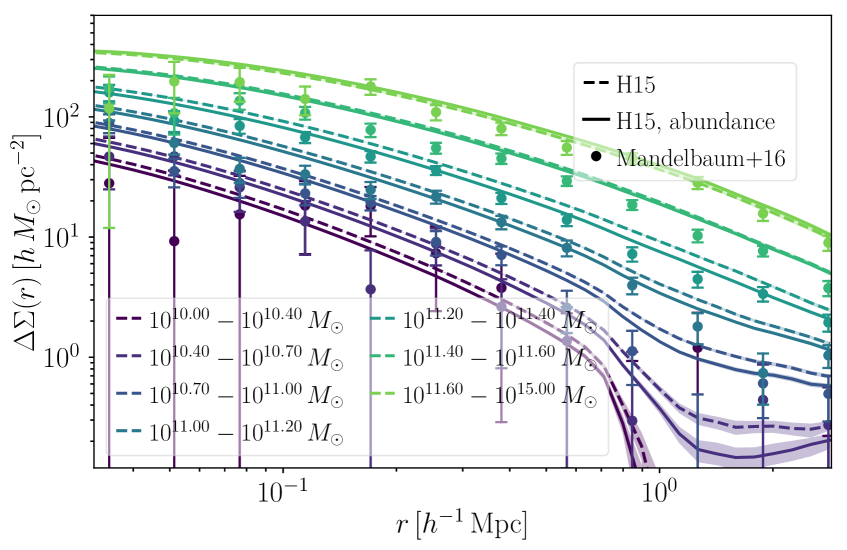
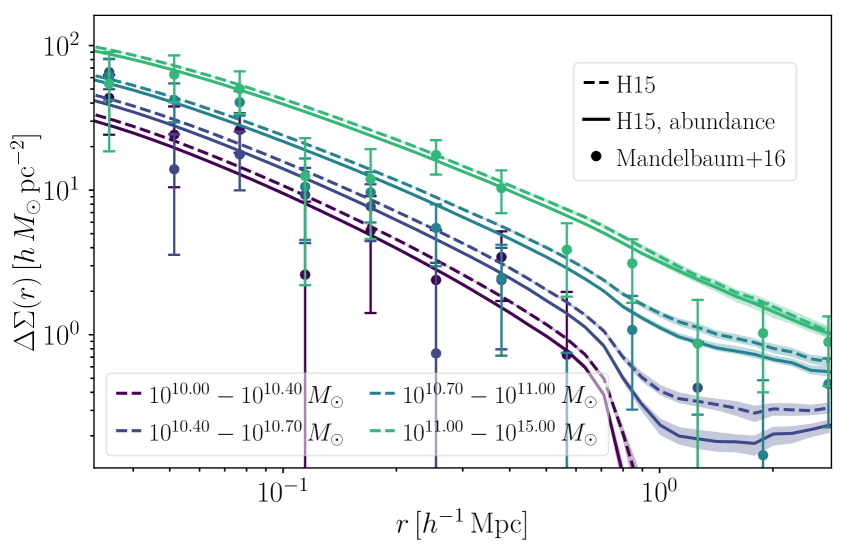
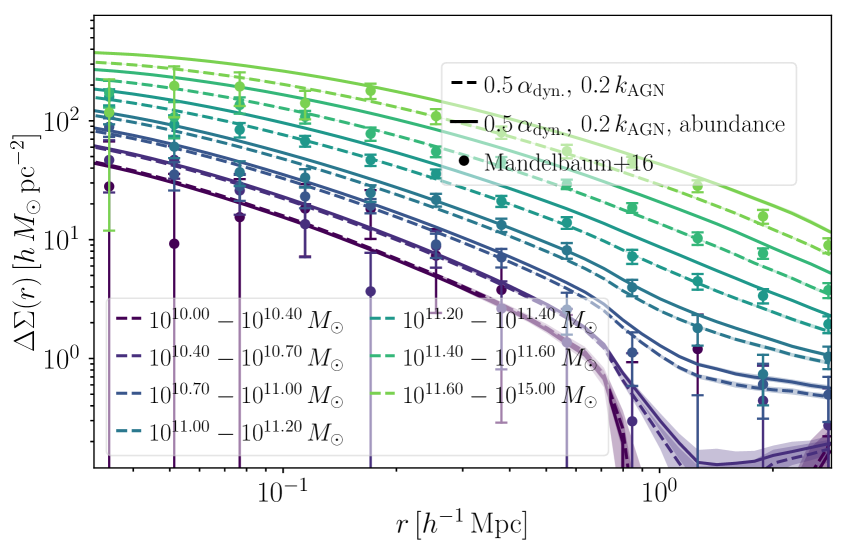
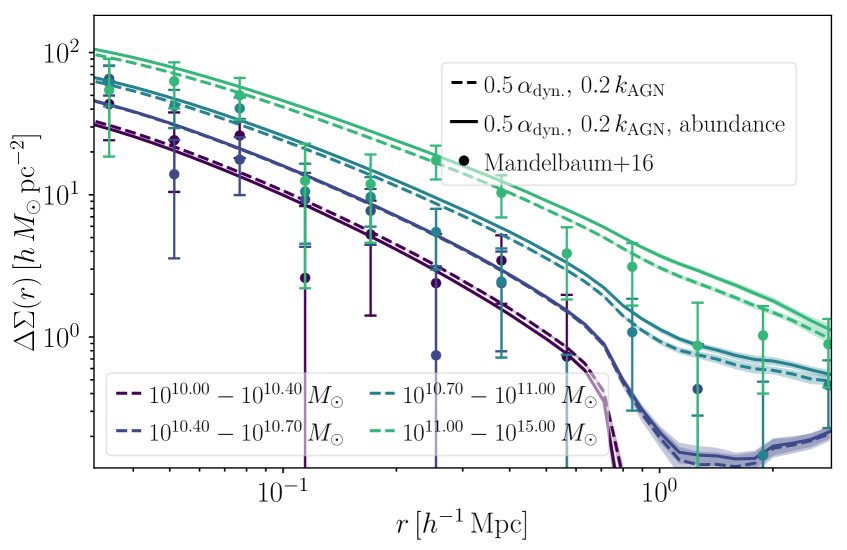
Separating the signal into red and blue according to Eq. (12) for the Mandelbaum et al. (2016) dataset comparison, the and solutions are again ruled out by the red signal from systems with for . We observe that weakening the AGN feedback efficiency reduces the host halo bimodality. In addition, we note that the H15 model (upper row in Fig. 12) in general predicts a stronger bimodality than the G11 model, and that the former is not plagued by a tension with data for the blue LBG lensing signal at the high mass end which was shown in Mandelbaum et al. (2016). This holds true for the red signal but to a smaller extent. Similarly as for the total signal, the model does an excellent job where the results are shown in the lower row of Fig. 12. The fiducial H15 model has (red LBGs) and (blue LBGs), which is worse than the G11 parameter values on top of this model which produces and , respectively.
Also in Table 4 we list the best fit models for red and blue LBGs with and without abundance corrected masses. Compared to the stellar mass only selection, the model now performs best, followed by the model. For the total LBG signal, this model finishes in fourth place (with ), so there is reasonable concordance. If we switch to the blue signal, we see a shift in preference towards models with short and weak , with the biggest gains on scales and outwards for stellar masses w.r.t. the model, which is the sixth best with . Still, the uncertainties in this signal region are quite large, and there are only a few blue LBGs in this mass range, meaning that we have more confidence in the red signal. If we consider the model predictions without dust extinction, the two colours do not agree on a single model, but we note that the case fits best for red LBG lensing and also red clustering , respectively. This model is still the best red LBG model if we account for abundance corrections to the masses (.
6.4.2 LBG lensing for TNG300
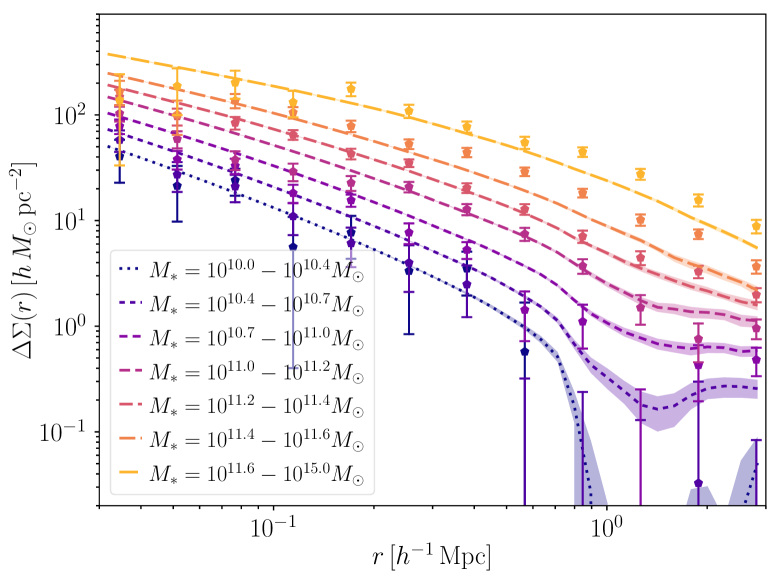
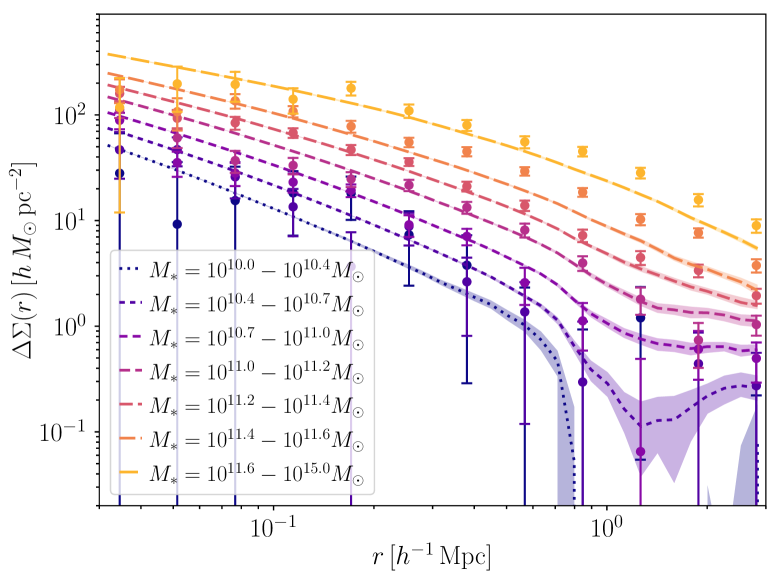
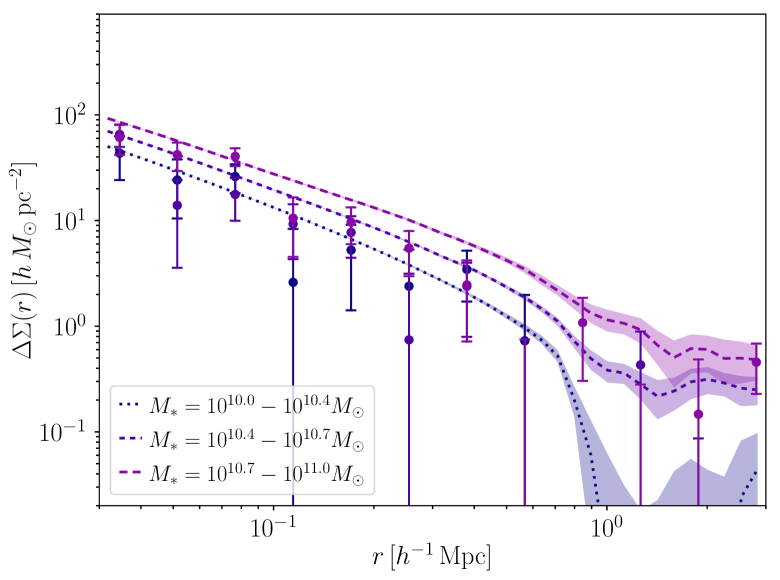
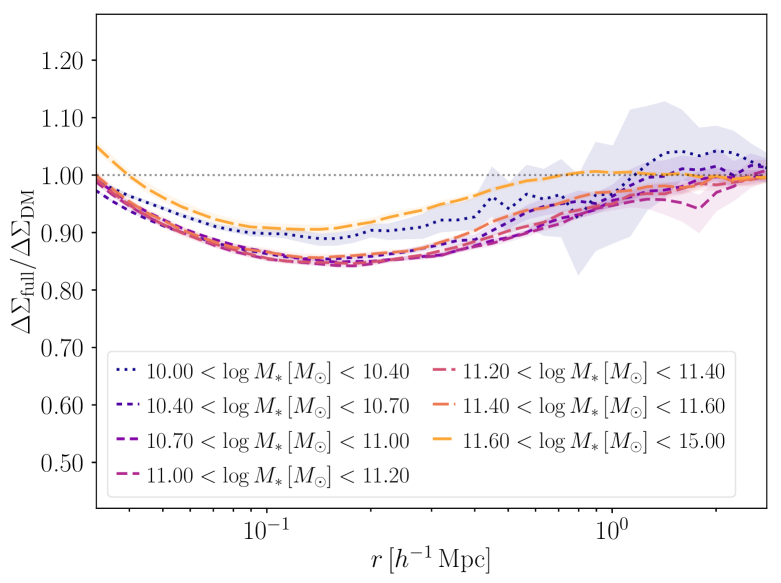
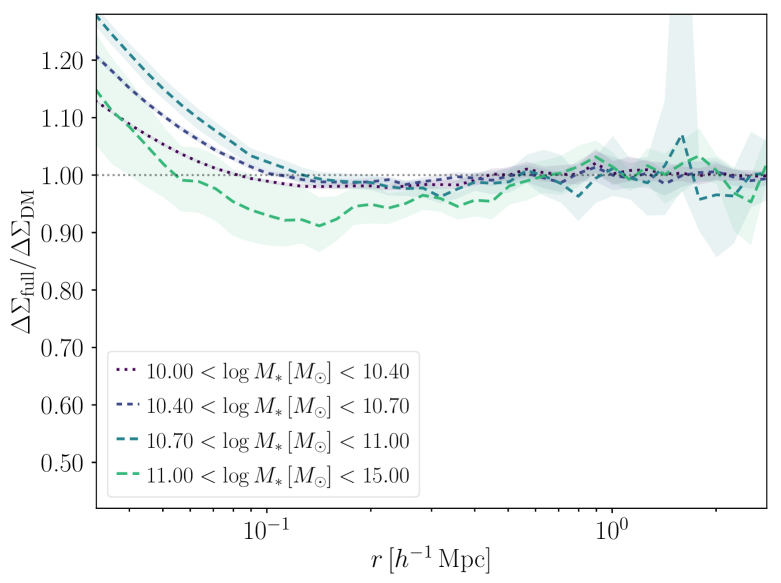
Moving on to the hydrodynamical predictions, we show in Figs. 13 and 14 the LBG lensing predictions for all, red and blue LBGs from TNG300. We have also conducted the analysis with corrected rTNG300 stellar masses and this mass choice introduces a drop in the signal from the least massive bins and increases the most massive signals from the fiducial bound mass predictions, but those predictions as well as those of TNG300 are in agreement with observations. We see that this statement also applies for red and blue LBGs in Fig. 14, where we do not plot the most massive blue signal due to poor statistics. If we compute the corresponding -values, TNG300 yields for all LBGs, for red and for blue LBGs (which is reduced to if we omit the mass bin where TNG300 predicts LBGs compared to a couple of thousands in the H15 SAM). This means that TNG300 performs slightly better than the H15 SAM for the total and red LBG signals, but worse for the blue LBG signal.
The effect of baryons is mostly noticeable in the innermost bin due to the presence of the stellar term, which produces an excessive signal for the two most massive bins for the total and red LBG signal compared to the SAMs, but otherwise the result conforms well with what we have previously shown. With respect to our best fit LBG SAM which slightly underpredicts the most massive red LBG lensing signal, it is moderately increased for TNG300 as seen in Fig. 13 and the upper left figure in Fig. 14.
In the lower row of Fig. 14, we restrict the comparisons to centrals and show the baryonic imprint for the two samples. We discover that the suppression for red centrals is larger than for blue centrals, which have more pronounced stellar terms. By fitting NFW profiles (Navarro et al., 1996, 1997) to the lensing signal (Wright & Brainerd, 2000) for for centrals in the mass bin, we are able to translate this difference into a bias in the observed host halo bimodality. Using observationally motivated weights and assuming a lens redshift of , we find the best-fit parameter values in Table 5. Baryons cause a shift of almost dex in the best fit host halo mass for the red sample, and while we still observe a host halo bimodality with red galaxies residing in more massive haloes by a factor of , it is reduced by from the gravity-only run where the red-to-blue mass ratio is . For the fitted masses for red galaxies, the suppression is for , after which the effect decreases. Baryonic effects also influence the measured concentrations , with a shift of for red systems with , whereas there are only small differences for blue galaxies. In Table 5, the host haloes for the blue galaxies are less concentrated in the gravity-only run, but they are more concentrated for all other mass bins, so we consider this a coincidence. The observed decrease in concentration in the full physics run conforms to previous findings in the literature for 3D density profiles (e.g. Duffy et al., 2010; Mummery et al., 2017). For this mass range, red central galaxies in the baryonic run reside in less concentrated host haloes in the full physics run than blue galaxies, but these correspond to more concentrated haloes in the gravity-only run. It is well-known that concentration correlates with formation time (e.g. Navarro et al., 1997; Gao & White, 2007), with older haloes on average being more concentrated which would host older galaxies which on average are redder. However, in the full physics run, feedback processes, whose effects appear to be irreversible (e.g. Zhu et al., 2017), have had more time to change the appearance of these older haloes, thus lowering their concentrations with respect to the subhaloes hosting younger blue systems.
Here, we have applied the dust model from Nelson et al. (2018) to the colours, but we have also checked that these results hold without dust, as well as apply to rTNG300. We have performed the same analysis in TNG100 for matched centrals and note comparable results, but with more scatter, with the largest suppression for red galaxies at for . We note the same trend with () shallower deformations in TNG100 than in TNG300 for red galaxies, whereas any difference for blue galaxies is hard to notice except for .
| Fitted parameter | Full physics | Gravity-only |
|---|---|---|
| (red) | 12.42 | 12.50 |
| (blue) | 12.30 | 12.31 |
| Concentration (red) | 5.67 | 6.70 |
| Concentration (blue) | 6.02 | 5.74 |
We thus conclude that the TNG suite is equally good as SAMs at producing predictions for LBGs. That there is only a significant disagreement between the two modelling frameworks for the innermost radial bin is very promising for the interpretation of observational LBG data with SAMs; i.e. that baryonic effects can mostly be ignored when determining host halo masses from lensing, as these small scales can be excluded or down-weighted.
6.5 Clustering
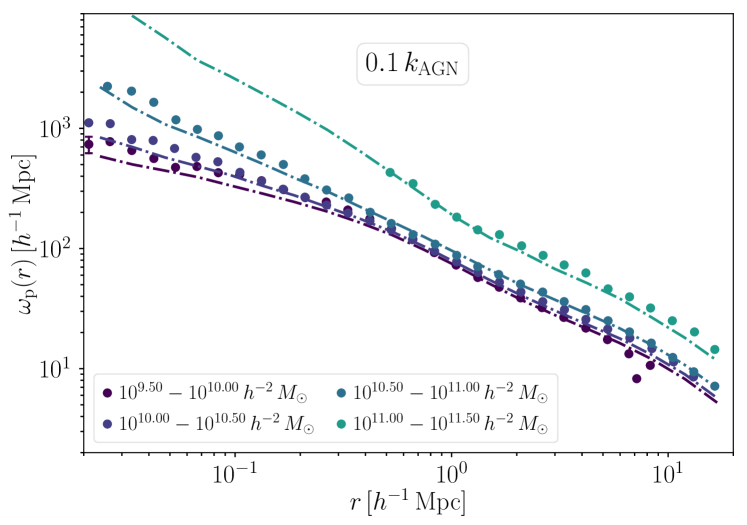
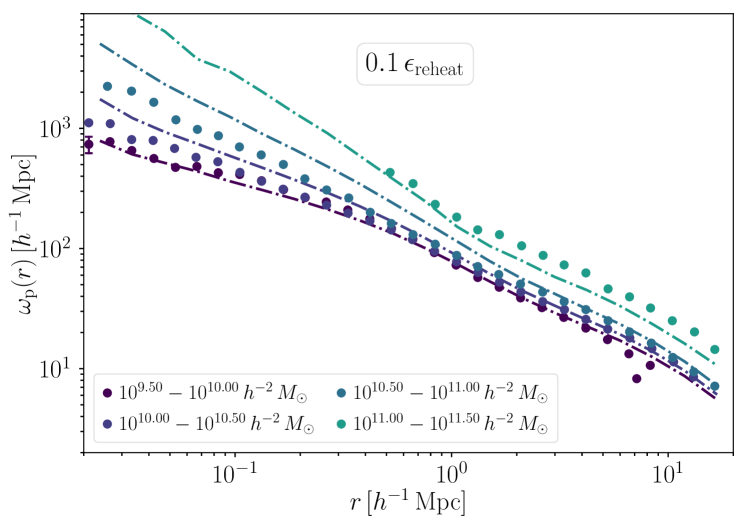
| Clustering (fiducial) | All | Red | Blue | |||
|---|---|---|---|---|---|---|
| First | 0.72 | 4.05 | 2.61 | |||
| Second | 0.94 | 4.36 | 2.94 | |||
| Third | 0.98 | 4.89 | 3.05 |
In this Section, we compare the clustering predictions from the different L-Galaxies variations and TNG300, with and without resolution correction to the stellar masses. Here, we do not change the stellar masses of the SAMs to match abundances but only focus on the baseline model predictions.
For the stellar mass-only clustering, we determine the best fit models through Eq. (10) by the mean values for all four clustering bins with the results given in Table 6. We find that both 2-pt statistics point towards a consistent picture with the lowest, best fit values reached for the weak AGN feedback models. In Table 6 we see that the best agreement is reached for the model, plotted in Fig. 15, which also gave the best stellar mass-only lensing predictions in Table 3 and that the is number two, which was the best for LBG stellar mass-only lensing in Table 4. The latter model predictions are very similar to the former and thus we refrain from showing them. In the case of lensing, it was not apparent at the high mass end whether the weak AGN feedback models or the weak SN feedback models were to be preferred, but if we compare the results in Fig. 15, we recognise that the model is disfavoured () by the massive clustering signals. Moderately weaker values, such as the model, are also marginally less preferred by the data ().
We compare the projected red and blue clustering signal to SDSS DR7 data from Zu & Mandelbaum (2016). In Table 6 we list the best models for red and blue clustering. If we compare the two, both prefer weaker AGN feedback. Our best model for the LBG lensing finishes in fourth place for the red clustering although the top three is dominated by its close siblings in parameter space. It is interesting to note that the top blue clustering models in Table 6 closely resemble the top models in Table 4 for blue LBG lenses. For low mass systems differences between the H15 and G11 models are substantial due to the overproduction of red galaxies in the G11 model which are more clustered. For these systems, the AGN feedback strength also has a significant effect on the amplitude of the 1-halo term for red galaxies. The TNG300 results are similar to the lowest feedback model predictions, although the signal drops towards the centre.
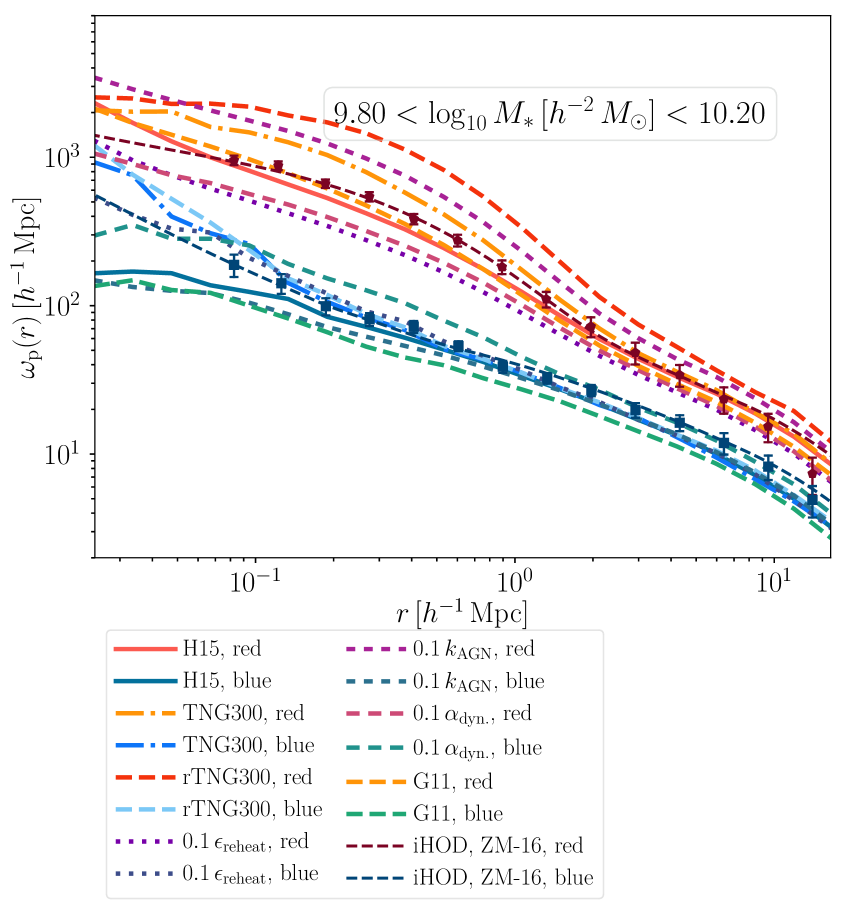
In Fig. 16, we also illustrate how the Pillepich et al. (2018b) resolution correction together with dust extinction affects the predicted clustering signal for red and blue galaxies in TNG300 vs. rTNG300. As previously reported in Springel et al. (2018), there was a tension for the predicted clustering signal for red galaxies with without dust extinction w.r.t. SDSS observations. If we use dust corrected colours the signal decreases and the tension is mitigated as can be seen in Fig. 16. The changes in the amplitude due to dust extinction are strongest in this low mass range since there are only a few red galaxies present and there is a rapid transition between red and blue. Still, if we apply the additional resolution correction, the tension is re-introduced as the red sequence is artificially shifted into the blue, leaving the most clustered galaxies. As hinted by the different satellite fractions at the knee of the SMF, the resolution correction introduces a similarly large tension for galaxies with w.r.t. data, as the one highlighted in Springel et al. (2018). Note that we are using 30 pkpc masses, so the result can differ slightly from the bound mass results. Further work has to be undertaken to clarify which corrections are necessary for which observable and to quantify the magnitude of the induced biases.
Fig. 16 suggests that the red clustering can be used to constrain the feedback efficiencies, but the results are sensitive to the dust model. We quantify this variation by comparing the clustering signals for the G11 and H15 model with and without dust. For stellar masses , there is a clear smooth suppression of the signal for red galaxies when dust is included compared to no dust, as more dusty star-forming blue galaxies which are on average less clustered are counted as red. This primarily affects the 1-halo term and the effect can amount to whereas the effect for the 2-halo term is depending on the galaxy formation model. This effect is greater for the G11 model due to its many low mass red galaxies, and it is greater for lower masses since most galaxies in that range are blue. For blue galaxies the situation is less clear; we observe a mild suppression for the two lowest mass bins for the H15 model, but the result at higher masses contains a lot of scatter.
We also show results for our extreme SAMs in Fig. 16, where we spot a clear tension between the model and the observations. This is the reason the low SN feedback models do not feature among our best. The model is not as extreme as the resolution corrected TNG300 result in Fig. 16 for red galaxies, which holds true for more massive systems. As for the model, it produces an excessive blue clustering signal, although it is in agreement with data for the least massive bin, and a too low red signal. The iHOD predictions are also plotted for comparison, and we see that they agree very well with the predictions from the SAMs and TNG300.
6.6 Galaxy group lensing
| 0.686 | 0.590 | 13.19 | 13.61 | 12.29 | 13.78 | 95 467 | 354 | 9.98 | 9.46 | 0.98 | |
| 0.728 | 0.725 | 13.45 | 13.74 | 12.75 | 13.92 | 60 289 | 150 | 10.22 | 9.91 | 0.95 | |
| 0.763 | 0.902 | 13.64 | 13.83 | 12.96 | 13.97 | 26 387 | 68 | 10.26 | 9.96 | 0.81 | |
| 0.859 | 1.151 | 13.89 | 14.08 | 13.22 | 14.02 | 6 698 | 22 | 10.36 | 10.33 | 0.50 | |
| 0.976 | 1.877 | 14.05 | 14.30 | 13.52 | 14.07 | 1 908 | 29 | 9.86 | - | 0.21 |
| H15 model on the gravity-only TNG100-DMO | |||||
|---|---|---|---|---|---|
| 0.732 | 13.12 | 13.80 | 400 | 9.87 | |
| 0.757 | 13.23 | 13.83 | 324 | 10.13 | |
| 0.937 | 13.60 | 13.92 | 157 | 10.39 | |
| 0.766 | 13.93 | 14.08 | 24 | 10.75 | |
| 0.818 | 13.80 | 14.31 | 6 | - | |
| and model on TNG100-DMO | |||||
| 0.751 | 13.08 | 13.80 | 345 | 9.83 | |
| 0.759 | 12.97 | 13.87 | 238 | 10.24 | |
| 0.808 | 13.16 | 13.79 | 275 | 9.49 | |
| 0.964 | 13.52 | 13.87 | 108 | 9.95 | |
| 0.925 | 13.48 | 14.13 | 46 | - |
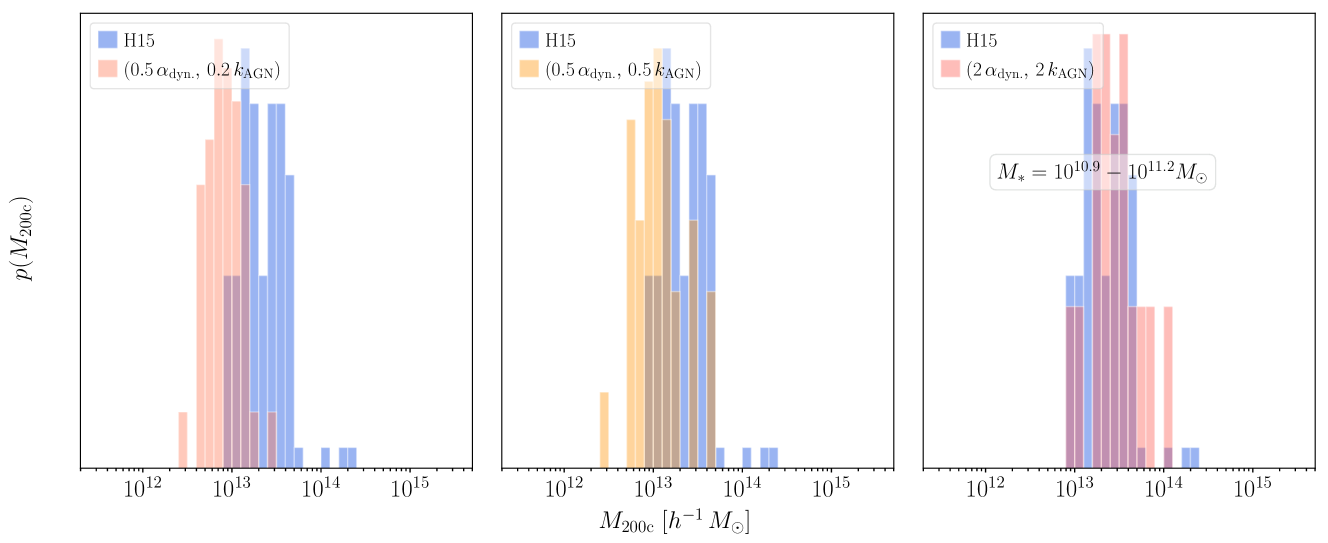
In this comparison, we are testing our new SAMs with altered parameter combinations from the previous constrained measurements from the stellar mass-only and LBG lensing and clustering samples against observations from an independent survey, in this case KiDS+GAMA galaxy group lenses. This serves to demonstrate that the new parameter combinations can match independent datasets, which will inform on the validity to use local redshift two-point statistics to tune a SAM and then use it to provide accurate predictions for upcoming higher redshift observations from surveys such as Euclid and LSST. We also present the corresponding results from the TNG suite, as well as Illustris, and discuss differences with respect to the original study (Velliscig et al., 2017), which compared data to the EAGLE simulation.
6.6.1 L-Galaxies vs. model variations
Here we focus on a few SAMs from Table 2, and especially our best fit LBG model with . Firstly we compare various statistical properties from the fiducial H15 run on the rescaled MR simulation with respect to EAGLE in Table 7. Then we reduce the volume and run the SAMs on the gravity-only TNG100-DMO to obtain similar statistics as for the EAGLE simulation, see Table 8, which was used in the original comparison, and especially to test claims on volume effects on the large-scale signal around . To show that we obtain the opposite shift of the host halo mass distribution, we also include a modified model with in the comparison. We also list the corresponding host halo masses and other properties for the rescaled MR to show that they are consistent across simulation volumes.
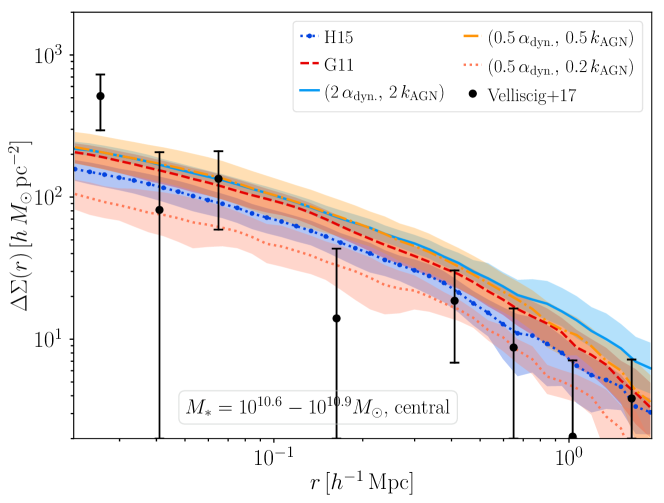
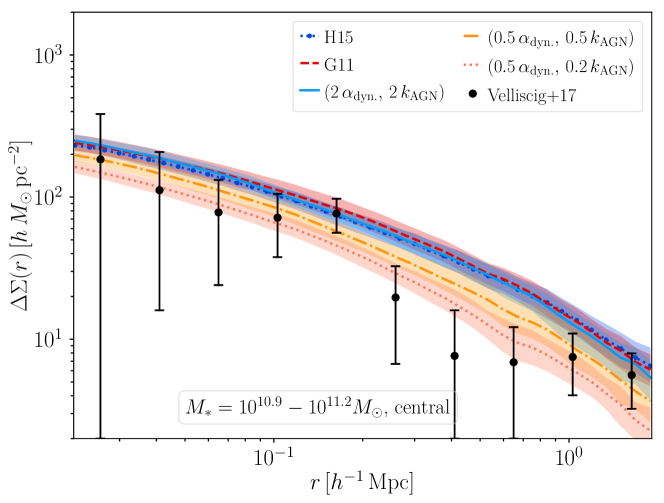
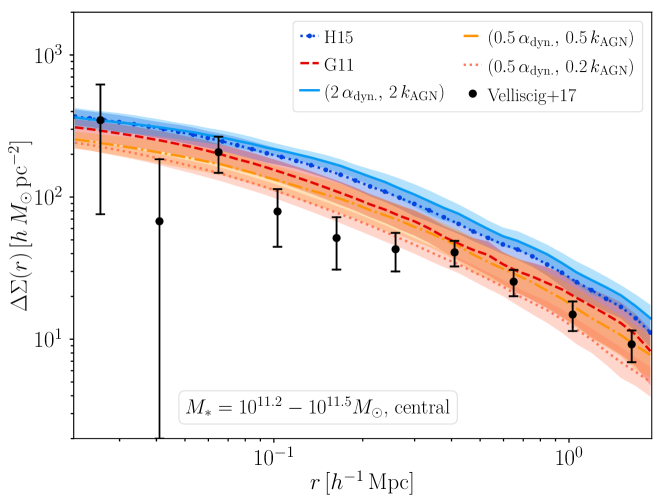
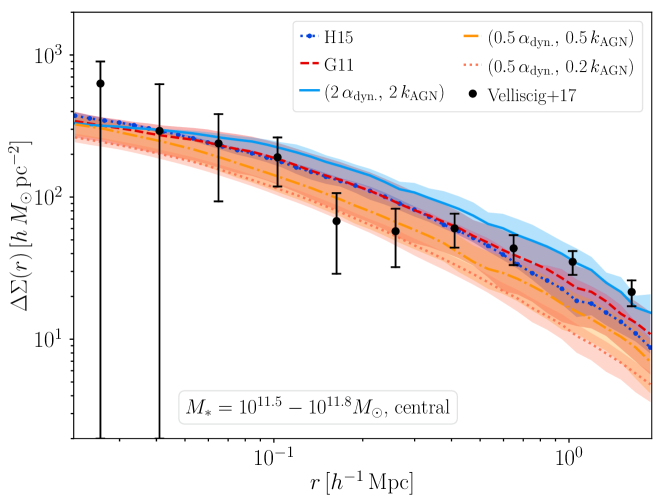
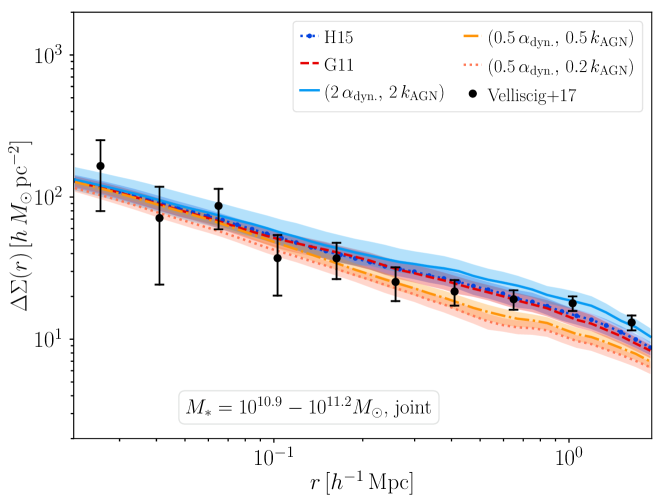
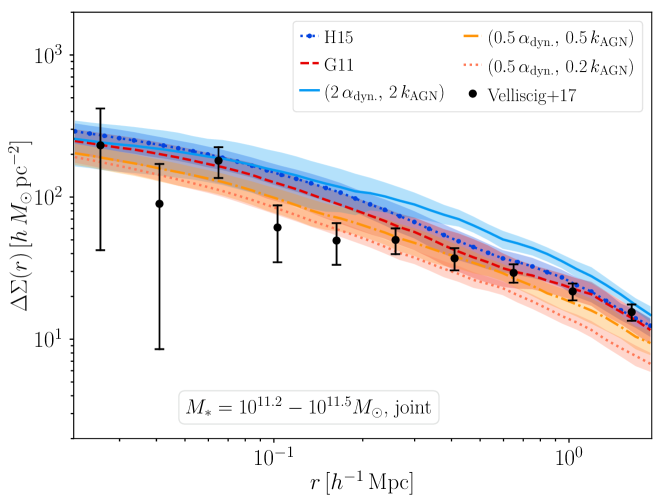
Compared to the quoted values in Velliscig et al. (2017) listed in Table 7 for the hydrodynamical EAGLE simulation (Schaye et al., 2015; Crain et al., 2015), we see that the limiting stellar masses are around 0.3-0.5 dex higher in the SAM. This translates to higher host halo masses in Table 8 in order to satisfy the observational matched satellite fraction criteria. By comparing the values in Table 7 and 8, we observe that they are consistent with one another, although the rescaled MR has better statistics than TNG100-DMO, which means that volume should have a negligible effect on the central galaxy lensing signal. In general, a more massive stellar mass bin requires a higher for the group membership criteria, although this is not necessarily true for all derivative H15 models, which we see in Table 8. By changing the merger criteria for the satellites, we are able to reduce for the mass bins; but it is raised for the bin. We shall see that this does not affect the agreement with the observations in this mass bin; and the reduction in the other two bins help to bring about better lensing predictions.
One may question how sensitive the host halo distributions and the lensing signals are to the explicit value of . It is true that the satellite fraction only evolves slowly with an increased for the lowest group mass bins due to the large number of satellites, which allows for a larger range of viable . By computing the average host halo masses as well as the altered satellite fractions for in the range for the H15 model run on the rescaled MR simulation, we discern that the average host halo mass for centrals is robust to moderate variations of with only changes which induce modest relative changes to compared to (at most for the second most massive bin).
We determine that the host halo masses for the lowest mass bin differ by about 1 dex between EAGLE and the SAMs, the predicted lensing signal for central galaxies from the SAMs are still consistent with the observations due to the large error bars; and the models yield similar signals with a slight shift between the H15 and G11 models. For the central signal in Fig. 18, all models are in agreement with data below . If we start to modify the SAMs to achieve better agreement for the higher stellar mass bins, changing and , can affect the signal and average host halo masses, with differences starting to show up from the bin onward. If we reduce and we are able to obtain more consistent values with the central galaxy signals for . This is especially true for stellar masses exceeding where we illustrate the shift in the host halo mass distribution in Fig. 17 compared to that of the reference H15 model. Increasing and produces a similar SMF, but causes a shift in the host halo mass distribution away from the observations. The best fit LBG model gives the lowest average host halo mass and the best central lensing signal for . When it comes to the satellite signal, however, this model does not do quite as well as the fiducial models for . This small error then propagates into the joint signal as seen in Fig. 19. Hence, while it is the best model for LBG lensing and for most of the central galaxy signals in Velliscig et al. (2017), it still needs refinements to adhere to the satellite lensing signal. To conclude, we see that our best constraint model conforms reasonably well with the new dataset for centrals, validating our approach.
If we consider the two fiducial models H15 and G11, they give similar predictions, especially for the satellite lensing signals. For the central galaxies, the G11 model predicts a lower signal for the bin and is greater by an almost equal amount for and the two are equal for and . Thus this dataset cannot be used to discriminate them against each other.
Compared to the stellar mass-only selection, we are able to agree with the joint and satellite lensing measurements in Velliscig et al. (2017) with all SAM models in the comparison, highlighting the need for isolation and group membership information from future surveys. We also obtain better agreement for the satellite lensing signal than EAGLE, which had a suppressed amplitude of the central bump, for . They argued that this was caused by the small simulation volume, but as we see for the SAMs run on TNG100-DMO this does not necessarily have to be an issue, although we have very few galaxies in our most massive bins; see the good agreement around in Fig. 19. If we compare the lensing signal for the H15 model run on the rescaled MR simulation, we find that the signal amplitude is slightly higher due to the presence of more massive haloes, specifically for the , and bins (the rescaled MR actually gives a slightly lower lensing signal for the bin). For the satellite lensing signal the central bumps are less prominent due to better statistics and larger spread in the average distances between the satellites and their centrals, which introduces a smoothing between the central subhalo lensing signal and its host central. We have to wait for larger observational datasets to see if this feature is also present in such surveys, and not intrinsic to how we construct mock catalogues in different simulation volumes.
To recap, we have shown that the modified SAM with is able to fit the central galaxy group signals across all covered stellar mass bins in the sample, and that it does moderately well for joint central and satellite galaxy group lensing. This bodes well for the possibility to forecast the signal for upcoming high- lensing surveys.
6.6.2 Hydrodynamical predictions and baryonic impact
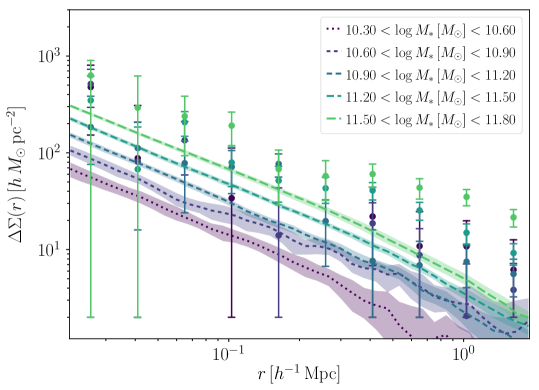
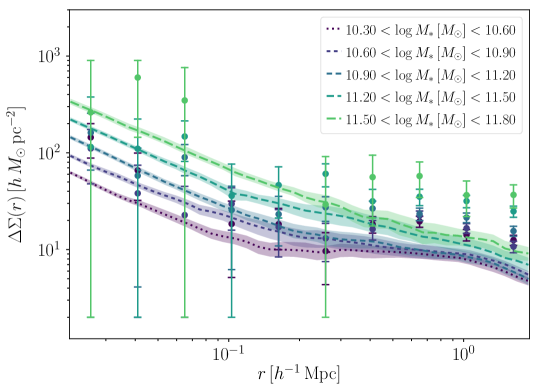
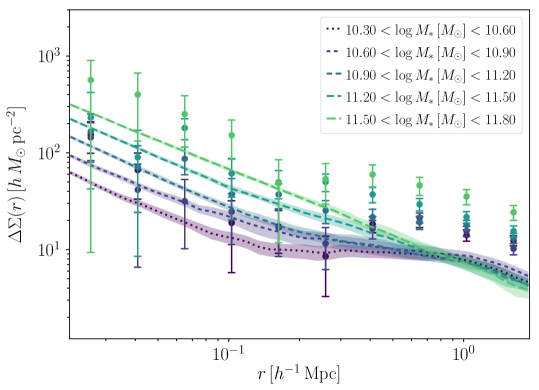
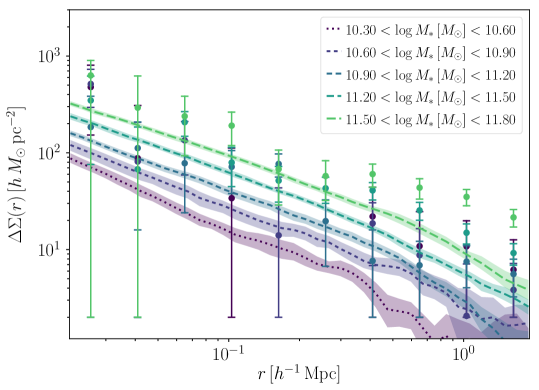
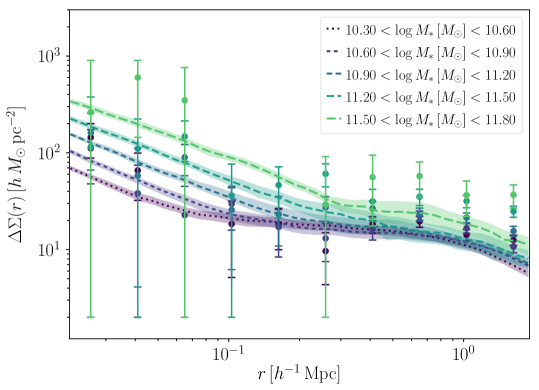
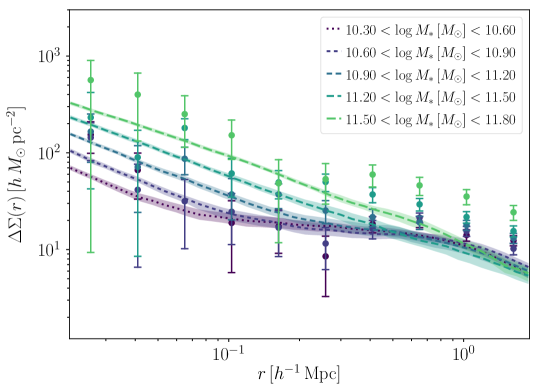
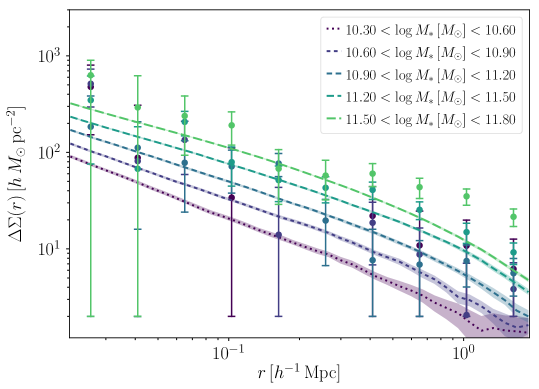
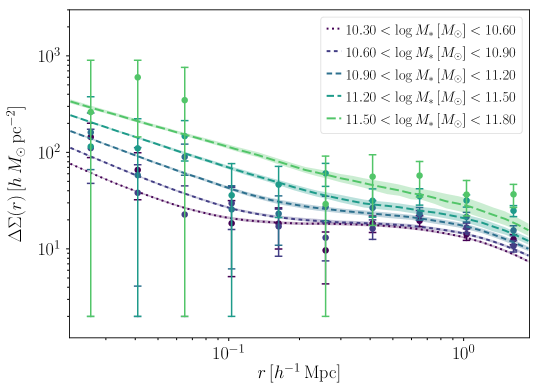
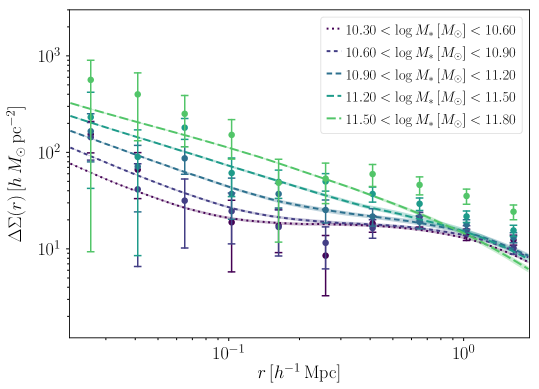
| Illustris | ||||||||||
|---|---|---|---|---|---|---|---|---|---|---|
| 0.657 | 0.725 | 0.752 | 0.725 | 12.06 | 13.52 | 12.02 | 13.59 | 419 (292) | 9.34 | |
| 0.698 | 0.855 | 0.894 | 0.860 | 12.41 | 13.56 | 12.53 | 13.66 | 265 (174) | 9.64 | |
| 0.686 | 0.767 | 0.842 | 0.767 | 12.53 | 13.51 | 12.63 | 13.60 | 256 (184) | 9.39 | |
| 0.785 | 1.017 | 0.981 | 1.024 | 12.79 | 13.68 | 12.90 | 13.74 | 159 (131) | 9.51 | |
| 1.283 | 1.208 | 1.370 | 1.203 | 12.99 | 13.81 | 13.14 | 13.84 | 125 (119) | - | |
| TNG100 | ||||||||||
| 0.498 | 0.684 | 0.627 | 0.685 | 12.12 | 13.65 | 12.11 | 13.62 | 619 (377) | 8.94 | |
| 0.636 | 0.783 | 0.750 | 0.783 | 12.56 | 13.72 | 12.51 | 13.71 | 407 (290) | 9.44 | |
| 0.668 | 0.864 | 0.811 | 0.864 | 12.78 | 13.75 | 12.83 | 13.74 | 216 (160) | 9.74 | |
| 0.934 | 1.207 | 1.060 | 1.116 | 13.02 | 13.88 | 13.06 | 13.91 | 104 (90) | 9.90 | |
| 1.103 | 1.256 | 1.234 | 1.232 | 13.34 | 13.90 | 13.36 | 13.83 | 80 (77) | - | |
| TNG300 | ||||||||||
| 0.588 | 0.791 | 0.733 | 0.792 | 12.35 | 13.85 | 12.26 | 13.84 | 9427 (5795) | 9.12 | |
| 0.675 | 0.886 | 0.833 | 0.886 | 12.70 | 13.92 | 12.71 | 13.90 | 5652 (3662) | 9.64 | |
| 0.806 | 1.059 | 0.995 | 1.057 | 12.98 | 14.03 | 13.02 | 14.00 | 1981 (1354) | 10.00 | |
| 0.990 | 1.250 | 1.164 | 1.242 | 13.28 | 14.10 | 13.32 | 14.06 | 978 (831) | 10.16 | |
| 1.397 | 2.020 | 1.565 | 1.989 | 13.48 | 14.23 | 13.50 | 14.19 | 872 (842) | - |
In Fig. 20, we show the corresponding profile measurements for Illustris, TNG100 and TNG300 for the central, satellite and the joint signal, respectively. Corresponding host halo masses and other statistical properties are quoted in Table 9. The TNG suite is well-apt at predicting the group lensing signals, both for centrals, satellites and joint samples, yielding similar predictions as EAGLE. However, these simulations have difficulties in matching the joint lensing signal at scales . This was also previously found for EAGLE (Velliscig et al., 2017). TNG300 yields the best results in this regard, where the signal is boosted by with respect to TNG100 for the joint lens sample for the mass bin at . However, several of the SAMs run on TNG100-DMO manage better, suggesting that this cannot be fully attributed to the simulation volume. Still, since the TNG300 predictions match the lensing signal well for satellite galaxies (in the lower middle row) whereas the central signals (left plot in the lowest row) for the two most massive bins are low in the outer region, one could correct the deficiency by adding more centrals in more massive haloes, which are prevalent in larger boxes. If we plot the same quantities with rTNG300, this problem is alleviated and there is only a mismatch for the most massive bin. Hence, some caution should be taken when interpreting these results. Illustris (in the first row) does not yield sufficiently high central lensing signals, although the model performs reasonably well in the inner radial regions for satellite galaxies.
Regarding the tabulated properties, comparing Tables 7 and 9, we find that the satellites in EAGLE are on average positioned marginally further out than those in TNG300 and the average central host halo masses in these two simulations agree fairly well. This also applies to the average satellite host halo masses, apart from the two most massive bins where the TNG300 values are more massive with dex. The smaller volume TNG100 has smaller average host halo masses than TNG300 with shifts of dex. These differences are larger for the average satellite host halo masses where they lie around dex. This produces a better agreement for the satellite lensing signal (compare the signal from outwards in the middle column in the middle and last row in Fig. 20). Illustris has lower average central host and satellite halo masses than the other hydrodynamical simulations, and on average predicts more massive stellar masses for its galaxies, which yields a discrepancy in the number counts in the column at the high mass end. Concerning the cutoff stellar masses, , Illustris, TNG100 and TNG300, in increasing order, prefer lower values than EAGLE; meaning lower values still than the SAMs. Since EAGLE, TNG100 and TNG300 are able to match the observations, the cutoff stellar masses should probably lie within their quoted range. Thus, here, the more consistent treatment of the satellite galaxies in galaxy groups in hydrodynamical simulations than in the SAMs affect the quality of the predictions.
Since we have had access to the gravity-only companion simulations, we can gauge how the statistics differ between the full physics and gravity-only runs. We find that the average host halo masses for the centrals and the satellite agree well for the TNG100 and TNG300 simulations. For Illustris, the central hosts are on average 0.1 dex more massive and this also applies to the satellite hosts, apart from the two most massive bins. Although we cannot match all satellite galaxies between the runs, we can generally say for all simulations here that the satellites in the gravity-only runs are on average situated further away from the host halo centres. Closer objects have probably already merged with the central galaxies in the gravity-only runs, which yields lower satellite fractions in the gravity-only runs for the groups. If we look at the substructures which are bijectively matched, they lie on average further out than all satellite galaxies in the full physics run, but closer to the centres than their gravity-only counterparts, which supports the hypothesis. Neglecting the lower matching rates for the satellite structures, which puts the validity of the comparison into question, the position shift results in a shift of the central bump in the 2D projections. This introduces significant scatter in the baryonic deformations on scales , which is hard to model. In addition, if one limits the analysis to the matched satellite signal (for ), it resembles the total satellite signal in the centre, but there are large reductions of the matched signal compared to the fiducial signal; and it has a steeper slope between the satellite term and the central bump term, which is smoothed for the full signal. In this region, the matched satellite signal is reduced by approximately a factor of two888This implies a lower host halo mass for the matched satellites than in the full signal., which together with its altered shape makes it a poor proxy. This is less of a problem for the two most massive bins, as the central bump decreases in prominence, but there are still considerable differences on scales . These statements hold for all simulations in Table 9; but the situation is slightly better in the EAGLE simulation for the mass bins where these differences are the most prominent. The drop of the matched satellite signal with respect to the total satellite signal for the mass bin at is compared to for the other models. We attribute this difference to the slightly different subhalo matching techniques. Further studies could clarify if varying the matching criterion could produce better total signal proxies to determine baryonic effects for satellite galaxies. These matching issues impede the ability to gauge the impact of baryons on the lensing signal, particularly for samples with high fractions. For our analysis, this problem particularly affects the joint signal analysis for the bins with , where the central fraction starts to exceed 50 %. This suggests that these effects are something future analyses can marginalise over for high-confidence central-dominated lens samples.
We already observed in Fig 10 that the matched and total red lensing signal differed for TNG300. Here the total signal agrees better with the KiDS+GAMA observations than the matched sub-sample, whose curves lie within the error bars for radial scales between the central satellite galaxy term and the central bump. Notwithstanding differences in the selection functions, this demonstrates that the models are capable to provide accurate (average) lensing profiles for satellites in some groups, and thus the problem for the red galaxies might be narrowed down to the colour and the precise group definition.
Lastly, we investigate the baryonic imprint on this group lens sample for the centrals, especially using TNG300. TNG100 and Illustris suffer from poor statistics, which affect the 1-to-2 halo transition regime at , where nearby and line-of-sight contributions from surrounding structures produces large scatter (which can amount to a factor 10 or more for the lowest mass bin) for the two lowest mass bins with . Owing to its larger volume, TNG300 does not suffer to the same extent from this scatter, but it is partly visible for the lowest mass bin where the signal is computed for galaxies (). From , the deformations are very similar to what was shown in Fig. 7. We note a slightly weaker trend with decreasing deformation at the very massive end, observed for both the stellar mass only centrals in Fig. 7 and in Fig. 14 for red centrals. This can be due to the wider mass bin in Fig. 7, and our restriction to galaxy groups where the AGN feedback is the strongest. The results from Illustris, EAGLE and TNG100 are also very similar to their stellar mass-only central counterparts. Again, TNG100 suggests a shallower deformation than TNG300 by a few percent. For the two most massive bins, the maximum suppression for EAGLE (by about ) lies more in line with TNG100 than TNG300.
7 Discussion
We have carried out a comparison between different SAMs as well as IllustrisTNG for different galaxy-galaxy lensing and galaxy clustering datasets and found broadly satisfactory agreement across several of them.
Starting with the TNG300 results, the simulation can achieve excellent lensing as well as clustering predictions, passing yet another milestone in physical modelling, for several of the datasets covered, especially for stellar-mass only () and group lens samples and LBG lensing, for all () and red galaxies , and blue if one neglects the most massive bin. In addition, it is interesting to note that this simulation can help to ameliorate the construction and parameter choices of semi-analytical models, suggesting a future mutually beneficial relationship between the two frameworks to arrive at realistic synthetic catalogues for Gigaparsec volumes. The dependency of the (red) galaxy clustering predictions on the stellar-mass resolution correction, shown in Fig. 16, highlights the future requirement to construct hydrodynamical simulations which feature e.g. resolution-independent recipes for star formation (cf. the discussion in Schaye et al., 2015; Pillepich et al., 2018b, regarding weak vs. strong numerical convergence for parameter values in the calibration steps) to obtain the proper volume scaling relations, or to directly calibrate for large simulation runs, as was performed for e.g. the BAHAMAS suite (McCarthy et al., 2017; McCarthy et al., 2018).
A residual challenge is the modelling of the SDSS-DR7 stellar mass + colour sample, both for TNG300 and the different SAMs, where we cannot reach sufficient agreement even for extreme model parameter variations in the SAM. Specifically, the tension we observe is that, for , TNG300 and TNG100 (as well as rTNG300) predict a for red galaxies which is generically above the SDSS data from Zu & Mandelbaum (2016) and Mandelbaum et al. (2016) for by up to a factor of two (i.e. several sigma). In contrast, the signal at as well as for blue galaxies at all distances is within roughly 1 sigma of the data. This mass range is the most problematic for the simulation, and at higher masses (across the whole radial range below ) the agreement with observations is better. The excess red signal at this mass range could be due to internal processes (i.e. the TNG feedback model at these mass scales) or external processes (i.e. an overestimated environmental impact of stripping due to too-large background gas densities). This issue propagates into the total lensing signal, where the model suggests a signal increase from to , especially in the region, which is disfavoured by the data. To solve this will probably require major work on the physical processes involved in the quenching of satellite galaxies for signal agreement around , as seen in Fig. 9. Traditionally, a way to boost galaxy clustering has been to populate massive galaxies with more satellite galaxies and we see that this might influence the lensing. The lensing data instead suggest that one should preferentially populate lower mass host haloes with red satellites. If we compare to the iHODs from Mandelbaum et al. (2016), they have no trouble getting the red lensing signal right, although we are able to produce equally well or slightly superior predictions at the extreme low mass end. We have also checked the halo occupation distributions for our SAMs compared to those shown in Zu & Mandelbaum (2015) for the iHOD setup for stellar masses at and , and we find adequate agreement for the central galaxies, but for satellites the distribution has tails of the order of dex towards lower and higher masses. If we remove the orphans these two tails disappear, and it is mostly the massive tail which dominates the lensing signal. Hence, we deduce that the physical processes setting the stellar masses and colours of satellites need refinements in future simulations and SAMs to eliminate these errors. Still, the agreement for the satellite lensing signals from the galaxy groups indicate that most of the machinery is correct.
Our best fit LBG SAM, the model, gives good predictions for the Velliscig et al. (2017) central galaxy signals. As an additional validation step we have computed its SMF up to and its predicted red galaxy fractions with respect to the fiducial H15 model. As pointed out in Section 6.1, the new SMF is slightly too high above the knee at and this also applies to but given the stellar mass uncertainties, we argue that this is still consistent with the observations (and IllustrisTNG). We are thus able to retain the good agreement to the SMF to , which is well beyond the depth of any near future lensing survey, meaning that this simplified study is compatible with the fiducial MCMC constraints used to tune H15. Yet, if we examine the red fractions, the new model shifts the distribution away from the observational data points. Still, the division is very sensitive to the actual shape of the colour distribution, especially for stellar masses between where the transition between blue and red is rapid. Thus, we do not put equal weight on matching the colour cuts. For we are in excellent agreement with H15. Future endeavours should focus on the incorporation of these lensing constraints into the MCMC chains themselves for the model selection, but, as we have shown, the modification of a few pertinent parameters is sufficient to produce an acceptable improvement. We have also examined the SMF evolution of our best fit model for stellar mass-only lenses, and it is also acceptable with respect to the data with the excess above the knee still present at , but within error bars. In Wang et al. (2016) it was argued that abundance corrections could be used to bring the signal into agreement. We also find that this is the case, but the effects are largest at the high mass end where the uncertainties are considerable.
The approaching era of precision cosmology requires a more profound understanding of systematic effects such as the influence of baryons. With the baryonic feedback prescriptions offered by TNG300, we find that we are still safe from their impact for the current datasets by restricting the analyses to scales to avoid the impact of the stellar term. Furthermore, large scale cosmological analyses are mostly safe from baryonic processes if one restrict the scales to , unless one considers more extreme formation models such as Illustris. That the baryonic effects on these scales are consistent for different feedback recipes is encouraging for analyses with explicit component modelling (e.g. Schneider & Teyssier, 2015; Schneider et al., 2019; Aricò et al., 2020), fitting formulae based measured simulation bias or extensions to the halo model (e.g. Harnois-Déraps et al., 2015; Mead et al., 2015, 2020) or with principal components (e.g. Eifler et al., 2015; Huang et al., 2019) and other libraries (e.g. van Daalen et al., 2020) (see e.g. Chisari et al., 2019, for a recent review of baryonic modelling). Future progress should be directed towards understanding the amplitude and scope of the suppression on intermediate radial scales, which is especially important for group scale systems where the effect of AGN feedback is the strongest. We have shown that this suppression both depends on the formation model, as well as the simulation volume. This is particularly important for further simulation campaigns where one should ensure that the baryonic deformations for a given galaxy formation recipe are consistent. We also observed that the suppression depends on the colour of the galaxy sample, and is less pronounced for blue (central) galaxies. This could be important for galaxy surveys where one treats the systematics differently depending on colour.
Further developments could also to be made to include additional 2-pt statistics in the analysis, such as cosmic shear which has been shown to offer interesting galaxy formation constraints (e.g. Foreman et al., 2016), as well as lensing 3-pt statistics (e.g. Saghiha et al., 2017; Linke et al., 2020), where the H15 SAM has been able to yield viable predictions in contrast to other SAMs.
8 Conclusions
| Dataset | Reference | Best model | |
|---|---|---|---|
| Stellar mass-only lensing | van Uitert et al. (2016) | 1.67 | |
| LBG lensing (all) | Wang et al. (2016) | 1.59 | |
| LBG lensing (red) | Mandelbaum et al. (2016) | 1.12 | |
| LBG lensing (blue) | Mandelbaum et al. (2016) | 1.67 | |
| Clustering (all) | G11 | 0.72 | |
| Clustering (red) | Zu & Mandelbaum (2016) | 4.05 | |
| Clustering (blue) | Zu & Mandelbaum (2016) | 2.61 |
In this Paper we have analysed predictions from different semi-analytical models of galaxy formation based on L-Galaxies and IllustrisTNG, TNG300 and TNG100, for galaxy-galaxy lensing and galaxy clustering datasets. We summarise the SAM configurations which performed the best for the different datasets in Table 10 and list the most important results below:
-
•
TNG300 is able to produce very good lensing predictions, especially for stellar mass-only selected lenses () (Section 6.2.3), but also for locally brightest galaxies (LBGs, Section 6.4.2) (), whereas the H15 SAM requires slight modifications to achieve the same level of agreement with fiducial performance at (Section 6.2.1) and (Section 6.4.1). One can adjust the merger times and AGN feedback parameters of the SAMs to bring about agreement at the high mass end, which improves the stellar-mass only lensing (Section 6.2.1) and LBG lensing signals (Section 6.4.1).
- •
-
•
We have found a tension (Section 6.3) for the red lensing signal with excessive predictions approximately ranging from to a factor of two at for (for the SAMs and in both TNG100 and TNG300, where the tension at also is present for ). Further work is required to model physics responsible for the (potentially stripped) satellite subhalo lensing signal in both hydrodynamical simulations and in SAMs, to achieve the right colours and stellar masses in lower host mass haloes.
-
•
We observe that baryons reduce the lensing signal on intermediate radial scales for by 10-15 % depending on the galaxy evolution model and simulation volume used compared to gravity-only runs (Section 6.2.3). This reduction, however, is too small to explain why the hydrodynamical simulations (TNG100, TNG300, EAGLE and Illustris) perform better than the H15 SAM for the stellar mass-only lenses for the van Uitert et al. (2016) dataset. We also find that the deformation is different for red and blue central galaxies at the same stellar mass (Section 6.4.2), with the suppression more prominent for red galaxies at for compared to a few percent for blue galaxies, and that this reduces the inferred host halo bimodality, both in TNG300 and TNG100.
-
•
With the dust model from Nelson et al. (2018) applied to the colours, the observed tension with SDSS-data for red galaxies in TNG300 with in Springel et al. (2018) is reduced (Section 6.5). By comparing the clustering signal from the G11 and H15 SAMs with and without dust, we find that for red galaxies with dust reduces the signal whereas the effect for the 2-halo term is depending on the galaxy formation model. The effect on the lensing signal is more modest, with the dusty red signal from H15 suppressed with at most for (Section 6.3).
-
•
By combining lensing data across different stellar masses and by adding clustering information, we identify a few viable parameter combinations in the SAM for the central galaxy signal which we have verified to be consistent with the external group membership datasets from Velliscig et al. (2017) (Section 6.6.1). Our best fit models suggest a weaker AGN radio-mode feedback by from the fiducial MCMC parameter value (Section 6.2.1), and for central-dominated samples also a shorter dynamical friction merger time multiplier by approximately from the value in the fiducial H15 model (Section 6.4.1), and they retain the good agreement with the SMF at up to (Section 7), making them suitable for future lensing and clustering surveys.
Thus we conclude that joint 2-pt statistics analyses are powerful, promising approaches to constrain galaxy formation.
Acknowledgements
The Authors would like to thank the referee whose comments have improved the Paper, and in addition, Edo van Uitert, Wenting Wang, Ying Zu and Rachel Mandelbaum for sharing their data. We thank Matthieu Schaller for sharing subhalo matching catalogues for the EAGLE simulation. In addition we thank Patrick Simon for providing useful comments on the draft. MR and SH acknowledge support by the DFG cluster of excellence ‘Origin and Structure of the Universe’ (www.universe-cluster.de) and would like to thank the Max Planck Institute for Astrophysics and the Max Planck Computing and Data Facility for computational resources. MR acknowledges additional support from the US DOE contract DE-AC02-06CH11357. BMBH acknowledges support from a Zwicky Prize fellowship. MV acknowledges support through an MIT RSC award, a Kavli Research Investment Fund, NASA ATP grant NNX17AG29G, and NSF grants AST-1814053 and AST-1814259. REA acknowledges support of the European Research Council through grant number ERC-StG/716151.
Data availability
Some of the data products underlying this article are available at www.tng-project.org/renneby20 and the rest are available upon request.
References
- Abazajian et al. (2009) Abazajian K. N., et al., 2009, ApJS, 182, 543
- Aihara et al. (2018) Aihara H., et al., 2018, Publications of the Astronomical Society of Japan, 70, S4
- Anderson et al. (2015) Anderson M. E., Gaspari M., White S. D. M., Wang W., Dai X., 2015, MNRAS, 449, 3806
- Angulo & Hilbert (2015) Angulo R. E., Hilbert S., 2015, MNRAS, 448, 364
- Angulo & White (2010) Angulo R. E., White S. D., 2010, MNRAS, 405, 143
- Aricò et al. (2020) Aricò G., Angulo R. E., Hernández-Monteagudo C., Contreras S., Zennaro M., Pellejero-Ibañez M., Rosas-Guevara Y., 2020, MNRAS, 495, 4800
- Artale et al. (2017) Artale M. C., et al., 2017, MNRAS, 470, 1771
- Ayromlou et al. (2020) Ayromlou M., Nelson D., Yates R. M., Kauffmann G., Renneby M., White S. D. M., 2020, arXiv e-prints, p. arXiv:2004.14390
- Bartelmann & Schneider (2001) Bartelmann M., Schneider P., 2001, Phys. Rept., 340, 291
- Behroozi et al. (2010) Behroozi P. S., Conroy C., Wechsler R. H., 2010, ApJ, 717, 379
- Behroozi et al. (2019) Behroozi P., Wechsler R. H., Hearin A. P., Conroy C., 2019, MNRAS, 488, 3143
- Bekki (2013) Bekki K., 2013, MNRAS, 432, 2298
- Berlind & Weinberg (2002) Berlind A. A., Weinberg D. H., 2002, ApJ, 575, 587
- Binney & Tremaine (1987) Binney J., Tremaine S., 1987, Galactic dynamics. Princeton University Press, Princeton, NJ
- Blanton & Roweis (2007) Blanton M. R., Roweis S., 2007, The Astronomical Journal, 133, 734
- Bose et al. (2019) Bose S., Eisenstein D. J., Hernquist L., Pillepich A., Nelson D., Marinacci F., Springel V., Vogelsberger M., 2019, MNRAS, 490, 5693
- Bower et al. (2006) Bower R. G., Benson A. J., Malbon R., Helly J. C., Frenk C. S., Baugh C. M., Cole S., Lacey C. G., 2006, MNRAS, 370, 645
- Boylan-Kolchin et al. (2008) Boylan-Kolchin M., Ma C.-P., Quataert E., 2008, MNRAS, 383, 93
- Boylan-Kolchin et al. (2009) Boylan-Kolchin M., et al., 2009, MNRAS, 398, 1150
- Bruzual & Charlot (2003) Bruzual G., Charlot S., 2003, MNRAS, 344, 1000
- Chisari et al. (2018) Chisari N. E., et al., 2018, MNRAS, 480, 3962
- Chisari et al. (2019) Chisari N. E., et al., 2019, The Open Journal of Astrophysics, 2, 4
- Cooray & Sheth (2002) Cooray A., Sheth R., 2002, Physics Reports, 372, 1
- Crain et al. (2015) Crain R. A., et al., 2015, MNRAS, 450, 1937
- Croton et al. (2006) Croton D. J., et al., 2006, MNRAS, 365, 11
- D’Souza et al. (2015) D’Souza R., Vegetti S., Kauffmann G., 2015, MNRAS, 454, 4027
- Davis et al. (1985) Davis M., Efstathiou G., Frenk C. S., White S. D. M., 1985, ApJ, 292, 371
- De Lucia & Blaizot (2007) De Lucia G., Blaizot J., 2007, MNRAS, 375, 2
- De Lucia et al. (2010) De Lucia G., Boylan-Kolchin M., Benson A. J., Fontanot F., Monaco P., 2010, MNRAS, 406, 1533
- Donnari et al. (2020) Donnari M., Pillepich A., Nelson D., Marinacci F., Vogelsberger M., Hernquist L., 2020, arXiv e-prints, p. arXiv:2008.00004
- Duffy et al. (2010) Duffy A. R., Schaye J., Kay S. T., Dalla Vecchia C., Battye R. A., Booth C. M., 2010, MNRAS, 405, 2161
- Eifler et al. (2015) Eifler T., Krause E., Dodelson S., Zentner A. R., Hearin A. P., Gnedin N. Y., 2015, MNRAS, 454, 2451
- Engler et al. (2020) Engler C., et al., 2020, arXiv e-prints, p. arXiv:2002.11119
- Foreman et al. (2016) Foreman S., Becker M. R., Wechsler R. H., 2016, MNRAS, 463, 3326
- Gao & White (2007) Gao L., White S. D. M., 2007, MNRAS, 377, L5
- Genel et al. (2014) Genel S., et al., 2014, MNRAS, 445, 175
- Gouin et al. (2019) Gouin C., et al., 2019, A&A, 626, A72
- Guo et al. (2011) Guo Q., White S., Boylan-Kolchin M., De Lucia G., Kauffmann G., et al., 2011, MNRAS, 413, 101
- Guo et al. (2016) Guo Q., et al., 2016, MNRAS, 461, 3457
- Hadzhiyska et al. (2020) Hadzhiyska B., Bose S., Eisenstein D., Hernquist L., 2020, arXiv e-prints, p. arXiv:2008.04913
- Harnois-Déraps et al. (2015) Harnois-Déraps J., van Waerbeke L., Viola M., Heymans C., 2015, MNRAS, 450, 1212
- Hearin et al. (2016) Hearin A. P., Zentner A. R., van den Bosch F. C., Campbell D., Tollerud E., 2016, MNRAS, 460, 2552
- Henriques et al. (2009) Henriques B. M. B., Thomas P. A., Oliver S., Roseboom I., 2009, MNRAS, 396, 535
- Henriques et al. (2013) Henriques B. M. B., White S. D. M., Thomas P. A., Angulo R. E., Guo Q., Lemson G., Springel V., 2013, MNRAS, 431, 3373
- Henriques et al. (2015) Henriques B. M. B., White S. D. M., Thomas P. A., Angulo R., Guo Q., Lemson G., Springel V., Overzier R., 2015, MNRAS, 451, 2663
- Henriques et al. (2017) Henriques B. M. B., White S. D. M., Thomas P. A., Angulo R. E., Guo Q., Lemson G., Wang W., 2017, MNRAS, 469, 2626
- Henriques et al. (2020) Henriques B. M. B., Yates R. M., Fu J., Guo Q., Kauffmann G., Srisawat C., Thomas P. A., White S. D. M., 2020, MNRAS, 491, 5795
- Huang et al. (2019) Huang H.-J., Eifler T., Mandelbaum R., Dodelson S., 2019, MNRAS, 488, 1652
- Ivezić et al. (2008) Ivezić Ž., et al., 2008, arXiv e-prints, p. arXiv:0805.2366
- Kauffmann et al. (1999) Kauffmann G., Colberg J. M., Diaferio A., White S. D. M., 1999, MNRAS, 303, 188
- Kaviraj et al. (2019) Kaviraj S., Martin G., Silk J., 2019, MNRAS, p. L103
- Kuijken et al. (2015) Kuijken K., et al., 2015, MNRAS, 454, 3500
- Lange et al. (2019) Lange J. U., Yang X., Guo H., Luo W., van den Bosch F. C., 2019, MNRAS, 488, 5771
- Laureijs et al. (2011) Laureijs R., et al., 2011, preprint, (arXiv:1110.3193)
- Leauthaud et al. (2011) Leauthaud A., Tinker J., Behroozi P. S., Busha M. T., Wechsler R. H., 2011, ApJ, 738, 45
- Leauthaud et al. (2012) Leauthaud A., et al., 2012, ApJ, 744, 159
- Leauthaud et al. (2017) Leauthaud A., et al., 2017, MNRAS, 467, 3024
- Lemson & Virgo Consortium (2006) Lemson G., Virgo Consortium t., 2006, preprint, pp astro–ph/0608019 (arXiv:astro-ph/0608019)
- Li & White (2009) Li C., White S. D. M., 2009, MNRAS, 398, 2177
- Linke et al. (2020) Linke L., et al., 2020, A&A, 640, A59
- Liske et al. (2015) Liske J., et al., 2015, MNRAS, 452, 2087
- Mandelbaum et al. (2016) Mandelbaum R., Wang W., Zu Y., White S., Henriques B., More S., 2016, MNRAS, 457, 3200
- Marinacci et al. (2018) Marinacci F., et al., 2018, MNRAS, 480, 5113
- Martin (1999) Martin C. L., 1999, ApJ, 513, 156
- McCarthy et al. (2010) McCarthy I. G., et al., 2010, MNRAS, 406, 822
- McCarthy et al. (2017) McCarthy I. G., Schaye J., Bird S., Le Brun A. M. C., 2017, MNRAS, 465, 2936
- McCarthy et al. (2018) McCarthy I. G., Bird S., Schaye J., Harnois-Deraps J., Font A. S., van Waerbeke L., 2018, MNRAS, 476, 2999
- McKinnon et al. (2016) McKinnon R., Torrey P., Vogelsberger M., 2016, MNRAS, 457, 3775
- McKinnon et al. (2017) McKinnon R., Torrey P., Vogelsberger M., Hayward C. C., Marinacci F., 2017, MNRAS, 468, 1505
- McKinnon et al. (2018) McKinnon R., Vogelsberger M., Torrey P., Marinacci F., Kannan R., 2018, MNRAS, 478, 2851
- Mead et al. (2015) Mead A. J., Peacock J. A., Heymans C., Joudaki S., Heavens A. F., 2015, MNRAS, 454, 1958
- Mead et al. (2020) Mead A. J., Tröster T., Heymans C., Van Waerbeke L., McCarthy I. G., 2020, arXiv e-prints, p. arXiv:2005.00009
- Mitchell et al. (2018) Mitchell P. D., et al., 2018, MNRAS, 474, 492
- Moster et al. (2010) Moster B. P., Somerville R. S., Maulbetsch C., van den Bosch F. C., Macciò A. V., Naab T., Oser L., 2010, ApJ, 710, 903
- Mummery et al. (2017) Mummery B. O., McCarthy I. G., Bird S., Schaye J., 2017, MNRAS, 471, 227
- Naiman et al. (2018) Naiman J. P., et al., 2018, MNRAS, 477, 1206
- Navarro et al. (1996) Navarro J. F., Frenk C. S., White S. D. M., 1996, ApJ, 462, 563
- Navarro et al. (1997) Navarro J. F., Frenk C. S., White S. D. M., 1997, ApJ, 490, 493
- Nelson et al. (2015) Nelson D., et al., 2015, Astronomy and Computing, 13, 12
- Nelson et al. (2018) Nelson D., et al., 2018, MNRAS, 475, 624
- Nelson et al. (2019) Nelson D., et al., 2019, Computational Astrophysics and Cosmology, 6, 2
- Nishimichi et al. (2019) Nishimichi T., et al., 2019, ApJ, 884, 29
- Peacock & Smith (2000) Peacock J. A., Smith R. E., 2000, MNRAS, 318, 1144
- Pillepich et al. (2018a) Pillepich A., et al., 2018a, MNRAS, 473, 4077
- Pillepich et al. (2018b) Pillepich A., et al., 2018b, MNRAS, 475, 648
- Planck Collaboration (2013) Planck Collaboration 2013, A&A, 557, A52
- Planck Collaboration (2014) Planck Collaboration 2014, A&A, 571, A16
- Planck Collaboration (2016) Planck Collaboration 2016, A&A, 594, A13
- Popping et al. (2017) Popping G., Somerville R. S., Galametz M., 2017, MNRAS, 471, 3152
- Renneby et al. (2018) Renneby M., Hilbert S., Angulo R. E., 2018, MNRAS, 479, 1100
- Reyes et al. (2012) Reyes R., Mandelbaum R., Gunn J. E., Nakajima R., Seljak U., Hirata C. M., 2012, MNRAS, 425, 2610
- Robotham et al. (2011) Robotham A. S. G., et al., 2011, MNRAS, 416, 2640
- Saghiha et al. (2017) Saghiha H., Simon P., Schneider P., Hilbert S., 2017, A&A, 601, A98
- Schaller et al. (2015) Schaller M., et al., 2015, MNRAS, 451, 1247
- Schaye et al. (2015) Schaye J., et al., 2015, MNRAS, 446, 521
- Schneider & Teyssier (2015) Schneider A., Teyssier R., 2015, Journal of Cosmology and Astro-Particle Physics, 2015, 049
- Schneider et al. (2019) Schneider A., Teyssier R., Stadel J., Chisari N. E., Le Brun A. M. C., Amara A., Refregier A., 2019, JCAP, 2019, 020
- Seljak (2000) Seljak U., 2000, MNRAS, 318, 203
- Spergel et al. (2003) Spergel D. N., et al., 2003, ApJS, 148, 175
- Spergel et al. (2015) Spergel D., et al., 2015, preprint, p. arXiv:1503.03757 (arXiv:1503.03757)
- Springel (2005) Springel V., 2005, MNRAS, 364, 1105
- Springel (2010) Springel V., 2010, MNRAS, 401, 791
- Springel et al. (2001) Springel V., White S. D. M., Tormen G., Kauffmann G., 2001, MNRAS, 328, 726
- Springel et al. (2005) Springel V., et al., 2005, Nature, 435, 629
- Springel et al. (2018) Springel V., et al., 2018, MNRAS, 475, 676
- Taylor et al. (2011) Taylor E. N., et al., 2011, MNRAS, 418, 1587
- Torrey et al. (2014) Torrey P., Vogelsberger M., Genel S., Sijacki D., Springel V., Hernquist L., 2014, MNRAS, 438, 1985
- Velliscig et al. (2017) Velliscig M., et al., 2017, MNRAS, 471, 2856
- Villaescusa-Navarro et al. (2018) Villaescusa-Navarro F., et al., 2018, ApJ, 866, 135
- Viola et al. (2015) Viola M., et al., 2015, MNRAS, 452, 3529
- Vogelsberger et al. (2013) Vogelsberger M., Genel S., Sijacki D., Torrey P., Springel V., Hernquist L., 2013, MNRAS, 436, 3031
- Vogelsberger et al. (2014a) Vogelsberger M., et al., 2014a, MNRAS, 444, 1518
- Vogelsberger et al. (2014b) Vogelsberger M., et al., 2014b, Nature, 509, 177
- Vogelsberger et al. (2019) Vogelsberger M., McKinnon R., O’Neil S., Marinacci F., Torrey P., Kannan R., 2019, MNRAS, 487, 4870
- Vogelsberger et al. (2020) Vogelsberger M., et al., 2020, MNRAS, 492, 5167
- Wang et al. (2016) Wang W., White S. D. M., Mandelbaum R., Henriques B., Anderson M. E., Han J., 2016, MNRAS, 456, 2301
- Weigel et al. (2016) Weigel A. K., Schawinski K., Bruderer C., 2016, MNRAS, 459, 2150
- Weinberger et al. (2017) Weinberger R., et al., 2017, MNRAS, 465, 3291
- White & Frenk (1991) White S. D. M., Frenk C. S., 1991, SpJ, 379, 52
- Wright & Brainerd (2000) Wright C. O., Brainerd T. G., 2000, ApJ, 534, 34
- Zennaro et al. (2019) Zennaro M., Angulo R. E., Aricò G., Contreras S., Pellejero-Ibáñez M., 2019, MNRAS, 489, 5938
- Zhu et al. (2017) Zhu Q., Hernquist L., Marinacci F., Springel V., Li Y., 2017, MNRAS, 466, 3876
- Zu & Mandelbaum (2015) Zu Y., Mandelbaum R., 2015, MNRAS, 454, 1161
- Zu & Mandelbaum (2016) Zu Y., Mandelbaum R., 2016, MNRAS, 457, 4360
- van Daalen et al. (2016) van Daalen M. P., Henriques B. M. B., Angulo R. E., White S. D. M., 2016, MNRAS, 458, 934
- van Daalen et al. (2020) van Daalen M. P., McCarthy I. G., Schaye J., 2020, MNRAS, 491, 2424
- van Uitert et al. (2016) van Uitert E., et al., 2016, MNRAS, 459, 3251