Submillimetre galaxies in cosmological hydrodynamical simulations – an opportunity for constraining feedback models
Abstract
Submillimetre galaxies (SMGs) have long posed a challenge for theorists, and self-consistently reproducing the properties of the SMG population in a large-volume cosmological hydrodynamical simulation has not yet been achieved. We use a scaling relation derived from previous simulations plus radiative transfer calculations to predict the submm flux densities of simulated SMGs drawn from cosmological simulations from the Illustris and IllustrisTNG projects based on the simulated galaxies’ star formation rates (SFRs) and dust masses and compare the predicted number counts with observations. We find that the predicted SMG number counts based on IllustrisTNG are significantly less than observed (more than 1 dex at mJy). The simulation from the original Illustris project yields more SMGs than IllustrisTNG: the predicted counts are consistent with those observed at both mJy and mJy and only a factor of lower than observed at intermediate flux densities. The redshift distribution of SMGs with mJy in IllustrisTNG is consistent with the observed distribution, whereas the Illustris redshift distribution peaks at significantly lower redshift (1.5 vs. 2.8). We demonstrate that IllustrisTNG hosts fewer SMGs than Illustris because in the former, high-mass () galaxies have lower dust masses and SFRs than in Illustris owing to differences in the sub-grid models for stellar or/and active galactic nucleus (AGN) feedback between the two simulations (we unfortunately cannot isolate the specific cause(s) post hoc). Our results demonstrate that because our method enables predicting SMG number counts in post-processing with a negligible computational expense, SMGs can provide useful constraints for tuning sub-grid models in future large-volume cosmological simulations.
keywords:
cosmology: theory – methods: numerical – galaxies: evolution – galaxies: formation – galaxies: star formation – galaxies: starburst.1 Introduction
Submillimetre galaxies (SMGs) are a class of rapidly star-forming (SFR ), highly dust-obscured galaxies that were discovered in the late 1990s (Smail et al. 1997; Barger et al. 1998; Hughes et al. 1998; Eales et al. 1999; see Casey et al. 2014 for a recent review). Since that time, they have been the focus of much observational work for multiple reasons. For example, they have inferred SFRs that are unprecedented in the local Universe (a ‘typical’ SMG has an SFR a factor of a few greater than Arp 220, and some have SFRs over an order of magnitude greater). Their SFR surface densities are sufficiently high that they approach the theoretical maximum SFR surface density at which momentum injection from stellar feedback can unbind the remaining gas and thus halt star formation (Scoville, 2003; Murray et al., 2005; Thompson et al., 2005). They are estimated to contribute as much as half of the SFR density of the Universe at (Chapman et al., 2005; Dunlop et al., 2017; Michałowski et al., 2017; Smith et al., 2017). Their number densities ( cMpc-3 at ) and stellar (median ; e.g. da Cunha et al. 2015; Ma et al. 2015; Miettinen et al. 2017) and halo (; Blain et al. 2004; Hickox et al. 2012; Wilkinson et al. 2017) masses suggest that they may be the progenitors of compact quiescent galaxies (Toft et al., 2014). SMGs at serve as beacons of the highest-mass dark matter halos at a given epoch (Miller et al., 2015, 2020), potentially enabling tests of CDM (Marrone et al., 2018). Most importantly for the present work, reproducing the observed SMG number counts and redshift distribution has posed a challenge for theorists since their discovery (Baugh et al., 2005; Primack, 2012), and their physical nature is still vigorously debated.
Modelling the SMG population self-consistently is extremely challenging. Because of their rarity, large volumes must be simulated. However, one must also resolve individual galaxies sufficiently well to capture physical processes that may be responsible for their high SFRs, including the classical explanation, merger-induced starbursts (e.g. Engel et al., 2010; Chakrabarti et al., 2008; Narayanan et al., 2010; Hayward et al., 2011), and disc instabilities (Lacey et al., 2016). Moreover, to accurately model SMGs, one must predict submm fluxes of simulated galaxies because there is not a one-to-one relation between submm flux density and SFR, mainly owing to the dependence of the dust temperature distribution and thus submm flux density on the dust mass in addition to the SFR (Hayward et al., 2011; Safarzadeh et al., 2016). For this purpose, it is necessary to perform dust radiative transfer, the results of which depend on the distribution of dust and sources of emission (stars and active galactic nuclei, AGN) on sub-galactic scales.
For the above reasons, hybrid approaches – rather than large-volume cosmological simulations with full radiative transfer – have typically been employed to model the SMG population. The earliest theoretical studies about SMGs employed semi-analytic models, in which submm fluxes were predicted via simplified radiative transfer calculations assuming an idealised axisymmetric geometry (e.g. Granato et al., 2000; Baugh et al., 2005) or using an analytic model for dust attenuation and empirical SED templates (e.g. Somerville et al., 2012). Granato et al. (2000) compared the SMG number counts and redshift distribution predicted by the galform (Cole et al., 2000) SAM with that observed. They found that the model under-predicted the observed counts by a factor of . Other SAMs (Fontanot et al., 2007; Somerville et al., 2012) also significantly under-predicted the bright SMG number counts. Baugh et al. (2005) explored various modifications to the galform model, searching for a means to match the SMG number counts and redshift distribution while not violating other observational constraints, such as the stellar mass function. They found that by assuming a flat stellar initial mass function (IMF) in starbursts (specifically, constant for the mass range ), in addition to other subdominant modifications to the model, they were able to reproduce the SMG number counts and redshift distribution. In the Baugh et al. (2005) model, SMGs are predominantly minor merger-driven starbursts (González et al., 2011). However, due to the many free parameters employed in SAMs, it is possible to find multiple qualitatively distinct solutions that satisfy observational constraints equally well (e.g. Lu et al., 2011; Henriques et al., 2013), so it is unclear that a top-heavy IMF is necessary, rather than simply sufficient given the other components of the model, to reproduce the SMG population. Indeed, in the current version of the galform model (Lacey et al., 2016), the IMF assumed for starbursts, , is still top-heavy compared to the Kroupa (2001) IMF ( for ) but considerably steeper than that assumed by Baugh et al. (2005), and SMGs are predominantly starbursts driven by disc instabilities rather than mergers (Cowley et al., 2015; Lacey et al., 2016). Moreover, Safarzadeh et al. (2017) demonstrated that the SMG number counts and redshift distribution predicted based on the Lu et al. (2014) SAM, which uses a standard Chabrier (2003) IMF, agree reasonably well with observations.
Some studies have employed approaches based on performing post-processing dust radiative transfer on idealised (non-cosmological) galaxy merger simulations. Narayanan et al. (2010, see also ; ) demonstrated that merger-induced starbursts could produce submm flux densities as high as observed. Hayward et al. (2013a) combined the results of isolated disc and galaxy merger simulations with a semi-empirical model for the redshift evolution of galaxy mass functions, merger rates, gas fractions and other properties to predict the SMG number counts and redshift distribution, finding good agreement with observations despite employing a standard Kroupa (2001) IMF. In their model, SMGs are a mix of isolated ‘quiescently’ star-forming disc galaxies, pre-coalescence mergers blended into a single submm source (see below), and merger coalescence-induced starbursts. Although the hybrid approach employed by Hayward et al. (2013a) satisfies various observational constraints, such as the stellar mass function, by construction, one significant downside is that it effectively sidesteps some important issues, such as self-consistently predicting the correct stellar mass function, and is far from ‘ab initio’.
Narayanan et al. (2015) performed radiative transfer in post-processing on a zoom simulation of a halo with a halo mass of . The central galaxy reached a peak submm flux density of mJy, comparable to the flux densities of the brightest SMGs known (Hayward, 2013). Narayanan et al. (2015) argued that major mergers did not play an important role in driving the galaxy’s high submm flux density. They posited that SMGs are typically massive galaxies undergoing minor mergers and that stellar feedback – which results in bursts of star formation, subsequent outflows, and re-accretion in a ‘galactic fountain’ (Muratov et al., 2015; Sparre et al., 2017; Hayward & Hopkins, 2017) – ‘saves’ gas accreted by the halo for consumption at , thus resulting in an SMG phase consistent with the peak of the observed SMG redshift distribution. However, as with idealised, non-cosmological simulations, zoom simulations suffer from a lack of statistics; thus, Narayanan et al. (2015) did not present predictions for the SMG number counts and redshift distribution, and it may not be possible to infer the nature of a ‘typical’ SMG from the evolution of a single halo.
Despite the aforementioned difficulties in using large-volume cosmological hydrodynamical simulations to model the SMG population, there have been a few such works published to date. Davé et al. (2010) performed a hydrodynamical simulation with a volume of . Given an estimate for the number density of SMGs (), they computed the expected number of SMGs that the simulation should contain, 41, and analysed the 41 most rapidly star-forming galaxies in the snapshot (effectively assuming a monotonically increasing relationship between submm flux density and SFR). In the Davé et al. (2010) model, SMGs correspond to the high-mass end of the star-forming galaxy ‘main sequence’, and their star formation is typically not driven by major mergers. The properties of the simulated galaxies agreed well with some of the observed properties of SMGs, but the SFRs were lower than those inferred for real SMGs by a factor of . Davé et al. (2010) noted that one possible explanation for this discrepancy is that the observationally inferred SFRs, which rely on the assumption of a standard Milky Way-type IMF, would overestimate the true SFR of SMGs if the IMF in SMGs were top-heavy, as argued in some of the works mentioned above. However, we note that at , at fixed stellar mass, all galaxies in the Davé et al. (2010) simulation, not only the SMG analogues, have SFRs lower than observed (i.e. the normalisation of the SFR–stellar mass relation in the simulation is systematically below that observed). Consequently, reconciling the SFRs of the observed and simulated galaxies would require a top-heavy IMF in lower-mass, more-typical galaxies in addition to SMGs.
Shimizu, Yoshida & Okamoto (2012) performed a cosmological hydrodynamical simulation with a comoving volume of . They employed a simple model to predict the submm flux densities of their simulated galaxies: assuming a spherically symmetric dust geometry, they computed the total luminosity absorbed by dust. Then, assuming dust of a single temperature in thermal equilibrium and neglecting dust self-absorption, they computed the submm flux densities of their simulated galaxies. Their predicted counts agree well with those observed for mJy, but they under-predict the counts of fainter sources. However, this success should be taken with a grain of salt, as their simplified model for computing the submm flux density may over-predict the submm flux density: applying the same model (i.e. using the scaling for an optically thin single-temperature modified blackbody) to hydrodynamical simulations of isolated disc galaxies and galaxy mergers on which they performed radiative transfer, Hayward et al. (2011) found that the simplified model over-predicts the flux densities (relative to the results of the radiative transfer calculations) by dex. Because of the steepness of the bright end of the SMG number counts, reducing the predicted fluxes of their model SMGs by this seemingly modest factor would cause the number counts to be significantly under-predicted.
McAlpine et al. (2019) compared the properties of ‘submm-bright’ galaxies (which they define by mJy) in the eagle simulation (Schaye et al., 2015) with those of observed SMGs. The submm fluxes were computed by performing dust radiative transfer directly on the galaxies from the simulation. Notably, the redshift distribution of sources with mJy agrees reasonably well with that observed, but the predicted number counts of sources with mJy are more than two orders of magnitude less than those observed (fig. 9 of Cowley et al. 2019; see also Wang et al. 2019).
Lovell et al. (2020) performed dust radiative transfer on galaxies from simba (Davé et al., 2019). Their predicted counts are closer to those observed than are those for eagle or, as we shall see below, IllustrisTNG, but they are still a factor of a few to less than observed, and the SMG redshift distribution is skewed toward somewhat higher redshift than observed.
The main advantage of our work (and that of McAlpine et al. 2019 and Lovell et al. 2020) relative to the cosmological-simulation-based SMG studies of Davé et al. (2010) and Shimizu et al. (2012) is how we define SMGs. For this purpose, it is necessary to compute the submm flux density directly because both the SFR and dust mass affect the FIR/submm SED (Hayward et al., 2011; Lanz et al., 2014; Safarzadeh et al., 2016). For this reason, a galaxy with a high SFR but low dust mass may actually have a lower submm flux density than one with a lower SFR but high dust mass, owing to the former galaxy having a ‘hotter’ SED. Consequently, the monotonic mapping between submm flux density and SFR assumed in Davé et al. (2010) does not hold in detail (Hayward et al., 2011, 2013a). Since the mass and spatial resolution state-of-the-art large-volume cosmological hydrodynamical simulations are possibly still insufficient to perform dust radiative transfer directly on the simulated galaxies (i.e. without resampling in both space and time; Trayford et al. 2017), and to avoid the significant computational expense associated with doing so, we instead assign submm flux densities to our simulated galaxies using a fitting function that gives the submm flux density as a function of SFR and dust mass. The fitting function was derived from the results of performing dust radiative transfer on hydrodynamical simulations of isolated disc and merging galaxies (Hayward et al., 2011, 2013a); see Section 2 for details. As discussed above, this approach is superior to that of Shimizu et al. (2012) because the single-temperature, optically thin modified blackbody scaling assumed in that work tends to over-predict the submm flux densities of the simulated galaxies by a factor of dex (Hayward et al., 2011), implying that the SMG number counts presented in Shimizu et al. (2012) are significantly higher than they would be had a more accurate method for computing submm flux densities been used.
One issue that has complicated previous comparisons between theoretical models and observations is blending of multiple SMGs into a single submm source. Models predict that blending of both early-stage mergers (Hayward et al., 2011, 2012, 2013a) and physically unassociated galaxies (Hayward et al., 2013b; Muñoz Arancibia et al., 2015; Cowley et al., 2015) should result in a significant fraction of observed single-dish submm sources breaking up into multiple sources when observed at higher resolution with e.g. ALMA, as has been observed (e.g. Karim et al., 2013; Hodge et al., 2013; Simpson et al., 2015; Hayward et al., 2018). Blending causes the number counts derived from single-dish observations (e.g. those based on SCUBA-2 maps) to exceed the true SMG number counts, as demonstrated explicitly by the comparison of LABOCA and ALMA counts shown in Karim et al. (2013), although the magnitude of this effect is still debated. For simplicity, we do not treat blending of submm sources in this work, so we will compare the simulated SMGs only with ALMA observations of spatially resolved SMGs.
In this work, we show that the SMG number counts predicted from Illustris using our simple method are in reasonable agreement with observations, whereas those predicted from IllustrisTNG are significantly less than observed. However, it has been shown in numerous previous works that IllustrisTNG better reproduces various aspects of the general galaxy population than Illustris, and thus the aforementioned result should not be interpreted as an indication that Illustris is more correct than IllustrisTNG. Instead, our results indicate a need for further revision of the sub-grid models and demonstrate the utility of SMG number counts for constraining said models for future large-volume cosmological simulations, especially given that our method for predicting the SMG counts incurs negligible computational expense.
The remainder of this work is organised as follows: in Section 2, we summarise the Illustris and IllustrisTNG simulations and the method for generating mock SMG catalogues from these simulations. Section 3 compares the predicted number counts with observations. In Section 4, we outline how our method for predicting SMG number counts from large-volume cosmological simulations can be used to constrain sub-grid feedback models, discuss how the quenched fractions of massive galaxies in the simulations compare with observational constraints, and detail some limitations and future work. In Section 5, we conclude.
2 Methods
2.1 The Illustris and IllustrisTNG simulations
Here, we summarise the details of the large-volume cosmological simulations from the Illustris and IllustrisTNG projects used in this work. Both simulations were run using arepo (Springel, 2010), an unstructured moving-mesh hydrodynamics code. The details of the physical model employed in Illustris are presented in Vogelsberger et al. (2014a, see also and ), so we will only briefly list the key aspects here. The models for star formation and stellar feedback are based on Springel & Hernquist (2003). Star formation is implemented by stochastically spawning stellar particles at a rate set by a volume density-dependent Kennicutt-Schmidt law (Kennicutt, 1998; Schmidt, 1959); a density threshold of 0.13 cm-3 is employed. An effective equation of state is used to approximate how SNe heat the ISM, and stellar feedback-driven winds are implemented by stochastically kicking and temporarily hydrodynamically decoupling gas cells in a manner intended to capture bipolar winds (Springel & Hernquist, 2003). Importantly for the present work, stellar evolution, chemical enrichment, and gas return are tracked. BH accretion is modelled as Eddington-limited modified Bondi-Hoyle accretion with a boost factor to account for the gas density near the BH being underestimated due to resolution, and a two-stage model for AGN feedback, including both quasar and radio modes, is employed (Springel et al., 2005; Sijacki et al., 2007). The sub-grid models were tuned to reproduce the SFR density as a function of redshift and SFR stellar mass–halo mass and black hole mass–stellar mass relations. Further details about and first results from the Illustris simulations are presented in Vogelsberger et al. (2014b, a); Genel et al. (2014); Sijacki et al. (2015). In this work, we use the Illustris-1 simulation, which has a volume of (106.5 Mpc)3, resolution elements, a dark matter (baryonic) mass resolution of , and a gravitational softening of 710 pc.
The IllustrisTNG simulation that we employ, tng100, has the same initial conditions (modulo minor differences in the cosmology) and resolution as Illustris-1, but improvements to the numerical method and an updated physical model intended to alleviate many of the discrepancies between the Illustris results and observations are employed. We note that the aforementioned discrepancies refer to the overall galaxy population, such as the galaxy colour bimodality; the properties of SMGs, which represent an ‘extreme’ sub-population of galaxies, were not considered. The updated numerical method and physical model are described in Pillepich et al. (2018a) and Weinberger et al. (2017), and further details about the simulations and first results are presented in various works (e.g. Springel et al., 2018; Pillepich et al., 2018b; Nelson et al., 2018; Naiman et al., 2018). The IllustrisTNG model was tuned to reproduce the SFR density as a function of redshift and galaxy stellar mass and stellar mass–halo mass relations, and the BH mass–stellar mass relation, halo gas fractions and stellar half-mass radii of galaxies were also considered; see section 3.2 of Pillepich et al. (2018a). We refer the interested reader to those works for full details, and we will only highlight the modifications most relevant to the present work here. Regarding the AGN feedback model, the low-accretion state mode was changed to a kinetic model (Weinberger et al., 2017). When computing the Bondi-Hoyle accretion rate, a boost factor is no longer employed; to prevent too-slow early BH growth, a larger seed mass (, rather than the value of used in Illustris) is assumed. A few aspects of the model for stellar feedback-driven winds were also changed (Pillepich et al., 2018a). First, the wind calls are kicked isotropically rather than in a bipolar manner. A redshift dependence and floor for the wind velocity are also employed. Also, unlike in Illustris, a fraction of the wind energy is deposited as thermal (rather than kinetic) energy (Marinacci et al., 2014), and a metallicity dependence of the mass loading factor, such that winds are less effective at higher metallicity, is assumed.
2.2 Generating simulated SMG catalogues
As discussed in Section 1, to identify SMGs in the simulation, it is ideal to compute individual simulated galaxies’ submm flux densities via dust radiative transfer. The mass and spatial resolution of Illustris and IllustrisTNG are insufficient to resolve the sub-kpc structure of the ISM, and owing to both the sub-grid equation of state treatment of stellar feedback and resolution, such simulations tend to feature overly puffy discs and thus underestimate the attenuation (Trayford et al., 2017). Consequently, we do not perform radiative transfer directly. Instead, we use the following relation based on the results of performing radiative transfer on higher-resolution hydrodynamical simulations of idealised isolated discs and mergers (Hayward et al., 2011, 2013a):
| (1) |
where SFR is the ‘instantaneous’ SFR associated with the star-forming gas cells (for consistency with Hayward et al. 2011) and is the dust mass. When applying the relation, following Hayward et al. (2013b), we incorporate a scatter of 0.13 dex (independent of SFR and dust mass) assuming a Gaussian distribution (Hayward et al., 2011). The submm flux densities predicted using this relation also agree well with the results of performing dust radiative transfer directly on cosmological zoom simulations (Liang et al., 2018; Cochrane et al., 2019) and a semi-analytic model (A. Benson, private communication). Moreover, by combining the above with the observed SFR- and relations, one can derive an relation (Hayward et al., 2013a; Hayward, 2012) that agrees reasonably well with that observed for SMGs (Davies et al., 2013). Although given sufficient resolution and unlimited computing time, it would be preferred to perform radiative transfer directly, our approach has the advantage of trivial computational expense, and it may actually be more accurate than direct radiative transfer given the resolution of state-of-the-art large-volume simulations such as Illustris and IllustrisTNG.
In the above, we approximate the total SFR and ISM metal mass of a simulated galaxy by summing over the values for all cells within 25 kpc of the subhalo centre, excluding those that are contained in subhaloes of the halo under consideration (i.e. those in satellite galaxies; recall that we will compare with observations of resolved SMGs, in which satellite galaxies should typically not be blended with central galaxies). We have confirmed that the results are insensitive to the radial cut employed as long as it is kpc. Since dust is likely destroyed in hot halo gas (e.g. McKinnon et al., 2016, 2017; Popping et al., 2017), when computing the ISM metal mass, we only consider ‘ISM gas’ defined using the temperature-density cut from Torrey et al. (2012):
| (2) |
Given this value, we then compute the dust mass using a dust-to-metal ratio of 0.4 (Dwek, 1998; James et al., 2002). The results are not strongly dependent on the exact dust-to-metal ratio used because of the sub-linear scaling between submm flux density and dust mass (e.g. using a value of 0.5 would boost the submm flux density by per cent).
2.3 Number counts
The process described in the previous subsection yields a submm (850-µm) flux density, , for each subhalo in the simulation (in addition to other important properties of each subhalo, including the SFR; stellar, gas, metal, and dust masses; and redshift). Given the SMG catalogues derived from each time snapshot of the simulations, we then compute the number counts and redshift distribution. To determine the cumulative number counts of galaxies, , we first calculate the number of sources with a given submm flux per unit comoving volume for each snapshot. Next, we multiply the number density at a given redshift by the redshift-dependent comoving volume element and integrate over redshift (see equation 3 in Hayward et al., 2013a).
3 Results

Fig. 1 compares the 850-µm number counts predicted using IllustrisTNG and Illustris with those observed. As explained in Section 1, we do not treat the effects of blending due to the coarse angular resolution of single-dish submm telescopes, so we only compare with counts based on interferometric observations with ALMA since such observations have sufficient angular resolution to resolve multi-component sources into individual SMGs (e.g. Karim et al., 2013). The IllustrisTNG counts are significantly lower than observed: at mJy, the observed counts are an order of magnitude or more higher. There are no SMGs in IllustrisTNG with mJy. The counts predicted using Illustris are in better agreement with those observed: they are consistent at mJy and mJy, and they are only a factor of lower than observed at intermediate flux densities.
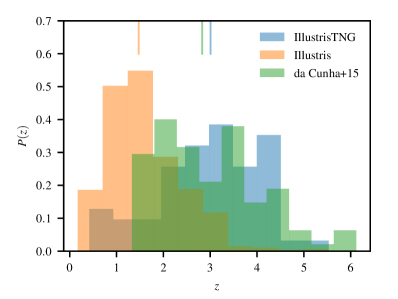
Fig. 2 compares the redshift distributions of SMGs with mJy in the two simulations with the observed distribution for the ALESS sample (da Cunha et al., 2015). In contrast with the number counts, for the redshift distribution, IllustrisTNG is in much better agreement with observations. The IllustrisTNG and observed redshift distributions are broadly consistent, with similar median redshifts (3.0 vs. 2.8). The Illustris redshift distribution peaks at a much lower redshift, 1.5, and differs dramatically from that observed. It is interesting that IllustrisTNG matches the observed redshift distribution significantly better than Illustris, but given that IllustrisTNG underpredicts the number counts by more than an order of magnitude, it is unclear whether this agreement is meaningful or purely coincidental.
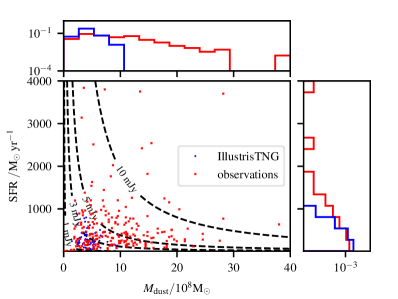
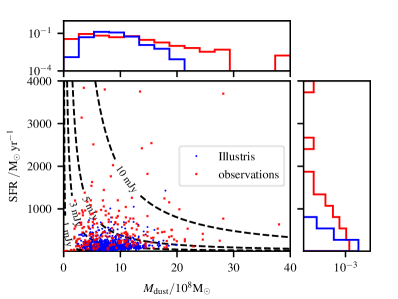
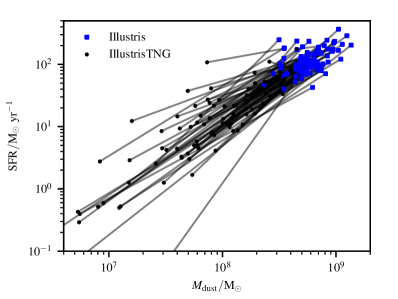
To understand the underlying reason(s) for the discrepancies between the counts predicted using IllustrisTNG and Illustris, in Fig. 3, we show the distribution of the mock SMGs in the SFR- plane (blue circles) for IllustrisTNG (top panel) and Illustris (bottom panel). Only simulated galaxies with mJy are plotted. The dashed lines show contours for various values assuming ; recall that in our model, the simulated galaxies’ SFRs, dust masses, and redshifts fully determine their submm flux densities (see Eq. 1).111Because we include scatter when computing using Eq. (1), many of the simulated SMGs with assigned mJy lie on the lower-flux side of the mJy contour. The other points represent observed SMGs from da Cunha et al. (2015) and Miettinen et al. (2017).222One SMG from Miettinen et al. (2017) with SFR and has been omitted to avoid excess white space. The SFR and values for the observed SMGs were obtained by fitting their UV–mm spectral energy distributions (SEDs) with the magphys SED modelling code, which has been demonstrated to be able to accurately recover these and other galaxy properties by applying the code to simulated galaxy SEDs, for which the ‘ground truth’ is known (Michałowski et al., 2012; Hayward & Smith, 2015; Smith & Hayward, 2015, 2018). Because we plot the simulated SMGs taken from all redshift snapshots rather than the results for a lightcone covering an area equal to that probed by the observations, the densities of the simulated and observed points in a given region should not be directly compared, but the plots are useful for determining whether the simulations and observations span the same range of SFR and values. Moreover, because Illustris and IllustrisTNG have identical volumes (and initial conditions modulo minor differences in the cosmology), directly comparing the density of points for the simulations in the two panels is meaningful.
The most significant difference between IllustrisTNG and Illustris is that simulated galaxies in the former have significantly lower dust masses, with no IllustrisTNG galaxies having . In contrast, Illustris contains many simulated galaxies with dust masses greater this value. For reference, the observed SMGs in the ALESS sample (for which the number counts from Karim et al. 2013 are plotted as red dots in Fig. 1) have a median dust mass of , and the 16th-84th-percentile range of the likelihood distribution is (da Cunha et al., 2015). Some galaxies in Illustris have dust masses that are a factor of two higher than that of the most dust-rich galaxy in IllustrisTNG, and as shown below, galaxies with (i.e. ‘typical SMGs’ in the simulations) in IllustrisTNG have dust masses that are typically a factor of 3 lower than those of their Illustris counterparts. Since in Eq. 1, , a factor of three higher dust mass corresponds to a per cent higher submm flux density. Given the steepness of the number counts, the relatively modest boost in flux density due to the higher dust masses of the Illustris galaxies makes the Illustris counts agree much better with observations (Fig. 1).
The IllustrisTNG galaxies also exhibit lower SFRs, although the difference in the SFR distributions of Illustris and IllustrisTNG is less significant than for . In IllustrisTNG, 16 galaxies have SFR , and the maximum SFR reached is . Illustris has 29 galaxies with SFR , and the most rapidly star-forming galaxy has SFR .
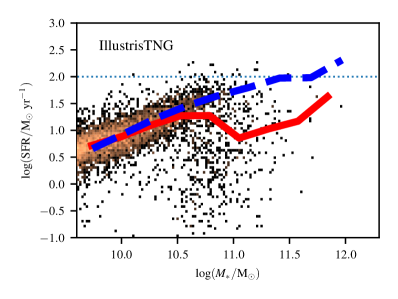
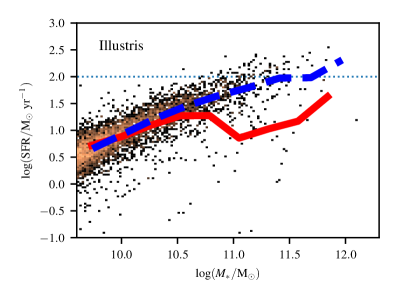
In Fig. 3, we only considered simulated galaxies with mJy. We will now compare some key properties of all massive galaxies in Illustris and IllustrisTNG, which will further highlight the reasons for the differences between the Illustris and IllustrisTNG SMG number counts. We focus on for this analysis because the SMG redshift distribution peaks around that redshift (e.g. Chapman et al., 2005). Fig. 4 shows the distribution of all IllustrisTNG (top panel) and Illustris (bottom) galaxies in the snapshot with in the SFR– plane. At , both simulations feature a tight ‘star formation main sequence’ (SFMS; Noeske et al. 2007; Daddi et al. 2007; see Sparre et al. 2015 and Donnari et al. 2019 for detailed analyses of the SFR– relations in Illustris and IllustrisTNG, respectively), and the typical SFR values at fixed stellar masses are similar. At higher masses, many of the simulated galaxies are ‘quenched’ (i.e. lie significantly below the main sequence), with a greater fraction of quenched galaxies in IllustrisTNG than in Illustris; how the quenched fractions in the simulations compare with observational constraints will be discussed in Section 4. Moreover, the typical SFRs are somewhat less in IllustrisTNG than in Illustris: at and (a representative stellar mass for bright SMGs), the median SFR in IllustrisTNG is , whereas the corresponding value for Illustris is . This difference is partially due to IllustrisTNG having a lower normalisation for the SFMS (Donnari et al., 2019) (and consequently a lower cosmic SFR density at ‘cosmic noon’; see fig. 4 of Pillepich et al. 2018a) compared to Illustris and partly because of the higher quenched fraction in this mass and redshift range in IllustrisTNG. This indicates that one or more of the differences between the Illustris and IllustrisTNG galaxy formation models results in systematically lower star formation rates for massive galaxies – and consequently less SMGs – in IllustrisTNG compared with Illustris.
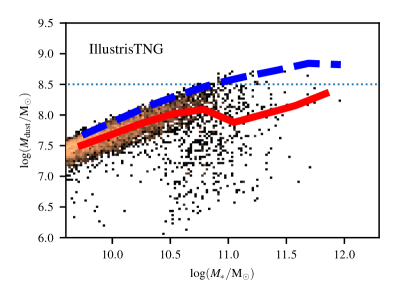
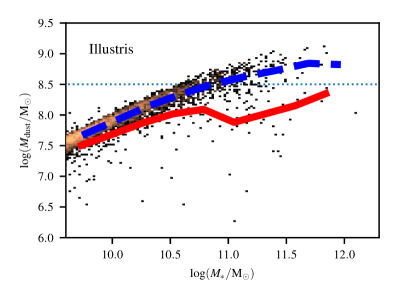
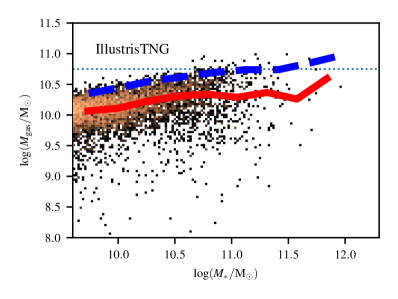
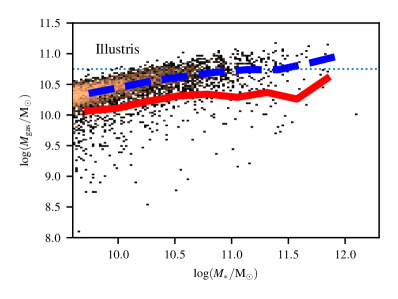
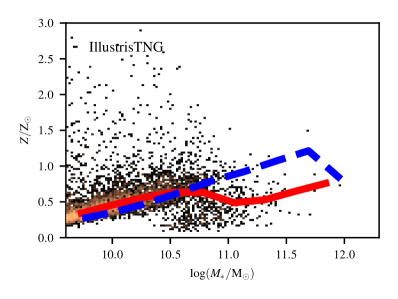
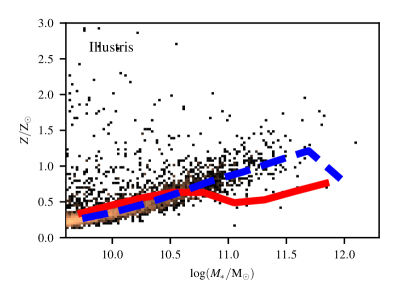
From Fig. 3, we saw that galaxies in IllustrisTNG tend to have lower dust masses than those in Illustris. Recall that in our model, the dust masses of the simulated galaxies are determined by their ISM cold gas-phase metal masses, so the differences in the values must be driven by differences in gas masses or/and metallicities. Fig. 5 shows dust mass (first row), gas mass (second row), and metallicity (third row) vs. stellar mass for IllustrisTNG (left column) and Illustris (right column); all galaxies with are plotted. The first row of Fig. 5 shows that at and , the IllustrisTNG galaxies have systematically lower dust masses (at fixed stellar mass) than the Illustris galaxies, and the difference is greater (a factor of a few) at . At and , the median values in IllustrisTNG and Illustris are and , respectively, a factor of 3 difference. The second row shows that this discrepancy is primarily due to the IllustrisTNG galaxies having lower gas masses than the Illustris galaxies at fixed stellar mass: at and , the ISM gas masses are a factor of lower in IllustrisTNG than in Illustris; the median values are and , respectively. The normalisation of the mass–metallicity relation at is also lower in IllustrisTNG than in Illustris (third row), but the magnitude of this discrepancy is much less than for the gas mass. Again for and , the median values for IllustrisTNG and Illustris are 0.49 and 0.92, a difference of only per cent. Consequently, the differences in gas mass are primarily responsible for the differences in dust mass between the two simulations.
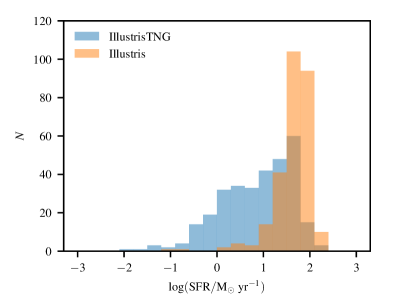

To further highlight the differences between the simulations that drive the differences in their SMG populations, Fig. 6 shows the distributions of SFR and for galaxies at with stellar masses of . Both the SFR (top panel) and dust mass (bottom panel) distributions of the galaxies in IllustrisTNG are systematically offset to lower values relative to those for Illustris galaxies. Even at this high stellar mass, the SMG selection tends to select only galaxies in the high-SFR or/and high- tails of the distributions (e.g. in our model, a galaxy with SFR and has mJy). Consequently, it is clear that the relative lack of SMGs in IllustrisTNG compared to Illustris occurs because there are significantly fewer galaxies in both the high-SFR and high- tails of the distributions in IllustrisTNG.
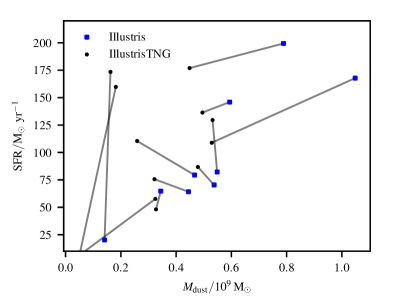
Given that it would be prohibitively computationally expensive to run many variants of the simulations considered here, systematically varying the sub-grid feedback models one-by-one, solely for the purpose of the present work, it is somewhat challenging to identify which change(s) to the feedback models cause IllustrisTNG to host significantly fewer SMGs than Illustris. However, since the simulations use identical initial conditions, it is instructive to consider how the properties of matched individual galaxies differ between the two simulations. For a given halo hosting an SMG with mJy in IllustrisTNG at a given redshift, we search Illustris for the halo at the same redshift whose center is closest to that of the IllustrisTNG halo and confirm that the two halos’ virial masses differ by less than 30 per cent; we do the same for the halos that host SMGs in Illustris. Fig. 7 presents this comparison for the SFR– plane for SMGs in the snapshot of IllustrisTNG (top panel) and Illustris (bottom panel). The top panel shows the positions of the IllustrisTNG SMGs in the SFR– plane as black points. Each of these galaxies is connected to the matched Illustris halo (blue points) by a line. The plot reveals that for all of the 6 SMGs in IllustrisTNG, the corresponding galaxy in Illustris has similarly high SFR and mass values. For individual galaxies, the median ratio of the stellar mass (not shown) in Illustris to that in IllustrisTNG is 0.94. The median SFR ratio is 0.81, and the median dust mass ratio is 1.1. Consequently, halos that host SMGs in IllustrisTNG tend to host galaxies with similarly high submm flux densities in Illustris.
The bottom panel of Fig. 7 shows a similar comparison but for the 79 SMGs in Illustris. In contrast with the top panel, this plot indicates that most of these galaxies have significantly lower SFR or/and values in IllustrisTNG. The median ratio of individual Illustris SMGs’ stellar masses (not shown) in IllustrisTNG to the corresponding value for Illustris is 0.76. The median ratios for the SFR, dust mass, and gas mass (not shown) are 0.12, 0.17, and 0.24, respectively, indicating that halos that host SMGs in Illustris typically host galaxies with order-of-magnitude-lower SFRs and dust masses in IllustrisTNG. Taken together, these plots demonstrate that some change(s) to the feedback model in IllustrisTNG relative to the Illustris model have caused most of the SMGs in Illustris to ‘drop out’ of the SMG population in IllustrisTNG, primarily by decreasing the gas mass and thus both SFR and dust mass. One of the primary drivers of the changes to the sub-grid models in IllustrisTNG relative to those in Illustris was the need to quench galaxies more effectively. Although this goal has been achieved in IllustrisTNG in the sense that a colour bimodality consistent with observations is obtained, it seems that the highest-mass galaxies are now being quenched slightly too early, causing the SMG counts to be under-predicted by IllustrisTNG.
4 Discussion
4.1 SMGs as a constraint on galaxy formation models
We have shown that the SMG number counts predicted using IllustrisTNG are significantly lower than observed, whereas those predicted using Illustris agree better with observations; the reasons for this difference are that massive () galaxies in IllustrisTNG tend to have significantly lower SFRs and dust masses (primarily due to having lower gas masses) than in Illustris. This difference holds not only statistically but also for matched halos in the two simulations. We conclude that one or more of the differences between the sub-grid feedback models employed in Illustris and IllustrisTNG – likely those for stellar feedback-driven outflows or/and AGN feedback – are responsible for these differences.
Overall, IllustrisTNG is more successful than Illustris at matching various more-general observational constraints. In particular, multiple lines of evidence indicated that the quenching of star formation in Illustris was too inefficient (see Nelson et al. 2015 for a detailed discussion), and the changes to the sub-grid feedback models were partially motivated by the need to rectify this issue (Weinberger et al., 2017, 2018; Nelson et al., 2018). The models employed in IllustrisTNG result in more-efficient quenching, yielding a bimodal colour distribution consistent with that observed. However, the resulting galaxy morphology–colour and morphology–size relations are inconsistent with observations, suggesting that further refinement of the quenching model is necessary (Rodriguez-Gomez et al., 2019). Our results provide additional support for this, suggesting that massive galaxies are too efficiently quenched in IllustrisTNG (but see Donnari et al. 2019 for a comparison of the quenched fractions at in Illustris and IllustrisTNG with observational constraints). This may indicate that the timing of quenching of massive galaxies is still not correct; we discuss this issue in more detail in the next subsection.
Our results reinforce the need to satisfy multiple observational constraints, such as the stellar mass function at different redshifts, before a model for the SMG population can be considered successful. In their hybrid ‘semi-empirical’ model, which obtained good agreement with observed SMG number counts, Hayward et al. (2013a) partially avoided the issues encountered here by matching the stellar mass functions and gas fractions of massive galaxies by construction; the ‘added value’ was provided by including the effects of mergers based on hydrodynamical simulations and performing radiative transfer to self-consistently compute submm fluxes. In contrast, models that have attempted to self-consistently reproduce the SMG population in an ‘ab initio’ manner have generally come up short because they do not reproduce the observed counts or other properties of SMGs, they employ simplifications that are unlikely to be valid in detail, or they incorporate IMF variations that are not well-motivated by theory or observations.
For example, in the large-volume simulation of Davé et al. (2010), the ‘SMGs’ (selected assuming a monotonic mapping between SFR and submm flux, which should not hold in detail due to the influence of dust mass on the SED shape) have SFRs a factor of less than observed. Also using a large-volume cosmological simulation, Shimizu et al. (2012) predicted SMG number counts in reasonable agreement with those observed, but, as discussed above, their simple model for computing the submm flux likely causes them to over-predict the submm flux and thus counts compared with more accurate calculations. Based on a single cosmological zoom simulation, Narayanan et al. (2015) claimed that ‘typical’ massive galaxies undergo a long-lived SMG phase and suggested that their model would predict counts consistent with those observed. However, the central galaxy in their simulation is a bright SMG ( mJy) only once the dust mass exceeds ; this value is greater than the dust masses inferred via SED modelling for any of the ALMA-resolved SMGs from da Cunha et al. (2015) and Miettinen et al. (2017). Note that their simulation did not include AGN feedback, which is believed to be a crucial ingredient to match other observational constraints, and our work suggests that the treatment of AGN feedback can significantly affect the predictions for the SMG population (see also Lacey et al. 2016). Moreover, subsequent works employing an improved version of the stellar feedback model used in Narayanan et al. (2015) have found that massive galaxies are insufficiently quenched (Su et al., 2019; Su et al., 2020). The lack of AGN feedback may explain why Narayanan et al. (2015) obtained such high dust masses (up to for the central galaxy at the end of the simulation, ). The semi-analytic models that are able to match SMG number counts either employ top-heavy IMFs (Baugh et al., 2005; Lacey et al., 2016) or ‘non-traditional’ scalings for stellar feedback-driven outflows (Safarzadeh et al., 2017), and it remains unclear whether these assumptions are consistent with other observational constraints and physical arguments.
Given the above, we conclude that producing SMGs in sufficient number with properties consistent with those observed remains a challenge for theorists, and further work, both observational and theoretical, regarding this population is sorely needed. Because reproducing the SMG population in a cosmological context is so difficult, they are useful for constraining sub-grid feedback models employed in cosmological simulations. With the exception of the galform SAM, SMGs are typically not considered when tuning existing sub-grid models or building new ones, perhaps because of the perceived complexity of predicting SMG number counts (assuming that radiative transfer calculations are required). However, this can change. The simple method for predicting submm flux that we have employed enables predicting SMG number counts from large-volume cosmological simulations with negligible additional computational expense. Consequently, the observed SMG number counts and redshift distribution can be used as additional constraints on feedback models that are sensitive to regions of the galaxy parameter space (namely, high mass, SFR, and redshift) that traditional comparisons tend not to probe. The utility of SMGs for constraining galaxy formation physics will continue to increase as the community observes larger samples of submm sources with ALMA to more accurately determine the number counts, especially at high flux densities and at high redshift. One particularly interesting application will be constraining variations in the IMF (as has been the case for more than a decade): if the next generation of large-volume simulations is able to reproduce many properties of the population of less extreme galaxies even better than is currently the case but still cannot reproduce the SMG number counts and redshift distribution, this may indeed be (indirect) evidence for IMF variation in SMGs.
4.2 Quenched galaxies at and their relationship to SMGs
As discussed above, our results suggest that massive () galaxies are being quenched too early in IllustrisTNG. It should thus be instructive to compare the quenched fractions of massive galaxies in the simulations with those observed. Donnari et al. (2019) show that the IllustrisTNG quenched fraction at this mass at is consistent with the observations of Muzzin et al. (2013), of order 50 per cent. Moreover, Valentino et al. (2019) find that the number density of quenched galaxies with at predicted by IllustrisTNG is broadly consistent with observational constraints (which, however, are uncertain at the order-of-magnitude level). Valentino et al. (2019) also show that the SMG number density at in IllustrisTNG predicted using our model is consistent with that observed. However, neither of the aforementioned studies cover the peak of the observed SMG redshift distribution, and is the crucial period during which the massive galaxy population transitions from being dominated by dusty star-forming galaxies to being dominated by quenched galaxies (fig. 2 of Martis et al., 2016). Using a significantly larger sample than previous studies, Sherman et al. (2020) find that IllustrisTNG predicts quenched fractions for galaxies at that are times greater than observed. If indeed IllustrisTNG overpredicts the quenched fraction as suggested by Sherman et al. (2020), we would naturally expect it to underpredict the observed SMG counts.
Given the above results, it is plausible that massive galaxies are being quenched somewhat too early in IllustrisTNG. However, the fact that the IllustrisTNG redshift distribution agrees well with that observed (see Fig. 2) seems inconsistent with this explanation. Moreover, since it is known that Illustris underpredicts the quenched fraction and does not exhibit a colour bimodality consistent with observations, it is unsurprising that the Illustris SMG redshift distribution peaks at much lower redshift than observed. Since IllustrisTNG underpredicts the submm counts by more than a magnitude, we wish to avoid over-interpreting the agreement in terms of the SMG redshift distribution, but these results clearly demonstrate that both the integral SMG number counts and redshift distribution serve as useful constraints on galaxy formation models.
4.3 Limitations and future work
We will now discuss some limitations and avenues for future work. The simplicity of our model for predicting submm flux densities is an advantage in that it enables predicting SMG number counts from large-volume cosmological simulations with negligible additional computational expense, but its simplicity also brings some limitations. First, the relation tends to over-predict the submm flux densities of fainter (i.e. lower-SFR or/and lower-) SMGs because in such galaxies, the underlying assumption that all of the star formation is obscured can break down. Thus, to apply Eq. 1 to such galaxies, it would be necessary to first estimate the fraction of the SFR that is obscured by dust and then use that value rather than the total SFR (for one possible method to do so, see Popping et al., submitted). Even better would be to perform dust radiative transfer directly on the simulated galaxies if we are convinced that the simulations resolve the clumpy structure of the ISM sufficiently well to make this meaningful. A useful intermediate step would be to re-derive a scaling relation for submm flux density using higher-resolution, more physical simulations than those originally used (Hayward et al., 2011, 2013a). We have already performed this type of verification on a limited set of simulations (Liang et al., 2018; Cochrane et al., 2019), but more work along these lines would be merited.
Both the simple scaling relations we use and full dust radiative transfer calculations critically depend on the dust mass (specifically the dust mass distribution in the case of the latter). In this work, we employ a cut in temperature-density space to define ‘ISM gas’ and then multiply the total metal mass in this ISM gas by a constant dust-to-metal ratio in order to approximate the dust mass. Using a ‘live’ dust model in the simulations (e.g. McKinnon et al., 2016, 2017) would potentially be a more accurate approach, especially since incorporation of dust destruction processes would alleviate the need to identify dust-containing ‘ISM gas’ with a simple cut like we have done here. Going further, treating the dust as a separate fluid (e.g. Hopkins & Lee, 2016; Seligman et al., 2019; McKinnon et al., 2019) may lead to non-negligible differences in the results of radiative transfer calculations (and thus any scaling relation we would derive from them) because e.g. if the dust and gas are not coupled, radiation-pressure-driven outflows may affect the ISM gas and dust differently and may even lead to different grain properties as a function of distance from the galaxy.
Moreover, we found in previous work that Illustris (and likely IllustrisTNG given that it has the same resolution) has less starbursts (outliers above the SFMS) than observed (Sparre et al., 2015). Sparre et al. (2017) demonstrated that resolution is one cause of the under-prediction of starbursts in Illustris by performing cosmological zoom simulations of mergers selected from Illustris, keeping the sub-grid model fixed, and finding order-of-magnitude higher SFR enhancements due to mergers in the zooms than in Illustris. The fact that Illustris matches the observed SMG counts reasonably well suggests that if starbursts were better resolved, the Illustris sub-grid model may actually lead to an over-prediction of the SMG counts. Conversely, the SMG counts predicted using the IllustrisTNG model may be in better agreement with observations if starbursts are resolved.
5 Conclusions
We have used a simple scaling relation derived in previous work to predict SMG number counts for the IllustrisTNG TNG100 and Illustris cosmological hydrodynamical simulations. Our principal conclusions are the following:
-
1.
The SMG number counts predicted based on IllustrisTNG are lower than those observed for mJy by an order of magnitude or more; in contrast, those based on Illustris are in excellent agreement with the observed counts for mJy and mJy, and they are only a factor of lower than observed for intermediate flux densities. Thus, Illustris fares better than IllustrisTNG in terms of reproducing the observed SMG population (which mainly corresponds to galaxies with at ) despite the latter better satisfying other observational constraints, such as the stellar mass function at , the galaxy colour bimodality, the massive galaxy quenched fraction, and the gas contents of low-redshift galaxies.
-
2.
The redshift distribution of SMGs in IllustrisTNG agrees well with that observed, with similar median redshifts (3.0 and 2.8, respectively), whereas that for Illustris is biased toward significantly lower redshift than observed (median ).
-
3.
The difference between the counts predicted based on the two simulations is due to massive galaxies in IllustrisTNG having both lower dust masses (primarily because of lower gas masses rather than lower metallicities) and SFRs at fixed stellar mass compared to Illustris.
-
4.
In both simulations, SMGs correspond to massive () galaxies with SFR and dust mass values well above the median value for galaxies at fixed mass and redshift. The high- and, to a lesser extent, high-SFR tails of the distributions are more populated in Illustris than in IllustrisTNG, which causes the former to host considerably more SMGs.
-
5.
By comparing the same halos in Illustris and IllustrisTNG, we find that halos that host SMGs in IllustrisTNG tend to host galaxies with similar SFR and values in Illustris. However, the converse does not hold: most of the SMG-hosting halos in Illustris tend to host galaxies with similar stellar masses but order-of-magnitude or more lower SFR and dust mass values in IllustrisTNG.
-
6.
Because the Illustris and IllustrisTNG simulations employ the same initial conditions modulo minor differences in the cosmology, this comparison indicates that the differences in the sub-grid models employed in the two simulations alter the predictions for the SMG population. Overall, our results demonstrate that the SMG population provides important constraints on galaxy formation models.
Our method entails negligible additional computational expense, so in the future, the observed SMG number counts and redshift distribution can be employed as useful ‘orthogonal’ constraints when developing and tuning the sub-grid feedback models that are necessarily employed in large-volume cosmological simulations, as has been done by some semi-analytic modelling groups for more than a decade.
Acknowledgements
We thank Shy Genel, Melanie Habouzit, and Stuart McAlpine for useful discussion. The Flatiron Institute is supported by the Simons Foundation. MS acknowledges support from the European Research Council under ERC-CoG grant CRAGSMAN-646955.
Data Availability
The data underlying this article will be shared on reasonable request to the corresponding author.
References
- Barger et al. (1998) Barger A. J., Cowie L. L., Sanders D. B., Fulton E., Taniguchi Y., Sato Y., Kawara K., Okuda H., 1998, Nature, 394, 248
- Baugh et al. (2005) Baugh C. M., Lacey C. G., Frenk C. S., Granato G. L., Silva L., Bressan A., Benson A. J., Cole S., 2005, MNRAS, 356, 1191
- Blain et al. (2004) Blain A. W., Chapman S. C., Smail I., Ivison R., 2004, ApJ, 611, 725
- Casey et al. (2014) Casey C. M., Narayanan D., Cooray A., 2014, Phys. Rep., 541, 45
- Chabrier (2003) Chabrier G., 2003, PASP, 115, 763
- Chakrabarti et al. (2008) Chakrabarti S., Fenner Y., Cox T. J., Hernquist L., Whitney B. A., 2008, ApJ, 688, 972
- Chapman et al. (2005) Chapman S. C., Blain A. W., Smail I., Ivison R. J., 2005, ApJ, 622, 772
- Cochrane et al. (2019) Cochrane R. K., et al., 2019, MNRAS, 488, 1779
- Cole et al. (2000) Cole S., Lacey C. G., Baugh C. M., Frenk C. S., 2000, MNRAS, 319, 168
- Cowley et al. (2015) Cowley W. I., Lacey C. G., Baugh C. M., Cole S., 2015, MNRAS, 446, 1784
- Cowley et al. (2019) Cowley W. I., Lacey C. G., Baugh C. M., Cole S., Frenk C. S., Lagos C. d. P., 2019, MNRAS, 487, 3082
- Daddi et al. (2007) Daddi E., et al., 2007, ApJ, 670, 156
- Davé et al. (2010) Davé R., Finlator K., Oppenheimer B. D., Fardal M., Katz N., Kereš D., Weinberg D. H., 2010, MNRAS, 404, 1355
- Davé et al. (2019) Davé R., Anglés-Alcázar D., Narayanan D., Li Q., Rafieferantsoa M. H., Appleby S., 2019, MNRAS, 486, 2827
- Davies et al. (2013) Davies L. J. M., Bremer M. N., Stanway E. R., Lehnert M. D., 2013, MNRAS, 433, 2588
- Donnari et al. (2019) Donnari M., et al., 2019, MNRAS, 485, 4817
- Dunlop et al. (2017) Dunlop J. S., et al., 2017, MNRAS, 466, 861
- Dwek (1998) Dwek E., 1998, ApJ, 501, 643
- Eales et al. (1999) Eales S., Lilly S., Gear W., Dunne L., Bond J. R., Hammer F., Fèvre O. L., Crampton D., 1999, ApJ, 515, 518
- Engel et al. (2010) Engel H., et al., 2010, ApJ, 724, 233
- Fontanot et al. (2007) Fontanot F., Monaco P., Silva L., Grazian A., 2007, MNRAS, 382, 903
- Genel et al. (2014) Genel S., et al., 2014, MNRAS, 445, 175
- González et al. (2011) González J. E., Lacey C. G., Baugh C. M., Frenk C. S., 2011, MNRAS, 413, 749
- Granato et al. (2000) Granato G. L., Lacey C. G., Silva L., Bressan A., Baugh C. M., Cole S., Frenk C. S., 2000, ApJ, 542, 710
- Hatsukade et al. (2013) Hatsukade B., Ohta K., Seko A., Yabe K., Akiyama M., 2013, ApJ, 769, L27
- Hayward (2012) Hayward C. C., 2012, PhD thesis, Harvard University
- Hayward (2013) Hayward C. C., 2013, MNRAS, 432, L85
- Hayward & Hopkins (2017) Hayward C. C., Hopkins P. F., 2017, MNRAS, 465, 1682
- Hayward & Smith (2015) Hayward C. C., Smith D. J. B., 2015, MNRAS, 446, 1512
- Hayward et al. (2011) Hayward C. C., Kereš D., Jonsson P., Narayanan D., Cox T. J., Hernquist L., 2011, ApJ, 743, 159
- Hayward et al. (2012) Hayward C. C., Jonsson P., Kereš D., Magnelli B., Hernquist L., Cox T. J., 2012, MNRAS, 424, 951
- Hayward et al. (2013a) Hayward C. C., Narayanan D., Kereš D., Jonsson P., Hopkins P. F., Cox T. J., Hernquist L., 2013a, MNRAS, 428, 2529
- Hayward et al. (2013b) Hayward C. C., Behroozi P. S., Somerville R. S., Primack J. R., Moreno J., Wechsler R. H., 2013b, MNRAS, 434, 2572
- Hayward et al. (2018) Hayward C. C., et al., 2018, MNRAS, 476, 2278
- Henriques et al. (2013) Henriques B. M. B., White S. D. M., Thomas P. A., Angulo R. E., Guo Q., Lemson G., Springel V., 2013, MNRAS, 431, 3373
- Hickox et al. (2012) Hickox R. C., et al., 2012, MNRAS, 421, 284
- Hodge et al. (2013) Hodge J. A., et al., 2013, ApJ, 768, 91
- Hopkins & Lee (2016) Hopkins P. F., Lee H., 2016, MNRAS, 456, 4174
- Hughes et al. (1998) Hughes D. H., et al., 1998, Nature, 394, 241
- James et al. (2002) James A., Dunne L., Eales S., Edmunds M. G., 2002, MNRAS, 335, 753
- Karim et al. (2013) Karim A., et al., 2013, MNRAS, 432, 2
- Kennicutt (1998) Kennicutt R. C., 1998, ApJ, 498, 541
- Kroupa (2001) Kroupa P., 2001, MNRAS, 322, 231
- Lacey et al. (2016) Lacey C. G., et al., 2016, MNRAS, 462, 3854
- Lanz et al. (2014) Lanz L., Hayward C. C., Zezas A., Smith H. A., Ashby M. L. N., Brassington N., Fazio G. G., Hernquist L., 2014, ApJ, 785, 39
- Liang et al. (2018) Liang L., Feldmann R., Faucher-Giguère C.-A., Kereš D., Hopkins P. F., Hayward C. C., Quataert E., Scoville N. Z., 2018, MNRAS, 478, L83
- Lovell et al. (2020) Lovell C. C., Geach J. E., Davé R., Narayanan D., Li Q., 2020, arXiv e-prints, p. arXiv:2006.15156
- Lu et al. (2011) Lu Y., Mo H. J., Weinberg M. D., Katz N., 2011, MNRAS, 416, 1949
- Lu et al. (2014) Lu Y., et al., 2014, ApJ, 795, 123
- Ma et al. (2015) Ma J., et al., 2015, ApJ, 812, 88
- Marinacci et al. (2014) Marinacci F., Pakmor R., Springel V., 2014, MNRAS, 437, 1750
- Marrone et al. (2018) Marrone D. P., et al., 2018, Nature, 553, 51
- Martis et al. (2016) Martis N. S., et al., 2016, ApJ, 827, L25
- McAlpine et al. (2019) McAlpine S., et al., 2019, MNRAS, 488, 2440
- McKinnon et al. (2016) McKinnon R., Torrey P., Vogelsberger M., 2016, MNRAS, 457, 3775
- McKinnon et al. (2017) McKinnon R., Torrey P., Vogelsberger M., Hayward C. C., Marinacci F., 2017, MNRAS, 468, 1505
- McKinnon et al. (2019) McKinnon R., Kannan R., Vogelsberger M., O’Neil S., Torrey P., Li H., 2019, arXiv e-prints, p. arXiv:1912.02825
- Michałowski et al. (2012) Michałowski M. J., et al., 2012, MNRAS, 426, 1845
- Michałowski et al. (2017) Michałowski M. J., et al., 2017, MNRAS, 469, 492
- Miettinen et al. (2017) Miettinen O., et al., 2017, A&A, 606, A17
- Miller et al. (2015) Miller T. B., Hayward C. C., Chapman S. C., Behroozi P. S., 2015, MNRAS, 452, 878
- Miller et al. (2020) Miller T. B., Chapman S. C., Hayward C. C., Behroozi P. S., Bradford M., Willott C. J., Wagg J., 2020, ApJ, 889, 98
- Muñoz Arancibia et al. (2015) Muñoz Arancibia A. M., Navarrete F. P., Padilla N. D., Cora S. A., Gawiser E., Kurczynski P., Ruiz A. N., 2015, MNRAS, 446, 2291
- Muratov et al. (2015) Muratov A. L., Kereš D., Faucher-Giguère C.-A., Hopkins P. F., Quataert E., Murray N., 2015, MNRAS, 454, 2691
- Murray et al. (2005) Murray N., Quataert E., Thompson T. A., 2005, ApJ, 618, 569
- Muzzin et al. (2013) Muzzin A., et al., 2013, ApJ, 777, 18
- Naiman et al. (2018) Naiman J. P., et al., 2018, MNRAS,
- Narayanan et al. (2010) Narayanan D., Hayward C. C., Cox T. J., Hernquist L., Jonsson P., Younger J. D., Groves B., 2010, MNRAS, 401, 1613
- Narayanan et al. (2015) Narayanan D., et al., 2015, Nature, 525, 496
- Nelson et al. (2015) Nelson D., et al., 2015, Astronomy and Computing, 13, 12
- Nelson et al. (2018) Nelson D., et al., 2018, MNRAS, 475, 624
- Noeske et al. (2007) Noeske K. G., et al., 2007, ApJ, 660, L43
- Ono et al. (2014) Ono Y., Ouchi M., Kurono Y., Momose R., 2014, ApJ, 795, 5
- Pillepich et al. (2018a) Pillepich A., et al., 2018a, MNRAS, 473, 4077
- Pillepich et al. (2018b) Pillepich A., et al., 2018b, MNRAS, 475, 648
- Popping et al. (2017) Popping G., Somerville R. S., Galametz M., 2017, MNRAS, 471, 3152
- Primack (2012) Primack J. R., 2012, Annalen der Physik, 524, 535
- Rodriguez-Gomez et al. (2019) Rodriguez-Gomez V., et al., 2019, MNRAS, 483, 4140
- Safarzadeh et al. (2016) Safarzadeh M., Hayward C. C., Ferguson H. C., Somerville R. S., 2016, ApJ, 818, 62
- Safarzadeh et al. (2017) Safarzadeh M., Lu Y., Hayward C. C., 2017, MNRAS, 472, 2462
- Schaye et al. (2015) Schaye J., et al., 2015, MNRAS, 446, 521
- Schmidt (1959) Schmidt M., 1959, ApJ, 129, 243
- Scoville (2003) Scoville N., 2003, Journal of Korean Astronomical Society, 36, 167
- Seligman et al. (2019) Seligman D., Hopkins P. F., Squire J., 2019, MNRAS, 485, 3991
- Sherman et al. (2020) Sherman S., et al., 2020, MNRAS, 499, 4239
- Shimizu et al. (2012) Shimizu I., Yoshida N., Okamoto T., 2012, MNRAS, 427, 2866
- Sijacki et al. (2007) Sijacki D., Springel V., Di Matteo T., Hernquist L., 2007, MNRAS, 380, 877
- Sijacki et al. (2015) Sijacki D., Vogelsberger M., Genel S., Springel V., Torrey P., Snyder G. F., Nelson D., Hernquist L., 2015, MNRAS, 452, 575
- Simpson et al. (2015) Simpson J. M., et al., 2015, ApJ, 807, 128
- Smail et al. (1997) Smail I., Ivison R. J., Blain A. W., 1997, ApJ, 490, L5
- Smith & Hayward (2015) Smith D. J. B., Hayward C. C., 2015, MNRAS, 453, 1597
- Smith & Hayward (2018) Smith D. J. B., Hayward C. C., 2018, MNRAS,
- Smith et al. (2017) Smith D. J. B., Hayward C. C., Jarvis M. J., Simpson C., 2017, MNRAS, 471, 2453
- Somerville et al. (2012) Somerville R. S., Gilmore R. C., Primack J. R., Domínguez A., 2012, MNRAS, 423, 1992
- Sparre et al. (2015) Sparre M., et al., 2015, MNRAS, 447, 3548
- Sparre et al. (2017) Sparre M., Hayward C. C., Feldmann R., Faucher-Giguère C.-A., Muratov A. L., Kereš D., Hopkins P. F., 2017, MNRAS, 466, 88
- Springel (2010) Springel V., 2010, MNRAS, 401, 791
- Springel & Hernquist (2003) Springel V., Hernquist L., 2003, MNRAS, 339, 289
- Springel et al. (2005) Springel V., Di Matteo T., Hernquist L., 2005, MNRAS, 361, 776
- Springel et al. (2018) Springel V., et al., 2018, MNRAS, 475, 676
- Su et al. (2019) Su K.-Y., et al., 2019, MNRAS, 487, 4393
- Su et al. (2020) Su K.-Y., et al., 2020, MNRAS, 491, 1190
- Thompson et al. (2005) Thompson T. A., Quataert E., Murray N., 2005, ApJ, 630, 167
- Toft et al. (2014) Toft S., et al., 2014, ApJ, 782, 68
- Torrey et al. (2012) Torrey P., Vogelsberger M., Sijacki D., Springel V., Hernquist L., 2012, MNRAS, 427, 2224
- Torrey et al. (2014) Torrey P., Vogelsberger M., Genel S., Sijacki D., Springel V., Hernquist L., 2014, MNRAS, 438, 1985
- Trayford et al. (2017) Trayford J. W., et al., 2017, MNRAS, 470, 771
- Valentino et al. (2019) Valentino F., et al., 2019, arXiv e-prints, p. arXiv:1909.10540
- Vogelsberger et al. (2013) Vogelsberger M., Genel S., Sijacki D., Torrey P., Springel V., Hernquist L., 2013, MNRAS, 436, 3031
- Vogelsberger et al. (2014a) Vogelsberger M., et al., 2014a, MNRAS, 444, 1518
- Vogelsberger et al. (2014b) Vogelsberger M., et al., 2014b, Nature, 509, 177
- Wang et al. (2019) Wang L., Pearson W. J., Cowley W., Trayford J. W., Béthermin M., Gruppioni C., Hurley P., Michałowski M. J., 2019, A&A, 624, A98
- Weinberger et al. (2017) Weinberger R., et al., 2017, MNRAS, 465, 3291
- Weinberger et al. (2018) Weinberger R., et al., 2018, MNRAS, 479, 4056
- Wilkinson et al. (2017) Wilkinson A., et al., 2017, MNRAS, 464, 1380
- da Cunha et al. (2015) da Cunha E., et al., 2015, ApJ, 806, 110