COSSU
*Corresponding author:
Replacing wakes with streaks in wind turbine arrays
Abstract
[Summary]Wind turbine wakes negatively affect downwind turbines in wind farms reducing their global efficiency. The reduction of wake-turbine interactions by actuating control on yaw angles and induction factors is an active area of research. In this study, the capability of spanwise-periodic rows of wind turbines with tilted rotors to reduce negative wake-turbine interactions is investigated through large-eddy simulations. It is shown that, by means of rotor tilt, it is possible to replace turbine far wakes with high-speed streaks where the streamwise velocity exceeds the freestream velocity at hub height. Considering three aligned rows of wind turbines, it is found that the global power extracted from the wind can be increased by tilting rotors of the upwind turbine rows, similarly to what already known for the case of a single column of aligned turbines. It is further shown that global tilt-induced power gains can be significantly increased by operating the tilted turbines at higher induction rates. Power gains are further increased for higher ratios of rotor diameters and turbine spacings to the boundary layer height. All these findings are consistent with those of previous studies where streamwise streaks were artificially forced by means of spanwise-periodic rows of wall-mounted roughness elements in order to control canonical boundary layers for drag-reduction applications.
\jnlcitation\cname(\cyear2020), \ctitleReplacing wakes with streaks in wind turbine arrays, \cjournalWind En., \cvol2020;00:1–12.
keywords:
wind farm control, wake redirection, boundary layer streaks, wind energy1 Introduction
In wind farms, turbines impacted by wakes generated by upwind turbines experience significant reductions in the mean available wind power and increased turbulence levels.1, 2 A significant number of design and control strategies have been proposed to alleviate these negative effects among which great interest has been recently attracted by the approach where the rotor yaw angle is controlled in order to deflect the wake away from downwind turbines. In yawed turbines, indeed, the misalignment of the mean thrust force and wind direction induces a pair of vertically-stacked counter-rotating vortices which increasingly deflect the wake away from the mean wind axis in the horizontal plane.3, 4, 5 The thrust-wind misalignment reduces the amount of power produced by the yawed turbine but this power loss can be more than compensated by the power gain of downwind turbines induced by the wake deflection.6, 7
In complement to yaw control, which is associated to wake deflections in the horizontal plane, it has been recently shown that turbine wakes can be deflected in the vertical direction by acting on the rotor tilt angle8, 9, 10 and that the power gain in downwind turbines can be larger than the power reduction associated to the tilt of upwind turbines11, 12, 13. Best performances were obtained with positive tilt angles for which the wake is deflected towards the ground. Furthermore, power gains obtained by means of tilt were found to be potentially larger than those associated to yaw control because the downwash associated to the positive tilt exploits the vertical wind shear by displacing downwards higher-altitude higher-velocity fluid towards downwind turbines therefore increasing their available wind power.
Despite its potential, however, tilt control has been the subject of only a few studies probably because in most of installed wind turbines, which have upwind-aligned rotors, positive tilt would lead the rotor to hit the tower. However, positive tilt capabilities are compatible with turbines with downwind-aligned rotors which are being revisited as a very promising concept because they are resilient in extreme wind situations and are compatible with highly flexible very large blades. Indeed, downwind-aligned turbines admit favourable distributions of blade bending loads and benefit from passive yaw control capabilities which are critical in off-grid situations experienced in extreme wind conditions.14, 15
Previous investigations of tilt control have mostly considered the effect of tilting rotors of upwind turbines in an isolated column of aligned turbines; for the case of two aligned turbines,11 the best power gains were obtained for positive tilt angles and, for the case of three aligned turbines 12 when both upwind turbines were tilted. A more recent study,13 based on a reduced wind-farm model, has considered global annual power gains (for selected wind roses) of model wind farms where tilt was applied only to peripheral turbines with fixed tilt setting (not depending on the wind direction). It was found that tilt could produce gains of annual power production that were larger for 5MW wind turbines than for 13MW wind turbines. The best gains were obtained for tilt angles smaller than what was found for isolated-column configurations (actually, it was found that a power reduction was experienced for ).
The present study complements the few previous investigation on tilt control by further considering the effect of tilt applied to spanwise-periodic rows of wind turbines. In this case a spanwise-periodic distribution of counter-rotating quasi-streamwise vortices is forced by the tilted turbines inducing a spanwise-periodic distribution of upwash and downwash flows.
Spanwise-periodic distributions of counter-rotating vortices, when immersed in shear flows, are known to induce quasi-streamwise streaks, i.e. streamwise-elongated spanwise-alternating high-speed and low-speed regions, which are ubiquitous in transitional and fully developed turbulent shear flows.16, 17, 18, 19, 20 The streaks are amplified via the lift-up effect21, 22, 17 which is a non-modal amplification mechanism23, 24, 25, 26, 27, 19 that has been exploited as a natural control amplifier for flow-control applications. Artificially forced streaks have indeed been used to delay transition in laminar boundary layers,28, 29 to reduce pressure drag on idealized car models at high Reynolds numbers,30 to reduce the turbulent friction drag in pipes31 and to suppress vortex shedding in bluff-body wakes.32, 33, 34 In this context, spanwise-periodic rows of tilted wind turbines display a strong similarity with spanwise-periodic rows of roughness elements used in previous experimental studies of flow control by streaks35, 36, 29, 37, 38 which, similarly to the tilted turbines, produce spanwise-periodic distributions of wakes and counter-rotating streamwise vortices. In these flow-control studies it was found that the wakes of the roughness elements, were replaced, further downstream, by high-speed streaks, i.e. regions of streamwise velocity excess. We are interested in verifying if a similar effect can be observed in the atmospheric surface layer with forcing given by tilted turbines.
In the present study we will therefore determine if high-speed coherent streaks can be forced by spanwise-periodic rows of wind turbines with tilted rotors and if the total power of model wind farms can be increased by forcing these spanwise-periodic coherent streaks. The effects of changing the tilt angle and the induction factor of the tilted turbines will be also investigated as well as that of increasing the relative size and spacing of the wind turbines with respect to the boundary layer thickness. These effects will be explored by means of large-eddy simulations where wind turbines are modeled as actuator-disks.
The paper is organized as follows. The formulation of the problem at hand is introduced in §2 and the streaky flow forced by a single spanwise row of turbines is described in §3. The effect of forcing the streaks on the power production of three rows of wind turbines is presented in §4 where the effect of turbine size, tilt angle and induction factor are discussed. The main results are summarized and further discussed in §5. Additional details on used numerical methods are provided in Appendix A.
2 Problem formulation
We consider the flow developing around a set of wind turbines immersed in a turbulent boundary layer. The turbines are aligned with the mean wind speed at hub height (zero yaw angle). This complex turbulent flow is simulated by means of large-eddy simulations implemented in the Simulator for On/Offshore Wind Farm Applications (SOWFA39) where the flow is modeled with the filtered Navier-Stokes equations under the usual Boussinesq approximation for the effects of density variations. Subgrid-scale stresses are modeled with the Smagorinsky model40 and it is assumed that near the ground the flow adheres to the Monin-Obhukov similarity theory for turbulent boundary layers above rough surfaces41 by implementing appropriate stress boundary conditions.42 Slip boundary conditions are enforced at the top plane of the solution domain. Additional details about the used numerical methods and the discretization parameters used in the simulations are provided in Appendix A.
We will limit our analysis to the case of an isothermal flow (neutral boundary layer) driven by a constant pressure gradient neglecting the effect of Coriolis acceleration. The results obtained under these strong assumptions are a reasonable approximation of those that would have been obtained in a neutral atmospheric boundary layer if the wind turbines remain confined to the atmospheric surface layer.43, 44, 1
Inflow boundary conditions for the simulations are generated by means of ‘precursor’ simulations of the turbulent boundary layer in the absence of wind turbines45, 46, 39 where periodic boundary conditions are enforced in the horizontal plane with - streamwise-spanwise periodicity (the extension of the domain). Once a fully developed statistically stationary regime is attained, the temporal evolution of flow variables on the inflow plane is stored and then used as inflow boundary condition for the simulations with the wind turbines. In this way, it is possible to expose the turbines to realistic inflow turbulent wind conditions. In this study, all the simulations with turbines make use of precursor simulations run in the same numerical domain. Results are presented for domains of height H=1km with ranging from 3km to 6km and from 500m to 3km and spatial resolutions ranging from 14m to 21.4m (see Appendix A). The domains are not large and long enough to avoid a potential locking of boundary layer large-scale motions because of the periodic boundary conditions47, 48 but they are well adapted to illustrate the averaged effects of rotor tilt.
The effect of wind turbines on the flow is accounted for by means of the actuator disk model (ADM) which has been shown to correctly reproduce the main characteristics of turbines wakes except in the wake formation region.49 In the chosen ADM approach the forces exerted by turbines blades on the fluid are averaged over the whole rotor disk. Following previous investigations,43, 44, 50 the total force exerted by each turbine on the fluid is assumed to be , where is the disk-based thrust coefficient, is the unit vector normal to the rotor, is the rotor-normal wind velocity component averaged over the rotor surface of area and is the rotor diameter. The force is assumed to be uniformly distributed over the rotor surface and the effects of wake rotation are neglected. Turbines are assumed to always operate in Region II. The power produced by each turbine is where with the coefficient accounting with grid effects and the power lost by wing-tip vortices51, 50 (the results presented in this paper, where ratios of powers are examined, do not depend on the specific value chosen for ). The optimal Betz value maximizing the power output of an isolated ideal turbine in the absence of tilt and yaw is obtained for43, 44, 50 .
3 Forcing streaks by tilting rotors
Simulation setting
We first consider the effect of tilt on the wakes of a (single) spanwise-periodic row of wind turbines. The flow is simulated in a domain extending 1km in the vertical direction (which corresponds to the boundary layer thickness H) and 6km x 0.5km (i.e. 6H x H/2) in the streamwise and spanwise directions respectively. The relatively short lateral extension of the domain enables to analyze ‘pure’ coherent structures generated by tilted rotors excluding their interactions with boundary layer large-scale motions which have larger spanwise spacings (typically in the range ). The lateral domain extension corresponds to the spacing of the turbines of the row. The actuator disk dimensions (diameter , hub height ) are based on the NREL 5-MW turbine model52 but, unlike that model, turbines are forced to operate in Region II for all wind speeds. The chosen ratio is equal to the one used in previous investigations of streak generation by a row of cylindrical roughness elements of diameter .35, 29, 37, 38 Turbines are located at () downstream of the inflow boundary and they operate at the constant , a value consistent with those observed in real wind farms.53, 54, 55 Wakes are simulated up to downstream of the turbines.
The precursor simulation is run in the chosen domain with periodic boundary conditions allowing the complete development of the turbulent boundary layer in the absence of wind turbines with the applied constant pressure gradient . The mean incoming wind velocity at hub height is . The velocity and pressure fields on the inflow (west) plane are stored and used to rerun the simulation in the presence of the wind turbines which are operated starting from . Statistics are accumulated starting from when the wakes are well developed, up to . First, the reference case is run where the rotor has the usual small negative tilt enforced to prevent any impact of the blades on the tower.52 Then, the runs are repeated with unchanged parameters except for the rotor tilt angle .
Streaks formation and wake reversal
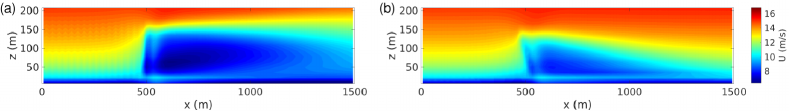
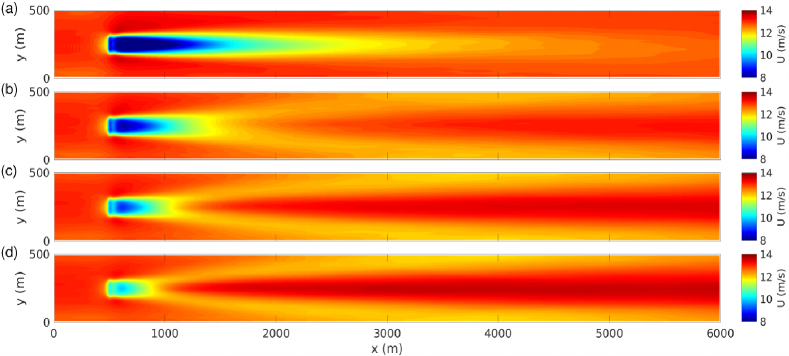
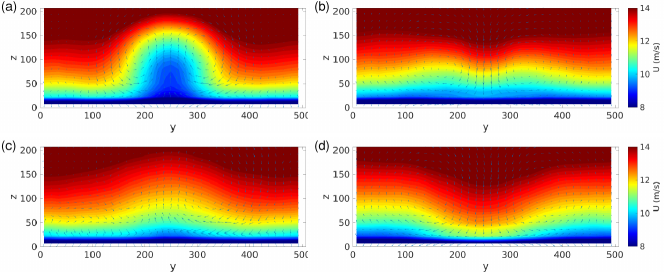
From Fig. 1, showing the time-averaged streamwise velocity field in the longitudinal vertical plane through the rotor axis, it can be verified that a positive rotor tilt induces the deflection of the wake towards the ground which strongly reduces its streamwise extent when compared to the reference case. The wake-shortening effect is also clearly visible in Fig. 2 representing the time-averaged streamwise velocity field in the horizontal plane at hub height for the reference case and for increasing tilt angles. From Fig. 2 it can also be seen that for sufficiently large tilt angles the wakes are not only shortened but replaced by high-velocity regions (high-speed streaks) where the mean streamwise velocity is higher than the mean freestream velocity at hub height (). The process by which wakes are replaced by high-speed streaks can be appreciated in Fig. 3 where the time-averaged velocity fields of the reference and positive tilt cases are shown in the cross-stream planes situated and downwind of the turbine, respectively. The two counter-rotating vortices produced by the positive rotor tilt are clearly visible just as the associated downwash which produces the wake deflection towards the ground and its replacement by the high-speed streak further downstream.
From Figs. 2 and 3 is can be seen that in the middle- and far-wake regions not only the low-speed region (wake) is replaced by high-speed streaks but low-speed fluid is repositioned laterally in the streamwise corridors between the turbines (recall that a single spanwise wavelength is shown in the figures). Also, the spanwise size of the wakes and of the high-speed streaks, which are of the order of the rotor diameter in the near wake increase towards (half the turbine separation) in the far wake, as can also be appreciated from Fig. 2. These features are similar to those observed when streaks are forced by roughness elements in canonical laminar and turbulent flat-plate boundary layers56, 35, 38 where high-speed streaks emerge downwind of the roughness elements and low-speed streaks replace the high-speed regions in the corridors.
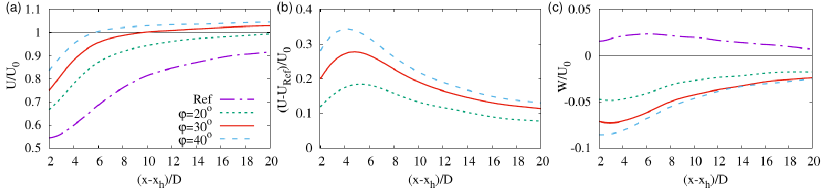
From Fig. 4 it can be seen that the downwash associated to the counter-rotating vortices generated by the tilted rotors decays downstream, just as observed in flat-plate boundary layers. However, in the present case the rotor tilt has two separate important effects on the wake in what concerns streamwise velocities. The first, direct, effect of tilt is the reduction of the initial velocity deficit in the wake associated to the reduction of the streamwise component of the thrust vector, which induces reductions of the extracted wind power. The second, indirect, effect is that the forced counter-rotating vortices redistribute momentum in the vertical direction increasing speeds downstream of the rotor where higher-located higher-speed fluid is displaced downwards (this is the famous lift-up effect17). It is this latter effect that makes possible the replacement of the wake by high-speed streaks where the streamwise velocity is higher than the incoming mean flow speed at hub height.
Fig. 4 also reveals that the tilt-induced maximum absolute gain in streamwise velocity with respect to the reference case is obtained roughly four diameters, i.e. one spanwise wavelength downstream of the turbine and is relevant up to downstream. The downstream region where best power gains could be obtained () is therefore situated upstream of that where U is highest () or even that where U exceeds the freestream velocity ( for ) because power gains depend on and not simply on .
4 Forcing high-speed streaks to increase global efficiency
4.1 Influence of tilt angles and thrust coefficients on power gains
Simulation setting
We now consider the potential power gains that can be obtained by tilting rotors of upwind turbines in multiple-rows configurations. Preliminary tests show that, similarly to the case of two turbines,11 moderate global power gains can be obtained with two rows of wind turbines by tilting the rotors in the upwind row. A more recent study has shown that, in the case of three turbines aligned in a single column, higher power gains could be obtained when both the upwind and the middle rotors are tilted.12 New simulations are therefore performed with three rows of turbines with spanwise spacing in each row and wind-aligned corresponding turbines. Turbines rows are spaced by in the streamwise direction (as in previous studies of tilt control of a single column of two and three turbines11, 12). This value is large enough to attain sufficient absolute values of the mean streamwise velocity in the wake of upwind turbines (see Fig. 4) but it does not exceed by a too large amount the value () where the extra velocity recovery due to the tilt is maximum (see Fig. 4).
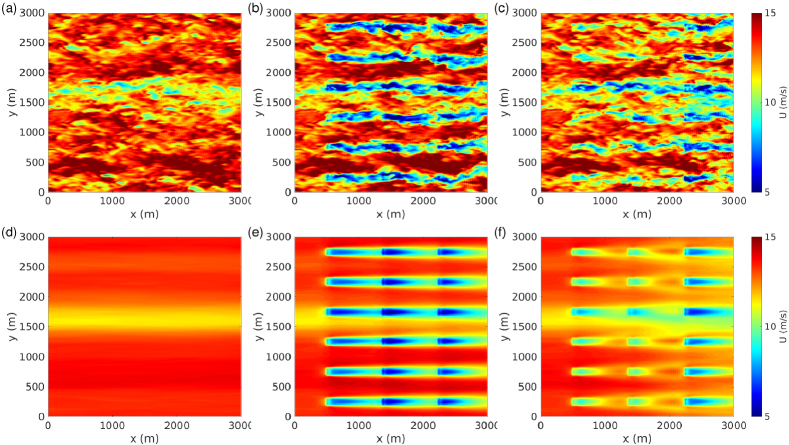
Simulations are run in a domain with the same height (1km) and pressure gradient as in §3 but with a different 3km x 3km horizontal extension which enables the development of large-scale motions in the turbulent boundary layer18, 19 allowing for reliable statistics of turbines power production. A precursor simulation is run in the same domain and used to generate the inflow boundary conditions that are used for the simulation in the presence of the turbines. The presence of a large-scale coherent boundary layer low-speed streak can indeed be clearly discerned in Fig. 5.
Simulations are then performed in the presence of the 3 aligned rows of 6 turbines which can be accommodated in the simulation domain (see Fig. 5) with the chosen streamwise and spanwise spacing (but an infinite number of turbines is effectively considered in the spanwise direction because of the spanwise-periodic boundary conditions). The upwind row is situated downstream of the inflow boundary where the mean incoming wind velocity at hub height is . Statistics are accumulated from t=24000s (more than one hour after the turbines are switched on at t=20000s) to t=30000s.
First, the reference case is simulated with all turbines operating in the same conditions (, ). For this case, the usual situation where the wake of upwind turbines strongly reduces the mean wind seen by the aligned downwind turbines is observed, as shown in Figs.5 and 5. Preliminary computations (not shown) indicate that the best power gains are obtained when the rotors of both the upwind and the middle rows of turbines are tilted. The runs are therefore repeated with all parameters unchanged except for the rotor tilt of the upwind and middle rows turbines. Results are shown for the case where they are tilted by the same angle , for selected values of .
Influence of tilt control angle at fixed thrust coefficient
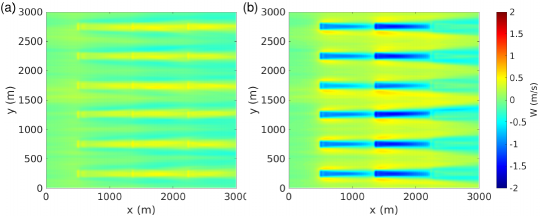
Instantaneous and mean streamwise velocity fields are reported in Fig. 5 in the plane at hub height for the precursor simulation, the reference case and the case with tilt of the rotors of the upwind and middle turbine rows. Mean vertical velocity fields at hub height are reported in Fig. 6. From these figures it can be seen that, as already observed in the case of three aligned turbines12 and two aligned rows of roughness elements in a plane channel,37 the effects of rotor tilt in the two upwind rows are almost additive resulting in vertical downwards velocities (downwash) and wake recoveries which are stronger downwind of the middle row of turbines than downwind of the front (most upwind) row.
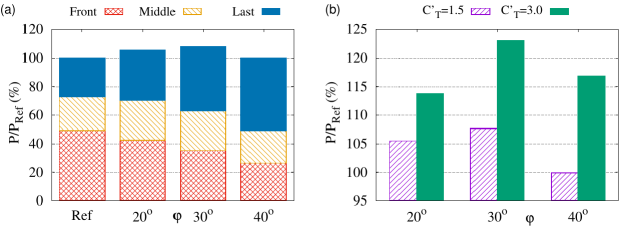
In Fig. 7 the mean total power produced by the three rows of turbines when rotors of the two upwind rows are tilted is compared to the mean power produced in the reference condition. From this figure it is seen that the effect of increasing the positive rotor tilt is to decrease the mean power extracted by the most upwind row of turbines (because of the reduction of the normal momentum flux trough the tilted rotor) and to increase that of the last (most downwind) row of turbines (because of the increase of the mean streamwise velocity on the rotor). A milder variation is observed for the power extracted by the middle row where the two contrasting effects are at play. Overall, the beneficial effects overcome the detrimental effect of the tilt resulting in a total power increase with respect to the reference case, which is maximal for .
Influence of an increased induction in tilted turbines
We note that an increase of from 1.5 to 3 in the tilted turbines results in an increased vertical component of the thrust enhancing the streamwise vortices. The simulations with tilted rotors have been therefore repeated by operating the tilted rotors at while leaving the turbines with non-tilted rotor at the nominal . The results, reported in Fig. 7, show that operation of the tilted rotors at leads to a substantial increase of the tilt-induced power gain, with an almost tripled maximum power gain obtained near . This indicates that there certainly is room for further enhancement of tilt-induced power gains by optimizing combinations in wind farm operation. We leave such an optimization for future study.
4.2 Influence of the relative rotor size on power gains
The computation of optimal perturbations of canonical turbulent wall-bounded flows indicates that the largest energy amplifications of coherent streamwise streaks can be attained when the spanwise spacing of the streaks and of the vortices used to force them is of a few boundary layer thicknesses,27, 57, 58 requiring roughness elements with diameters of the order of the boundary layer thickness.38, 30 The results reported in the previous sections, obtained with actuator disks based on the NREL 5-MW turbine dimensions, correspond to a ratio which is an order of magnitude smaller than optimal ratios. In fact, optimal ratios can not be considered in the present setting where the boundary layer thickness coincides with the vertical extension of the solution domain where (horizontal) slip boundary conditions are enforced. However, even if relatively far from the values of optimal spanwise spacing, a moderate increase of the amplification of the streaks issued from quasi-streamwise vortices of given energy can be expected if the ratio is, even moderately, increased.
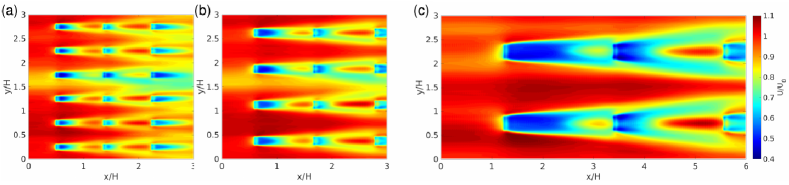
We therefore consider two reasonably larger ratios (approximately corresponding to the DTU 10-MW turbine model59 with immersed in a 1km-thick boundary layer) and for three rows of turbines keeping constant to and their relative spanwise and streamwise spacing. Additional simulations are therefore performed with 4x3 turbines with in the 3km x 3km x 1km domain considered in §4.1 and with 2x3 turbines with in an additional 6km x 3km x 1km domain as shown in Fig. 8. Building on the previous findings, the same tilt angle is enforced on all rotors of the upwind and middle row turbines which are operated with , while the most downwind row is operated at reference values.
The additive wake-shortening effect induced by rotor tilts is seen to operate similarly for all the considered ratios, as the relative spanwise and streamwise turbine spacing have been kept constant. As anticipated, mean power gains are increased for larger ratios, as reported in Fig. 9, up to a maximum observed power gain exceeding 40% for the largest considered value of . Despite their very encouraging nature, however, the latter results should be taken with care because for , turbines are no more confined into the logarithmic region of the considered pressure-driven boundary layer which has a structure similar to that of the atmospheric surface layer. In this case, streak amplifications cease to be ‘universal’ but depend on the particular structure of the flow in the outer layer. Additional work is therefore needed to confirm and extend the results obtained for the largest ratio in more realistic atmospheric boundary layer settings.

5 Conclusion
This main goals of this study were to determine if rotor tilt in spanwise-periodic rows of wind turbines could be used to replace the (low speed) wakes of the turbines with high-speed streaks and determine the global power gains that could be obtained by forcing these streaks in order to enhance the power production of downwind turbines.
It is found that spanwise-periodic rows of wind turbines with tilted rotors can be effectively used to force spanwise-periodic distributions of quasi-streamwise vortices which, for sufficiently large positive tilt angles, are able to ‘reverse’ the wakes by replacing them with high-speed streaks. The observed wake-reversal is similar to that documented in previous investigations where spanwise-periodic rows of cylindrical roughness elements were used to force streaks in canonical flat-plate boundary layers.56, 35, 29, 38, 30 However, while streamwise velocities higher than the mean incoming freestream velocity at hub height can be found in the far wake, the maximum of the mean streamwise velocity recovery induced by the rotor tilt is attained more upstream ( downwind of the rotor).
The analysis of the power production of three spanwise-periodic rows of aligned wind turbines confirms that the total mean power can be increased by tilting the rotors in the front (upwind) and the middle turbine rows, with best performances obtained when for the considered configurations. The relative power gains obtained with actuator disks with same dimensions as the NREL 5-MW turbines and operated at are similar to those found for an isolated column of three NREL 5MW turbines12 by including, unlike in this study, the effects of wake rotation, radial distribution of the aerodynamics forces on the blades, Coriolis acceleration and the capping inversion. This demonstrates the robustness of the mechanisms underlying power gains obtained by tilting rotors.
It was then verified if further power gains could be obtained by increasing the thrust coefficient of the tilted turbines. It is found that operating the tilted turbines at instead of , tilt-induced power gains can be highly increased. It is believed that additional power gain improvements can be achieved by means of a systematic optimization of distributions for tilted turbines that we leave for future study.
It is additionally shown that further substantial tilt-induced power gains are obtained with ratios and of turbines diameter and spanwise-spacing to the boundary-layer height larger than those of the NREL 5MW turbines immersed in a 1km-thick boundary layer (, ). This is consistent with previous results showing that maximum amplifications of coherent large-scale streaks in turbulent boundary layers are obtained for ratios of a few units.57, 27, 60, 31 Further investigations are, however, needed to confirm and extend these results to the regime where realistic atmospheric boundary layer profiles and the effect of Coriolis acceleration must be taken into due account. This high- regime is not only of interest for futuristic very-large turbines but also for current-generation turbines operating in shallow atmospheric boundary layers (for instance, the Haliade-X diameter is comparable to typical nocturnal boundary layer heights). In the case of (shallow) stable boundary layers, furthermore, the higher vertical velocity gradients, promoting more efficient streak amplification, coupled with reduced turbulent levels in the incoming flow, associated to poorer wake recovery in the reference case, might lead to dramatic power gains. This is the subject of a current intense research effort.
Additional investigations are also needed to explore the benefits of tilt control in deep turbine arrays of large wind farms and for a complete range of wind directions. Configurations with peripheral tilted turbines acting on a wind-farm have been very recently investigated13 for constant-tilt zero-yaw and constant operation mode. It would be very interesting to extend such type of investigations using optimized combinations possibly complemented with yaw control to optimally target the forced high-speed streaks to downstream turbines. Also, as the high-speed fluid in the corridors between wind turbines enhances wake recovery in the absence of tilt, it remains to be understood if its replacement with lower speed fluid induced by rotor tilt can significantly affect tilt-control performances, especially in deep turbine arrays.
Acknowledgments
References
- 1 Stevens RJ, Meneveau C. Flow Structure and Turbulence in Wind Farms. Annu. Rev. Fluid Mech. 2017; 49(1): 311–339. doi: 10.1146/annurev-fluid-010816-060206
- 2 Porté-Agel F, Bastankhah M, Shamsoddin S. Wind-Turbine and Wind-Farm Flows: A Review. Bound.-Layer Meteorol. 2019. doi: 10.1007/s10546-019-00473-0
- 3 Dahlberg JÅ, Medici D. Potential improvement of wind turbine array efficiency by active wake control (AWC). In: Proc. European Wind Energy Conference. ; 2003; Madrid, Spain.
- 4 Howland MF, Bossuyt J, Martínez-Tossas LA, Meyers J, Meneveau C. Wake Structure in Actuator Disk Models of Wind Turbines in Yaw under Uniform Inflow Conditions. J. Renew. Sustain. Energy 2016; 8(4): 043301. doi: 10.1063/1.4955091
- 5 Bastankhah M, Porté-Agel F. Experimental and Theoretical Study of Wind Turbine Wakes in Yawed Conditions. J. Fluid Mech. 2016; 806: 506–541. doi: 10.1017/jfm.2016.595
- 6 Medici D, Alfredsson PH. Measurements on a Wind Turbine Wake: 3D Effects and Bluff Body Vortex Shedding. Wind Energy 2006; 9(3): 219–236. doi: 10.1002/we.156
- 7 Jiménez A, Crespo A, Migoya E. Application of a LES Technique to Characterize the Wake Deflection of a Wind Turbine in Yaw. Wind Energy 2010; 13(6): 559–572. doi: 10.1002/we.380
- 8 Guntur S, Troldborg N, Gaunaa M. Application of engineering models to predict wake deflection due to a tilted wind turbine. In: Proceedings of EWEA 2012 - European Wind Energy Conference & Exhibition. EWEA; 2012.
- 9 Fleming PA, Gebraad PM, Lee S, et al. Evaluating Techniques for Redirecting Turbine Wakes Using SOWFA. Renew. Energy 2014; 70: 211–218. doi: 10.1016/j.renene.2014.02.015
- 10 VerHulst C, Meneveau C. Altering Kinetic Energy Entrainment in Large Eddy Simulations of Large Wind Farms Using Unconventional Wind Turbine Actuator Forcing. Energies 2015; 8(1): 370–386. doi: 10.3390/en8010370
- 11 Fleming P, Gebraad PM, Lee S, et al. Simulation Comparison of Wake Mitigation Control Strategies for a Two-Turbine Case: Simulation Comparison of Wake Mitigation Control Strategies for a Two-Turbine Case. Wind Energy 2015; 18(12): 2135-2143. doi: 10.1002/we.1810
- 12 Annoni J, Scholbrock A, Churchfield M, Fleming P. Evaluating Tilt for Wind Plants. In: 2017 American Control Conference (ACC). IEEE; 2017; Seattle, WA, USA: 717–722. http://ieeexplore.ieee.org/document/7963037/
- 13 Bay CJ, Annoni J, Martínez-Tossas LA, Pao LY, Johnson KE. Flow Control Leveraging Downwind Rotors for Improved Wind Power Plant Operation. In: 2019 American Control Conference (ACC). ; 2019: 2843–2848.
- 14 Kiyoki S, Sakamoto K, Kakuya H, Saeki M. 5-MW Downwind Wind Turbine Demonstration and Work Toward Smart Operation Control. Hitachi Review 2017; 66(5): 465–472.
- 15 Loth E, Steele A, Qin C, Ichter B, Selig MS, Moriarty P. Downwind pre-aligned rotors for extreme-scale wind turbines. Wind Energy 2017; 20(7): 1241–1259. doi: 10.1002/we.2092
- 16 Kline SJ, Reynolds WC, Schraub FA, Runstadler PW. The Structure of Turbulent Boundary Layers. J. Fluid Mech. 1967; 30: 741-773. doi: 10.1017/S0022112067001740
- 17 Schmid PJ, Henningson DS. Stability and Transition in Shear Flows. Springer . 2001.
- 18 Hutchins N, Marusic I. Evidence of very long meandering features in the logarithmic region of turbulent boundary layers. J. Fluid Mech. 2007; 579: 1–28. doi: 10.1017/S0022112006003946
- 19 Cossu C, Hwang Y. Self-sustaining processes at all scales in wall-bounded turbulent shear flows. Phil. Trans. R. Soc. A 2017; 375(2089): 20160088. doi: 10.1098/rsta.2016.0088
- 20 Önder A, Meyers J. On the Interaction of Very-Large-Scale Motions in a Neutral Atmospheric Boundary Layer with a Row of Wind Turbines. J. Fluid Mech. 2018; 841: 1040–1072. doi: 10.1017/jfm.2018.86
- 21 Moffatt HK. The interaction of turbulence with strong wind shear. In: Yaglom A, Tatarsky VI. , eds. Proc. URSI-IUGG Colloq. on Atoms. Turbulence and Radio Wave Propag.Proc. URSI-IUGG Colloq. on Atoms. Turbulence and Radio Wave Propag. Nauka; 1967; Moscow: 139–154.
- 22 Landahl MT. A note on an algebraic instability of inviscid parallel shear flows. J. Fluid Mech. 1980; 98: 243–251. doi: 10.1017/S0022112080000122
- 23 Böberg L, Brosa U. Onset of Turbulence in a Pipe. Z. Für Naturforschung A 1988; 43(8-9): 697-726. doi: 10.1515/zna-1988-8-901
- 24 Butler KM, Farrell BF. Three-Dimensional Optimal Perturbations in Viscous Shear Flow. Phys. Fluids A 1992; 4: 1637-1650. doi: 10.1063/1.858386
- 25 Gustavsson LH. Energy Growth of Three-Dimensional Disturbances in Plane Poiseuille Flow. J. Fluid Mech. 1991; 224: 241–260. doi: 10.1017/S002211209100174X
- 26 Trefethen LN, Trefethen AE, Reddy SC, Driscoll TA. A New Direction in Hydrodynamic Stability: Beyond Eigenvalues. Science 1993; 261: 578–584. doi: 10.1126/science.261.5121.578
- 27 Cossu C, Pujals G, Depardon S. Optimal transient growth and very large scale structures in turbulent boundary layers. J. Fluid Mech. 2009; 619: 79-94. doi: 10.1017/S0022112008004370
- 28 Cossu C, Brandt L. Stabilization of Tollmien-Schlichting waves by finite amplitude optimal streaks in the Blasius boundary layer. Phys. Fluids 2002; 14: L57–L60. doi: 10.1063/1.1493791
- 29 Fransson J, Talamelli A, Brandt L, Cossu C. Delaying Transition to Turbulence by a Passive Mechanism. Phys. Rev. Lett. 2006; 96: 064501. doi: 10.1103/PhysRevLett.96.064501
- 30 Pujals G, Depardon S, Cossu C. Drag reduction of a 3D bluff body using coherent streamwise streaks. Exp. Fluids 2010; 49(5): 1085-1094. doi: 10.1007/s00348-010-0857-5
- 31 Willis AP, Hwang Y, Cossu C. Optimally amplified large-scale streaks and drag reduction in the turbulent pipe flow. Phys. Rev. E 2010; 82: 036321. doi: 10.1103/PhysRevE.82.036321
- 32 Del Guercio G, Cossu C, Pujals G. Optimal perturbations of non-parallel wakes and their stabilizing effect on the global instability. Phys. Fluids 2014; 26: 024110. doi: 10.1063/1.4866043
- 33 Del Guercio G, Cossu C, Pujals G. Optimal streaks in the circular cylinder wake and suppression of the global instability. J. Fluid Mech. 2014; 752: 572-588. doi: 10.1017/jfm.2014.347
- 34 Marant M, Cossu C, Pujals G. Optimal streaks in the wake of a blunt-based axisymmetric bluff body and their influence on vortex shedding. C. R. Méc. 2017; 345: 378-385. doi: 10.1016/j.crme.2017.05.010
- 35 Fransson J, Brandt L, Talamelli A, Cossu C. Experimental and theoretical investigation of the non-modal growth of steady streaks in a flat plate boundary layer. Phys. Fluids 2004; 16: 3627–3638. doi: 10.1063/1.1773493
- 36 Fransson J, Brandt L, Talamelli A, Cossu C. Experimental study of the stabilisation of Tollmien-Schlichting waves by finite amplitude streaks. Phys. Fluids 2005; 17: 054110. doi: 10.1063/1.1897377
- 37 Hollands M, Cossu C. Adding streaks in the plane Poiseuille flow. C.R. Mécanique 2009; 337: 179–183. doi: 10.1016/j.crme.2009.03.012
- 38 Pujals G, Cossu C, Depardon S. Forcing large-scale coherent streaks in a zero pressure gradient turbulent boundary layer. J. Turb. 2010; 11(25): 1-13. doi: 10.1080/14685248.2010.494607
- 39 Churchfield MJ, Lee S, Michalakes J, Moriarty PJ. A Numerical Study of the Effects of Atmospheric and Wake Turbulence on Wind Turbine Dynamics. J. Turbul. 2012; 13: N14. doi: 10.1080/14685248.2012.668191
- 40 Smagorinsky J. General circulation experiments with the primitive equations: I. The basic experiment. Mon. Weather Rev. 1963; 91: 99-164. doi: 10.1175/1520-0493(1963)091<0099:GCEWTP>2.3.CO;2
- 41 Monin A, Obukhov A. Basic laws of turbulent mixing in the surface layer of the atmosphere. Contrib. Geophys. Inst. Acad. Sci. USSR 1954; 151(163): e187.
- 42 Schumann U. Subgrid scale model for finite difference simulations of turbulent flows in plane channels and annuli. J. Comp. Phys. 1975; 18: 376–404. doi: 10.1016/0021-9991(75)90093-5
- 43 Calaf M, Meneveau C, Meyers J. Large Eddy Simulation Study of Fully Developed Wind-Turbine Array Boundary Layers. Phys. Fluids 2010; 22(1): 015110. doi: 10.1063/1.3291077
- 44 Goit JP, Meyers J. Optimal Control of Energy Extraction in Wind-Farm Boundary Layers. J. Fluid Mech. 2015; 768: 5-50. doi: 10.1017/jfm.2015.70
- 45 Keating A, Piomelli U, Balaras E, Kaltenbach HJ. A priori and a posteriori tests of inflow conditions for large-eddy simulation. Phys. fluids 2004; 16(12): 4696–4712. doi: 10.1063/1.1811672
- 46 Tabor GR, Baba-Ahmadi MH. Inlet conditions for large eddy simulation: A review. Computers & Fluids 2010; 39(4): 553–567. doi: 10.1016/j.compfluid.2009.10.007
- 47 Fishpool G, Lardeau S, Leschziner M. Persistent non-homogeneous features in periodic channel-flow simulations. Flow, turbulence and combustion 2009; 83(3): 323–342.
- 48 Munters W, Meneveau C, Meyers J. Shifted periodic boundary conditions for simulations of wall-bounded turbulent flows. Phys. Fluids 2016; 28(2): 025112.
- 49 Wu YT, Porté-Agel F. Large-eddy simulation of wind-turbine wakes: evaluation of turbine parametrisations. Boundary-layer meteorology 2011; 138(3): 345–366. doi: 10.1007/s10546-010-9569-x
- 50 Munters W, Meyers J. An Optimal Control Framework for Dynamic Induction Control of Wind Farms and Their Interaction with the Atmospheric Boundary Layer. Philos. Trans. R. Soc. Math. Phys. Eng. Sci. 2017; 375(2091): 20160100. doi: 10.1098/rsta.2016.0100
- 51 Martinez LA, Meneveau C, Stevens RJAM. Wind farm large-eddy simulations on very coarse grid resolutions using an actuator line model. In: 34th Wind Energy Symposium. ; 2016: 1261.
- 52 Jonkman J, Butterfield S, Musial W, Scott G. Definition of a 5-MW reference wind turbine for offshore system development. Technical Paper NREL/TP-500-38060, National Renewable Energy Lab.(NREL); Golden, CO (United States): 2009.
- 53 Wu YT, Porté-Agel F. Modeling turbine wakes and power losses within a wind farm using LES: An application to the Horns Rev offshore wind farm. Renewable Energy 2015; 75: 945–955. doi: 10.1016/j.renene.2014.06.019
- 54 Stevens RJAM, Gayme DF, Meneveau C. Coupled wake boundary layer model of wind-farms. J. Renew. Sust. En. 2015; 7(2): 023115. doi: 10.1063/1.4915287
- 55 Munters W. Large-Eddy Simulation and Optimal Coordinated Control of Wind-Farm Boundary Layers. PhD thesis. Faculty of Engineering Science, KU Leuven, Leuven, Belgium; 2017. https://lirias.kuleuven.be/1745677?limo=0.
- 56 White EB. Transient growth of stationary disturbances in a flat plate boundary layer. Phys. Fluids 2002; 14: 4429–4439. doi: 10.1063/1.1521124
- 57 Pujals G, García-Villalba M, Cossu C, Depardon S. A note on optimal transient growth in turbulent channel flows. Phys. Fluids 2009; 21: 015109. doi: 10.1063/1.3068760
- 58 Hwang Y, Cossu C. Linear non-normal energy amplification of harmonic and stochastic forcing in turbulent channel flow. J. Fluid Mech. 2010; 664: 51-73. doi: 10.1017/S0022112010003629
- 59 Bak C, Zahle F, Bitsche R, et al. Description of the DTU 10 MW Reference Wind Turbine. DTU Wind Energy Report I-0092, DTU Wind Energy; Roskilde (Denmark): 2013.
- 60 Hwang Y, Cossu C. Amplification of coherent streaks in the turbulent Couette flow: an input-output analysis at low Reynolds number. J. Fluid Mech. 2010; 643: 333-348. doi: 10.1017/S0022112009992151
- 61 OpenCFD . OpenFOAM - The Open Source CFD Toolbox – User’s Guide. OpenCFD Ltd.; UK: 2.4 ed. 2011.
- 62 Martinez-Tossas L, Leonardi S. Wind Turbine Modeling for Computational Fluid Dynamics. Subcontract Report NREL/SR-5000-55054, US National Renewable Energy Laboratory; Golden, CO (USA): 2013.
Appendix A Methods
The standard numerical schemes and parameters implemented in SOWFA39 and built on standard OpenFOAM (release 2.4.x) solvers are used to solve the filtered Navier-Stokes equations with Boussinesq fluid model and Smagorinsky40 modeling for the subgrid scale motions. The PIMPLE scheme is used for time advancement. Schumann’s stress boundary conditions42 are enforced at the near-ground horizontal boundary.
Numerical simulations of the considered turbulent boundary layers have been performed in x x numerical domains of (vertical) height , (streamwise) length and width . Three domains have been considered. Domains D1 (6km x 0.5km x 1km) and D2 (3km x 3km x 1km), both discretized with 15m x 14m x 14m cells, have been used for the simulations implying actuator disks with the dimensions of the NREL 5-MW () and DTU 10-MW () turbines. Domain D3 (6km x 3km x 1km), discretized with 21.4m x 20 x 14m cells, has been used for the simulations implying actuator disks with . The solutions are advanced with time steps satisfying the CFL 0.45 constraint and keeping reasonable the amount of data stored in precursor simulations.
The original actuator disk (ADM) turbine model implemented in SOWFA, which includes wake rotation effects as well as the blade-derived radial dependence of the forces acting on the fluid62, has been modified to implement the in-house ADMC model used in the present study by: (a) keeping the same discretization points on the disk but distributing the body force uniformly in the radial direction, (b) setting the body force magnitude to43, 44, 50 removing its dependence on the turbine controller, (c) removing body force components parallel to the rotor plane (inducing wake rotation). In this way, the turbine response only depends on and not on the turbine controller settings, simplifying the interpretation of the results. The Gaussian projection of the control-point-discretized body forces with a smoothing parameter is left unchanged with for simulations in domains D1 and D2 and for simulations performed in domain D3.