Study of galaxies on large-scale filaments in simulations
Abstract
We use data from the Evolution and Assembly of GaLaxies in their Environment (eagle) cosmological simulation to study properties of galaxies in the cosmic web. Galaxies become more redder and form stars at a lower rate relative to their counterparts further away from the cylindrical axis of the large-scale filaments. These trends are particularly strong for galaxies with . We also find that at distances Mpc from the spine of the filaments, the median gas and stellar mass fraction in filament galaxies rises sharply with decreasing distance from the spine of the filament. These results, together with matching trends in the SFR/ and the colour of filament galaxies suggest that (i) the intrafilamentary gas condenses into the filament galaxies thus fuelling star formation in them, and (ii) increased number density of galaxies closer to the central axis of the filament enhances the rate of gravitational interactions among filament galaxies closer to the spine.
keywords:
galaxies: evolution; galaxies: star formation; galaxies: clusters: general; galaxies: fundamental parameters1 Introduction
Galaxies form and evolve on the cosmic web: a complex network of intricately woven filaments and sheets of matter which intersect at the nodes, aka the clusters of galaxies (Bond et al., 1996). The distribution of all matter on such a web-like structure is expected from the theory of structure formation (Zeldovich et al., 1982) even before it was observed. However, the impact of the cosmic web on the properties of galaxies through their interactions with the large-scale environment is yet to be understood fully.
The role of the large-scale environment in modulating the evolution of galaxies has been well established in the literature (Dressler et al., 1997; Binggeli et al., 1988; Kauffmann et al., 2004; Weinmann et al., 2009; Peng et al., 2012; Boselli et al., 2016). While interactions with the ambient hot gas in dense environments such as clusters and groups can lead to a loss of cold gas from galaxies through ram-pressure stripping (Gunn & Gott, 1972), gravitational interactions between galaxies (Kewley et al., 2006; Sobral et al., 2015; Stroe et al., 2015), or harassment of low-mass satellite galaxies by a more massive counterpart (Moore et al., 1996) can quench formation of stars in intermediate and low-density environments.
Simulations have confirmed that even though there are more galaxies in clusters, a large fraction of all galaxies resides on large-scale filaments (e.g. see table 2 of Libeskind et al., 2018). So in order to understand the role played by the cosmic web in the evolution of galaxies, it becomes critical to study the large-scale filaments and their influence on the properties of galaxies. The intra-filament medium (IFM) is expected to be at K, and over-dense by a factor of relative to the mean of the Universe (e.g. Cen & Ostriker, 1999; Croft et al., 2001). Hydrodynamical simulations show that the Bremsstrahlung brightness in the cosmic web reaches at most erg s-1 cm-2 arcmin-2 (Dolag et al., 2006). Hence, while we overcome the technical challenges to observe the IFM directly, it is essential to study its impact on the galaxies residing therein by studying their properties.
There is plenty of evidence in the literature to suggest that the galaxies on filaments have higher star formation rate relative to their counterparts in clusters and voids (Porter & Raychaudhury, 2007; Fadda et al., 2008; Porter et al., 2008; Mahajan et al., 2012; Mahajan et al., 2018; Vulcani et al., 2019). Furthermore, galaxies on filaments are found to be more metal-rich (Darvish et al., 2015), as well as host more satellite galaxies (Guo et al., 2015). Studies of galaxy pairs on filaments indicate a significant alignment between the pair axis and the axis of the filament on which they reside (Lambas et al., 1988; Donoso et al., 2006; Mesa et al., 2018). In particular, Mesa et al. (2018) found that the alignment for pairs of elliptical galaxies is stronger than the pairs comprising one or both spiral galaxies, especially within kpc of the spine of the filament.
Several recent studies suggest that the properties of galaxies on filaments change as a function of their distance from the cylindrical axis of the filament. Using optical spectroscopic and photometric data from the Galaxy And Mass Assembly (GAMA) survey and the Horizon-AGN simulation suite, Kraljic et al. (2018) found that galaxies tend to become passive closer to the filament axis. Multi-wavelength data from the GAMA survey were also used by Alpaslan et al. (2016) to show that galaxies () become less star forming and more massive with decreasing distance from the filaments’ axis. Mahajan et al. (2018) studied the Coma supercluster () using similar optical data from the Sloan Digital Sky Survey (SDSS) and ultraviolet (UV) data from the Galaxy Evolution Explorer (Galex) mission. One of their major results is that the colours of galaxies become redder and emission in the H line decreases on approaching the spine of the filament. Similar results have also been obtained for galaxies at higher redshift (Chen et al., 2017; Malavasi et al., 2017; Laigle et al., 2018b; Luber et al., 2019).
In the last few years, state-of-the-art simulations have been employed to understand the symbiotic relationship between the large-scale structure and its galaxy constituents. Large cosmological simulations not just serve as a test bed for validating various theories of structure formation and evolution, but also serve as a laboratory to predict the properties of the yet to be observed constituents of the Universe. For instance, Martizzi et al. (2018) used the IllustrisTNG simulations to show that the filaments contain more star-forming gas, as well as higher mass fraction of such gas relative to clusters. In a study based on the Horizon MareNostrum simulation, Gay et al. (2010) explored the properties of galaxies at redshift of (box size of Mpc), and found that the G-K colour of galaxies becomes redder on approaching the spine of the filaments.
Even though the present day simulations are able to produce global trends in the properties of galaxies, they depend upon recipes to mimic effects of various sub-grid physical processes at play. Since these parameters can not be found using first principles, it is critical to understand the variation in properties of galaxies as a continuous function of their environment in order to validate different sub-grid recipes. The Evolution and Assembly of GaLaxies and their Environment (eagle; Schaye et al., 2015; Crain et al., 2015; McAlpine et al., 2016; Trayford et al., 2016; Correa et al., 2017) is one such suite of simulations which has been used to study various aspects of evolution of galaxies in recent years (Trayford et al., 2015; Furlong et al., 2015; De Rossi et al., 2017a). A very useful aspect of the eagle simulations is that the calibration of the feedback parameters is performed by broadly matching the galaxy stellar mass function (GSMF) at , maintaining reasonable galaxy sizes. Through this new implementation, eagle can reasonably match and predict multi-wavelength observations at large scales, making them an ideal resource to study galaxies in different environments.
2 The eagle Simulations
In this work we employ data produced by the eagle simulation (Schaye et al., 2015; McAlpine et al., 2016), which is a suite of hydrodynamical simulations run with modified version of the Gadget3 code. The simulation uses a flat CDM cosmology with parameters taken from the Planck mission (Planck Collaboration et al., 2014) results: = 0.693, = 0.307, = 0.04825, = 0.8288, = 0.9611,Y = 0.248 and = 67.77 (i.e. = 0.6777). Specifically, we use the reference model RefL0100N1504 with co-moving box length of 100 Mpc. The total number of particles in the RefL0100N1504 run is , giving an initial gas particle mass () of , and a dark matter particle mass of , respectively. By using state-of-the-art numerical techniques, eagle differs from other simulations in its implementation of energy feedback from stars, i.e. it does not distinguish between core-collapse supernovae, stellar winds and radiation pressure. In this study we have used the snapshot at to create mock observational data.
2.0.1 The physical parameters
Star formation in the eagle simulations is implemented using the Kennicutt-Schmidt relation (Kennicutt, 1998) between the gas mass density and the star formation density (Schaye & Dalla Vecchia, 2008). In particular, the star formation rate decreases with increasing metallicity above the density threshold given by Schaye (2004) as:
| (1) |
where, Z is the gas metallicity. The simple stellar populations represented by these stellar particles follow the Chabrier initial mass function (IMF). Furthermore, in order to prevent artificial fragmentation, a density dependent temperature floor () is applied following the equation of state : with , where is the pressure, is the gas density and is the ratio of the heat capacities. The temperature floor is normalised to K at to mimic gas in cold phase. When the gas density exceeds , and the temperature , the gas particles are assigned a star formation rate (SFR):
| (2) |
where, is the gravitational constant, is ratio of specific heats and is the fraction of mass in the gas, and is kept at 1.0 for the RefL100N1504 model. Parameters and are estimated from the fit to observational data (Kennicutt, 1998).
The rates of radiative cooling and heating are computed on an element-to-element basis in the presence of Haardt & Madau (2001) ultraviolet or x-ray ionizing background, and the cosmic microwave background. Eleven elements (H, He, C, N, O, Ne, Mg, Si, S, Ca and Fe) which are important for calculating cooling rates at (Wiersma et al., 2009b) along with the total metallicity are tracked in the simulations.
The simulations incorporate various sub-grid feedback mechanisms including stellar winds from asymptotic giant branch (AGB) stars, supernovae (both core collapse and type IA; Wiersma et al., 2009a) and active galactic nuclei (AGN; Schaye et al., 2015). The prompt stellar feedback is implemented in a manner similar to Dalla Vecchia & Schaye (2012). In this ‘stochastic feedback’ model, the fraction of energy () released by the core collapse supernovae is given by:
| (3) |
where, and are the asymptotic values of and is the density of the parent gas particle. In this model, , , and are free parameters. This fraction is injected into the neighbouring cells 30 Myr after the birth of the stellar particle. The thermal energy ejected by a star is distributed stochastically isotropically, resulting in temperature change of K.
When the mass of a halo reaches , a gas particle at the centre of the potential well is converted into a seed black hole with a mass of (Springel et al., 2005). The accretion of matter on the central black hole is based on a modified Bondi-Hoyle model (Schaye et al., 2015). A fraction of 0.015 of the rest mass energy of the matter accreted on the central black hole is returned to the surrounding thermally as a jump of K.
All the free parameters related to physical processes are calibrated to reproduce the GSMF and galaxy sizes at .

2.0.2 Properties of galaxies
In eagle simulations, the dark matter haloes are identified using the friends-of-friends (FOF) algorithm (Einasto et al., 1984), such that the dark matter particles separated by less than 0.2 times the mean inter-particle separation are bound into a single halo. The individual galaxies are identified using the SUBFIND algorithm (Springel et al., 2001; Dolag et al., 2009), which labels the galaxy closest to the centre of the parent halo as the central galaxy, and other haloes inside the parent as satellite galaxies.
It is difficult to quantify the mass or luminosity of galaxies in simulations using the SUBFIND algorithm, because it assigns the mass of unbound particles to the central galaxy. This leads to an extended stellar distribution for such galaxies. Hence, in this work we use the stellar mass of the subhalo obtained within an aperture of 30 kpc in physical units (pkpc, henceforth), centred at the minima of the subhalo potential (Trayford et al., 2015; Schaye et al., 2015). The choice of aperture is motivated by the fact that 3-D aperture of 30 kpc matches the results obtained using 2-D Petrosian aperture (Schaye et al., 2015).
The eagle simulation uses the Bruzual & Charlot (2003) population synthesis models for each particle to obtain the spectral energy distribution (SED) of galaxies. The spectra convolved with the filter response function within 30 pkpc aperture gives the broadband colours of the galaxies in optical and near infrared wavebands (Doi et al., 2010; Hewett et al., 2006). We employ some of these rest-frame colours to study the properties of galaxies. A full list of all the variables used in our analysis is provided in Table 1. In this work, we use the SFR inside 30 kpc in physical units centred at minima of subhalo potential to explore such trends. The SFR has been measured using the mass of dense gas in the subhalo (Schaye & Dalla Vecchia, 2008).
Studies of large-scale filaments based on observations mainly focus on the outskirts of massive clusters (e.g. Dolag et al., 2006; Porter et al., 2008; Mahajan et al., 2012), or superclusters111In this work a filament or a network of filaments bound by clusters of galaxies on opposite ends is referred to as a ‘supercluster’. (e.g. Porter & Raychaudhury, 2007; Haines et al., 2011; Mahajan et al., 2018), which often comprise two or more massive clusters and groups with large-scale filaments passing through them. In order to mimic such superclusters using the eagle simulations, in this work we identify systems where two massive clusters may be connected via filaments. The eagle simulations however have a small box size (the largest box is 100 Mpc on each side), hence not many superclusters are expected to have formed in it (Bagla & Ray, 2005; Bagla et al., 2009). Therefore, in order to make the best use of the available data, we generated mock observations by identifying the positions of haloes with mass . Nine such clusters were found, resulting in 36 () potential slices comprising superclusters. Table 2 lists the properties of these haloes (), which are analysed further. To find the underlying structure of the cosmic web, we restricted ourselves to galaxies with (within 30 pkpc aperture), which gives us a sample of 294,780 galaxies. This choice of stellar mass limit is motivated by earlier work which showed that for the RefL0100N1504 run, simulations are well matched to the observations for (Schaye et al., 2015; Trayford et al., 2016).
| Parameter | Description |
|---|---|
| Total stellar mass within the aperture (). | |
| Total gas mass within the aperture (). | |
| Total subhalo Mass () | |
| x,y,z | Position of subhalo |
| SFR | Star formation rate within the aperture. |
| u band without dust attenuation. | |
| g band without dust attenuation. | |
| r band without dust attenuation. |
| grpid | R (pkpc) | x (Mpc) | y (Mpc) | z (Mpc) | Number of subhaloes | |
|---|---|---|---|---|---|---|
| 27000000000000 | 1426.70 | 5.72 | 75.61 | 47.48 | 17101 | |
| 27000000000001 | 1135.12 | 18.12 | 79.88 | 53.51 | 9942 | |
| 27000000000002 | 1349.73 | 9.12 | 35.03 | 54.52 | 9152 | |
| 27000000000003 | 1356.48 | 52.43 | 5.00 | 20.12 | 7430 | |
| 27000000000004 | 1162.48 | 10.96 | 81.29 | 54.89 | 7365 | |
| 27000000000005 | 1054.56 | 77.85 | 76.97 | 42.28 | 6909 | |
| 27000000000006 | 1055.64 | 76.13 | 89.23 | 41.89 | 6191 | |
| 27000000000007 | 981.45 | 61.25 | 33.08 | 20.23 | 6183 | |
| 27000000000008 | 948.02 | 84.83 | 47.33 | 8.14 | 3190 |
2.1 Mock Observations
Although simulations contain 3-dimensional (3D, henceforth) information, we created 2D projections of 3D slices in order to compare our results with the observations. Furthermore, the 2D analysis allows us to artificially expand our dataset by rotating the central axis of the supercluster systems found in the simulation box as described below. Motivated by observational studies of supercluster filaments crossing clusters of galaxies (e.g. Dolag et al., 2006; Porter et al., 2008; Mahajan et al., 2012; Mahajan et al., 2018), we begin by considering each cluster pair system as a possible supercluster candidate.
In order to generate a slice of these data for making mock observations, the coordinate system is changed by translating the origin to the centre of the line joining the two clusters in the system. The system is then rotated by keeping one axis fixed with the line joining the two clusters, and choosing the orientation of the remaining two axes randomly. Laigle et al. (2018a) have shown that a 60–200 Mpc thick slice can capture real 3D filaments even in their 2D projection. Therefore, in order to characterise the environment in 2D projections, we choose a slice of co-moving width 60 Mpc with the normal perpendicular to the line joining the cluster pair as shown in Fig. 1. This choice of width also compliments the width of the Coma supercluster region studied by Mahajan et al. (2012); Mahajan et al. (2018). In the following, we refer to this transformed frame as .
2.2 Classification of Environment
The cosmic web can be broadly segregated into different components based on the density of galaxies. Characterisation of these environments requires identifying the local topology and clustering of the constituents. In this study, we follow an approach similar to that used in Mahajan et al. (2018, hereafter SM18) to characterise environment into groups and clusters, filaments and voids, respectively.
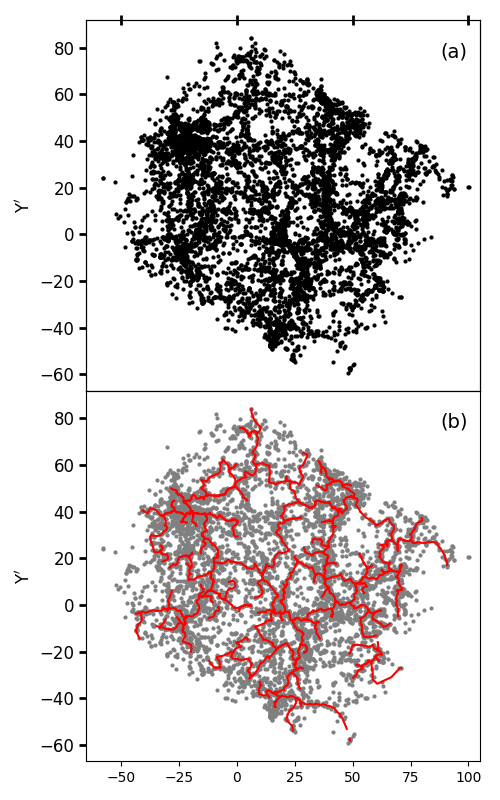
In order to identify filaments in the 2D projected slices, we employ the Discrete Persistent Structures Extractor (disperse; Sousbie, 2011) algorithm. disperse uses the Morse theory and persistence theory to map the persistence of critical points obtained by measuring density at discrete points to the underlying topology. It identifies features such as nodes, filaments, and saddle points using just one parameter. This parameter called the persistence threshold crudely corresponds to the level of complexity to be retained while identifying structures in a distribution. We direct the reader to SM18 and Sousbie (2011) for detailed application and working of the algorithm, and choice of parameters.
The persistence threshold above which all the critical points are retained for analysis is usually taken to be 3-5 , where is the standard deviation. It suppresses the selection noise and picks relatively denser and longer filaments (Sousbie, 2011). In this work, we choose the significance threshold of which segregates the noise from the points used for analysis in this work for each mock observation.
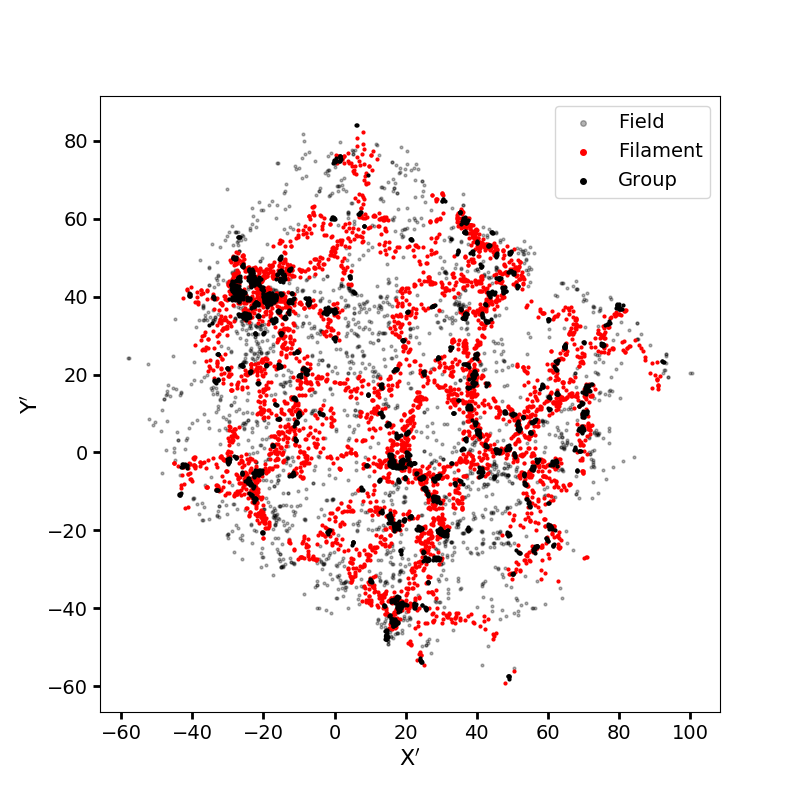
Filaments are obtained by applying disperse on the distribution of galaxies in the projection. In Fig. 2(b) we show the filaments identified for a representative slice. We identify filament galaxies as those which (i) do not belong to clusters or groups, and (ii) are Mpc from the spine of the filament. The choice of filament radius is driven by the fact that of all galaxies found within Mpc of the spine of the filaments lie Mpc from the central axis (also see Sec. 3.1.1).
In order to identify the galaxies in each slice, we use eagle’s group catalogue to identify the friends-of-friends groups with total mass, , and comprising at least four galaxies with (Schaye et al., 2015). The galaxies which are not linked to groups, clusters or filaments were classified as void galaxies. In Fig. 3 we show the distribution of galaxies in different environments in one of the slices.
3 Properties of galaxies on filaments
In order to study the properties of galaxies in different environments in the eagle simulations, we stack all the 36 slices obtained from mock observations. In the following we analyse the trends in the properties of galaxies, in particular the galaxies on filaments with respect to their counterparts residing in denser and rarer regions of the space.
3.1 The large-scale filaments
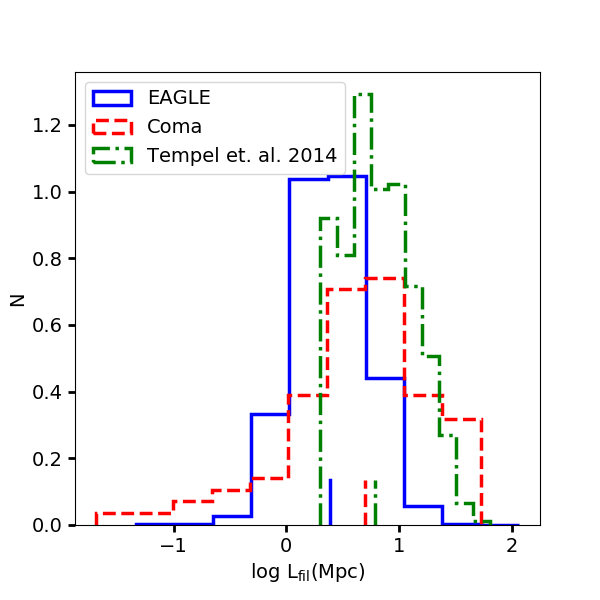
In Fig. 4 we compare the distribution of length of filaments from our stacked sample generated from the eagle simulations, with the filaments in the Coma supercluster (SM18), as well as another distribution of filaments obtained from the SDSS dataset (see fig. 11 of Tempel et al., 2014). While SM18 identified the filaments in 2D projections, just like this work, the filaments of Tempel et al. (2014) were identified from the 3D distribution of galaxies.
To compare these distributions, we use the Welch’s t-test (Welch, 1947), which tests for the hypothesis that two distributions have different means. We find that the distribution of lengths of filaments from eagle simulation when compared with the filaments from SM18 and Tempel et al. (2014) gives p-values in both cases. The filaments found in both the observational datasets are found to be relatively longer than the filaments found in the eagle simulations. However, this result can only be considered qualitatively because of the different redshifts of the samples, and the fact that the procedure for finding the filaments is dependent on the algorithms with free parameters which can influence the distribution of length of filaments (Libeskind et al., 2018).
3.1.1 Colours of galaxies
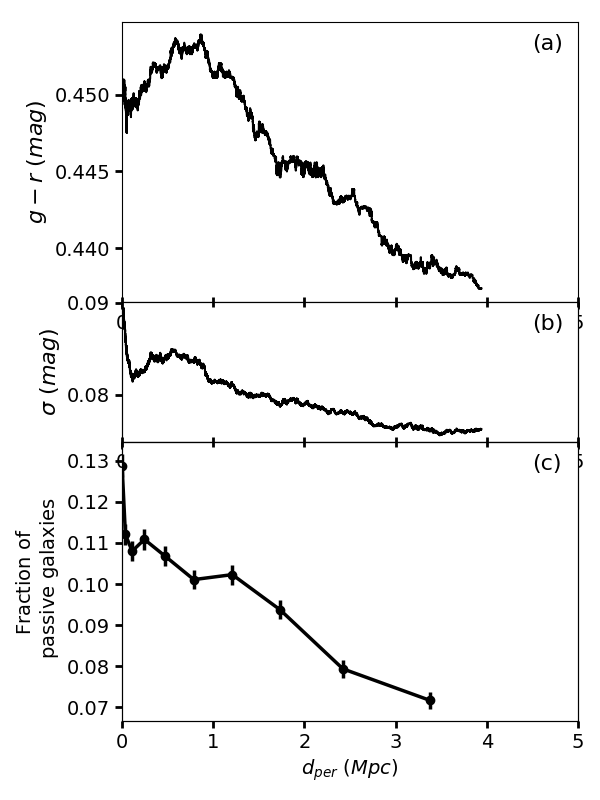
Broadband optical colours are often a good representative of the age of the most dominant stellar population, and hence, the age of galaxies. Therefore, in order to study the impact of the filament environment on the evolution of galaxies we analyse their colour as a function of increasing environmental density. In Fig. 5 we show the running median of the colour of galaxies, median absolute deviation (MAD) of colour, and the fraction of passive galaxies (sSFR Gyr-1; Schaye et al., 2015), as a function of their perpendicular distance from the spine of filaments (). We find that the galaxies become redder and more passive closer to the spine of filaments within a radius of Mpc from the filament axis. Specifically, the passive fraction increases from 8% at a distance of Mpc from the spine of the filaments to 11.5% at the centre of the filaments. Welch’s t-test statistic shows that the colour of galaxies at Mpc is statistically different from their counterparts farther away from the spine of the filaments (Table 3). The MAD quantifies the width of the distribution at different , essentially showing that the distributions are broader closer to the spine of the filaments where most of the galaxies lie. This result is in tune with the findings from observations (Alpaslan et al., 2016; Kuutma et al., 2017; Kraljic et al., 2018; Bonjean et al., 2019), as well as other simulations (Gay et al., 2010). Such trends with have helped in constraining the radius of filaments to Mpc (Bonjean et al., 2018; Mahajan et al., 2018; Tanimura et al., 2019).
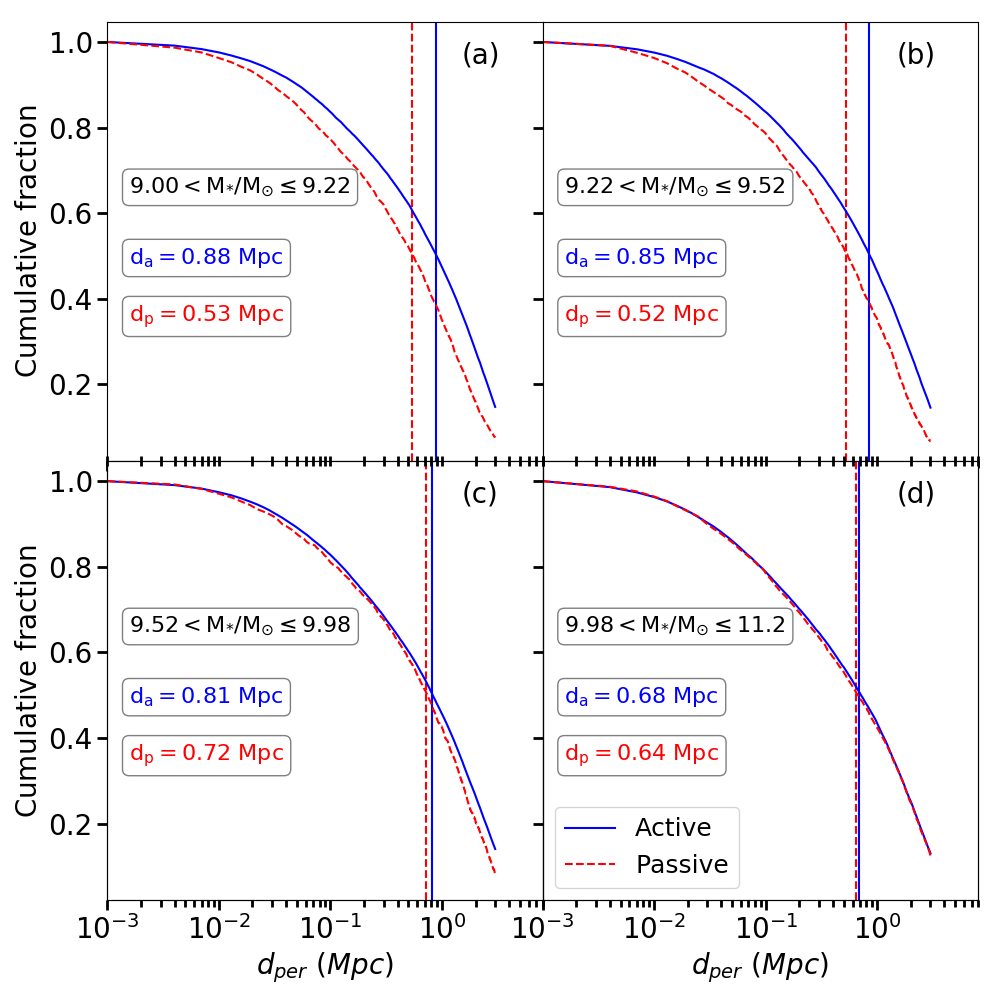
The stellar mass of galaxies is well known to correlate with the environmental density. Hence in order to break this degeneracy between and environment, in Fig. 6 we show the cumulative fraction for the active and passive galaxies in filaments separately in four mass bins: , (b) , (c) and (d) . The mass bins are chosen to include the same number of galaxies in each bin. For the three low stellar mass bins ((a)-(c)), the median for the active galaxies’ distributions have values close to 1 Mpc, i.e. the radius of filaments comprising of the galaxies on the cosmic web. We further tested for statistical differences among the distributions in each panel using the Kruskal-Wallis (KW) test (Kruskal & Wallis, 1952). The KW statistic is a non-parametric rank-based test which assumes independent observations, continuous variability and same shape for the two distributions. For the four panels in Fig. 6 the KW test yields a probability of 5.67e-82, 1.10e-52, 2.85e-06, and 0.31 in favour of the hypothesis that the two distributions had the same medians. Based on this analysis we also conclude that except for high mass galaxies, at fixed stellar mass, passive galaxies lie closer to the spine of the filament than their active counterparts.
| Parameter | bin1-bin2 | bin2-bin3 | bin1-bin3 |
|---|---|---|---|
| sSFR | 0.310 | ||
| 0.058 | |||
| 0.021 | |||
| 0.871 |
3.1.2 Star formation in filament galaxies
The star formation rate of filament galaxies is enhanced relative to their counterparts in clusters as well as the voids (Fadda et al., 2008; Mahajan et al., 2012). SM18 showed that while the optical and UV colours becomes bluer, the equivalent width of the H line increases for the filament galaxies moving away from the spine of the filaments.
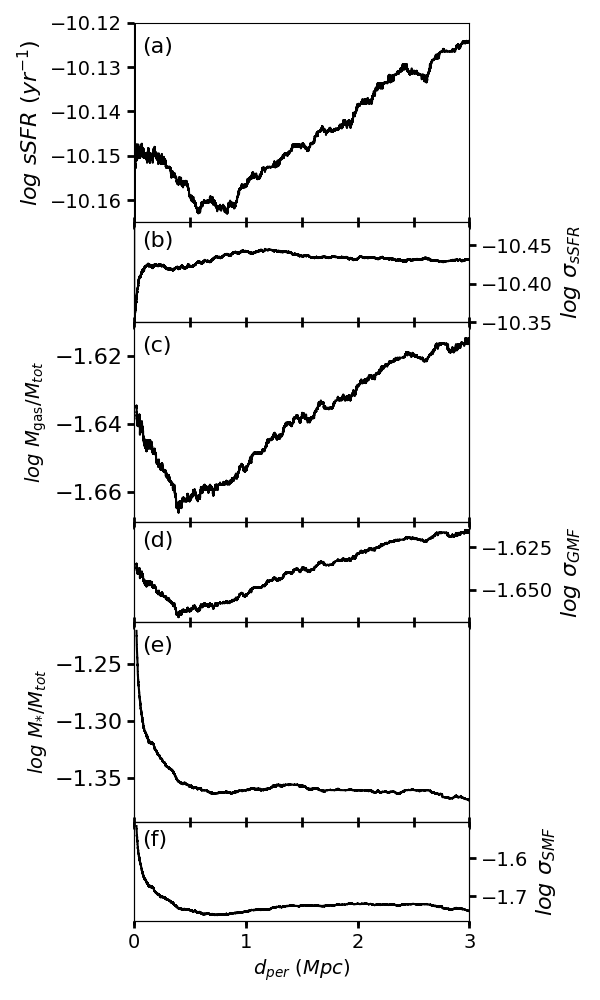
In Fig. 7(a)-(b) we show the variation of the running median of the specific star formation rate (sSFR) as a function of the perpendicular distance () to the spine of the filaments and the MAD for the same. On approaching the filaments, the sSFR decreases slowly until Mpc from the spine of the filaments, and thereafter increases again closer to the central axis. Table 3 confirms the observed trends by showing that the sSFR distribution for galaxies within Mpc is different from their counterparts further away from the spine of the filaments. This result correlates well with the colour of galaxies becoming bluer in Fig. 5(a). Furthermore, these results support the findings of Liao & Gao (2019), who have suggested that the galaxies on filaments can accrete intrafilamentary gas to feed star formation, and the density of this gas should also increase with decreasing distance from the spine of the filaments.
In order to test our hypothesis and test if the increase in star formation activity near the spine of the filaments is correlated with an increase in the availability of gas, we study the distribution of mass in stars and gas in the filaments as a function of . In Fig. 7(c)–(f) we show the variation in the fraction of stellar mass and gas mass as a function of for of the galaxies in our sample with non-zero gas mass fraction, and the respective MAD for the same. The denominator for the fractions, is the total mass of the galaxy, which includes the gas (), stars () and the dark matter mass () inside a 30 pkpc aperture.
The median stellar mass fraction (SMF) shows a mild increase only within Mpc from the central axis of the filaments. This trend is reciprocated by the gas mass fraction (GMF) as well. However, at Mpc, the median GMF rises smoothly, but the median SMF remains constant. The observed trends are also confirmed statistically in Table 3. Furthermore, we note that all the trends seen in Fig. 7 are primarily driven by low mass () which dominate our sample. Galaxies with stellar masses in the range also show trends similar to their less massive counterparts with minor deviations. But the most massive galaxies show an almost constant distribution for sSFR and the gas mass fraction, but an incline in the stellar mass fraction distribution with decreasing at small distances ( Mpc) from the spine of the filament.
These trends suggest that the intrafilamentary gas condenses into the galaxies on filaments and fuel star formation, supporting the results of Liao & Gao (2019). However, these small changes (2%–5%) in the GMF and the sSFR are not enough to turn a passively evolving galaxy to an active one as seen here in Fig. 5, and in other studies based on observations (Bonjean et al., 2019). Also because of the small magnitude of these changes it is not surprising that such trends have yet not been observed in real data. The increase in the passive fraction of galaxies is likely caused by increased gravitational interactions amongst filament galaxies, likely due to an increased number density of galaxies closer to the spine of the filament. As a result of these interactions, these galaxies not only exhaust their reservoir of gas, but will also show momentary increase in their star formation activity, therefore contributing to the trend observed for the sSFR. Similar conclusions have also been drawn by Bonjean et al. (2019), who modelled the passive fraction of filament galaxies to find a positive gradient in their SFR which they attributed to mergers.
3.1.3 Metallicity
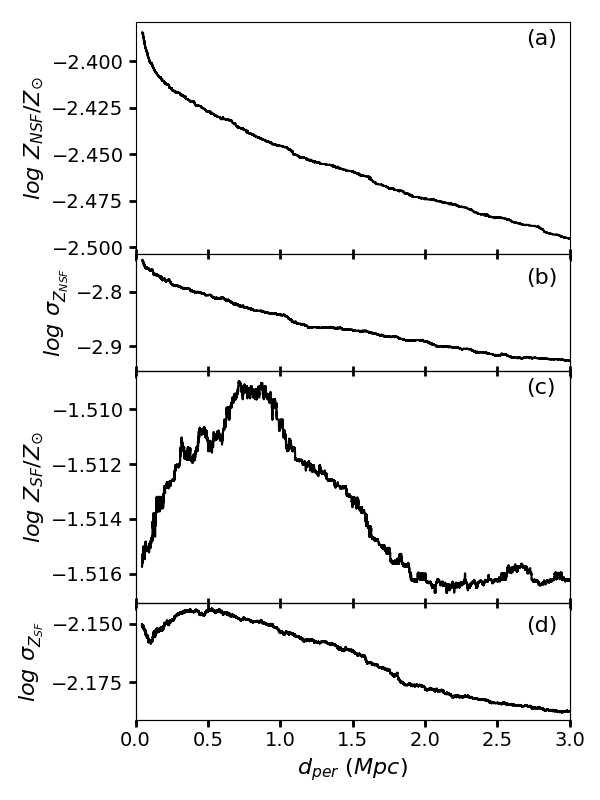
Metallicity, the fraction of mass in elements heavier than Helium is dependent on the complex interplay of gas accretion on galaxies and outflows from different feedback processes. For our analysis of metallicity, we use the smoothed metallicity provided for each subhalo by Wiersma et al. (2009b). The gas metallicity is divided into the star-forming () and non-star-forming () metallicity, respectively. The star-forming gas is cold () enough to form stars, with the SFR dependent upon the metallicity (Schaye & Dalla Vecchia, 2008). On the other hand, the non-star forming gas comprises hot and under-dense gas which can not form stars. We refer the reader to Schaye (2004) for a detailed discussion on how star-formation is implemented in the eagle simulation.
Our prior results indicate that galaxies are likely to accrete gas as they move towards the spine of the filament. Therefore, in order to test this hypothesis using we show the running median of as a function of their perpendicular distance from the spine of the filaments, in Fig. 8. Although with significant scatter, the median within Mpc of the spine of the filaments is clearly elevated relative to the galaxies further away. On the other hand, is found to increase smoothly with decreasing distance from the filament axis222Just like Fig. 7, these trends in metallicity are also driven by the low-mass galaxies (). The more massive galaxies show noisy, almost constant distribution of both and except an apparent decline within . (Fig. 8(c)). This result, together with Fig. 7(c) indicates that the non-star forming gas is accreted onto the galaxies. This result also supports the findings of Liao & Gao (2019) who used hydrodynamical simulations to show that at high redshifts ( and ) around 30% of the gas accreted on the galaxy halos on filaments is the intrafilamentary medium.
4 Discussion
We have used data products from the EAGLE simulations to show that the intermediate density environment prevalent on the filaments influence the properties of galaxies on them. In the following, we discuss our results in the context of the filament galaxies studied in the literature, and also analyse the properties of filament galaxies relative to their counterparts in other environments.
4.1 Filaments in the literature
Kleiner et al. (2017) used the 6 degrees Field Galaxy Survey (Jones et al., 2009) and the Parkes all-sky survey (Staveley-Smith et al., 2000) to study the HI fraction of galaxies on nearby filaments identified by disperse. They found that massive galaxies () closer ( Mpc) to the spine of the filaments have higher HI-to-stellar mass ratio (HI fraction), where as the HI fraction among lower mass galaxies show no difference with respect to the control sample of galaxies Mpc away from the spine of the filaments. Kleiner et al. (2017) attributed the higher HI fraction in massive filament galaxies to cold gas accretion from the intrafilamentary medium.
On the other hand, Crone Odekon et al. (2018) used data from the ALFALFA survey (Giovanelli et al., 2005) to study the HI reservoir in galaxies. Complimentary to the results presented here, Crone Odekon et al. (2018) observed that at fixed stellar mass and colour, galaxies show a deficiency in HI on approaching the filaments. Furthermore, they also observed that at fixed local density, the HI fraction of lower mass galaxies () decreases on approaching the filaments.
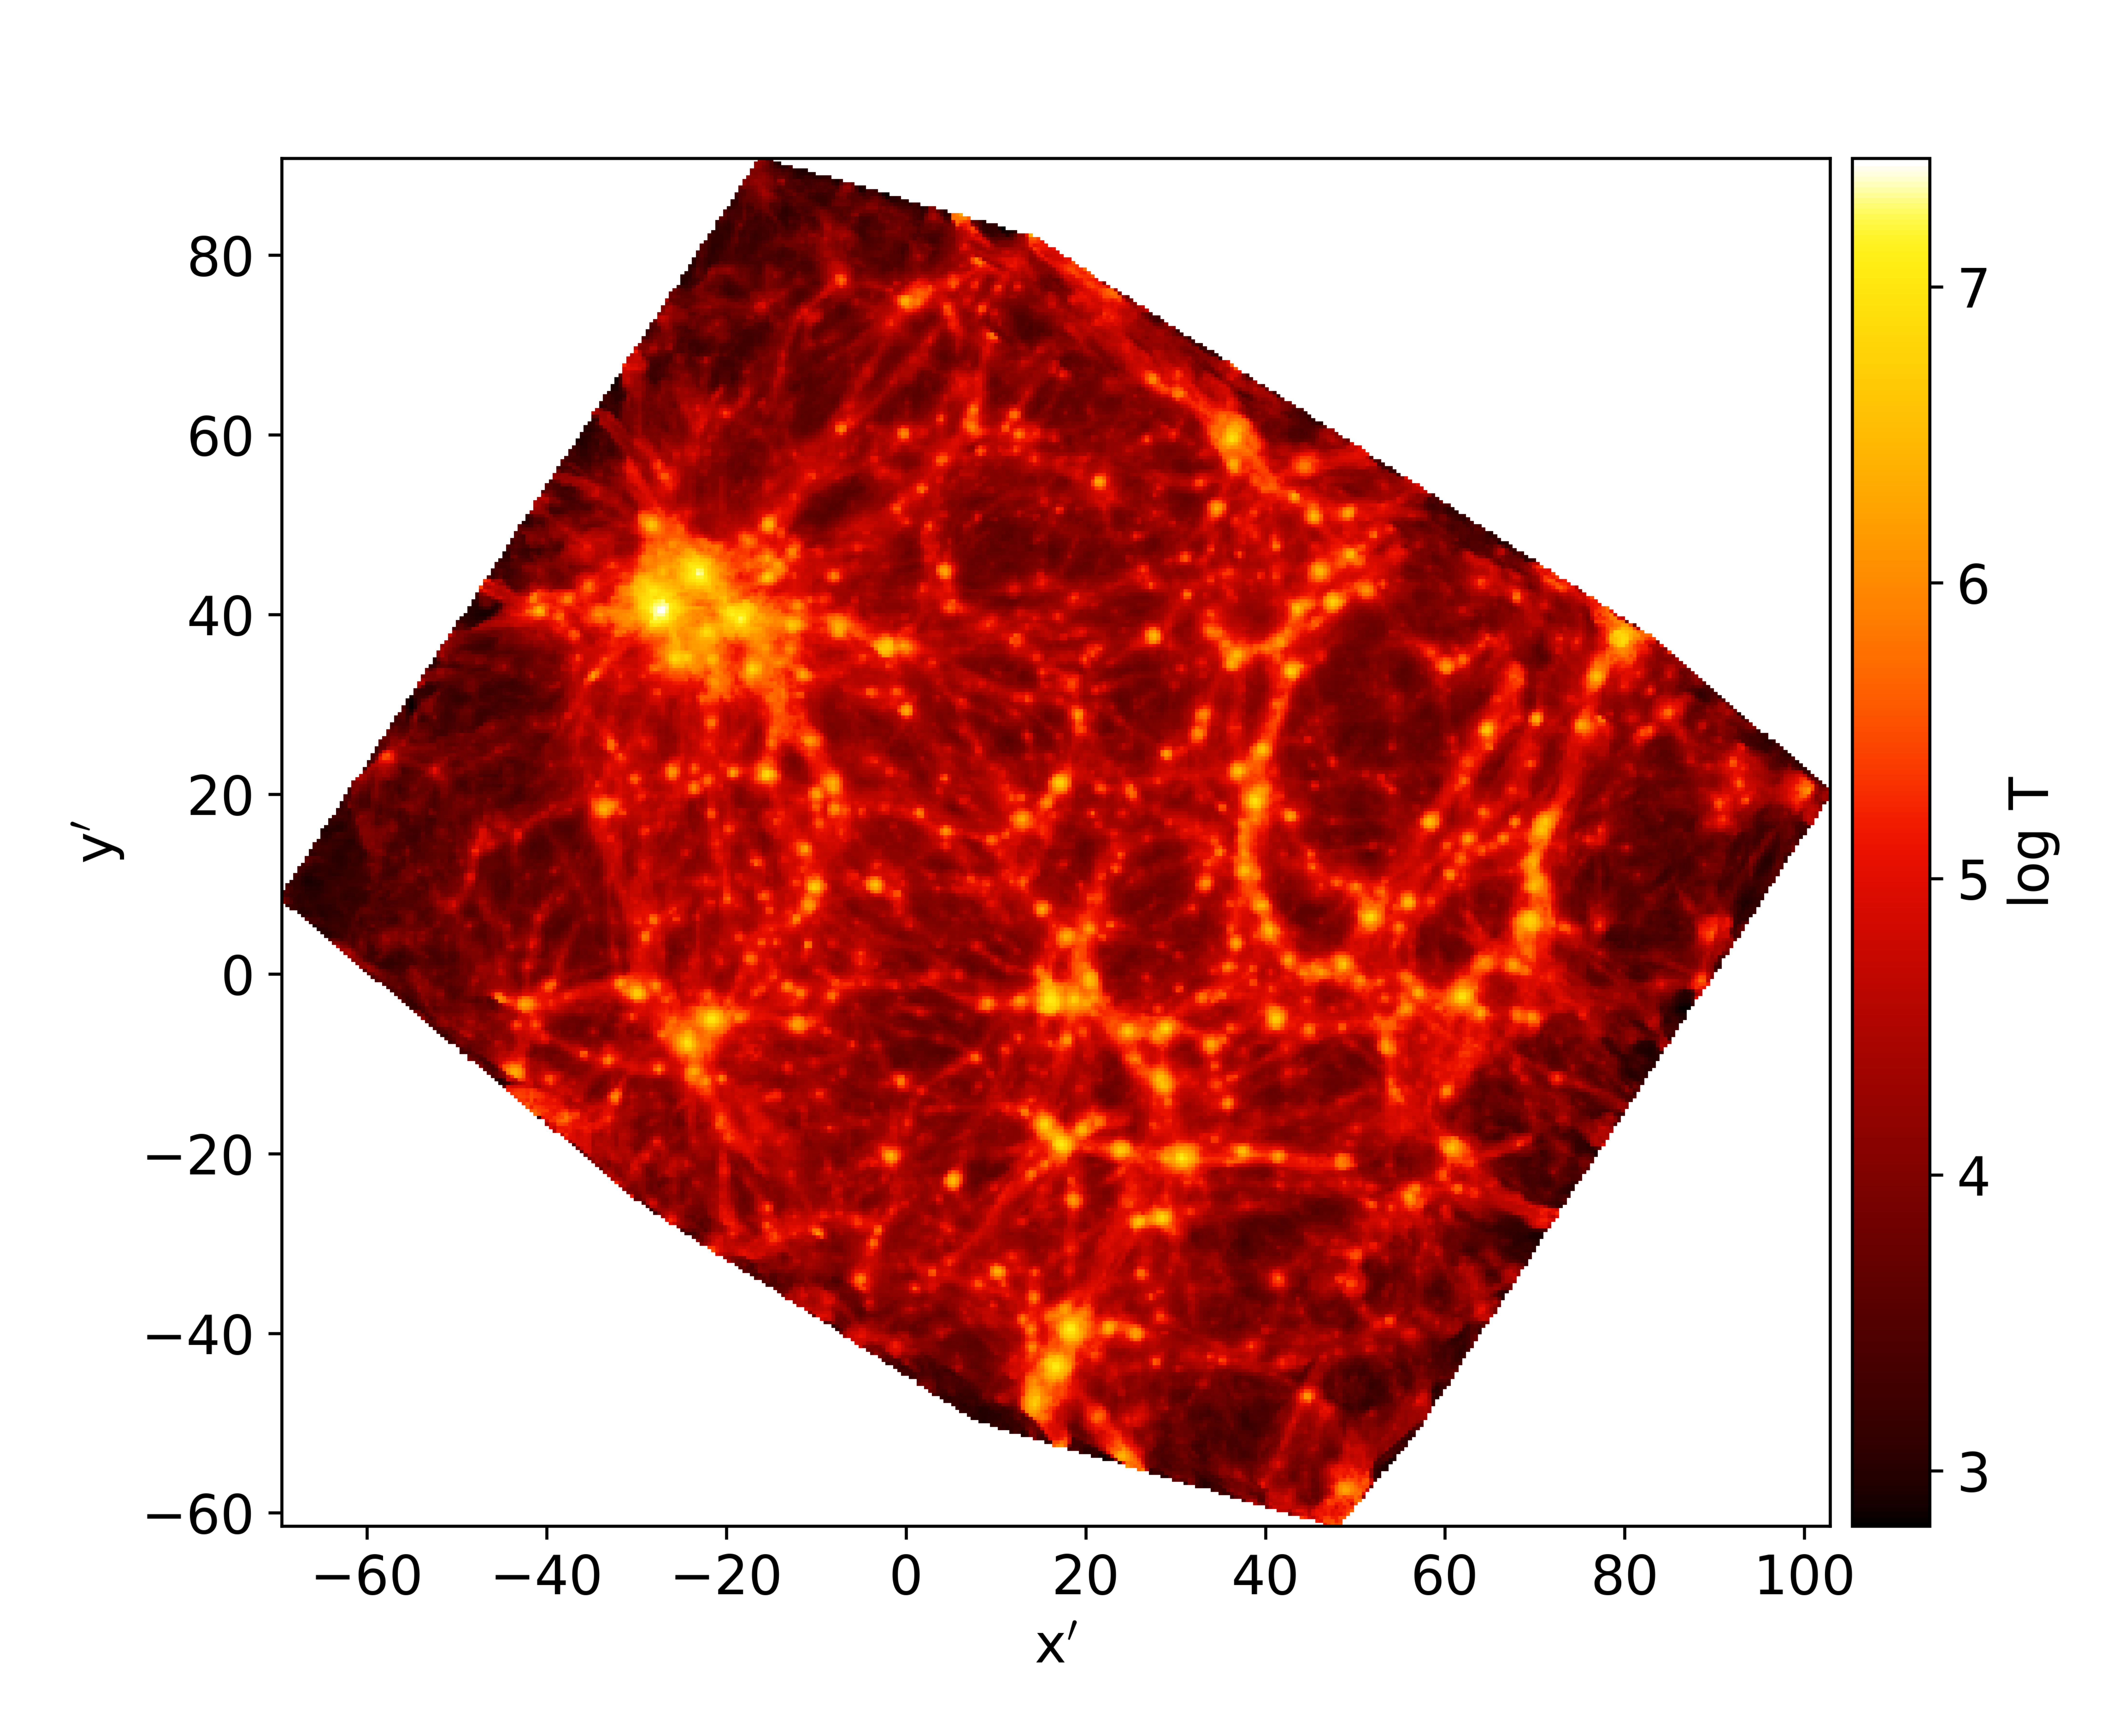
Even though the lower mass limit of our sample is 0.5 dex greater than the sample used by Crone Odekon et al. (2018), we can make use of the particle dataset to study the trends observed in the eagle simulation. In Fig. 7 we show that the gas mass fraction decreases with until Mpc from the spine of the filament, but at Mpc, the trend seems to reverse. It is worth noting that the stellar mass of galaxies also seems to increase within the same radius around the spine of filaments. These results, together with enhanced sSFR within Mpc from the spine from the filament (Fig. 7 (a)), indicate that the enhanced gas condensing in galaxies closer to the spine of the filaments may lead to an increase in the rate of formation of stars. This hypothesis is in tune with the results of Kleiner et al. (2017) as well as Fig. 9, where we have used the particle dataset from the eagle simulation to show the projected temperature map for the gas in the example slice shown in Fig. 3. It is evident that the filaments in the eagle simulation comprise gas at , which can fuel star formation in galaxies, especially closer to the spine of the filaments (Bonjean et al., 2019).
Darvish et al. (2015) studied 28 galaxies on filaments against 30 galaxies in voids from the COSMOS survey (; Scoville et al., 2007). They found that the star-forming galaxies on filaments have higher metallicity than their counterparts in the voids. Darvish et al. (2015) attributed this difference to the accretion of pre-enriched filamentary gas on to the filament galaxies. In a complimentary study of filaments at from the Horizon hydrodynamical simulation, Gay et al. (2010) also found that the gas-phase metallicity of galaxies increases with decreasing distance from the spine of the filaments. Our analysis shows similar trends in Fig. 8. However, we also note that the eagle simulations’ reference model used here (RefL0100N1504) is known to over-predict the metallicity relative to runs with smaller box lengths and observations (fig. 1; De Rossi et al., 2017b). But since this over-prediction is consistent throughout the box, it should not influence the trends observed in the metallicity as a function of environment.
Kuutma et al. (2017) used the SDSS data to study the statistical variation in the properties of galaxies on approaching the spine of the filaments. Kuutma et al. (2017) found that the galaxies become more elliptical and redder in the colour with decreasing distance from the spine of the filaments. Using a similar dataset, SM18 studied the Coma supercluster to find a similar increase in the colour index of galaxies with decreasing . A similar trend is reflected in the analysis presented here in Fig. 5. We find that the median colour of galaxies becomes redder with decreasing distance from the spine of filaments.
Alpaslan et al. (2016) analysed 1799 star-forming spiral galaxies () within Mpc of the centre of filaments using data from the Galaxy and Mass Assembly (GAMA) survey. In agreement with the results presented in this work as well as other literature (e.g. Kraljic et al., 2018; Laigle et al., 2018b), they found that galaxies closer to the spine of the filaments are more massive, and at fixed , galaxies are quenched closer to the spine of the filaments. Based on our own results and those presented in the literature we therefore suggest that along with stellar mass and large-scale environment, anisotropic tides along filaments impact the assembly history of galaxy halos, and hence the properties of galaxies.
4.2 Filaments vs groups and voids
In this section, we compare the properties of galaxies on filaments to their counterparts in groups and clusters, and the voids.
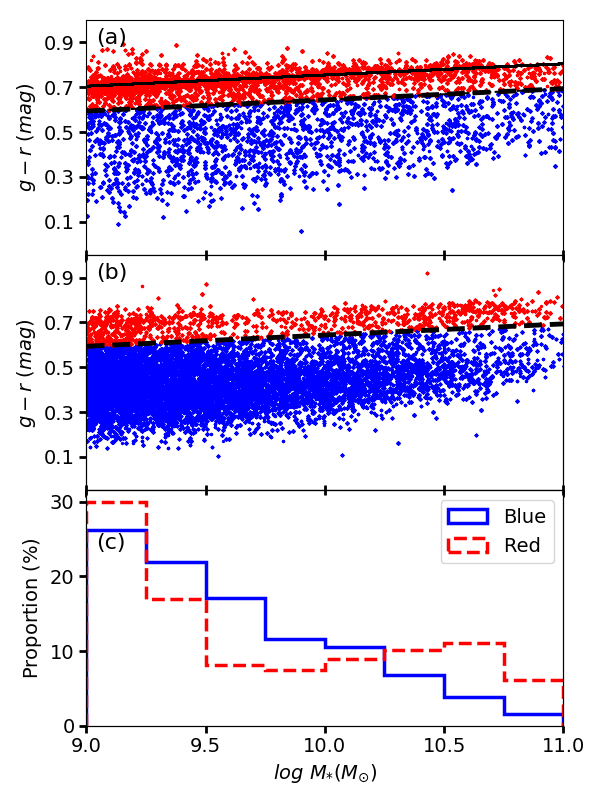
In Fig. 10 we show the distribution of galaxies in the colour- plane for the groups and filaments, respectively. In order to compare the two colour distributions, we fit the red sequence to the distribution of cluster galaxies. In this work, all galaxies with colour more than bluer than the red sequence are classified as blue galaxies, where is the standard deviation (0.055 mag) obtained by iteratively fitting the red sequence. It is evident from Fig. 10 (b) that there are fewer red galaxies on filaments, relative to the clusters. Specifically, while of the cluster galaxies are red, only of the filament galaxies follow suit.
In Fig. 10(c) we plot the kernel density estimates (KDE) of stellar mass for galaxies in both the colour selected populations of filament galaxies. KDE are closely related to histograms but are continuous and smooth. KDE is a non-parametric methods for calculating probability distribution of a variable using a non-negative function called kernel. We used Gaussian kernel and scott estimator (Scott, 2015) for bandwidth used in the kernel. A large fraction of the blue galaxies (77%) are found to have stellar mass, . On the other hand, while most of the red galaxies on filaments are massive, around of them have . The Welch’s t-test applied to the two distribution yields a p-value of , inferring that the two populations are statistically distinct. This result suggests that some environmental mechanism(s) may be responsible for quenching star formation in lower mass galaxies on filaments.
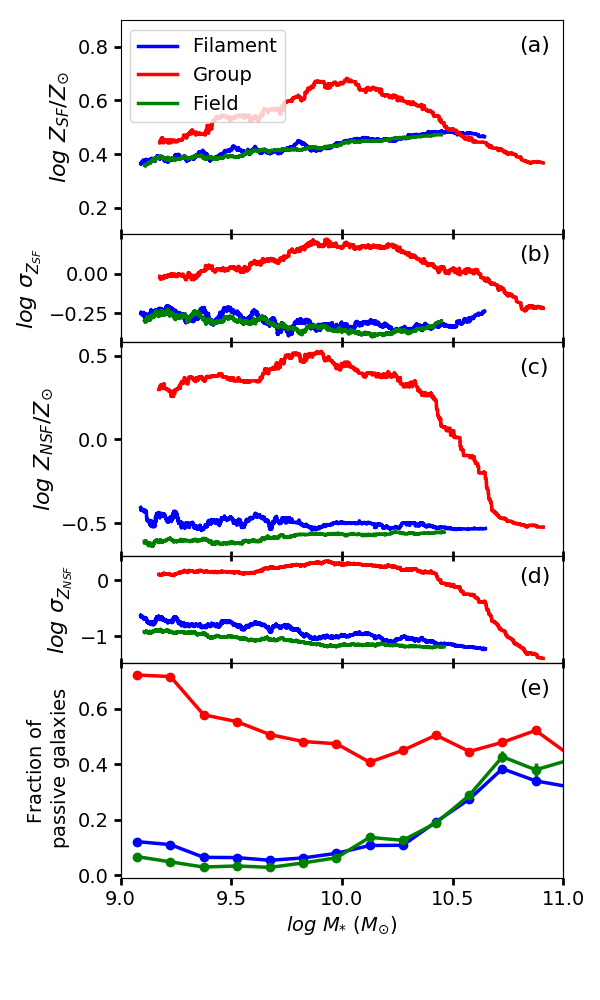
The metallicity of a galaxy is related to its stellar mass , such that more massive galaxies also have higher gas as well as stellar metallicities (McClure & van den Bergh, 1968; Lequeux et al., 1979; Garnett, 2002; Tremonti et al., 2004; Lee et al., 2006; Mannucci et al., 2010; Cresci et al., 2019). In Fig. 11(a and c) we show the median metallicity of the star-forming gas (), and the non-star forming (NSF) gas () as a function of in different environments. In agreement with the previous findings (De Rossi et al., 2017b), the NSF gas is found to be less metal rich relative to the star-forming gas. While the galaxies on filaments and voids show almost constant and , their counterparts in groups show marginally different trends on either side of , such that the Welch t-test probability is 0.045 in favour of the hypothesis that the distribution of for the lower mass galaxies () is statistically similar to their massive counterparts. The respective probability for for group galaxies is found to be . Such trends of lower in the most massive galaxies have also been observed in the Coma cluster (Poggianti et al., 2001), and the Coma supercluster (Tiwari et al., 2020).
Fig. 11 can be compared to fig. 1 of De Rossi et al. (2017b), who have also made use of the eagle simulation to compare the mass-metallicity relation obtained in simulations with various observational datasets and found them to agree within uncertainties. Our analysis indicates that the slope of the mass-metallicity relation is primarily determined by the galaxies in dense environments.
In Fig. 11(c) we show the fraction of passive galaxies () as a function of stellar mass in different environments. It is evident that in the groups’ environment, the fraction of low-mass () passive galaxies increases significantly with decreasing . On the other hand, the galaxies in filaments and voids show identical trends in the opposite direction, i.e. the fraction of passive galaxies increases with , particularly for galaxies with . This result is in broad agreement with the literature (e.g. Haines et al., 2006) where the dwarf galaxies are found to be passive only if they are a satellite to a massive galaxy. SM18 have also shown that the colour distribution of galaxies changes from voids to clusters, mainly because of a higher fraction of massive galaxies turning redder in dense environments.
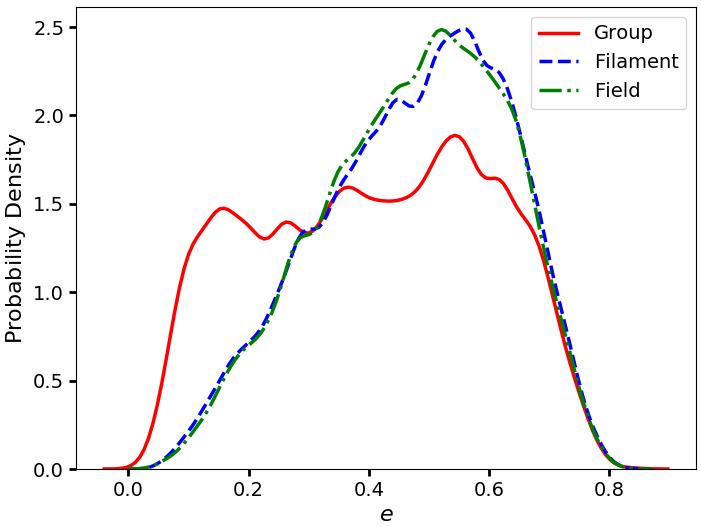
The morphology of galaxies can provide important clues to their evolution. In this work, we use the morphology of resolved galaxies having more than 300 stellar particles as per the procedure described by Thob et al. (2019). The shape parameters are derived using the reduced iterative inertia tensor in ellipsoidal apertures. Ellipticity is defined as:
| (4) |
where, and are the length of semi-minor and semi-major axis, respectively. In Fig. 12 we plot the distribution of for galaxies in different environments. The Welch’s t-test for all but one pairs of environments yield p-value of . The distribution of for the filament and void galaxies has the Welch’s t-test probability of 0.116 in favour of the hypothesis that the two distributions are identical, suggesting that the ellipticity of the void and filament galaxies are statistically indistinguishable. This result is in agreement with the observations (Alpaslan et al., 2015) where the GAMA survey data was used to show that the galaxies in filaments and voids have similar distributions of ellipticity, such that the maximum of the distribution lies in the range . On the other hand, the groups and clusters are dominated by low , i.e. more elliptical galaxies.
5 Conclusion
We employ data from the eagle simulations to explore properties of galaxies in different environments, in particular the large-scale filaments. We summarize the major findings of our analysis below:
-
•
Galaxies become redder and more passive closer to the central axis of the filaments. Furthermore, this trend is likely observed due to an increase in the relative fraction of passively-evolving galaxies having (Figs. 6, 10(c)) closer to the centre of the filaments. In agreement with the results from various observations, this trend is observed within a radius of 2 Mpc around the spine of the filament, thus providing an upper limit for the filaments’ radius.
-
•
Both, the gas and stellar mass fractions of galaxies rise closer to the spine of the filaments within Mpc. But at Mpc the SMF remains constant while the GMF rises smoothly with increasing distance from the spine of the filaments. Together with the findings from the literature, these results lead us to conclude that the observed trends are a consequence of increased gravitational interactions between filament galaxies closer to the spine of the filament. This enhancement in the interaction rate is caused by an increased number density of galaxies closer to the centre of the filaments.
-
•
The morphology of galaxies on filaments is similar to their counterparts in voids, but statistically distinct from the ones in clusters. However, fewer red galaxies are found on the filaments relative to clusters.
To conclude, our results indicate that many properties of galaxies on filaments are different from their counterparts in clusters and voids. The colour, star formation, metallicity and gas fraction of filament galaxies change as a function of their distance from the central axis of the filament. This could be an impact of the IFM as well as the number density of galaxies, both of which increase with decreasing . High resolution spectroscopic and HI data for galaxies covering all environments and a range of stellar masses are required to confirm our results. We hope the upcoming facilities such as the Vera Rubin Observatory (VRO) would be crucial for the same. At shorter wavelengths, the Advanced Telescope for High ENergy Astrophysics (ATHENA) x-ray observatory is likely to unravel the properties of the warm hot intergalactic medium (WHIM) in the 0.5–12 kev range.
6 Data availability
The data underlying this article were derived from sources in the public domain: http://icc.dur.ac.uk/Eagle/database.php
7 Acknowledgement
We are grateful to the reviewer for their suggestions which have greatly improved this manuscript. The authors would like to acknowledge the high-performance computing facility at IISER Mohali. We acknowledge the Virgo Consortium for making their simulation data available. The eagle simulations were performed using the DiRAC-2 facility at Durham, managed by the ICC, and the PRACE facility Curie based in France at TGCC, CEA, Bruyères-le-Châtel. Singh thanks Pooja Munjal, IISER Mohali, for her help in making Fig. 1. Mahajan is funded by the INSPIRE Faculty award (DST/INSPIRE/04/2015/002311), Department of Science and Technology (DST), Government of India.
References
- Alpaslan et al. (2015) Alpaslan M., et al., 2015, MNRAS, 451, 3249
- Alpaslan et al. (2016) Alpaslan M., et al., 2016, MNRAS, 457, 2287
- Bagla & Ray (2005) Bagla J. S., Ray S., 2005, MNRAS, 358, 1076
- Bagla et al. (2009) Bagla J. S., Prasad J., Khandai N., 2009, MNRAS, 395, 918
- Binggeli et al. (1988) Binggeli B., Sandage A., Tammann G. A., 1988, ARA&A, 26, 509
- Bond et al. (1996) Bond J. R., Kofman L., Pogosyan D., 1996, Nature, 380, 603
- Bonjean et al. (2018) Bonjean V., Aghanim N., Salomé P., Douspis M., Beelen A., 2018, A&A, 609, A49
- Bonjean et al. (2019) Bonjean V., Aghanim N., Douspis M., Malavasi N., Tanimura H., 2019, arXiv e-prints, p. arXiv:1912.06559
- Boselli et al. (2016) Boselli A., et al., 2016, A&A, 596, A11
- Bruzual & Charlot (2003) Bruzual G., Charlot S., 2003, MNRAS, 344, 1000
- Cen & Ostriker (1999) Cen R., Ostriker J. P., 1999, ApJ, 514, 1
- Chen et al. (2017) Chen Y.-C., et al., 2017, MNRAS, 466, 1880
- Correa et al. (2017) Correa C. A., Schaye J., Clauwens B., Bower R. G., Crain R. A., Schaller M., Theuns T., Thob A. C. R., 2017, MNRAS, 472, L45
- Crain et al. (2015) Crain R. A., et al., 2015, MNRAS, 450, 1937
- Cresci et al. (2019) Cresci G., Mannucci F., Curti M., 2019, A&A, 627, A42
- Croft et al. (2001) Croft R. A. C., Di Matteo T., Davé R., Hernquist L., Katz N., Fardal M. A., Weinberg D. H., 2001, ApJ, 557, 67
- Crone Odekon et al. (2018) Crone Odekon M., Hallenbeck G., Haynes M. P., Koopmann R. A., Phi A., Wolfe P.-F., 2018, ApJ, 852, 142
- Dalla Vecchia & Schaye (2012) Dalla Vecchia C., Schaye J., 2012, MNRAS, 426, 140
- Darvish et al. (2015) Darvish B., Mobasher B., Sobral D., Hemmati S., Nayyeri H., Shivaei I., 2015, ApJ, 814, 84
- De Rossi et al. (2017a) De Rossi M. E., Bower R. G., Font A. S., Schaye J., Theuns T., 2017a, MNRAS, 472, 3354
- De Rossi et al. (2017b) De Rossi M. E., Bower R. G., Font A. S., Schaye J., Theuns T., 2017b, MNRAS, 472, 3354
- Doi et al. (2010) Doi M., et al., 2010, AJ, 139, 1628
- Dolag et al. (2006) Dolag K., Meneghetti M., Moscardini L., Rasia E., Bonaldi A., 2006, MNRAS, 370, 656
- Dolag et al. (2009) Dolag K., Borgani S., Murante G., Springel V., 2009, MNRAS, 399, 497
- Donoso et al. (2006) Donoso E., O’Mill A., Lambas D. G., 2006, MNRAS, 369, 479
- Dressler et al. (1997) Dressler A., et al., 1997, ApJ, 490, 577
- Einasto et al. (1984) Einasto J., Klypin A. A., Saar E., Shandarin S. F., 1984, MNRAS, 206, 529
- Fadda et al. (2008) Fadda D., Biviano A., Marleau F. R., Storrie-Lombardi L. J., Durret F., 2008, ApJ, 672, L9
- Furlong et al. (2015) Furlong M., et al., 2015, MNRAS, 450, 4486
- Garnett (2002) Garnett D. R., 2002, ApJ, 581, 1019
- Gay et al. (2010) Gay C., Pichon C., Le Borgne D., Teyssier R., Sousbie T., Devriendt J., 2010, MNRAS, 404, 1801
- Giovanelli et al. (2005) Giovanelli R., et al., 2005, AJ, 130, 2598
- Gunn & Gott (1972) Gunn J. E., Gott J. Richard I., 1972, ApJ, 176, 1
- Guo et al. (2015) Guo Q., Tempel E., Libeskind N. I., 2015, ApJ, 800, 112
- Haardt & Madau (2001) Haardt F., Madau P., 2001, in Neumann D. M., Tran J. T. V., eds, Clusters of Galaxies and the High Redshift Universe Observed in X-rays. p. 64 (arXiv:astro-ph/0106018)
- Haines et al. (2006) Haines C. P., La Barbera F., Mercurio A., Merluzzi P., Busarello G., 2006, ApJ, 647, L21
- Haines et al. (2011) Haines C. P., Busarello G., Merluzzi P., Smith R. J., Raychaudhury S., Mercurio A., Smith G. P., 2011, MNRAS, 412, 145
- Hewett et al. (2006) Hewett P. C., Warren S. J., Leggett S. K., Hodgkin S. T., 2006, MNRAS, 367, 454
- Jones et al. (2009) Jones D. H., et al., 2009, MNRAS, 399, 683
- Kauffmann et al. (2004) Kauffmann G., White S. D. M., Heckman T. M., Ménard B., Brinchmann J., Charlot S., Tremonti C., Brinkmann J., 2004, MNRAS, 353, 713
- Kennicutt (1998) Kennicutt Robert C. J., 1998, ApJ, 498, 541
- Kewley et al. (2006) Kewley L. J., Geller M. J., Barton E. J., 2006, AJ, 131, 2004
- Kleiner et al. (2017) Kleiner D., Pimbblet K. A., Jones D. H., Koribalski B. S., Serra P., 2017, MNRAS, 466, 4692
- Kraljic et al. (2018) Kraljic K., et al., 2018, MNRAS, 474, 547
- Kruskal & Wallis (1952) Kruskal W. H., Wallis W. A., 1952, Journal of the American Statistical Association, 47, 583
- Kuutma et al. (2017) Kuutma T., Tamm A., Tempel E., 2017, A&A, 600, L6
- Laigle et al. (2018a) Laigle C., et al., 2018a, MNRAS, 474, 5437
- Laigle et al. (2018b) Laigle C., et al., 2018b, MNRAS, 474, 5437
- Lambas et al. (1988) Lambas D. G., Groth E. J., Peebles P. J. E., 1988, AJ, 95, 996
- Lee et al. (2006) Lee H., Skillman E. D., Cannon J. M., Jackson D. C., Gehrz R. D., Polomski E. F., Woodward C. E., 2006, ApJ, 647, 970
- Lequeux et al. (1979) Lequeux J., Peimbert M., Rayo J. F., Serrano A., Torres-Peimbert S., 1979, A&A, 500, 145
- Liao & Gao (2019) Liao S., Gao L., 2019, MNRAS, 485, 464
- Libeskind et al. (2018) Libeskind N. I., et al., 2018, MNRAS, 473, 1195
- Luber et al. (2019) Luber N., van Gorkom J. H., Hess K. M., Pisano D. J., Fernández X., Momjian E., 2019, AJ, 157, 254
- Mahajan et al. (2012) Mahajan S., Raychaudhury S., Pimbblet K. A., 2012, MNRAS, 427, 1252
- Mahajan et al. (2018) Mahajan S., Singh A., Shobhana D., 2018, MNRAS, 478, 4336
- Malavasi et al. (2017) Malavasi N., et al., 2017, MNRAS, 465, 3817
- Mannucci et al. (2010) Mannucci F., Cresci G., Maiolino R., Marconi A., Gnerucci A., 2010, MNRAS, 408, 2115
- Martizzi et al. (2018) Martizzi D., et al., 2018, arXiv e-prints, p. arXiv:1810.01883
- McAlpine et al. (2016) McAlpine S., et al., 2016, Astronomy and Computing, 15, 72
- McClure & van den Bergh (1968) McClure R. D., van den Bergh S., 1968, AJ, 73, 1008
- Mesa et al. (2018) Mesa V., Duplancic F., Alonso S., Muñoz Jofré M. R., Coldwell G., Lambas D. G., 2018, A&A, 619, A24
- Moore et al. (1996) Moore B., Katz N., Lake G., Dressler A., Oemler A., 1996, Nature, 379, 613
- Peng et al. (2012) Peng Y.-j., Lilly S. J., Renzini A., Carollo M., 2012, ApJ, 757, 4
- Planck Collaboration et al. (2014) Planck Collaboration et al., 2014, A&A, 571, A16
- Poggianti et al. (2001) Poggianti B. M., et al., 2001, ApJ, 562, 689
- Porter & Raychaudhury (2007) Porter S. C., Raychaudhury S., 2007, MNRAS, 375, 1409
- Porter et al. (2008) Porter S. C., Raychaudhury S., Pimbblet K. A., Drinkwater M. J., 2008, MNRAS, 388, 1152
- Schaye (2004) Schaye J., 2004, ApJ, 609, 667
- Schaye & Dalla Vecchia (2008) Schaye J., Dalla Vecchia C., 2008, MNRAS, 383, 1210
- Schaye et al. (2015) Schaye J., et al., 2015, MNRAS, 446, 521
- Scott (2015) Scott D. W., 2015, Multivariate Density Estimation: Theory, Practice, and Visualization
- Scoville et al. (2007) Scoville N., et al., 2007, ApJS, 172, 1
- Sobral et al. (2015) Sobral D., Stroe A., Dawson W. A., Wittman D., Jee M. J., Röttgering H., van Weeren R. J., Brüggen M., 2015, MNRAS, 450, 630
- Sousbie (2011) Sousbie T., 2011, MNRAS, 414, 350
- Springel et al. (2001) Springel V., White S. D. M., Tormen G., Kauffmann G., 2001, MNRAS, 328, 726
- Springel et al. (2005) Springel V., Di Matteo T., Hernquist L., 2005, MNRAS, 361, 776
- Staveley-Smith et al. (2000) Staveley-Smith L., Koribalski B. S., Stewart I., Putman M. E., Kilborn V. A., Webster R. L., 2000, in Mangum J. G., Radford S. J. E., eds, Astronomical Society of the Pacific Conference Series Vol. 217, Imaging at Radio through Submillimeter Wavelengths. p. 50
- Stroe et al. (2015) Stroe A., et al., 2015, MNRAS, 450, 646
- Tanimura et al. (2019) Tanimura H., et al., 2019, MNRAS, 483, 223
- Tempel et al. (2014) Tempel E., Stoica R. S., Martínez V. J., Liivamägi L. J., Castellan G., Saar E., 2014, MNRAS, 438, 3465
- Thob et al. (2019) Thob A. C. R., et al., 2019, MNRAS, 485, 972
- Tiwari et al. (2020) Tiwari J., Mahajan S., Singh K. P., 2020, arXiv e-prints, p. arXiv:2005.02757
- Trayford et al. (2015) Trayford J. W., et al., 2015, MNRAS, 452, 2879
- Trayford et al. (2016) Trayford J. W., Theuns T., Bower R. G., Crain R. A., Lagos C. d. P., Schaller M., Schaye J., 2016, MNRAS, 460, 3925
- Tremonti et al. (2004) Tremonti C. A., et al., 2004, ApJ, 613, 898
- Vulcani et al. (2019) Vulcani B., et al., 2019, MNRAS, 487, 2278
- Weinmann et al. (2009) Weinmann S. M., Kauffmann G., van den Bosch F. C., Pasquali A., McIntosh D. H., Mo H., Yang X., Guo Y., 2009, MNRAS, 394, 1213
- Welch (1947) Welch B. L., 1947, Biometrika, 34, 28
- Wiersma et al. (2009a) Wiersma R. P. C., Schaye J., Smith B. D., 2009a, MNRAS, 393, 99
- Wiersma et al. (2009b) Wiersma R. P. C., Schaye J., Theuns T., Dalla Vecchia C., Tornatore L., 2009b, MNRAS, 399, 574
- Zeldovich et al. (1982) Zeldovich I. B., Einasto J., Shandarin S. F., 1982, Nature, 300, 407