Possible octupole deformation of 208Pb and the ultracentral to puzzle
Abstract
Recent measurements have established the sensitivity of ultracentral heavy-ion collisions to the deformation parameters of non-spherical nuclei. In the case of 129Xe collisions, a quadrupole deformation of the nuclear profile led to an enhancement of elliptic flow in the most central collisions. In 208Pb collisions a discrepancy exists in similar centralities, where either elliptic flow is over-predicted or triangular flow is under-predicted by hydrodynamic models; this is known as the -to- puzzle in ultracentral collisions. Motivated by low-energy nuclear structure calculations, we consider the possibility that 208Pb nuclei could have a pear shape deformation (octupole), which has the effect of increasing triangular flow in central PbPb collisions. Using the recent data from ALICE and ATLAS, we revisit the -to- puzzle in ultracentral collisions, including new constraints from recent measurements of the triangular cumulant ratio and comparing two different hydrodynamic models. We find that, while an octupole deformation would slightly improve the ratio between and , it is at the expense of a significantly worse triangular flow cumulant ratio. In fact, the latter observable prefers no octupole deformation, with for 208Pb, and is therefore consistent with the expectation for a doubly-magic nucleus even at top collider energies. The -to- puzzle remains a challenge for hydrodynamic models.
I Introduction
The precision of heavy-ion collisions has reached the point that differences in the collective flow can be predicted between beam energies at the level of a few percent Noronha-Hostler et al. (2016a); Niemi et al. (2016a); Adam et al. (2016a). While minor model differences remain in terms of both the initial conditions and transport coefficients, the vast majority of collaborations can now fit (and predict) the “bread and butter” observables such as charged particle spectra and two-particle azimuthal anisotropies Song et al. (2011); Bozek and Wyskiel-Piekarska (2012); Gardim et al. (2012); Bozek and Broniowski (2013); Niemi et al. (2016b); Ryu et al. (2015); McDonald et al. (2017); Bernhard et al. (2016); Gardim et al. (2017); Alba et al. (2018); Giacalone et al. (2018); Eskola et al. (2018); Weller and Romatschke (2017); Schenke et al. (2019). Extractions from the above theoretical models have generally converged on a minimum in the shear viscosity to entropy density ratio of with a maximum in the bulk viscosity to entropy density ratio at . While a number of questions still remain about the exact scale that initial conditions probe Gardim et al. (2018); Noronha-Hostler et al. (2016b); Gardim et al. (2018); Nagle and Zajc (2019); Hippert et al. (2020); Nunes da Silva et al. (2020) and the limitations of hydrodynamics in small systems Acharya et al. (2019a), a general consensus has emerged within the community about the applicability of event-by-event relativistic viscous hydrodynamics in large AA collisions.
Therefore, when there are deviations of experimental flow data from theoretical calculations in large systems, it generally signifies missing physics that goes beyond the above paradigm. One recent example was the measurement of a significant enhancement in in central 129Xe129Xe collisions compared to expectations that assumed a spherical nucleus. However, the 129Xe nucleus is expected to have a small quadrupole deformation, and this enhancement is explained by such an effect Giacalone et al. (2018); Acharya et al. (2018a, 2019b); Collaboration (2018); collaboration (2018). Previous studies Adamczyk et al. (2015); Goldschmidt et al. (2015); Dasgupta et al. (2017); Giacalone (2019a) of collisions of 238U, which is known to have a substantial quadrupole deformation, also found an enhancement in the elliptic flow in ultracentral events. In both of these cases the nuclei have a quadrupole (and a small hexadecapole ), leading to an enhanced elliptic shape and hence to an increase in in ultracentral collisions. Additional proposals include studying the effect of alpha clustering in Lim et al. (2019); Citron et al. (2019); Rybczyński and Broniowski (2019), scanning small deformed ions Noronha-Hostler et al. (2019), and exploring polarized nuclear beams Bozek and Broniowski (2018); Broniowski and Bożek (2019). Recent work discussing the details of measuring deformations using heavy-ion collisions can be found in Refs. Giacalone (2019b, 2020). Typically the most sensitivity to nuclear deformation occurs in central collisions; this is because at zero impact parameter the anisotropy occurs solely due to fluctuations, while in other centralities the impact region is dominated by the almond overlap shape. Furthermore, other sources of fluctuations which scale with the system size will have the smallest effect in central collisions where the overlap region is the largest.
Similarly, it has been noted that ultracentral 208Pb208Pb collisions exhibit a relationship between and that is not shown by any existing theoretical model Luzum and Ollitrault (2013); Collaboration (2012); Shen et al. (2015); Rose et al. (2014). While theoretical calculations which treat the 208Pb nucleus as spherical predict a natural hierarchy of , the data instead show . As a result, the models all either underpredict the triangular flow or overpredict the elliptic flow in ultracentral 208Pb208Pb collisions. A number of attempts have been made to resolve this puzzle by varying the initial conditions Luzum and Ollitrault (2013); Shen et al. (2015); Gelis et al. (2019), the transport coefficients Luzum and Ollitrault (2013); Rose et al. (2014), and the equation of state Alba et al. (2018), but it still remains a generic feature of models. In addition to this discrepancy among the two-particle correlations and , it was also pointed out that the four-particle correlation also contains discrepancies between theory and data in very central collisions Giacalone et al. (2017). In the four-particle sector, the hydrodynamic models tended to underpredict the ratio Chatrchyan et al. (2014); Aamodt et al. (2011); Aad et al. (2014), which corresponds to overestimating the width of the event-by-event fluctuations in .
The reason that the hierarchy emerges from hydrodynamic models in ultracentral collisions is as follows. In heavy ion collisions and especially in central collisions of large systems, there is a strong linear mapping from the initial-state geometry to the final-state collective flow. This mapping is quantified by the nearly linear proportionality between the initial-state eccentricity vectors and the final-state flow vectors
| (1) |
Non-linear corrections to the hydrodynamic response can become significant in more peripheral collisions but are negligible in the ultracentral region considered here Noronha-Hostler et al. (2016c); Sievert and Noronha-Hostler (2019); Rao et al. (2019). The linear response coefficients thus encode the entire hydrodynamic evolution and properties of the medium.
In ultracentral collisions, where the impact parameter nearly vanishes, the mean-field geometry of the collision is perfectly round (at least for spherical nuclei). Then on average, and it is the event-by-event fluctuations of the geometry which produce both and , leading to . However, this picture is changed somewhat by the effects of viscosity. Although both the elliptic and triangular harmonics are comparable at level of the initial eccentricities, the relative magnitudes of the final depend on the size of the response coefficients , and dissipative effects naturally lead to . Thus, initial conditions for round nuclei will generically exhibit an relationship, leading to in the final state, in disagreement with the data.111The values of and depend on the range of transverse momentum, and so one does not always have . Nevertheless, the dependence is the same in theory and experiment, and so the discrepancy remains, regardless of the details of the measurement. To overcome the additional viscous suppression of in the final state, instead one needs an initial state with .
In light of the recent studies on deformed nuclei in central heavy ion collisions, it’s natural to question if 208Pb may also be showing signs of nuclear deformation. This would be somewhat surprising since 208Pb is a highly stable nucleus with doubly-magic atomic number; nuclear structure tables indicate that the octupole deformation, , is zero Möller et al. (2016). However, a recent paper did predict a finite using a Minimization After Projection model Robledo and Bertsch (2011). Additionally, nuclear structure experiments are performed at significantly lower beam energies – multiple orders of magnitude lower than relativistic heavy ion collisions — and the structure of the nucleus may evolve from low to high energies. Finally, nuclear structure experiments only probe the electric charge density and its associated geometry, whereas heavy-ion collisions probe the color charge density and its associated geometry. A difference in the geometry of electric charge from the full geometry of nuclear matter, such as a neutron skin Tarbert et al. (2014), could modify the initial geometry relevant for heavy-ion collisions. It seems plausible then, that the deformation parameters such as could be different between the electric and color charge densities in 208Pb. Furthermore, the neutron skin has been a point of interest for both low-energy nuclear collisions Abrahamyan et al. (2012) and also for neutron stars’ mass radius relationship Horowitz and Piekarewicz (2001); Fattoyev and Piekarewicz (2012); Fattoyev et al. (2018).
In this paper we explore the possibility of an octupole deformation in 208Pb. Since the original papers on the -to- puzzle came out, the LHC has also had a subsequent run at 5.02 TeV with a higher luminosity, which has led to significantly smaller error bars in their experimental data. Between updates in the medium effects (e.g. improvements in the equation of state) and these smaller error bars, we find that the to puzzle in ultracentral collisions is significantly smaller than originally thought. Nevertheless, we find that an octupole deformation does not explain the remaining discrepancy. Further, by using recent data from ATLAS Aaboud et al. (2020) we can place a limit on the octupule deformation of 208Pb in our models. The rest of this paper is structured as follows. In Sec. II we discuss the properties of the initial state, including a discussion in Sec. II.1 introducing the deformation parameters and the calculation in Sec. II.2 of the second and fourth cumulants of the initial-state eccentricities in two different models. In Sec. III we discuss the two hydrodynamical models we will be comparing: v-USPhydro and MUSIC. In Sec. IV we compare the results of the two hydrodynamic simulations against data to assess the impact on the -to- puzzle, and we summarize our conclusions in Sec. V.
II Initial State
II.1 Octupole deformation in 208Pb
Modern simulations of heavy-ion collisions begin by sampling the position of each nucleon in a nucleus on an event-by-event basis from a Woods-Saxon distribution, in order to obtain the geometrical structure of the heavy ion. Generally the two-parameter Woods-Saxon distribution is given in spherical coordinates by
| (2) |
The Woods-Saxon profile (2) yields a nearly constant density for which transitions into an exponential falloff for . For a deformed nucleus, the radius is not taken to be constant, but becomes a function of the angle , which can be decomposed into a complete sum of spherical harmonics:
| (3) |
For a spherical nucleus we have , with nonzero values induced by a quadrupole, octupole, or hexadecupole deformation, respectively. In principle, the summation (3) of extends over all , but for our present purposes we consider only the octupole deformation . Initial condition models will vary in the details of effects beyond the nucleon-level position sampling, such as color charge fluctuations, constitutent quarks, strings, and minijets; however, since the foundation is the Wood-Saxon distribution (2), any deformation has a relatively generic effect.
In Ref. Robledo and Bertsch (2011), a Minimization After Projection model was used to predict the octupole deformation of 208Pb, finding in the ground state. However, using a Hartree-Fock-Bogoliubov calculation, the authors instead found . The authors also cite an expected error for the comparison of these deformation parameters between theory and experiment. Thus, from nuclear structure considerations we expect that the octupole deformation of 208Pb should be constrained to . Here we check a range of for 208Pb compared to experimental data in order to quantify its effect.
In order to generate initial conditions with an octupole deformation, we have modified the Trento initial condition model Moreland et al. (2015) to include a nonzero . In Trento we use the geometric mean (so that the entropy density at proper time fm/ is proportional to ), fluctuation parameter , and nucleon width . This setup was obtained from a Bayesian analysis of experimental data Bernhard et al. (2016) and has been successful in a number of predictions across systems size Giacalone et al. (2018). Additionally, we compare this to an alternative initial condition satisfying a linear scaling due to the recent discussion in Refs. Lappi (2006); Nagle and Zajc (2019); Romatschke and Romatschke (2019); Chen et al. (2015), which we have also modified Trento to include. With linear scaling we must also adjust the multiplicity fluctuations and there we considered . However, all hydrodynamic simulations are performed using Trento.
II.2 Eccentricities
While the impact parameter in heavy ion collisions is not directly measurable, proxy measures such as the number of produced particles (which is anticorrelated with impact parameter) can be used instead. When binned into centrality percentiles, the produced multiplicity is greatest in the events with complete overlap of the ions and small impact parameter. For the most central collisions (say centrality), the impact parameter is essentially zero; finer binning into ultra-central collisions is additionally sensitive to nuclear deformation and to fluctuations in particle production Noronha-Hostler et al. (2019).
Since the number of produced particles in the final state is controlled by the entropy of the system at freeze-out, centrality binning by entropy is a good approximation to centrality determined by multiplicity. Moreover, due to the low viscosity of the quark-gluon plasma, the total entropy is nearly conserved, allowing us to approximately determine an event’s centrality directly from the initial state. Then, in a given event, the eccentricities calculated in the center of mass frame are defined as
| (4) |
with the entropy density in polar coordinates. In the center of mass frame, identically222Not to be confused with the dipole asymmetry, which is often notated as , and quantify the elliptic and triangular shape of the impact region, respectively. Because of the (anti)correlation between impact parameter and centrality, there is a strong dependence of the ellipticity on centrality: is maximal in mid-central collisions where the elliptical shape of the overlap region is most prominent.
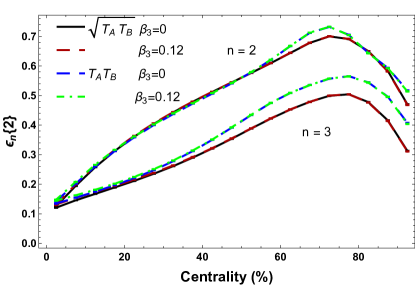
Compared to the ellipticity , the triangularity is zero at a mean-field level, being driven entirely by the event-by-event fluctuations away from a smooth Woods-Saxon profile (2). As a result, the dependence of versus centrality is therefore flatter than for , growing only as the transverse size of the collision area decreases, as shown in Fig. 1. In fact, one can vary quite significantly without any visible effect in mid-central to peripheral collisions. Only in central collisions (i.e. ) are differences visible for a deformed nucleus with nonzero .
 |
 |
 |
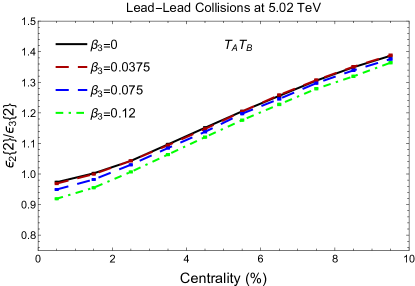 |
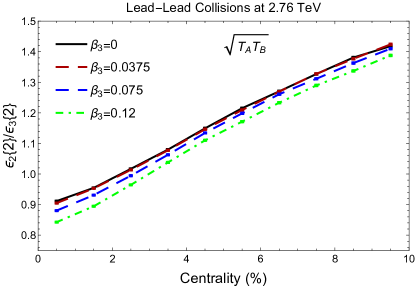
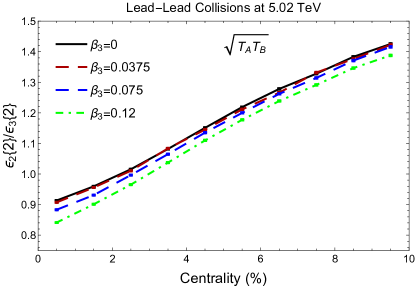
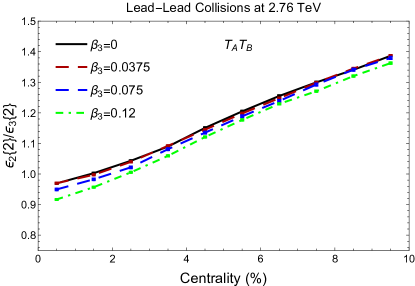
In Fig. 2 we study the central collisions in more detail by comparing the ratio of the triangularity to ellipticity. This initial-state quantity is not equal to in the final state because the response coefficients in Eq. (4) do not cancel; still a change in eccentricity ratio will be reflected directly in the final-state flow ratio. We show results for Pb Pb collisions at both 2.76 TeV and 5.02 TeV for a range of octupole values. We also compare the eccentricities obtained from the Bayesian-preferred geometric mean of Trento versus those of a linear scaling , inspired by CGC expectations for the mean energy density at early times Lappi (2006); Nagle and Zajc (2019); Romatschke and Romatschke (2019); Chen et al. (2015). We find that is slightly more likely to provide eccentricities compatible with experimental data. This is because in the most central collisions that we consider here () we find that leads to by , compared to the linear scaling which leads to a smaller enhancement of only a few percent. As discussed previously, initial conditions with in central collisions are needed in order to obtain the observed after viscous damping of the higher harmonics. Finally, we note that there does not appear to be a strong beam energy dependence to this ratio, consistent with other studies Rao et al. (2019).
 |
 |
 |
 |
While the ratio of and has received the most attention, there are also important discrepancies in the ratio of predicted by models. In Ref. Giacalone et al. (2017) it was pointed out that
| (5) |
due to the nearly-linear response in central collisions. To ensure that this ratio holds, we ran 11,000 events in the centrality class and compared the initial-state ratio of eccentricities versus the final-state hydrodynamic flow. We found that the difference between and was less than , giving confidence that we can compare the eccentricity ratio for the initial condition models directly. This assumption is important since this observable requires extremely high statistics, on the order of 15 million events to cover a wide centrality range, so that running full hydrodynamic simulations would be prohibitive.
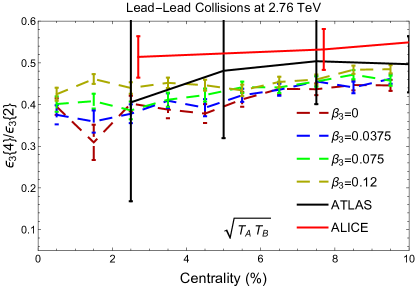
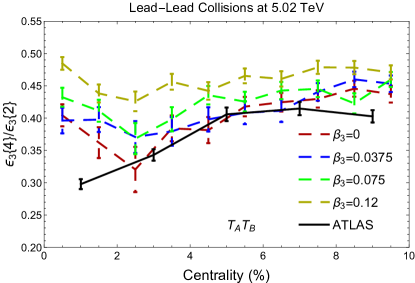
In Fig. 3 we plot the cumulant ratio as is varied and find that the larger , the more this ratio is enhanced. The previous comparisons for this observable Giacalone et al. (2017) were for Pb Pb collisions at 2.76 TeV where the estimated experimental errors were quite large. Importantly, these uncertainties are certainly overestimated because the covariance was not reported by the experimental collaborations, so that the uncertainties in the ratio overcount the correlated errors. Comparing the variations to previous experimental results at 2.76 TeV, we find that no range of can be eliminated from and, in fact, appears to be preferred compared to ALICE results Acharya et al. (2019a).
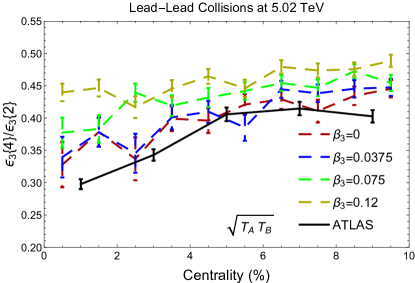
However, due to the higher luminosity at 5.02 TeV and because the ATLAS experiment did report the complete uncertainty for the ratio , this ratio can be used to put constraints on the parameter. Since in this ratio the linear response coefficient cancels, it is mostly sensitive to the choice of initial state models rather than medium properties. In fact, for scaling only and fit within the ATLAS experimental error bands, which allows us to set the upper bound . Interestingly, scaling consistently overpredicts ATLAS data and appears to be significantly less sensitive to the deformation parameter compared to . While scaling is not well-motivated from a theoretical perspective, it appears to better capture the features of the experimental data.
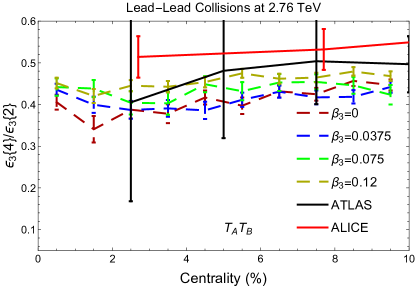
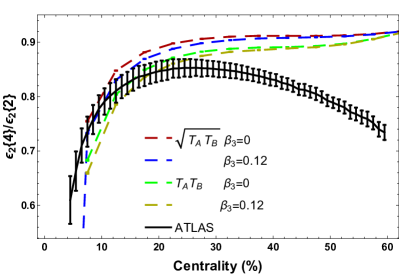
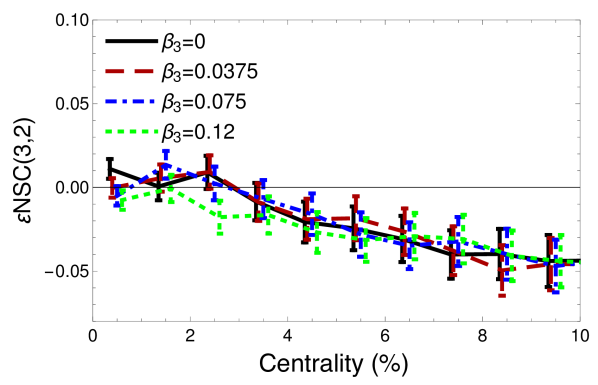
For completeness, in Fig. 4 we also plot the cumulant ratio for of 0 and 0.12 for both scalings. From 0-20% Centrality there is good agreement to ALICE data Acharya et al. (2019a) from the deformations with the higher deformation showing some tension with data in very central collisions. Above 30% Centrality all models start to deviate significantly from data, reflecting the onset of nonlinear response in mid-central collisions.
III Hydrodynamical model
We study the hydrodynamic response to these initial conditions by performing full simulations, and to ensure the results are not unique to a particular hydrodynamic model, we perform calculations within two different frameworks for comparison.
The first model uses the hydrodynamic code v-USPhydro Noronha-Hostler et al. (2013, 2014) (Parameter 1), which solves the equations of motion using Smoothed Particle Hydrodynamics. There the shear viscosity to entropy density ratio is taken to be a constant , the bulk viscosity is set to , and the freeze-out temperature is MeV. The equation of state used is WB21/PDG16+ Alba et al. (2018), which has been shown before to fit experimental data well across system sizes and beam energies Alba et al. (2018); Giacalone et al. (2018) with other predictions in ArAr and OO systems still remaining to be confirmed Sievert and Noronha-Hostler (2019). One crucial emphasis of this model is on the detailed treatment of feed-down decays: the hydrodynamic phase is followed by direct decays Sollfrank et al. (1991); Wiedemann and Heinz (1997) using all known resonances from the PDG16+ Alba et al. (2017). The philosophy behind this method is to use the most state-of-the-art list of particles, which most closely matches Lattice QCD results Alba et al. (2017) but this sacrifices hadronic transport afterwards because many of these resonances decay into 3 or 4 bodies, which have not yet been incorporated into SMASH Ono et al. (2019) or URQMD.
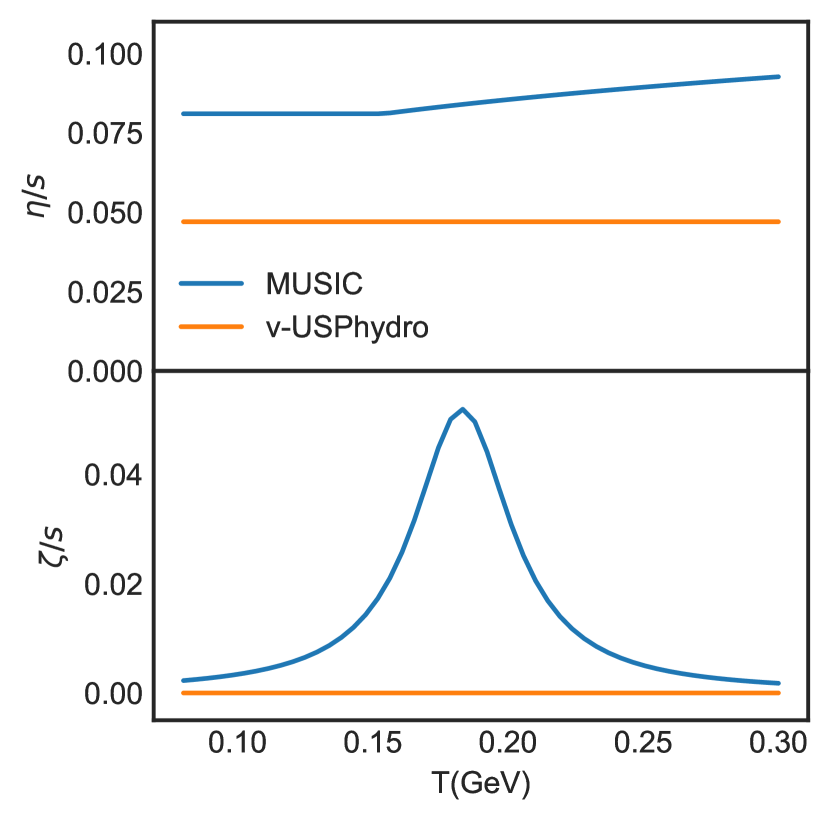
The second hydrodynamic model uses MUSIC Schenke et al. (2010, 2011) (Parameter 2), a grid-based code. Here all fluid parameters are taken as the Maximum a Posteriori (MAP) values from the Bayesian analysis of momentum integrated observables reported in Table 5.9 of Ref. Bernhard et al. (2016). Both and depend on temperature, as shown in Fig. 5. The equation of state used is s95p-v1.2 Huovinen and Petreczky (2010). When the system reaches a local temperature of 151 MeV, the fluid is converted to hadrons and resonances, which evolve in the hadron cascade code UrQMD Bass et al. (1998); Bleicher et al. (1999). These parameters were tuned for a Trento initial condition of energy density at followed by a period of free streaming fm/, whereas here we use Trento to initialize the entropy density at a finite time fm/ with no initial transverse flow. Nevertheless, the fit to data at most centralities is expected to be reasonable Nunes da Silva et al. (2019, 2020).
In both cases, v-USPhydro and MUSIC pass analytical solutions (the Gubser test) Marrochio et al. (2015) so that any differences in the results should lie not in numerics, but in the different physical ingredients such as the shear and bulk viscosities, the equation of state, the list of hadrons and resonances, and hadronic rescatterings. Note that the hydrodynamic equations of motion are different for v-USPhydro and MUSIC. v-USPhydro uses phenomenological Israel-Stewart and MUSIC used DNMR with the second order transport coefficients from Denicol et al. (2014).
IV Results
We ran our full hydrodynamic machinery for 5,000-10,000 events in the centrality range of for PbPb 5.02 TeV collisions at the LHC. Because these simulations take a significant amount of time to run, we only consider the geometric mean scenario (), which we found in the previous section is more likely to fit experimental data.
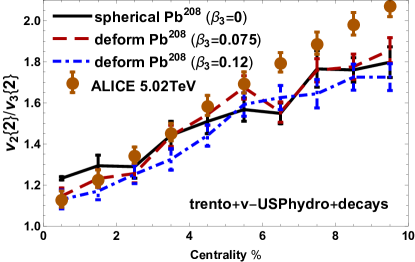
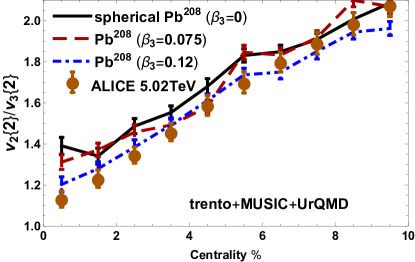
While CMS produced ultracentral data in LHC Run 1, ALICE has significantly more data for Run 2 Acharya et al. (2019a), so here we make the comparisons for the LHC Run 2 using Acharya et al. (2018b). In Fig. 6 we plot the ratio for Trento+v-USPhydro+decays (top panel) and Trento+MUSIC+UrQMD (bottom) along with the ALICE data. We see that, in both cases a finite deformation significantly improves the fit to experimental data. For Trento+v-USPhydro+decays is the best fit, whereas for Trento+MUSIC+UrQMD provides a better fit. We also note that the absolute magnitudes of are smaller in v-USPhydro than in MUSIC, which can be attributed to the smaller shear viscosity used in v-USPhydro. This is because, unlike the ratio of different cumulants of the same harmonic, the ratio has significant a viscosity dependence; is more strongly damped by viscosity than .
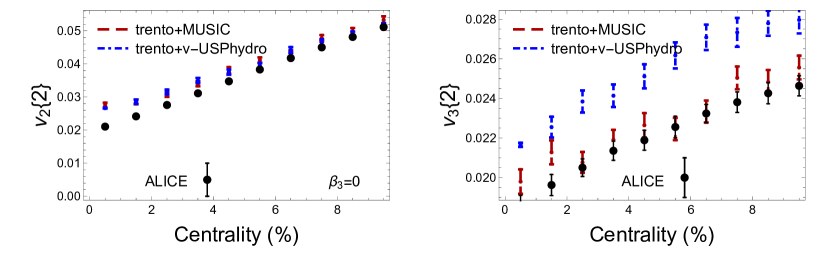
Comparisons of the ratio shown in Fig. 6 are one important element of the -to- puzzle, but it is also essential to compare the absolute magnitudes of both quantities as well. These comparisons are shown in Fig. 7 for the spherical case . Generally, both Trento+MUSIC and Trento+v-USPhydro fit well for centralities larger than centrality, but in the central collisions shown here, they both overpredict the experimental data. Meanwhile, Trento+MUSIC manages to fit quite well from centrality while Trento+v-USPhydro overpredicts the data. Thus, based on these two representative examples of hydrodynamic models, it appears that the crux of the -to- puzzle may lie in the overprediction of rather than an underprediction of . From this perspective, it seems unlikely that boosting the triangularity by adding an octupole deformation will improve the agreement with data.
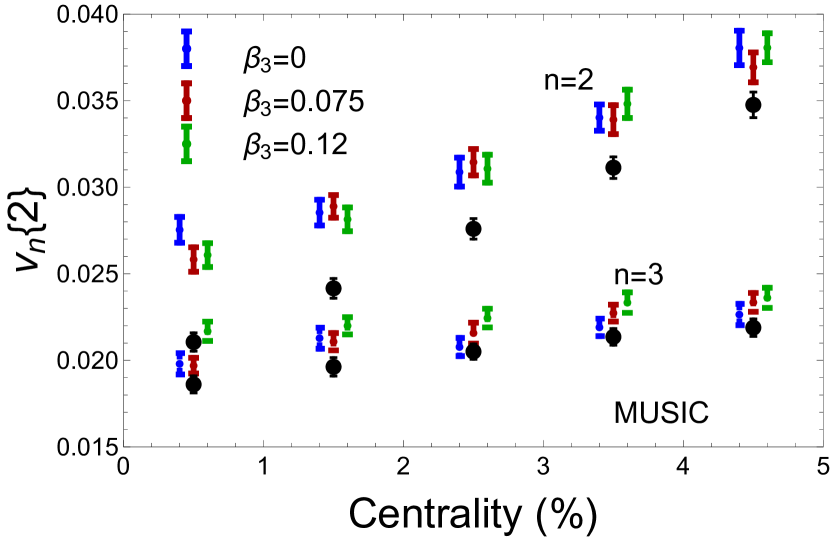
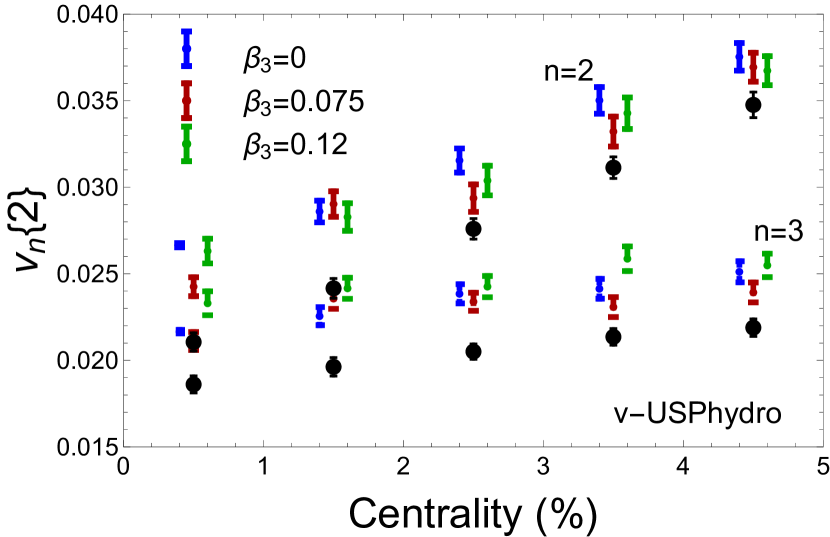
Indeed, this is what’s seen in Fig. 8 when we consider the impact of the deformation. While a larger generally leads to a larger in most cases, there appear to be some non-monotonic fluctuations, and the deformation can non-trivially affect as well.
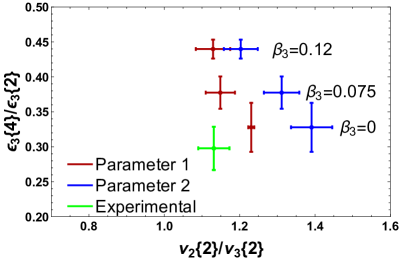
As was noted previously in Sec. II.2 and plotted in Fig. 3, increasing the octupole deformation does not improve the agreement of the calculated with data. Instead, the increasing disagreement with the data allows us to set an upper bound before this ratio becomes incompatible with the data. Thus any improvement caused by in the ratio in Fig. 6 must be weighed against the deterioration of the agreement of . We illustrate this in Fig. 9 by plotting the two observables simultaneously on independent axes. There are a number of caveats to this comparison which should be immediately pointed out. The “experimental” point here represents a combination of the ATLAS data for Aad et al. (2014) and the ALICE data for Acharya et al. (2018b, 2019a). On the theory side, the points represent combinations of the initial-state (without running hydrodynamics) with the full final-state evaluation of for different values of the deformation and for the two hydrodynamic models. Despite these caveats, the plot clearly illustrates the inability of an octupole deformation to resolve the -to- puzzle: the improved agreement in is more than offset by the worsened agreement in .
V Conclusions
By this point, a number of possibilities to resolve the -to- puzzle have been explored and exhausted. Variations in the initial conditions (assuming spherical Pb nuclei) Shen et al. (2015), the transport coefficients Rose et al. (2014), and the equation of state Alba et al. (2018) have all been considered, yet the problem still remains. No initial condition models assuming spherical Pb ions managed to capture the triangular flow fluctuations in ultra central PbPb collisions despite being able to reproduce elliptic flow fluctuations Giacalone et al. (2017).
In this paper, we considered the possibility of a nonzero octupole deformation in 208Pb as a means of improving the mismatch in the ratio in data. Those results from full hydrodynamics (Fig. 6) and the cumulant ratio from the initial state (Fig. 3) are the main results of this work. We find that, while a finite does improve the agreement in with data, it simultaneously worsens the agreement in . Moreover, we have also performed direct comparisons to the absolute magnitudes of and , rather than just their ratio (Fig. 8). We find that, in both hydrodynamic models, the biggest discrepancy underlying the -to- puzzle lies with an overprediction of rather than the underprediction of .
Clearly, an octupole deformation of 208Pb is not a viable resolution of the -to- puzzle in ultracentral collisions within these models. While different in the details of their implementation and emphasizing different physics, both v-USPhydro and MUSIC are examples of reasonable hydrodynamic models that can describe bulk flow observables in heavy ion collisions. The two hydrodynamic models differ in various details, but in particular the larger viscosity in MUSIC (see Fig. 5) leads to noticeable differences. That larger viscosity creates additional viscous suppression of higher harmonics like , bringing MUSIC into better quantitative agreement with than v-USPhydro, which overpredicts the data.
This difference arising from the viscosity illustrates an important correlation between the parameters like entering the hydrodynamics models, and parameters like entering the initial state. By adjusting , one can dial the ratio but not control the absolute magnitudes of either quantity. Those magnitudes are affected directly by the choice of viscosity, in correlation with the prior choice of . Thus it seems reasonable that a simultaneous fit of the unknown properties of the initial state (such as the deformation parameters , ) and the hydrodynamic transport parameters could help to resolve the -to- puzzle.
For the hydrodynamic models, clearly the choice of viscosity has a significant effect on the -to- puzzle, possibly indicating that a more sophisticated treatment of out-of-equilibrium effects could be important. Adding a temperature-dependent to the v-USPhydro model could also be an important improvement.
Following our analysis, we stress that studying the -to- puzzle only through the ratio can be highly misleading. Independent observables, like the multiparticle correlations , are vital to constrain the origin of these discrepancies. Additionally, it is critical to separately examine the absolute magnitudes of and as the baseline for the ratio . For now, the -to- puzzle in ultracentral Pb Pb collisions remains a challenge for hydrodynamic models.
Acknowledgements
J.N.H., M.S., and P.C. acknowledge support from the US-DOE Nuclear Science Grant No. DE-SC0019175, the Alfred P. Sloan Foundation, and the Illinois Campus Cluster, a computing resource that is operated by the Illinois Campus Cluster Program (ICCP) in conjunction with the National Center for Supercomputing Applications (NCSA) and which is supported by funds from the University of Illinois at Urbana-Champaign. M.L. acknowledges support by FAPESP projects 2016/24029-6, 2017/05685-2 and 2018/24720-6 and by project INCT-FNA Proc. No. 464898/2014-5.
Appendix A Other Observables
A.1 Symmetric Cumulant
As part of the -to- puzzle, it is natural to ask whether the correlation between these quantities, the symmetric cumulant , is sensitive to a potential deformation. In the initial state, the analogous quantity is the correlation among the eccentricities and , which was shown in Refs. Adam et al. (2016b); Giacalone et al. (2016); Gardim et al. (2017) to be closely related to the final-state .
We plot the symmetric cumulant in Fig. 10 for a range of octupole deformations . Even with 3 million events we find that all variations are indistinguishable within the statistical error bars. Thus, we find that is not an observable that is sensitive to deformations.
A.2 Linear Response Pearson Coefficients
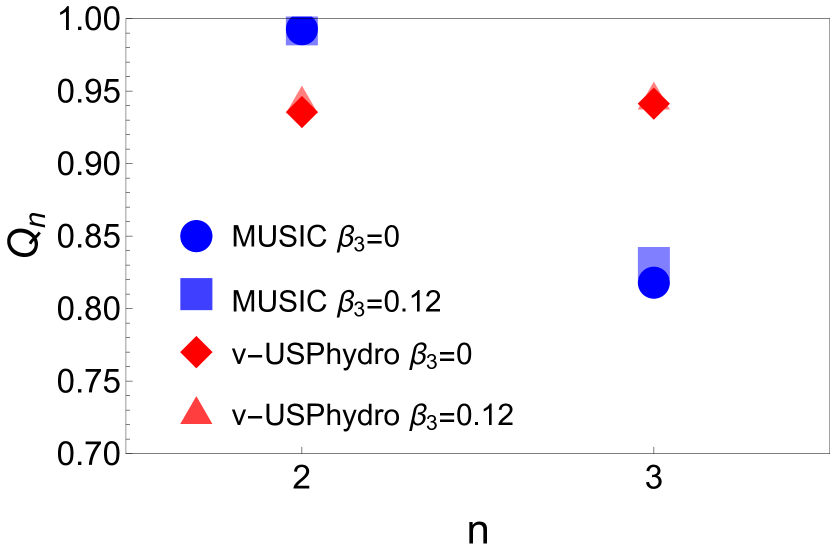
It is clear from the discussion of Fig. 8 that v-USPhydro and MUSIC produce different final flow harmonics. This is due to differences in their “best fit” medium parameters — primarily viscosity, although they also differ slightly in other respects, such as the equation of state as well. In ultracentral collisions, both models are well described by linear response theory, with the model differences yielding different constants of proportionality. Aside from this, the two models also may receive small contributions from nonlinear response, and these contributions can be different. The deviations from linear response are encapsulated in the linear (Pearson) correlation coefficients between initial eccentricity and the final flow harmonic .
We find in Fig. 11 that the MUSIC simulation has a very strong linear relation (4), event-by-event for , but a weaker linear correlation for . Conversely, the v-USPhydro show a similar linear correlation for both harmonics. Without a dedicated study, it is difficult to further disentangle how the various features of the models result in the overall mapping from initial state eccentricities to final state flow harmonics.
References
References
- Noronha-Hostler et al. (2016a) J. Noronha-Hostler, M. Luzum, and J.-Y. Ollitrault, Phys. Rev. C93, 034912 (2016a), arXiv:1511.06289 [nucl-th] .
- Niemi et al. (2016a) H. Niemi, K. J. Eskola, R. Paatelainen, and K. Tuominen, Phys. Rev. C93, 014912 (2016a), arXiv:1511.04296 [hep-ph] .
- Adam et al. (2016a) J. Adam et al. (ALICE), Phys. Rev. Lett. 116, 222302 (2016a), arXiv:1512.06104 [nucl-ex] .
- Song et al. (2011) H. Song, S. A. Bass, U. Heinz, T. Hirano, and C. Shen, Phys. Rev. Lett. 106, 192301 (2011), [Erratum: Phys. Rev. Lett.109,139904(2012)], arXiv:1011.2783 [nucl-th] .
- Bozek and Wyskiel-Piekarska (2012) P. Bozek and I. Wyskiel-Piekarska, Phys. Rev. C85, 064915 (2012), arXiv:1203.6513 [nucl-th] .
- Gardim et al. (2012) F. G. Gardim, F. Grassi, M. Luzum, and J.-Y. Ollitrault, Phys. Rev. Lett. 109, 202302 (2012), arXiv:1203.2882 [nucl-th] .
- Bozek and Broniowski (2013) P. Bozek and W. Broniowski, Phys. Rev. C88, 014903 (2013), arXiv:1304.3044 [nucl-th] .
- Niemi et al. (2016b) H. Niemi, K. J. Eskola, and R. Paatelainen, Phys. Rev. C93, 024907 (2016b), arXiv:1505.02677 [hep-ph] .
- Ryu et al. (2015) S. Ryu, J. F. Paquet, C. Shen, G. S. Denicol, B. Schenke, S. Jeon, and C. Gale, Phys. Rev. Lett. 115, 132301 (2015), arXiv:1502.01675 [nucl-th] .
- McDonald et al. (2017) S. McDonald, C. Shen, F. Fillion-Gourdeau, S. Jeon, and C. Gale, Phys. Rev. C95, 064913 (2017), arXiv:1609.02958 [hep-ph] .
- Bernhard et al. (2016) J. E. Bernhard, J. S. Moreland, S. A. Bass, J. Liu, and U. Heinz, Phys. Rev. C94, 024907 (2016), arXiv:1605.03954 [nucl-th] .
- Gardim et al. (2017) F. G. Gardim, F. Grassi, M. Luzum, and J. Noronha-Hostler, Phys. Rev. C95, 034901 (2017), arXiv:1608.02982 [nucl-th] .
- Alba et al. (2018) P. Alba, V. Mantovani Sarti, J. Noronha, J. Noronha-Hostler, P. Parotto, I. Portillo Vazquez, and C. Ratti, Phys. Rev. C98, 034909 (2018), arXiv:1711.05207 [nucl-th] .
- Giacalone et al. (2018) G. Giacalone, J. Noronha-Hostler, M. Luzum, and J.-Y. Ollitrault, Phys. Rev. C97, 034904 (2018), arXiv:1711.08499 [nucl-th] .
- Eskola et al. (2018) K. J. Eskola, H. Niemi, R. Paatelainen, and K. Tuominen, Phys. Rev. C97, 034911 (2018), arXiv:1711.09803 [hep-ph] .
- Weller and Romatschke (2017) R. D. Weller and P. Romatschke, Phys. Lett. B774, 351 (2017), arXiv:1701.07145 [nucl-th] .
- Schenke et al. (2019) B. Schenke, C. Shen, and P. Tribedy, Phys. Rev. C99, 044908 (2019), arXiv:1901.04378 [nucl-th] .
- Gardim et al. (2018) F. G. Gardim, F. Grassi, P. Ishida, M. Luzum, P. S. Magalhães, and J. Noronha-Hostler, Phys. Rev. C97, 064919 (2018), arXiv:1712.03912 [nucl-th] .
- Noronha-Hostler et al. (2016b) J. Noronha-Hostler, J. Noronha, and M. Gyulassy, Phys. Rev. C93, 024909 (2016b), arXiv:1508.02455 [nucl-th] .
- Nagle and Zajc (2019) J. L. Nagle and W. A. Zajc, Phys. Rev. C99, 054908 (2019), arXiv:1808.01276 [nucl-th] .
- Hippert et al. (2020) M. Hippert, J. G. P. Barbon, D. Dobrigkeit Chinellato, M. Luzum, J. Noronha, T. Nunes da Silva, W. M. Serenone, and J. Takahashi, (2020), arXiv:2006.13358 [nucl-th] .
- Nunes da Silva et al. (2020) T. Nunes da Silva, D. Chinellato, M. Hippert, W. Serenone, J. Takahashi, G. S. Denicol, M. Luzum, and J. Noronha, (2020), arXiv:2006.02324 [nucl-th] .
- Acharya et al. (2019a) S. Acharya et al. (ALICE), Phys. Rev. Lett. 123, 142301 (2019a), arXiv:1903.01790 [nucl-ex] .
- Acharya et al. (2018a) S. Acharya et al. (ALICE), Phys. Lett. B784, 82 (2018a), arXiv:1805.01832 [nucl-ex] .
- Acharya et al. (2019b) S. Acharya et al. (ALICE), Phys. Lett. B788, 166 (2019b), arXiv:1805.04399 [nucl-ex] .
- Collaboration (2018) C. Collaboration (CMS), (2018).
- collaboration (2018) T. A. collaboration (ATLAS), CERN (CERN, Geneva, 2018).
- Adamczyk et al. (2015) L. Adamczyk et al. (STAR), Phys. Rev. Lett. 115, 222301 (2015), arXiv:1505.07812 [nucl-ex] .
- Goldschmidt et al. (2015) A. Goldschmidt, Z. Qiu, C. Shen, and U. Heinz, Phys. Rev. C92, 044903 (2015), arXiv:1507.03910 [nucl-th] .
- Dasgupta et al. (2017) P. Dasgupta, R. Chatterjee, and D. K. Srivastava, Phys. Rev. C95, 064907 (2017), arXiv:1609.01949 [nucl-th] .
- Giacalone (2019a) G. Giacalone, Phys. Rev. C99, 024910 (2019a), arXiv:1811.03959 [nucl-th] .
- Lim et al. (2019) S. H. Lim, Q. Hu, R. Belmont, K. K. Hill, J. L. Nagle, and D. V. Perepelitsa, Phys. Rev. C100, 024908 (2019), arXiv:1902.11290 [nucl-th] .
- Citron et al. (2019) Z. Citron et al., in Report on the Physics at the HL-LHC,and Perspectives for the HE-LHC, edited by A. Dainese, M. Mangano, A. B. Meyer, A. Nisati, G. Salam, and M. A. Vesterinen (2019) pp. 1159–1410, arXiv:1812.06772 [hep-ph] .
- Rybczyński and Broniowski (2019) M. Rybczyński and W. Broniowski, Phys. Rev. C100, 064912 (2019), arXiv:1910.09489 [hep-ph] .
- Noronha-Hostler et al. (2019) J. Noronha-Hostler, N. Paladino, S. Rao, M. D. Sievert, and D. E. Wertepny, (2019), arXiv:1905.13323 [hep-ph] .
- Bozek and Broniowski (2018) P. Bozek and W. Broniowski, Phys. Rev. Lett. 121, 202301 (2018), arXiv:1808.09840 [nucl-th] .
- Broniowski and Bożek (2019) W. Broniowski and P. Bożek, (2019), arXiv:1906.09045 [nucl-th] .
- Giacalone (2019b) G. Giacalone, (2019b), arXiv:1910.04673 [nucl-th] .
- Giacalone (2020) G. Giacalone, (2020), arXiv:2004.14463 [nucl-th] .
- Luzum and Ollitrault (2013) M. Luzum and J.-Y. Ollitrault, Proceedings, 23rd International Conference on Ultrarelativistic Nucleus-Nucleus Collisions : Quark Matter 2012 (QM 2012): Washington, DC, USA, August 13-18, 2012, Nucl. Phys. A904-905, 377c (2013), arXiv:1210.6010 [nucl-th] .
- Collaboration (2012) C. Collaboration (CMS), (2012).
- Shen et al. (2015) C. Shen, Z. Qiu, and U. Heinz, Phys. Rev. C92, 014901 (2015), arXiv:1502.04636 [nucl-th] .
- Rose et al. (2014) J.-B. Rose, J.-F. Paquet, G. S. Denicol, M. Luzum, B. Schenke, S. Jeon, and C. Gale, Proceedings, 24th International Conference on Ultra-Relativistic Nucleus-Nucleus Collisions (Quark Matter 2014): Darmstadt, Germany, May 19-24, 2014, Nucl. Phys. A931, 926 (2014), arXiv:1408.0024 [nucl-th] .
- Gelis et al. (2019) F. Gelis, G. Giacalone, P. Guerrero-Rodríguez, C. Marquet, and J.-Y. Ollitrault, (2019), arXiv:1907.10948 [nucl-th] .
- Giacalone et al. (2017) G. Giacalone, J. Noronha-Hostler, and J.-Y. Ollitrault, Phys. Rev. C95, 054910 (2017), arXiv:1702.01730 [nucl-th] .
- Chatrchyan et al. (2014) S. Chatrchyan et al. (CMS), Phys. Rev. C89, 044906 (2014), arXiv:1310.8651 [nucl-ex] .
- Aamodt et al. (2011) K. Aamodt et al. (ALICE), Phys. Rev. Lett. 107, 032301 (2011), arXiv:1105.3865 [nucl-ex] .
- Aad et al. (2014) G. Aad et al. (ATLAS), Eur. Phys. J. C74, 3157 (2014), arXiv:1408.4342 [hep-ex] .
- Noronha-Hostler et al. (2016c) J. Noronha-Hostler, L. Yan, F. G. Gardim, and J.-Y. Ollitrault, Phys. Rev. C93, 014909 (2016c), arXiv:1511.03896 [nucl-th] .
- Sievert and Noronha-Hostler (2019) M. D. Sievert and J. Noronha-Hostler, Phys. Rev. C100, 024904 (2019), arXiv:1901.01319 [nucl-th] .
- Rao et al. (2019) S. Rao, M. Sievert, and J. Noronha-Hostler, (2019), arXiv:1910.03677 [nucl-th] .
- Möller et al. (2016) P. Möller, A. J. Sierk, T. Ichikawa, and H. Sagawa, Atom. Data Nucl. Data Tabl. 109-110, 1 (2016), arXiv:1508.06294 [nucl-th] .
- Robledo and Bertsch (2011) L. M. Robledo and G. F. Bertsch, Phys. Rev. C84, 054302 (2011), arXiv:1107.3581 [nucl-th] .
- Tarbert et al. (2014) C. M. Tarbert et al., Phys. Rev. Lett. 112, 242502 (2014), arXiv:1311.0168 [nucl-ex] .
- Abrahamyan et al. (2012) S. Abrahamyan et al., Phys. Rev. Lett. 108, 112502 (2012), arXiv:1201.2568 [nucl-ex] .
- Horowitz and Piekarewicz (2001) C. J. Horowitz and J. Piekarewicz, Phys. Rev. Lett. 86, 5647 (2001), arXiv:astro-ph/0010227 [astro-ph] .
- Fattoyev and Piekarewicz (2012) F. J. Fattoyev and J. Piekarewicz, Phys. Rev. C86, 015802 (2012), arXiv:1203.4006 [nucl-th] .
- Fattoyev et al. (2018) F. J. Fattoyev, J. Piekarewicz, and C. J. Horowitz, Phys. Rev. Lett. 120, 172702 (2018), arXiv:1711.06615 [nucl-th] .
- Aaboud et al. (2020) M. Aaboud et al. (ATLAS), JHEP 01, 051 (2020), arXiv:1904.04808 [nucl-ex] .
- Moreland et al. (2015) J. S. Moreland, J. E. Bernhard, and S. A. Bass, Phys. Rev. C92, 011901 (2015), arXiv:1412.4708 [nucl-th] .
- Lappi (2006) T. Lappi, Phys. Lett. B 643, 11 (2006), arXiv:hep-ph/0606207 .
- Romatschke and Romatschke (2019) P. Romatschke and U. Romatschke, Relativistic Fluid Dynamics In and Out of Equilibrium, Cambridge Monographs on Mathematical Physics (Cambridge University Press, 2019) arXiv:1712.05815 [nucl-th] .
- Chen et al. (2015) G. Chen, R. J. Fries, J. I. Kapusta, and Y. Li, Phys. Rev. C 92, 064912 (2015), arXiv:1507.03524 [nucl-th] .
- Acharya et al. (2018b) S. Acharya et al. (ALICE), JHEP 07, 103 (2018b), arXiv:1804.02944 [nucl-ex] .
- Noronha-Hostler et al. (2013) J. Noronha-Hostler, G. S. Denicol, J. Noronha, R. P. G. Andrade, and F. Grassi, Phys. Rev. C 88, 044916 (2013), arXiv:1305.1981 [nucl-th] .
- Noronha-Hostler et al. (2014) J. Noronha-Hostler, J. Noronha, and F. Grassi, Phys. Rev. C 90, 034907 (2014), arXiv:1406.3333 [nucl-th] .
- Sollfrank et al. (1991) J. Sollfrank, P. Koch, and U. W. Heinz, Z. Phys. C 52, 593 (1991).
- Wiedemann and Heinz (1997) U. A. Wiedemann and U. W. Heinz, Phys. Rev. C 56, 3265 (1997), arXiv:nucl-th/9611031 .
- Alba et al. (2017) P. Alba et al., Phys. Rev. D96, 034517 (2017), arXiv:1702.01113 [hep-lat] .
- Ono et al. (2019) A. Ono et al., Phys. Rev. C 100, 044617 (2019), arXiv:1904.02888 [nucl-th] .
- Schenke et al. (2010) B. Schenke, S. Jeon, and C. Gale, Phys. Rev. C 82, 014903 (2010), arXiv:1004.1408 [hep-ph] .
- Schenke et al. (2011) B. Schenke, S. Jeon, and C. Gale, Phys. Rev. Lett. 106, 042301 (2011), arXiv:1009.3244 [hep-ph] .
- Huovinen and Petreczky (2010) P. Huovinen and P. Petreczky, Nucl. Phys. A 837, 26 (2010), arXiv:0912.2541 [hep-ph] .
- Bass et al. (1998) S. Bass et al., Prog. Part. Nucl. Phys. 41, 255 (1998), arXiv:nucl-th/9803035 .
- Bleicher et al. (1999) M. Bleicher et al., J. Phys. G 25, 1859 (1999), arXiv:hep-ph/9909407 .
- Nunes da Silva et al. (2019) T. Nunes da Silva, D. Dobrigkeit Chinellato, R. Derradi De Souza, M. Hippert, M. Luzum, J. Noronha, and J. Takahashi, MDPI Proc. 10, 5 (2019), arXiv:1811.05048 [nucl-th] .
- Marrochio et al. (2015) H. Marrochio, J. Noronha, G. S. Denicol, M. Luzum, S. Jeon, and C. Gale, Phys. Rev. C 91, 014903 (2015), arXiv:1307.6130 [nucl-th] .
- Denicol et al. (2014) G. Denicol, S. Jeon, and C. Gale, Phys. Rev. C 90, 024912 (2014), arXiv:1403.0962 [nucl-th] .
- Adam et al. (2016b) J. Adam et al. (ALICE), Phys. Rev. Lett. 117, 182301 (2016b), arXiv:1604.07663 [nucl-ex] .
- Giacalone et al. (2016) G. Giacalone, L. Yan, J. Noronha-Hostler, and J.-Y. Ollitrault, Phys. Rev. C 94, 014906 (2016), arXiv:1605.08303 [nucl-th] .