Scattering of Rod-like Swimmers in Low Reynolds Number Environments
In their search for metabolic resources microbes swim through viscous environments that present physical anisotropies, including steric obstacles across a wide range of sizes. Hydrodynamic forces are known to significantly alter swimmer trajectories near flat and low-curvature surfaces. In this work, we imaged hundreds-of-thousands of high-curvature scattering interactions between swimming bacteria and micro-fabricated pillars with radii from to cell lengths. As a function of impact parameter, cell-pillar interactions produced distinct chiral distributions for scattering angle – including unexpected ‘counter-rotator’ trajectories – well-described by a sterics-only model. Our data and model suggest that alteration of swimmer trajectories is subject to distinct mechanisms when interacting with objects of different size; primarily steric for objects below 10 cell lengths and requiring incorporation of hydrodynamics at larger scales. These alterations in trajectory impact swim dynamics and may affect microbial populations in ways that depend on the shape and placement of obstacles within an environment.
See pages - of bacterial_scattering_final_arxiv.pdf

Supplementary Information:
Scattering of Rod-like Swimmers in Low Reynolds Number Environments
1 Model of Steric Scattering
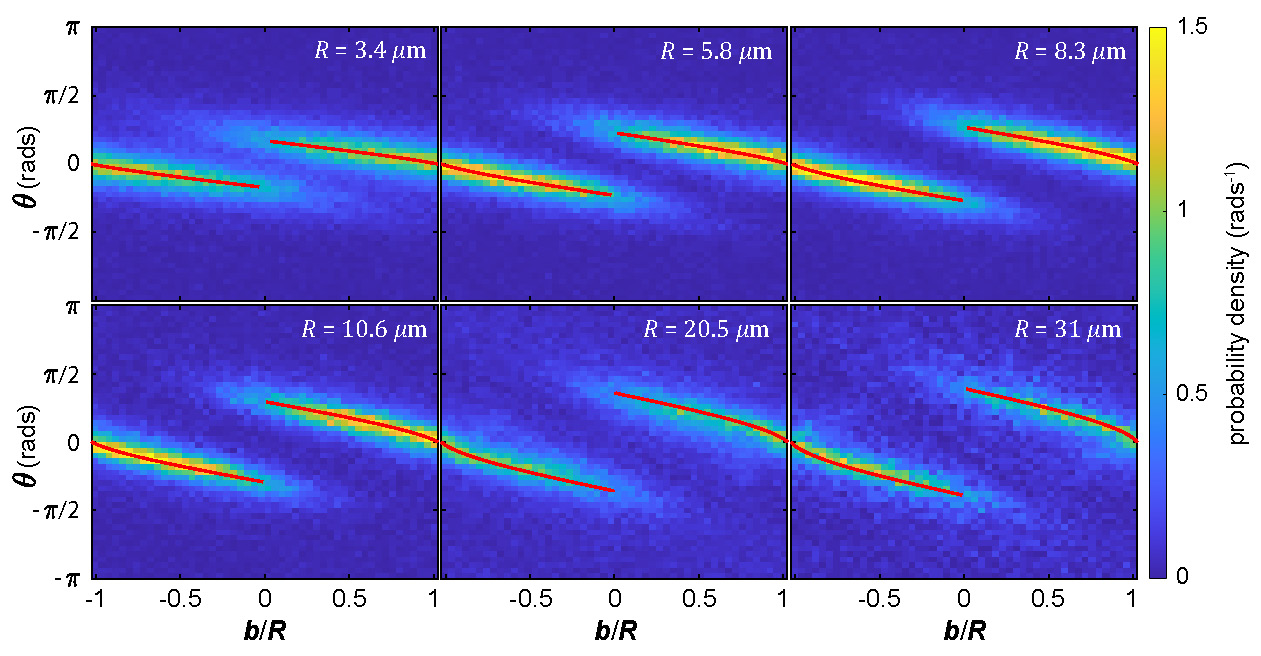
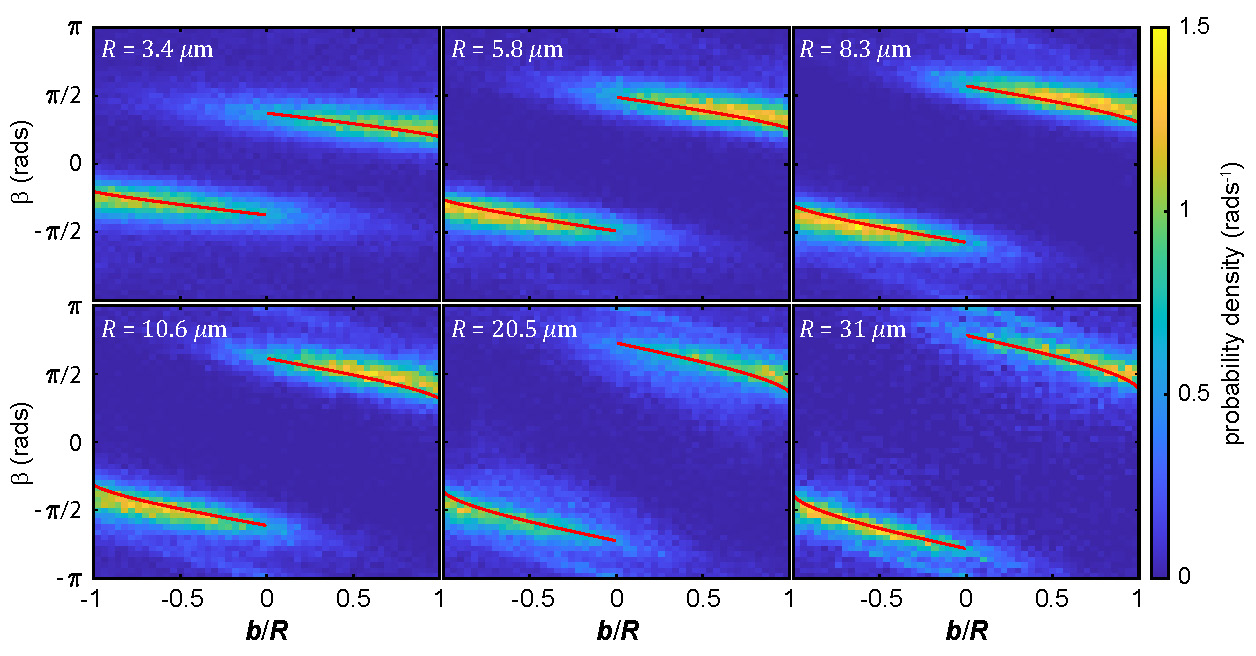
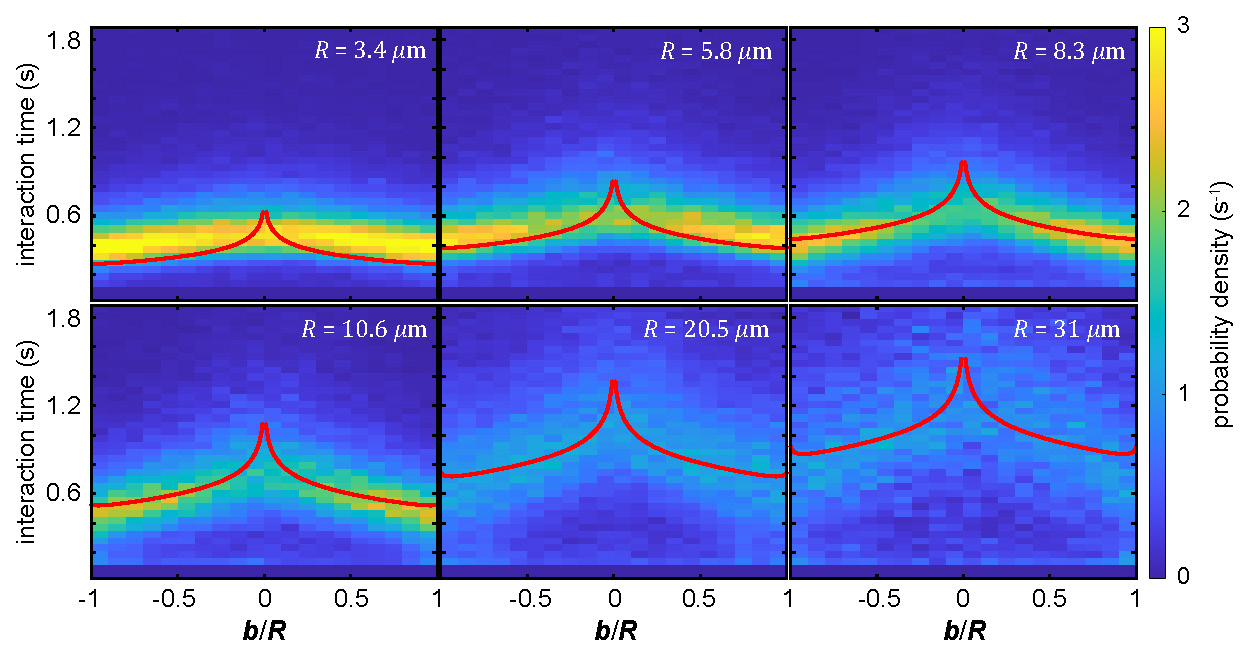
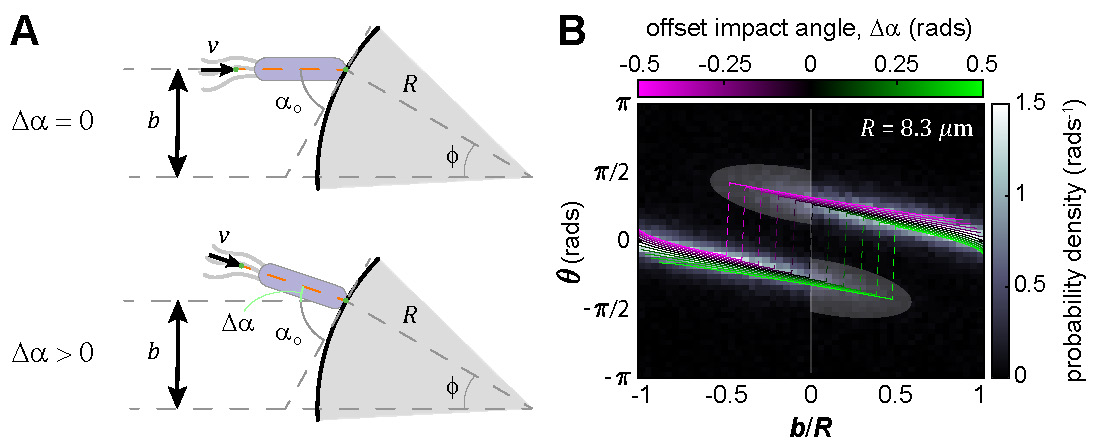
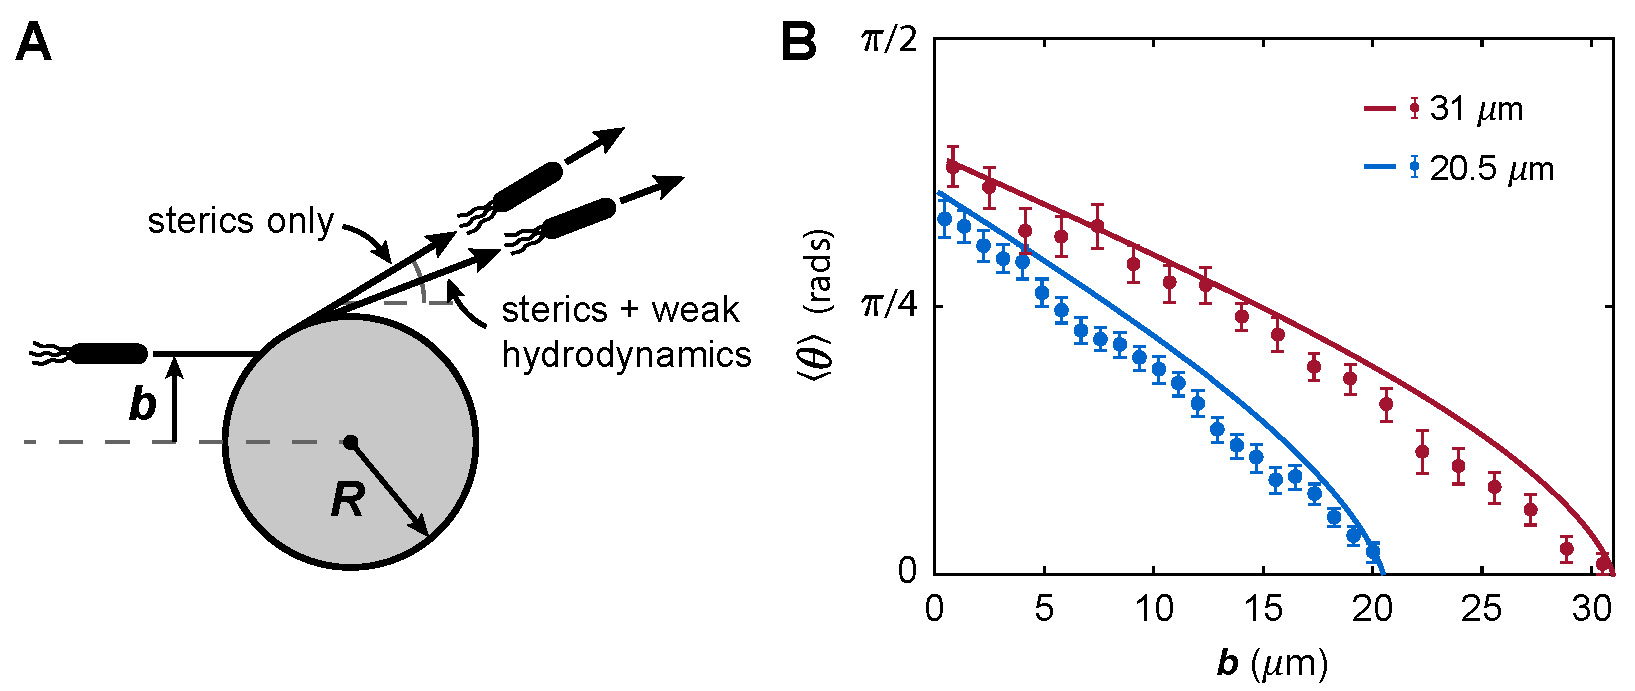
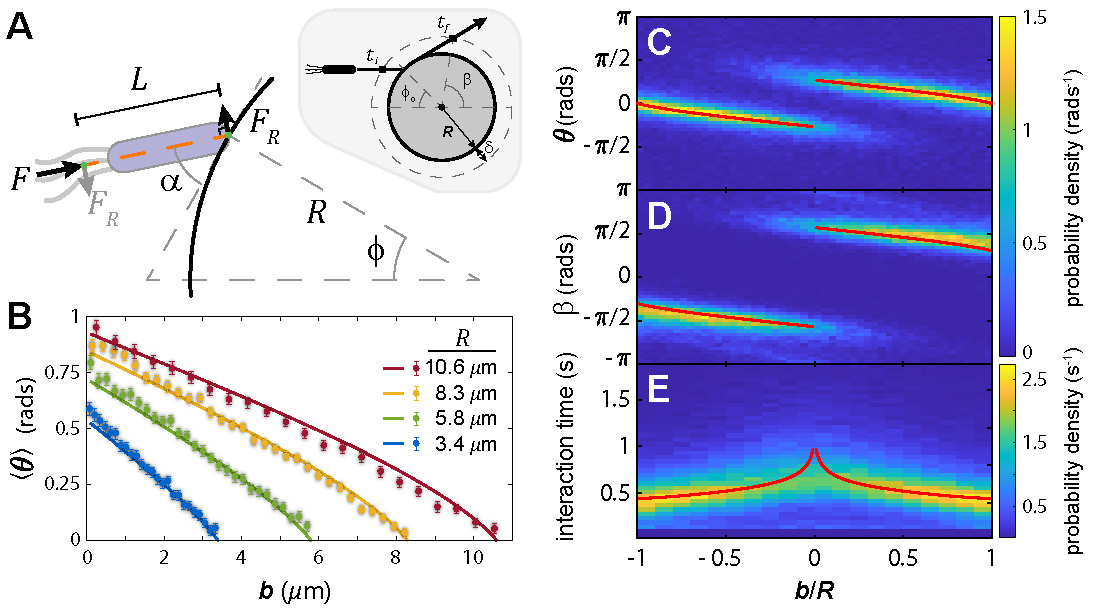
Herein we develop a steric model of a rod-like swimmer (e.g. bacterium) that aligns with a surface and subsequently scatters from it. Based on observed data, these geometric relationships are sufficient to describe the interaction and the resulting relationship between cellular motion with respect to an oriented surface, specifically predicting the relationship between the scattering parameter and the mean outgoing angle , as well as the duration of interaction (at constant swimming speed) and the angle of exit, . Please see the main text for model assumptions.
1.1 Geometric Constraints
As a matter of temporary convenience, we assume that the red point in Fig. 1 is the origin of a Cartesian coordinate system. The motion of each of the points and are parametrically described by and , respectively, thus all possible dynamics are captured by these four dependent variables. First, note that we are treating the cell as a line-object propelled on-axis from the rear. We assume that the length of the cell does not change, mandating that
| (1) |
and we assume (for now) that the point of contact is always in contact, sliding along the surface, until such time as the bacterium leaves the surface, hence
| (2) |
The length is the distance between the leading tip of the cell and the effective point of propulsion, a little longer than the cell body, we use throughout this work.
1.2 Drag-limited Dynamics
We first build up a simpler model of a swimming cell scattering from a flat surface oriented by an angle with respect to the horizontal (see Fig. 1), and then extend this model to account for movement along a curved (in this case circular) surface of radius .

Knowing that swimming bacteria exist at low Reynolds number ( ), we assume that viscous drag limits movement of the points and , and hence that the velocities of points and are proportional to the net force on those points with a fixed mobility for each point. The propulsion force , independent of any state of motion can be decomposed into a component that is parallel to the scattering surface and a component normal to the surface , such that given the current angle ,
| (3) |
and
| (4) |
We approach the equations of motion as a problem of finding as functions of and its derivatives. The force parallel to the surface translates the point according to
| (5) |
| (6) |
The distance is also defined geometrically by
| (7) |
and hence its time derivative is
| (8) |
such that
| (9) |
Looking back at the constraint for and taking the time derivative
| (10) |
Then using our results above
| (11) |
and with
| (12) |
this simplifies to
| (13) |
and finally
| (14) |
Then the projection of the translational force onto the coordinate perpendicular to the axis of the cell is what causes the cell body to rotate with respect to the surface, and thus
| (15) |
Finally, rotation of the cell is
| (16) |
We note that the natural length scale is (as it has nothing to do with ) and the natural time scale is , such that the equations of motion can be non-dimensionalized and written
| (17) |
and then
| (18) |
| (19) |
| (20) |
| (21) |
Finally, the differential equation for with initial condition is solved by
| (22) |
where the effect of the initial condition is to shift the time axis by . For long times or small this can be approximated simply as
| (23) |
This was the case for a rod-like object orienting to a flat surface tilted by an angle .
1.3 Contact Friction
To determine the potential role of friction, we note that if the parallel force exceeds the friction force then the point of contact will move, this can be stated as
| (24) |
where is the frictional coefficient, which gives a critical impact angle of
| (25) |
This is a condition for the balance between frictional and sliding forces – our data frequently show cells impacting the steric object essentially head-on, with subsequent sliding along the surface, indicating that the friction , supporting the model assumption that the motion is drag-limited.

1.4 Interactions with a Curved Surface
Assuming that viscous drag is the primary constraint on motion, we assume that all velocities are proportional to net force with a fixed mobility . The propulsion force , independent of any state of motion can be decomposed into a component that is parallel to the scattering surface and a component normal to the surface , such that given the current angle ,
| (26) |
and
| (27) |
For simplicity assume that the circle’s center is the coordinate origin, and hence
| (28) |
| (29) |
and thus
| (30) |
| (31) |
Using the parallel force we can also write
| (32) |
| (33) |
Both of these equations dictate that
| (34) |
which using the same definitions of time and length scale give
| (35) |
with , and the initial condition is related to the impact parameter by
| (36) |
and likewise the initial value of is
| (37) |
because we assume the cell impacts in a flat orientation (i.e. ). Then the rate change of due to torque is
| (38) |
where
| (39) |
and the rate change of due to the surface curvature is
| (40) |
then
| (41) |
and upon non-dimensionalization
| (42) |
This model predicts that if the cell is perpendicular to the surface then , same as the flat surface. However, it also predicts that there is a non-zero critical angle
| (43) |
that results in a stable orientation with respect to the surface, however, the fact that that angle is negative means that this only occurs for cells on the ‘inside’ (i.e. negative curvature), which may be part of the consistent orientation of motile Bacillus subtilis cells observed on the inside curvature of a circle111E. Lushi, H. Wioland, R.E. Goldstein; Fluid flows created by swimming bacteria drive self-organization in confined suspensions (2014). PNAS 111, 9733 - 9738..

For the moment let us make analytic headway by assuming small , and thus the differential equation becomes
| (44) |
noting that the flat surface case (earlier) corresponds to . The assumption of the model is that the bacterium leaves the surface when , thus the time when that happens is
| (45) |
and the angle at which it leaves is determined by
| (46) |
where is a constant such that . This integral has a complicated solution, however approximating cosine by its first two Taylor series terms we can find
| (47) |
Then finally, the measured exit angle is given by
| (48) |
with . Similarly, the limit when gives the initial condition , consistent the flat-surface model. The models overlaid with data in the main text and SI were calculated using this differential equation, but were solved exactly (numerically) (as opposed to applying the small approximation).

1.5 Interaction Time
An interaction with a pillar of radius was computationally triggered when a bacterium came within of the pillar center, where is the radial zone around the pillar inside of which we measured interactions, usually from the pillar surface. Thus for a given value of , the initial straight line path from entry into the interaction zone until contact with the pillar has a length
| (49) |
and applying the average swim speed , a transit time of
| (50) |
Likewise, after the cell has slide around the pillar and rotated to be tangent with the pillar surface, the length from that point to exit of the interaction zone is
| (51) |
and a transit time of
| (52) |
The time spent sliding and rotating around the pillar can be found exactly from the differential equation
| (53) |
which can be integrated directly for the time at which certain values of are achieved
| (54) |
where is an unimportant constant. The time between contact and tangency is given by
| (55) |
where we have now accounted for the natural timescale, and this simplifies to
| (56) |
Then the total interaction time is
| (57) |
See SI Figure 10. In our data processing, we subtract a constant length (of ) from to account for the offset between the position of the tip which makes contact with the pillar and the position of the cell centroid from image processing, that offset is applied consistently to all data processing and figures.
2 Predictions for Control Data
As a test for our entire image analysis and data pipeline, we imaged cells swimming through open regions of our device, that is, devoid of any steric obstruction except the upper and lower surfaces. We created fictitious interaction by zones by defining a typical (fictitious) pillar dimension () and corresponding interaction zone of width . As bacteria swam through the interaction zone, we processed their trajectories in precisely the same way as we processed actual steric interactions. We constructed the same plots of: dimensionless impact parameter () vs. scattering angle (), vs. exit angle (), and vs. interaction time, and we calculated the expected mean values of those relationships. The calculations below assume that the persistence length of the isotropic persistent random walk of the cellular trajectories is much longer than .
In particular, if diffusion of a trajectory across the interaction zone was isotropic, then the entry angle (of 0) should, on average, be zero upon exit, regardless of and hence
| (58) |
Similarly, if diffusion is isotropic the point of entry into the interaction zone, specified by , has the same mean -axis () value at the point of exit, giving the exit angle of
| (59) |
Finally, the interaction time, that is, the time from entry to exit, will be dominated by approximately straight trajectories that exit, on average, at the same value at both points. The time to execute that trajectory is
| (60) |
The data and overlaid control models are shown in Fig. 18.
3 Measured Chiral Symmetry
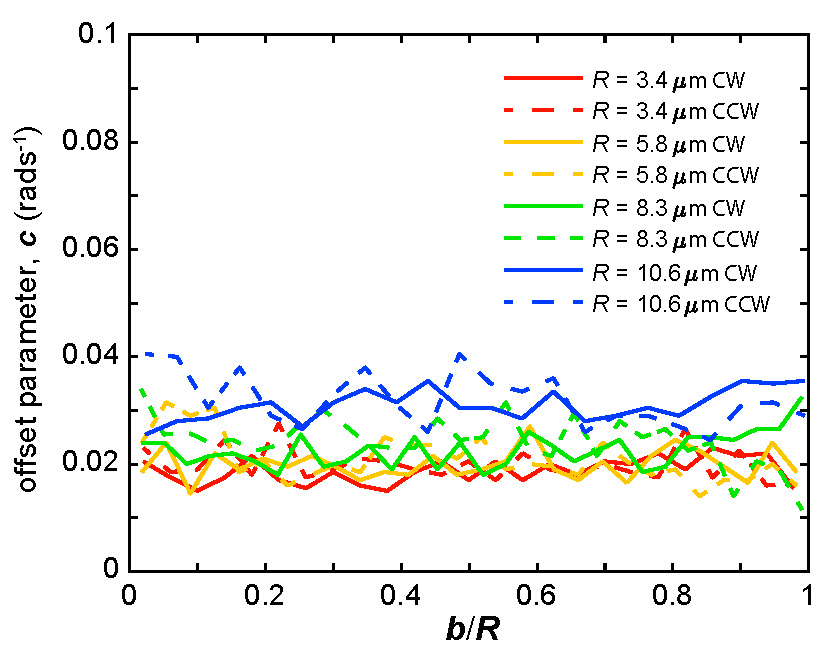
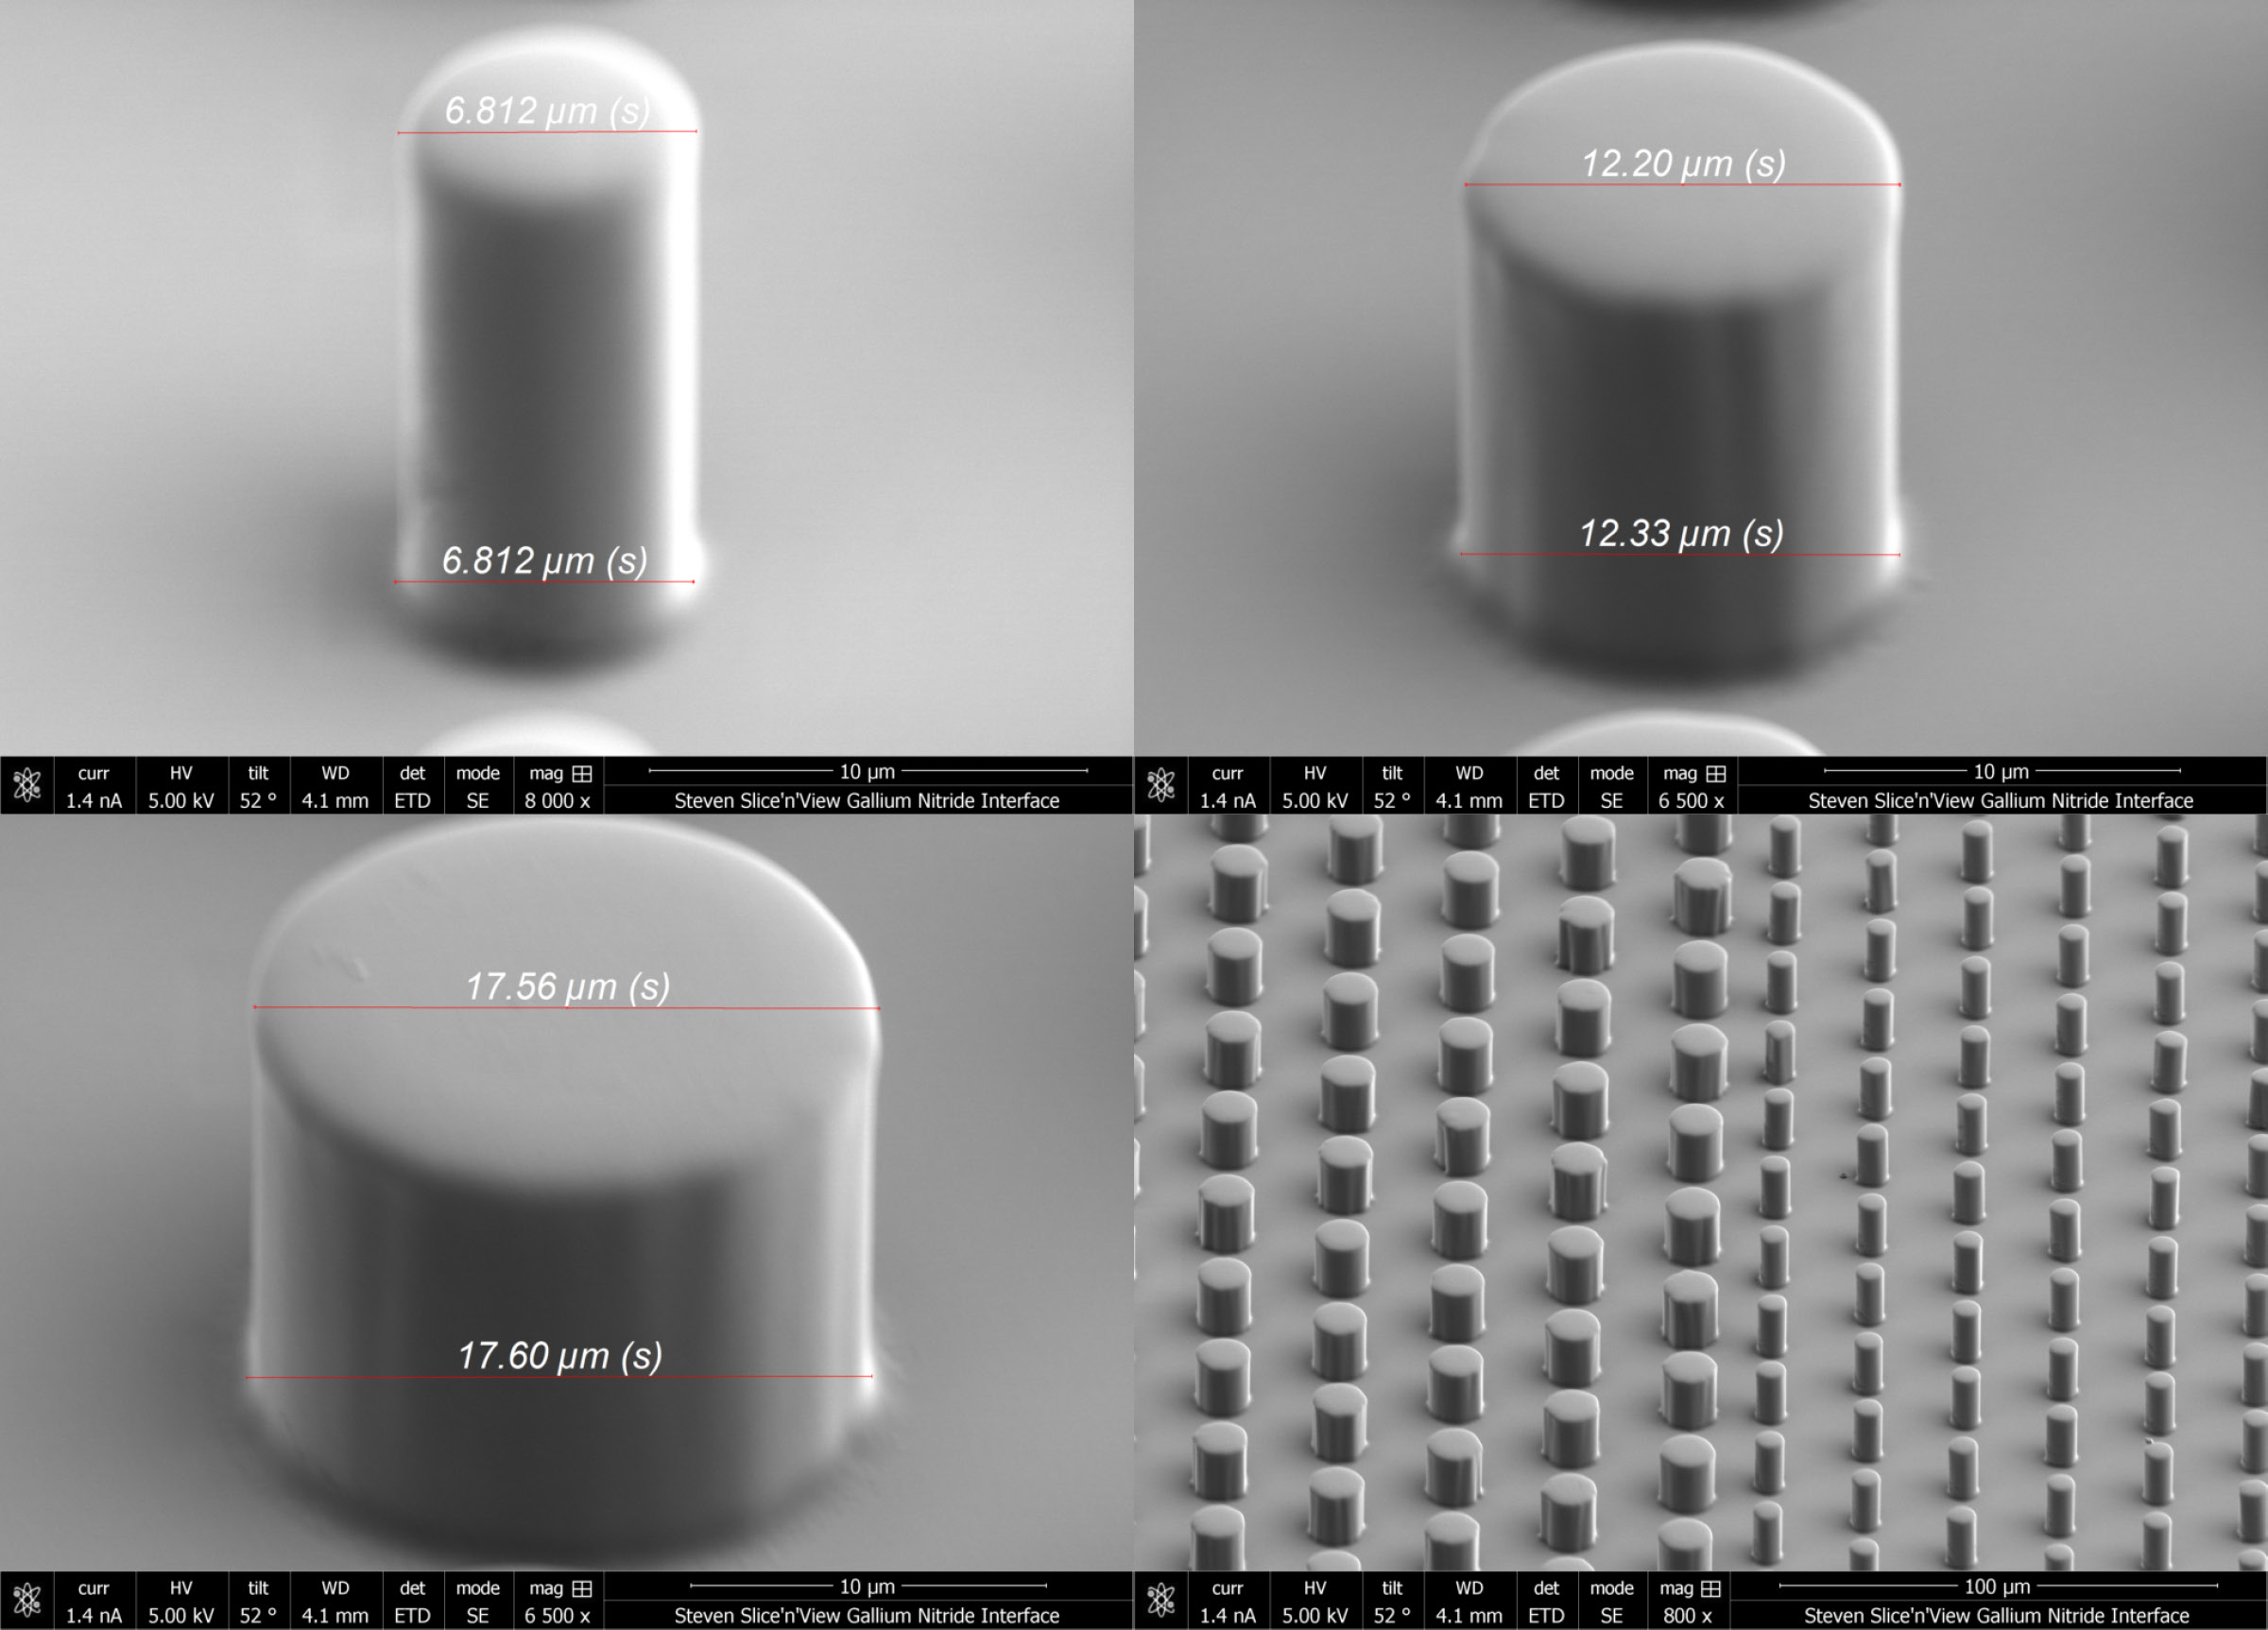
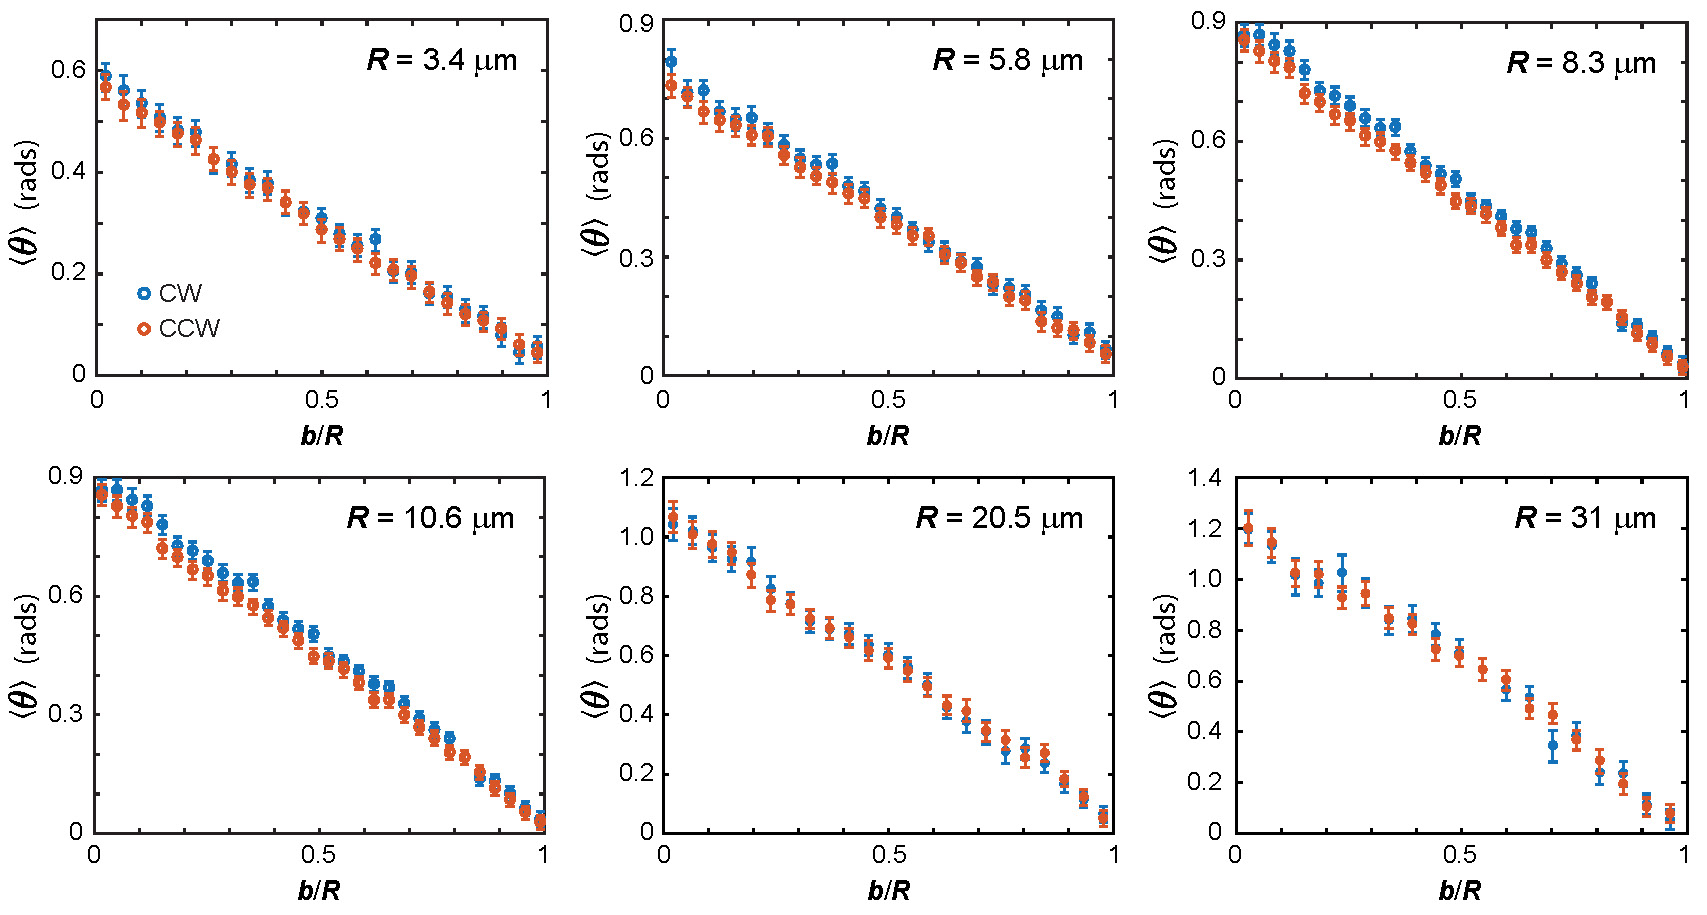
Given the mid-plane reflection symmetry of the device (in ) we expected the CW- and CCW-rotator distributions (including counter-rotators) to be approximately symmetric when mirrored across the and lines. We tested this by applying the appropriate symmetry operations to the data and then compared the mean scattering angles of each lobe for . For each pillar radius the mean scattering angles between the two lobes were largely symmetric. As pillar radius increased, there was a small chiral asymmetry between the two lobes (SI Fig. 19). Through initial, iterative improvement of the fabrication process we observed that decreasing the systematic tapering of pillars – resulting from photolithography – reduced these chiral asymmetries. Thus the observed asymmetry likely arises from small, systematic pillar tapering () that asymmetrically affects chiral coupling at the upper and lower surfaces where the difference in pillar radius is greatest.
4 MLE Fitting
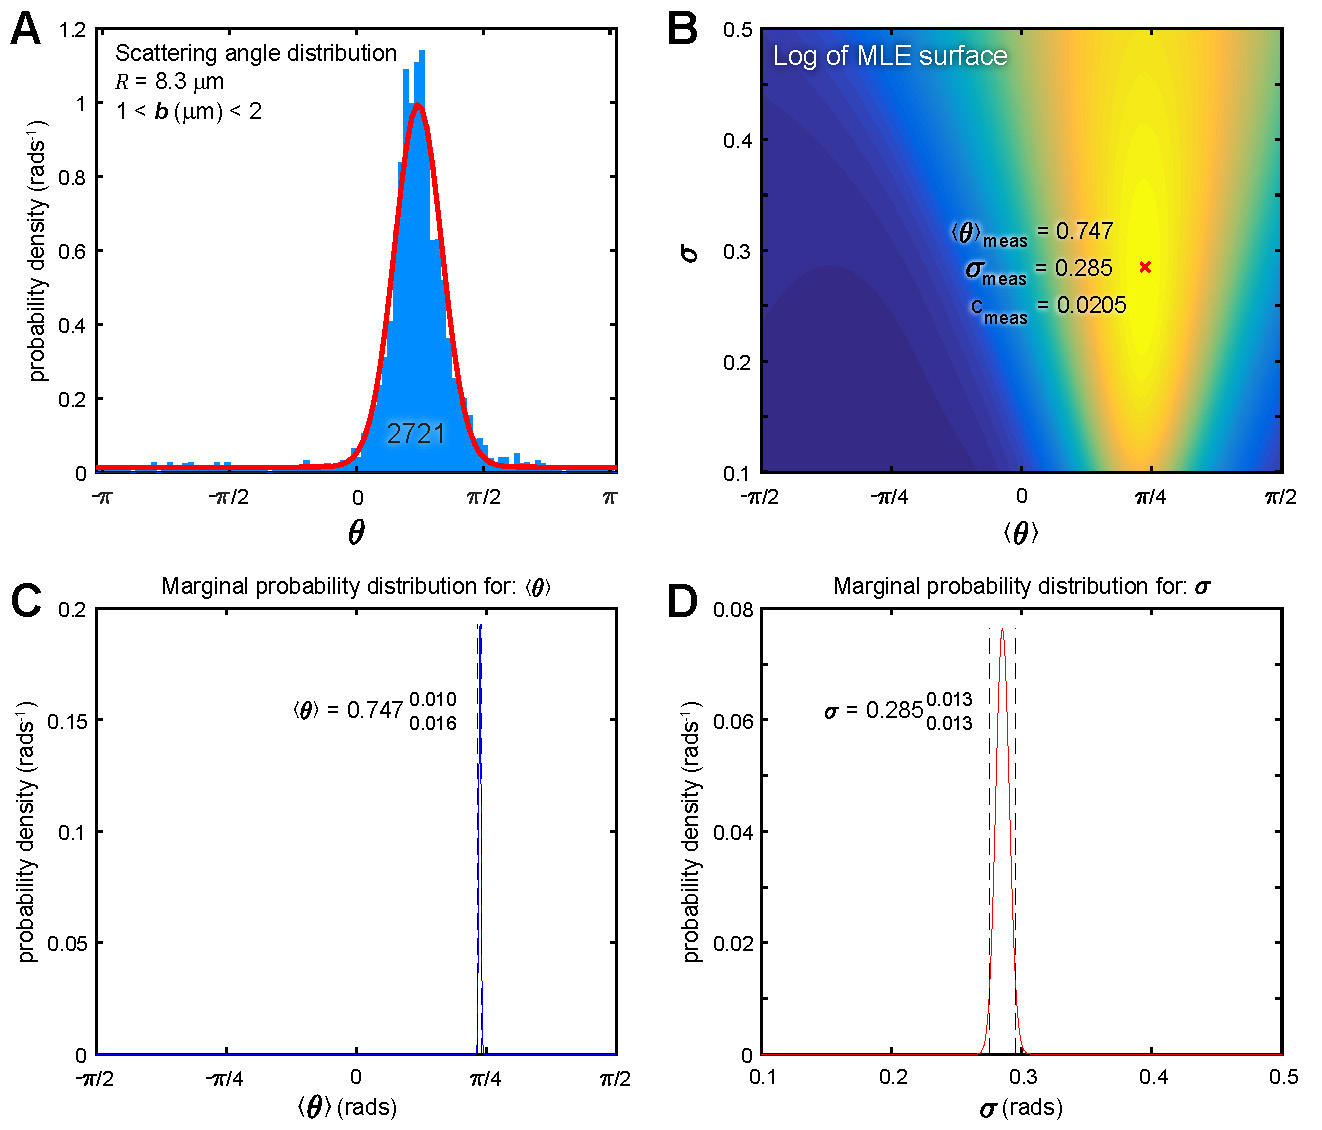
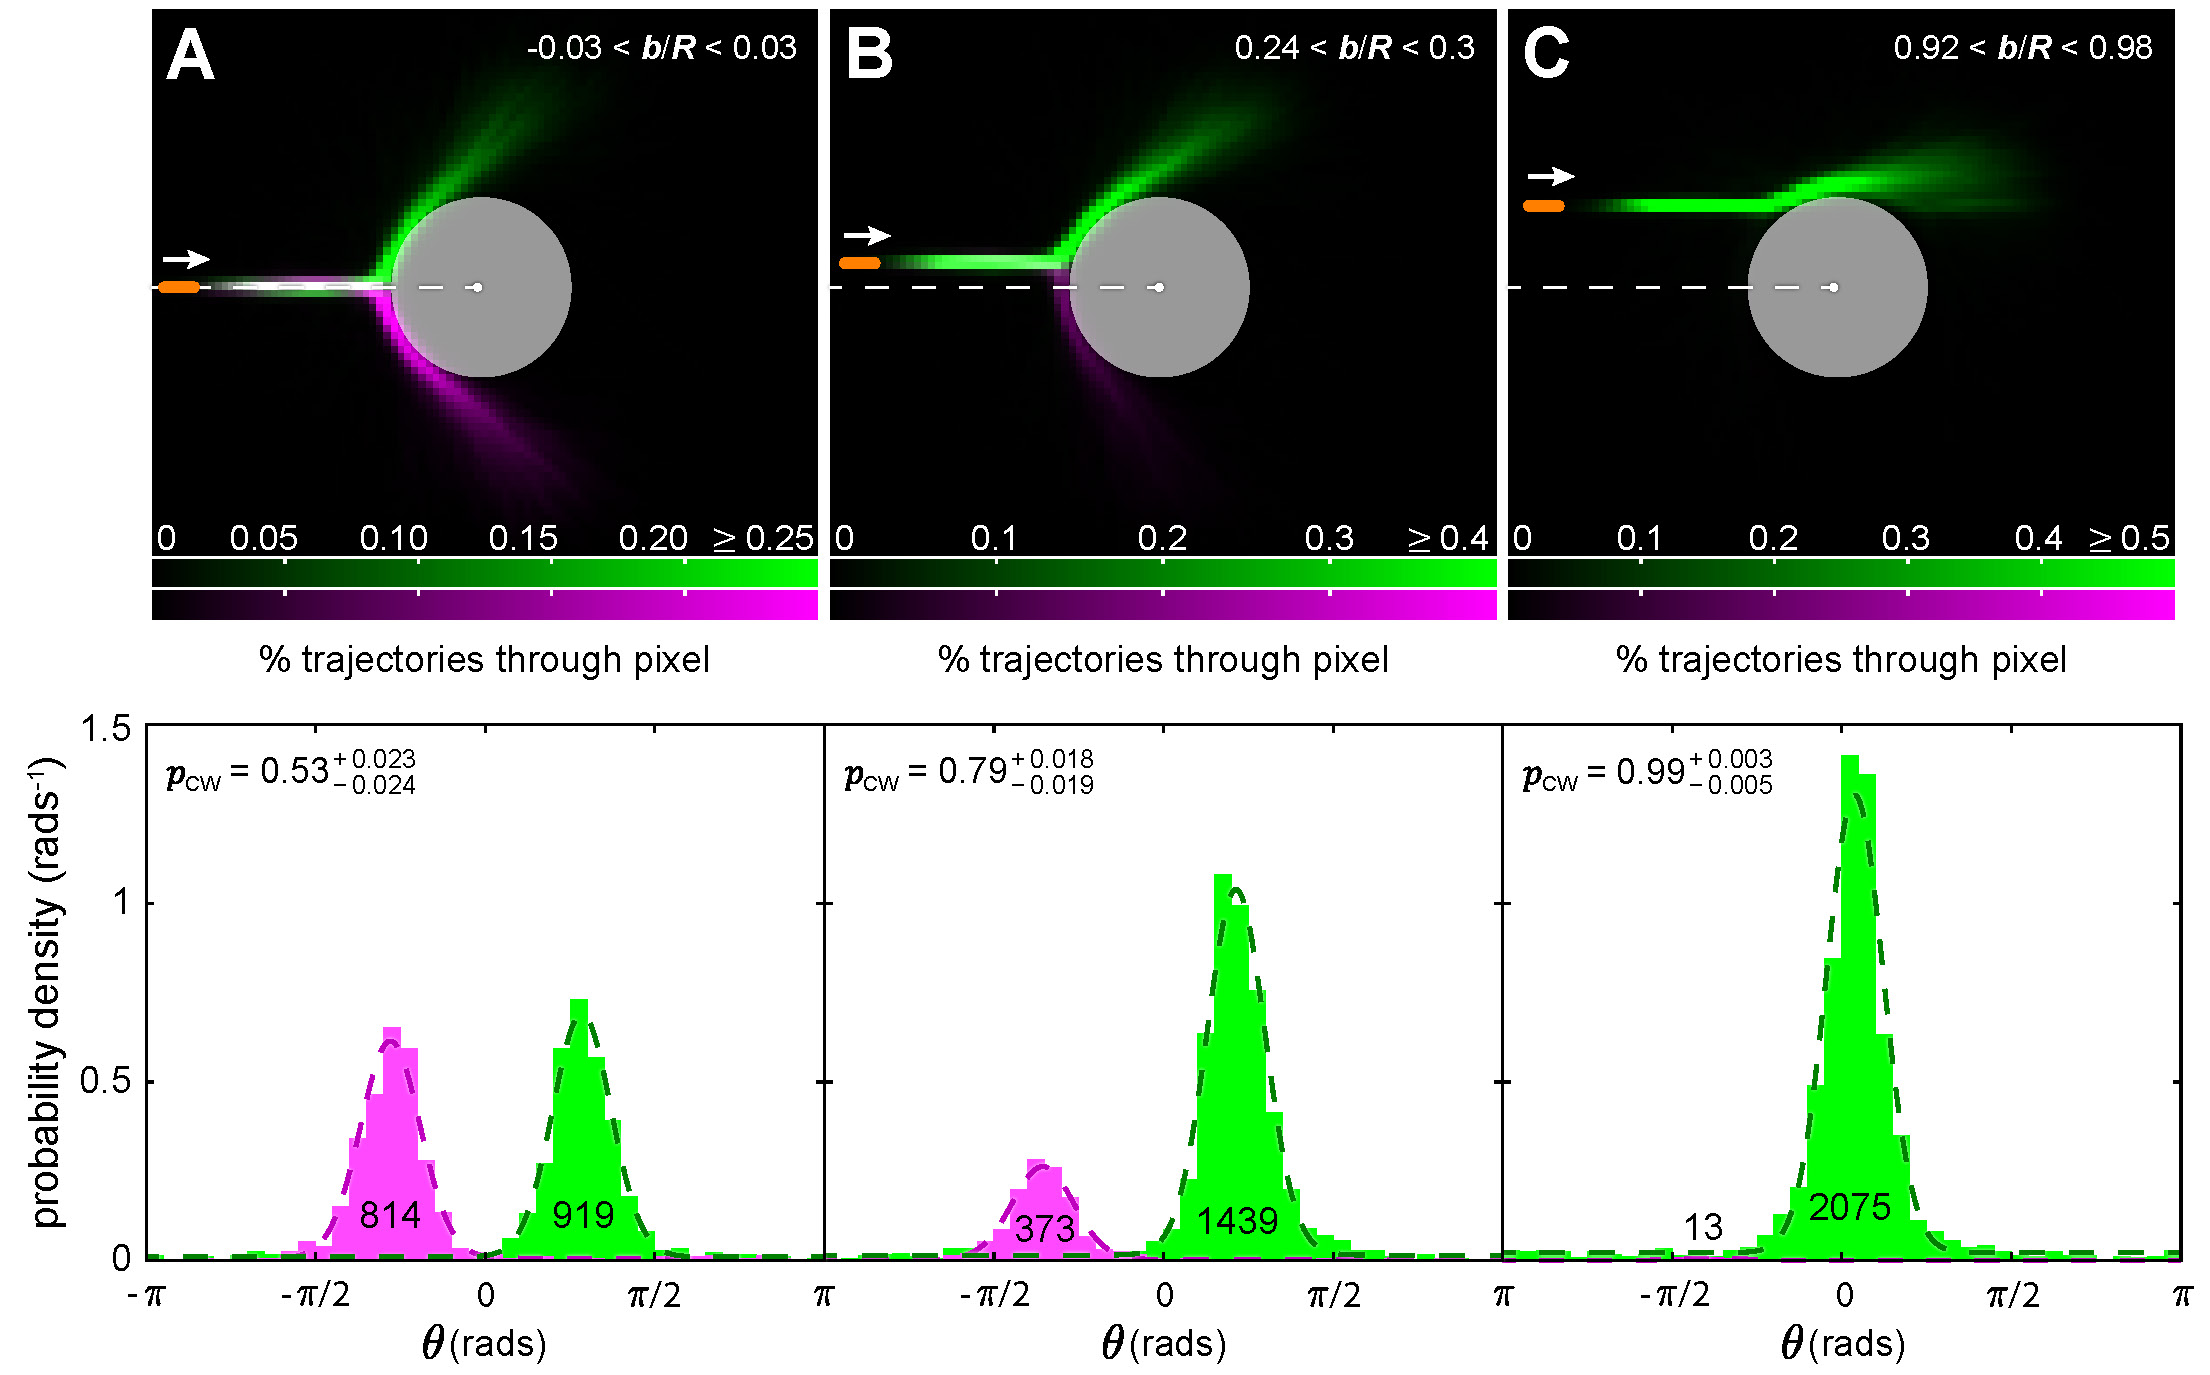
In order to extract parameters that both describe the trends of the scattering process and to compare with the predictions of our model, we applied Maximum-likelihood estimation to determine parameter values and 95% confidence intervals. For each bin in , we started with a von Mises distribution modified to include a constant offset that accounts for the uniform scattering angle that corresponds to non-directional ‘tumble-collisions’ in our measured data
| (61) |
where is the measured scattering angle, is the width of the distribution in radians (analogous to the standard deviation of a Gaussian), is the mean scattering angle, is the offset parameter, and is the modified Bessel function of the first kind. The index spans the measured values of . The log-likelihood function is then
| (62) |
which simplifies to
| (63) |
where the fraction of tumble-collisions is
| (64) |
We numerically sampled the log-likelihood function over reasonable ranges of all three parameters, and found the mode values for the parameters with 95% confidence intervals specified from the respective marginal distributions. An example of this data processing routine is shown SI Fig. 12.
5 Device Fabrication
Bacterial scattering events were measured in atypical microfluidic devices composed of a silicon wafer patterned with photoresist, and mechanically compressed against a thin layer of PDMS that was bonded to a glass slide. The top of the device consisted of a silicon wafer (University Wafer) onto which we spun a base layer of SU-8 2000.5 negative photoresist (Kayaku Advanced Materials Inc.). That layer was first soft baked at for 1 minute, exposed at an energy density of , and baked at for another minute to cure the layer. This base layer increases adhesion of the pillars to the surface and improves feature resolution. Onto this existing layer of cured photoresist, we spun a layer of SU-8 2015 negative photoresist, and then soft baked it at for three minutes. This thicker layer of photoresist was exposed with a quartz chromium mask containing the flow layout and pillared regions within the device, using a Suss MJB4 mask aligner. ‘T-topping’ (i.e. pillar taper) was minimized by filtering wavelengths below using a Hoya L-37 longpass filter (Hoya Optics Inc.) with an exposure energy density of . The photoresist was developed by mildly agitating the silicon wafer in SU-8 developer for 3 minutes and then performing a final ‘hard bake’ for 10 minutes at to increase structural stability.
The bottom piece consists of a thin layer of PDMS bonded to a glass slide that has inlet and outlet ports pre-drilled. Uncured PDMS is compressed between the pre-drilled slide and a second glass slide treated with tichlorosilane to minimize adhesion of the PDMS to this second slide. Small adhesive spacers between the two slides fixed the PDMS layer thickness to be . The PDMS was bonded to the drilled slide by baking at for 90 mins. Excess PDMS was removed from the inlet and outlet ports using a 1 mm biopsy punch. The patterned silicon wafer was then aligned to the inlet and outlet ports and mechanically compressed to create an airtight seal suitable for pulling suspensions of cells through the device with a syringe.
Once filled with the cellular suspension, the device ports were sealed to halt any global flow, and the device was viewed from the bottom through the glass slide on an inverted microscope.
6 Supporting Figures
