techreport \toggletruetechreport
Revisiting Comparative Performance of DNS Resolvers in the IPv6 and ECS Era
Abstract
This paper revisits the issue of the performance of DNS resolution services available to Internet users. While several prior studies addressed this important issue, significant developments, namely, the IPv6 finally getting traction and the adoption of the ECS extension to DNS by major DNS resolution services, warrant a reassessment under these new realities. We find that DNS resolution services differ drastically – by an order of magnitude in some locations – in their query response time. We also find established resolvers (Google DNS and OpenDNS) to lag far behind relative newcomers (Cloudflair and Quad9) in terms of DNS latency, and trace the cause to drastically lower cache hit rates, which we further trace to less cache sharing within the resolver platform. In addition, we find that public resolvers have largely closed the gap with ISP resolvers in the quality of CDNs’ client-to-edge-server mappings as measured by latency. Finally, in most locations, we observe IPv6 penalty in the latency of client-to-CDN-edge-server mappings produced by the resolvers. Moreover, this penalty, while often significant, still does not rise above typical thresholds employed by the Happy Eyeballs algorithm for preferring IPv4 communication. Thus, dual-stacked clients in these locations may experience suboptimal performance.
1 Introduction
DNS is a core component of the Internet machinery that not just maps human-readable hostnames into IP addresses but also plays a vital role in traffic engineering. In particular, CDNs, which, according to Cisco [Cisco_VNI], deliver over half of Web traffic to consumers, commonly use DNS to assign an end-user to the appropriate edge server. The performance of the DNS system, and especially the quality of DNS-provided mapping of a user to an edge server when the user accesses CDN-delivered content, plays a direct impact on user’s Web experience. This paper considers the performance of the DNS system from the end-user perspective, both in terms of its latency in answering queries and in terms of the quality of CDN user mappings. Several studies considered these important issues (e.g., [ager2010comparing, huang2011public, hours2016study]) and in particular documented lower user mapping quality produced by public resolvers. However, the emergence of the EDNS-Client-Subnet (ECS) DNS extension [rfc7871] to help public DNS resolvers provide high-quality CDN mappings for their users, as well IPv6 finally getting traction [CAZ+14], warrant a reassessment of these issues under these new realities.
This paper compares the performance experienced by end-users when using four popular IP public resolvers in terms of DNS resolution time and the quality of CDNs’ client-to-edge-server mappings, referred henceforth as ”client mappings”. Furthermore, all public resolvers and CDNs we consider are dual-stack, that is, capable of communicating with their clients over both IPv4 and IPv6. Thus, by recruiting vantage points that are also dual stack, we are able to directly assess any impact the IP version may have on these performance aspects.
Our main contributions include the following novel findings.
-
We find that DNS resolution services differ drastically – by an order of magnitude in some locations – in their query response time. In particular, the latency of established resolvers (Google DNS and OpenDNS) in our measurements far exceeds the latency of relative newcomers (Cloudflare and Quad9). We present strong evidence that a major cause of these higher latencies lies in less cache sharing within the resolvers platforms. Prior studies that considered public resolvers performance [ager2010comparing, huang2011public, hours2016study] focused on comparing them to ISP resolvers rather than to each other. A notable exception is a non-peer-reviewed NANOG presentation [DNS_resolvers_NANOG18], which also observed some of the differences but did not uncover the causes behind them. We contrast our findings with those in [DNS_resolvers_NANOG18] later in this paper.
-
We assess the impact of the IP version choice on DNS latency of the interaction between DNS clients and their resolvers. While multiple prior studies compared general performance of IPv4 and IPv6 (e.g., [law2008empirical, nikkhah2011assessing, zhou2008ipv6, wang2005understanding]), they only consider communication performance, whereas DNS latency may also be affected by server platforms, potentially engineered and provisioned differently for IPv4 and IPv6. We find that the DNS latency is generally little affected by the client’s choice of IP version to interact with the DNS system.
-
While IP version has little impact on DNS latency, we do observe IPv6 penalty in the latency of CDNs’ client mappings in most of our locations. Moreover, this penalty, while often substantial, still does not rise above typical thresholds employed by the Happy Eyeballs algorithm for preferring IPv4 communication. Thus, clients in these locations who choose IPv6 for Internet communication or use the Happy Eyeballs algorithm [rfc8305] to dynamically select between IPv4 and IPv6 for TCP communication, may experience suboptimal performance when accessing CDN-accelerated content.
-
Finally, we find that public resolvers have all but closed the gap with ISP-provided resolvers in the quality of CDNs’ client-to-edge-server mappings as measured by latency documented previously in a number of studies [ager2010comparing, huang2011public, hours2016study].
Our measurement datasets are available at [our_data].
2 Related Work
Several studies investigated the impact of using DNS public resolvers on end-users’ performance [ager2010comparing, huang2011public, hours2016study]. While differing in methodologies, they found that ISP resolvers were geographically closer [huang2011public], and redirected end-users to more proximal CDN edge servers [ager2010comparing, huang2011public, hours2016study] than the public DNS resolvers considered (collectively, Google, OpenDNS, and Level 3). However, these studies were conducted before ECS was either proposed [ager2010comparing, huang2011public] or adopted by the CDN under study [hours2016study]. None of them consider the impact of IPv6 on DNS behavior. Further, they focus on comparing public resolvers performance to that of ISP resolvers rather than to each other.
A NANOG presentation [DNS_resolvers_NANOG18] compares the responsiveness and availability of a large number of public resolvers but limits its analysis to only client-resolver interaction. An important aspect of our study, not addressed in [DNS_resolvers_NANOG18], is the comparison of quality of CDN client mappings produced by different resolution services. With respect to the latencies of client-resolver interactions, we contrast our findings with [DNS_resolvers_NANOG18] later in the paper but also uncover the root causes behind performance differences among the public resolvers in this regard (Section 4.1).
Chen et. al [chen2015end] studied the impact of enabling ECS at Akamai on the quality of client-to-edge-server mapping, especially for the clients using public resolvers. Their results show that enabling ECS has decreased the RTT between these clients and their edge servers by 50%, and significantly improved other metrics, at the cost of increasing the number of DNS queries from public resolvers to Akamai’s authoritative DNS servers by a factor of 8. Sánchez et. al [sanchez2013dasu] found similarly significant impact of ECS on the quality of client mapping in the EdgeCast CDN for clients using Google Public DNS. Using active measurements from a specially instrumented client application, they observed the reduction in the time to obtain the first byte of content of 20-60% for clients in North America and Western Europe and 70-90% for clients in Oceania. At the same time, our study shows that, with sufficient resolver footprint, a public DNS resolver can provide competitive client-to-edge-server mappings without resorting to ECS as we found Cloudflare and, to a less extent, Quad9, achieve this for most regions and CDNs we consider.
Turning to the impact of IPv6 transition, Alzoubi et.al [alzoubi2013performance] studied performance implications of unilateral enabling of IPv6 by Websites. They found no evidence of performance penalty for doing so, although their measurements employed coarse time granularity of 1 second. This finding was largely confirmed by Bajpai et. al [bajpai2016measuring]. Probing Alexa top-10K websites from 80 vantage points, the authors found that although most tested websites had higher latency over IPv6, 91% of these sites had IPv6 latencies within 1 msec of their IPv4 counterparts. Our investigation complements these studies by considering IPv6 impact on the quality of client-to-edge-server mappings, and finds the impact to be much more significant.
3 Methodology
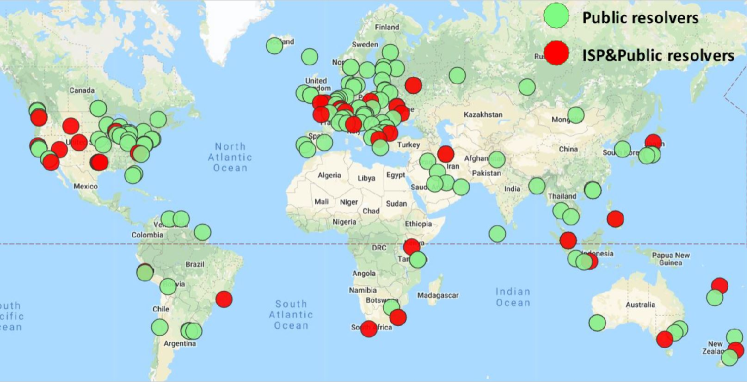
To conduct this study, we use 200 dual-stack RIPE Atlas probes [RIPE_Atlas], chosen from the total 1600 probes listed as dual-stack by RIPE Atlas based on their stability and diversity of represented autonomous systems and geographic locations. Using more probes would not appreciably improve general representativeness of our results because of a general strong skew of RIPE Atlas probes towards North American and, especially, European locations, which are already disproportionally represented in our sample. Four of our RIPE Atlas probes failed to get allocated to our experiment and did not produced any results. Moreover, we excluded another 8 probes as they consistently timeout on some services/protocols. The 188 productive probes are distributed in 74 countries across 188 ASes and 6 regions: 52 in North America (US and Canada), 70 in Europe, 38 in Asia, 11 in Latin America, 7 in Africa, and 10 in Oceania (a region that includes Australia and Pacific islands). Figure 1 shows the distribution of the probes.
We use these vantage points to access the first 100 websites from Majestic top-1M list [maj] that (a) support both IPv4 and IPv6 protocols (b) are accelerated by a CDN – which we determine by examining the CNAME chain of the DNS resolution of a website with ”www” prepended and (c) support HTTPS such that we can measure the latency between the probes and the assigned edge server111RIPE Atlas probes don’t support HTTP requests but do allow a TLS handshake, thus enabling the TCP latency measurement between the probe and the CDN edge server to which the probe is mapped.. The CDNs used by these websites include Akamai (65 sites), Cloudfront(17), Google(9), Fastly(8), and Incapsula (1).
Results Representativeness: Two aspects of our measurements concern the representativeness of our results: our selection of vantage points and the websites used to collect our datasets. With regard to the vantage points, while we carefully selected our probes to represent diverse geographic regions and ASes, one can’t assume they follow the distribution of the user concentrations. Thus, our results provide point assessments of comparative client experience at our vantage points as they choose different resolvers and IP versions, but we caution against using them for Internet-wide generalizations222We still note that the number of vantage points in our study compares favorably with prior peer-reviewed studies, including [ager2010comparing], which used ”more than 60 vantage points” from 50 commercial ISPs, [hours2016study], which employed a single vantage point, and [huang2011public], which performed its study from the perspective of a single website and its content delivery platform. A NANOG presentation [DNS_resolvers_NANOG18] describes a study that utilized somewhat more IPv4 vantage points (252 vs. 188) but less than a third of IPv6 vantage points (58 vs. 188) than our study..
With regard to using only 100 websites, we emphasize that our goal is not to assess the performance of the websites themselves but to compare the quality of client-to-edge-server mappings a CDN provides when accessed through various DNS resolution services and IP versions. Since Akamai, with its vast footprint of relatively small points of presence, is known to utilize only subsets of their points of presence for delivery of individual websites, it is useful to probe its mapping behavior through several websites. But generally, a small number of busy websites per CDN suffices. To verify this, we test that our results are not skewed by the website selection. We pick 50 websites out of the original 100 by randomly selecting roughly half of each CDN’s customers: 32 from Akamai, 8 from Cloudfront, 5 from Google, 4 from Fastly, and 1 from Incapsula. We then consider what effect, if any, this smaller set of websites would have on our results. We observe the median DNS latencies to stay within 2 msec from their values with 100 websites, and the median mapping latency within 1 msec for Akamai and within 2msec for non-Akamai CDNs.
Measurements: We consider the following public resolvers: Google Public DNS, OpenDNS, Quad9 and Cloudflare. We further contrast performance of these public resolvers with the ISP-provided resolvers for the probes. For the latter, we only consider the probes for which we can determine that their default resolvers are provided by their ISP. We determine this is the case by sending a query to our own domain from each probe and inferring the probe uses an ISP resolver if the two belong to the same autonomous system as determined by Team Cymru [cymru] or share at least a /24 prefix. Of all our productive probes, 36 pass this test and we use measurements from these probes when considering performance of ISP-provided resolvers. These probes represent 23 countries in all 6 regions, and 36 autonomous systems.
We conduct the following measurements when exploring a website from each probe. First, we measure DNS query latencies when querying for IPv4 address (A-type query) and IPv6 address (AAAA-type query), and when communicating with the resolver over IPv4 or IPv6 protocol – resulting in four combinations of query types and protocols used for communication. Second, we assess the quality of the obtained CDN mappings by measuring the latency of TCP handshake to the received CDN edge server, using its obtained IPv4 and IPv6 addresses. We conducted our experiment between October 30 and November 4, 2018.
For DNS latency, since we are interested in the responsiveness of the resolution services themselves, we attempt to factor out uncertainties due to unpredictable state of caching at the time of measurement by putting all resolution services on the level playing field with regard to caching. We thus first send a query to prewarm the revolver cache and, after waiting for 10 sec to ensure this query does precede the measurement despite Atlas’s imprecise scheduling (since even unused records have been shown to typically stay in the DNS cache much longer [schomp2013measuring], the response is likely to remain the cache despite this delay), use the median response time of three subsequent back-to-back queries as the measurement result for analysis. For mapping latency, we perform three downloads of the SSL certificate from the assigned CDN edge server and take the median handshake RTT (time between the SYN and SYN/ACK segments) for the result. We refer to this metric as mapping latency below. We interchangeably call assignments of clients to IPv4 (resp., IPv6) edge servers as IPv4 or A (resp., IPv6 or AAAA) mappings. To ensure fairness of the analysis, unless a probe produces all results (both DNS and mapping latencies) through every resolver for a specific website, we exclude such (probe,website) pair from any further consideration. Thus, we are able to use 17,573, out of possible, such pairs.
4 DNS Response Time
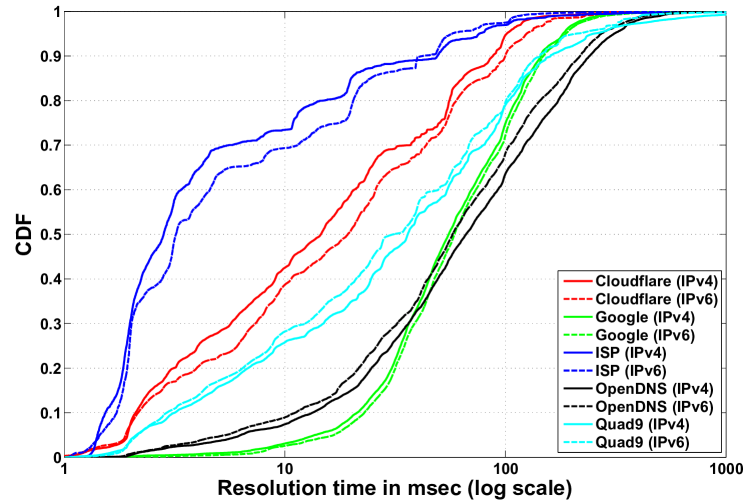
We first consider the overall distribution of DNS response times across all our vantage points, which reflects the aggregate performance trends for various resolution services and protocols, and then present performance differences from individual vantage points perspective. Figure 2 plots cumulative distribution of response times for A-type DNS queries conducted over IPv4 and IPv6 protocols using the resolvers under study (the distributions of AAAA query latencies are virtually identical). For convenience, Table 1 lists median latencies for all query types and protocols. We make the following observations.
| IP | ISP-Provided | Cloudflare | Quad9 | OpenDNS | ||||||
|---|---|---|---|---|---|---|---|---|---|---|
| A | AAAA | A | AAAA | A | AAAA | A | AAAA | A | AAAA | |
| v4 | 2.82 | 2.78 | 14.24 | 14.56 | 36.03 | 34.80 | 55.29 | 57.75 | 66.24 | 61.96 |
| v6 | 3.21 | 3.19 | 19.27 | 19.28 | 31.06 | 31.44 | 58.67 | 57.84 | 57.51 | 55.38 |
-
The times to resolve A and AAAA queries via a given resolver over a given IP version are very close. From Table 1, median latencies for both query types are within 5 ms of each other.
-
The DNS latency is also generally similar for IPv6 and IPv4 interactions. Delving deeper, Cloudflare responds somewhat slower333Throughout the paper, whenever we point out a difference in distributions, we verified that the Kolmogorov-Smirnov test rejected the hypothesis that the two samples in question come from the same distribution at significance level of at most 0.1%, and in fact mostly at much lower significance levels as the p-values are vanishingly small. over IPv6 than over IPv4, with its median latency 35% and 32% higher for A and AAAA queries, respectively, while Quad9 and OpenDNS are actually slightly quicker. We discuss possible reasons for these better latencies in Section 4.1. Google’s performance is virtually unaffected, and ISP resolvers are so much quicker than the public resolvers that any impact from the protocol choice is immaterial by comparison.
-
ISP resolvers respond statistically much faster than public resolvers, both over IPv4 and IPv6.
-
Among public resolvers, longer established providers (Google and OpenDNS) are significantly slower than relative newcomers (Quad9 and especially Cloudflare).
Comparing our results with the findings in the NANOG presentation (see [DNS_resolvers_NANOG18], slide 12), both studies find lower latency of Cloudflare than Google and OpenDNS. However, we find the latencies for all three providers, as well as the latency difference between Cloudflare and the other two providers, significantly higher than in [DNS_resolvers_NANOG18]. We can attribute our generally greater latencies to the fact that our vantage points represent a variety of networks including residential ones (which tend to have higher last-mile latencies), whereas [DNS_resolvers_NANOG18] used vantage points in their own data centers. However, this can’t explain the greater difference in latencies between the providers, for which we don’t have an explanation.
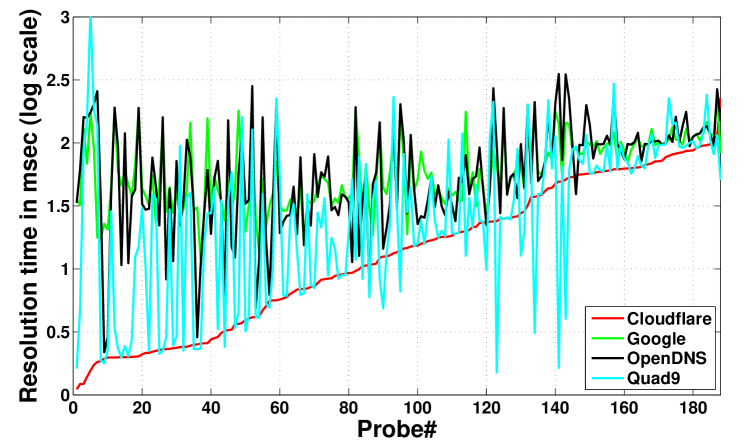
We now turn from aggregate DNS latency distributions across all vantage points to DNS latency comparison from the perspective of each vantage point. Figure 3 shows the DNS response times seen by each vantage point when using the public resolution services under study. Each data point is the median response time of a given resolver over the 100 hostname queries used in our study. The vantage points are listed on X-axis in the order of their Cloudflare latencies, and the remaining curves show corresponding latencies these vantage points experience through other resolvers. We only present the results for A-type queries over IPv4; the other three combinations of query type and the IP version produced similar results.
The figure shows that the conclusion we drew earlier for aggregate latency distributions across vantage points also holds for individual vantage points: a vast majority of vantage point experience significantly better average DNS latency with Cloudflare and Quad9 than with Google and OpenDNS, and a great majority of vantage points have lower latency with CLoudflare than with Quad9, although for some locations Quad9 holds large advantage. The figure further shows that for quite a few locations, these latency differences can be dramatic, by an order of magnitude or more, while other locations see only marginal differences. Thus, if one wants to maximize their DNS performance, they need to test different DNS providers from their specific location before choosing one to use.
4.1 On Causes for DNS Latency Differences
Lagging performance of Google and OpenDNS relative to Cloudflare has been observed previously in a non-peer reviewed article [DZone], but we would like to understand possible reasons behind this finding. One factor could be a difference in footprints. However, ping latencies from our probes to the resolvers’ anycast front-ends 444Because we did these measurements later, some of our probes were no longer available; we had 139 probes for IPv4 pings and 130 for IPv6. paint a mixed picture: while Cloudflare indeed shows lower median latencies (11.01ms for IPv4 and 12.85ms for IPv6) than the other three (24.49ms and 25.41ms for Quad9, 18.55ms and 23.67ms for Google, and 25.13ms and 26.82ms for OpenDNS), the other three resolvers all have latencies in the same ballpark. Thus, at least their front-ends are at a similar distance. We uncover another reason for the performance difference: the data below provides strong indication that the difference in the DNS cache miss rates plays a major role.
To assess the miss rate, we obtain the authoritative TTL of the responses by directly querying the authoritative DNS servers of the CDN services used by our target websites. Then we consider a response to be a cache miss if its TTL is equal to the authoritative except for Google, which decrements authoritative TTL by 1 sec before serving the authoritative response on a miss [google_cache]. So for Google we detect a cache miss if the response TTL is one second less than the authoritative.
Table 2 lists miss rates of the different resolvers for A queries, as well as the median latencies of the queries that hit and missed in the cache. The results for AAAA queries have the same trends and are not shown. In this analysis, we include all three queries past the cache-warming query for each website.
| Miss rate | Hit latency | Miss latency | ||||
|---|---|---|---|---|---|---|
| Resolver | (%) | (ms) | (ms) | |||
| IPv4 | IPv6 | IPv4 | IPv6 | IPv4 | IPv6 | |
| ISP | 6.26 | 7.20 | 2.53 | 3.05 | 31.14 | 24.30 |
| Cloudflare | 1.76 | 2.26 | 14.46 | 19.16 | 24.07 | 28.64 |
| Quad9 | 16.67 | 17.22 | 34.16 | 28.31 | 156.32 | 68.55 |
| 72.47 | 75.85 | 30.97 | 31.50 | 64.05 | 65.44 | |
| OpenDNS | 83.11 | 72.94 | 24.08 | 26.47 | 77.89 | 76.63 |
Table 2 provides a clear sources of the lower latencies of Cloudflare and Quad9 over Google and OpenDNS. First, both Quad9 and, especially, Cloudflare have dramatically lower miss rate. In fact, in the case of Quad9, this lower miss rate compensates for much higher miss latency, still resulting in lower overall latency in Figure 2555As a side observation, we also note a large difference between Quad9’s miss latency over IPv4 vs. IPv6. While speculating on a reason for this finding would require understanding of their platform architecture, this difference explains why Table 1 shows lower median latency of Quad9 over IPv6 than IPv4.. Second, Cloudflare has significantly lower latencies for both hits and misses than the other public resolvers.