Entanglement and classical correlations at the doping-driven Mott transition in the two-dimensional Hubbard model
Abstract
Tools of quantum information theory offer a new perspective to characterize phases and phase transitions in interacting many-body quantum systems. The Hubbard model is the archetypal model of such systems and can explain rich phenomena of quantum matter with minimal assumptions. Recent measurements of entanglement-related properties of this model using ultracold atoms in optical lattices hint that entanglement could provide the key to understanding open questions of the doped Hubbard model, including the remarkable properties of the pseudogap phase. These experimental findings call for a theoretical framework and new predictions. Here we approach the doped Hubbard model in two dimensions from the perspective of quantum information theory. We study the local entropy and the total mutual information across the doping-driven Mott transition within plaquette cellular dynamical mean-field theory. We find that upon varying doping these two entanglement-related properties detect the Mott insulating phase, the strongly correlated pseudogap phase, and the metallic phase. Imprinted in the entanglement-related properties we also find the pseudogap to correlated metal first-order transition, its finite temperature critical endpoint, and its supercritical crossovers. Through this footprint we reveal an unexpected interplay of quantum and classical correlations. Our work shows that sharp variation in the entanglement-related properties and not broken symmetry phases characterizes the onset of the pseudogap phase at finite temperature.
I Introduction
Quantum information theory Cover and Thomas (2006); Watrous (2018) provides new concepts, based on the nature of the entanglement, for characterising phases of matter and phase transitions in correlated many-body systems Amico et al. (2008); Eisert et al. (2010); Laflorencie (2016); Zeng et al. (2019). Entanglement properties can even describe new kinds of orders beyond the Landau theory, such as quantum-topological phases Wen (2017). But entanglement properties are in general elusive for measurements. However, advances with ultracold atoms have removed this barrier: recent experiments have demonstrated the ability to directly probe entanglement properties in bosonic and fermionic quantum many-body systems Islam et al. (2015); Kaufman et al. (2016); Cocchi et al. (2017); Lukin et al. (2019); Brydges et al. (2019).
In particular, the fermionic Hubbard model in two dimensions has a prominent role in the study of correlated many-body systems with ultracold atoms Jaksch and Zoller (2005); Esslinger (2010); Jordens et al. (2008); Schneider et al. (2008); Hofrichter et al. (2016); Cocchi et al. (2016); Cheuk et al. (2016); Parsons et al. (2016); Boll et al. (2016); Drewes et al. (2016, 2017); Nichols et al. (2018); Brown et al. (2019). On the theory side, this is because this model captures the essence of the correlation problem on a lattice. Experimentally, this is because its behavior can be linked to the phenomenology of high-temperature cuprate superconductors Anderson (1987).
Recent experimental work of Cocchi et al. Cocchi et al. (2017) with ultracold atoms has probed key measures of quantum correlations in the two-dimensional fermionic Hubbard model, paving the way for probing the role of the entanglement in the description of the complex phases of the model. On the theory side, in our work of Ref. Walsh et al. (2019a) using the cellular extension of dynamical mean-field theory (CDMFT), we showed that two indicators of entanglement and classical correlations –the local entropy and the mutual information– detect the first-order nature of the Mott metal-insulator transition, the universality class of the Mott endpoint, and the crossover emanating from it in the supercritical region. The local entropy is a measure of entanglement between a single site and its environment Amico et al. (2008). The mutual information measures the total (quantum and classical) correlations between a single site and its environment Groisman et al. (2005); Watrous (2018).
However, the theoretical framework of Ref. Walsh et al. (2019a) has so far been restricted to half filling. Hence, the exploration of the richer region of finite doping using entanglement-related properties remains an open frontier, one that bears relevance for the unconventional superconductivity problem in cuprates Anderson (1987); Lee et al. (2006); Tremblay et al. (2006). Indeed, upon hole-doping the Mott insulating state, electrons start to delocalise but correlations due to Mott physics persist up to large doping levels Sordi et al. (2010). This gives rise to complex electronic behavior, epitomised by the pseudogap state.
Here we generalise the study of Ref. Walsh et al. (2019a), using the same methodology, to the region of finite doping. By tuning the level of doping, we use local entropy and mutual information to characterise the Mott insulator, the strongly correlated pseudogap phase, and the metallic state. By tuning the temperature, we address the interplay between quantum and classical correlations, which is an open research challenge of growing interest Groisman et al. (2005); Wolf et al. (2008); Amico et al. (2008); Eisert et al. (2010); Laflorencie (2016) especially close to critical points Amico and Patanè (2007); Melko et al. (2010); Singh et al. (2011); Kallin et al. (2011); Wilms et al. (2011, 2012); Iaconis et al. (2013); Gabbrielli et al. (2018); Frérot and Roscilde (2019); Wald et al. (2020). Specifically, in CDMFT the pseudogap to metal transition induced by doping is first-order, terminates in a second-order endpoint at finite doping and finite temperature, and is followed by crossover lines in the supercritical region Sordi et al. (2010, 2011, 2012). We found that all these features are imprinted in the entanglement-related properties of a single site, without the need to look for area law properties or topological terms Eisert et al. (2010). Hence signatures at the level of entanglement persist from the low-temperature first-order quantum limit, up to the finite-temperature endpoint and beyond into the supercritical region. Our study corroborates the viewpoint that quantum and classical correlations resulting from Mott physics – and not a low-temperature symmetry-breaking order – are at the origin of the opening of the pseudogap at finite temperature Sordi et al. (2012, 2013); Reymbaut et al. (2019) that is observed, for example, in NMR experiments Alloul et al. (1989).
Even though our calculations are performed on the square lattice to minimize Monte Carlo sign problems, the phenomena would be best observed on frustrated lattices where they would not be masked by antiferromagnetic fluctuations Reymbaut et al. (2020).
We start in Sec. II by discussing the model and the quantum information tools we are using to characterize phases and phase transitions in the model. Then in Sec. III we briefly review the thermodynamic description of the normal-state phase diagram of the two-dimensional Hubbard model. This sets the stage for the information theory description of the doping-driven transition using entanglement entropy in Sec. IV, thermodynamic entropy in Sec. V, and mutual information in VI. We conclude with an outlook on the implications for the pseudogap problem in cuprates in Sec. VII. Additional figures for the analysis of local entropy, thermodynamic entropy, and total mutual information can be found in the appendices.
II Model and method
II.1 Solving the two-dimensional Hubbard model
We study the single band Hubbard model in two dimensions on a square lattice. The Hamiltonian describing the Hubbard model in two dimensions is
| (1) |
where is the nearest-neighbour hopping amplitude, and are the creation and annihilation operators for an electron at site with spin , is the Coulomb repulsion felt by an electron on site , the number operator is , and the chemical potential is .
We study this model using the cellular extension Maier et al. (2005); Kotliar et al. (2006); Tremblay et al. (2006) of dynamical mean-field theory Georges et al. (1996). In this approach, the self-energy of the lattice Green’s function is obtained from that of a cluster immersed in a self-consistent bath of non-interacting electrons. The properties of the bath are determined by requiring that the lattice Green’s function projected on the cluster equal the cluster Green’s function. We solve the plaquette (i.e. cluster) in a bath problem as a quantum impurity problem. We use the continuous-time quantum Monte Carlo method Gull et al. (2011); Sémon et al. (2014) based on the hybridization expansion of the impurity action. We set as our energy unit, and we take and . We also set the lattice spacing equal to as our distance unit.
We follow the numerical protocol described in Refs. Walsh et al. (2019a, b). In particular, we extract the occupation and the double occupation from the empty band up to half filling, in the temperature range , and in a broad range. All the results in this paper were obtained with a small chemical potential step (down to ) so that derivatives can be easily calculated with the simplest finite difference.
Let us briefly comment on the main strengths and limitations of the CDMFT method which are relevant for the results of this work. Like other cluster methods, such as dynamical cluster approach (DCA), CDMFT is a nonperturbative method that exactly treats local and nonlocal (spatial) correlations within the cluster. The inclusion of spatial correlations is a strength of the study on low dimensional systems such as the two-dimensional case studied here. It allows one to go beyond the single-site DMFT description which takes into account local correlations only.
This strength comes with the limitation that cluster size sets the length scale of the spatial correlations that are treated exactly. To overcome this limitation, one can in principle increase the cluster size, although in practice this is a challenging computational task. In other words, CDMFT - along with other cluster methods - can be viewed as a controlled approximation where the control parameter is the cluster size. In this work we do not explicitly assess the convergence of the CDMFT results with the cluster size. Instead, by considering CDMFT with a cluster only, we constrain the correlations to be short ranged. Nonlocal correlations coming from long-wavelength spin fluctuations could hide certain short-range phenomena, including the Mott transition considered in this work. This is true on the square lattice Schäfer et al. (2015). However, calculations on a small cluster of the square lattice are a good proxy for the Mott transition on the triangular lattice where frustration is strong enough to avoid the influence of long-wavelength antiferromagnetic fluctuations. We perform our calculations on the square lattice because on frustrated lattices, such as the triangular lattice, the continuous-time Quantum-Monte Carlo method that we use (CT-HYB) develops a severe sign problem Gull et al. (2011), related to Fermi statistics, that prevents us from reaching very low temperatures.
Note also that within CDMFT, when the correlation length remains finite, then the local observables - like the occupation and the double occupation calculated in this work - converge exponentially fast with increasing the cluster size Biroli and Kotliar (2005). Useful benchmarks of CDMFT results with other numerical techniques can be found for the half-filled model in Refs. Schäfer et al. (2020); Fratino et al. (2017) and away from half filling in Ref. LeBlanc et al. (2015).
Based on these considerations, we expect our results to be quantitatively correct at high temperatures, or at large (where electrons are more localized), or at large (where the effects of correlations are smaller), and only qualitatively correct in the other regions of the phase diagram (figure 3 discussed below shows a comparison with cold atom experiments).
II.2 Extracting entanglement-related properties
We focus on two entanglement-related properties, the local entropy and the mutual information between a single site and the rest of the lattice, averaged over all sites. Following our Refs. Walsh et al. (2019a, b), these two entanglement-related properties can be derived from the entanglement entropy, as explained below.
By partitioning the lattice sites in subsystem and its complement , the entanglement entropy associated to subsystem in a pure state is , where is the reduced density matrix obtained by tracing the density matrix of the total system over , . In information theory language, measures the uncertainty, or lack of information, in the state of subsystem . At zero temperature , the entanglement between and is the source of that uncertainty, and is a quantitative measure of the entanglement between and , hence the name ‘entanglement entropy’. Instead, at finite temperature , contains thermal contributions and hence it is no longer a quantitative measure of the quantum entanglement alone Cardy and Herzog (2014); Vedral (2004); Anders and Vedral (2007).
At finite temperature, it is therefore useful to also consider the concept of mutual information between subsystems and , which measures the total (quantum and classical) correlations shared between and . The mutual information is defined as , where is the entanglement entropy Cover and Thomas (2006); Watrous (2018). Subadditivity of the entropy implies that is non-negative. It equals if and only if the subsystems and are uncorrelated, . Hence a non-zero value of means that the sum of the entropy of the subsystems is larger than the entropy of the total system. In information theory language, a non-zero value of means that the total system contains more information than the sum of its subsystems and – that is, and are correlated.
Entanglement entropy and mutual information can be used to identify and characterize phases in many-body systems, and their phase transitions Amico et al. (2008); Eisert et al. (2010). For many-body systems on a lattice, a first step consists of calculating the entanglement entropy and mutual information between a single site (i.e. subsystem is just a site) and the rest of the lattice. One goal is to identify and characterize phase transitions while varying the tuning parameters of the phase transitions. A second step consists of analyzing how entanglement entropy and mutual information scale when the subsystem grows in size. One of the goals in this case is to characterize phases of matter as different structures in the correlations, and phase transitions as rearrangements of correlation patterns.
Here we confine our study to the first step, i.e. we analyze the behavior of the single-site entanglement entropy and the mutual information between a single site and the rest of the lattice upon doping the Mott insulator within the two-dimensional Hubbard model. This task has the advantage that it can be implemented readily in numerical simulations and in experiments with ultracold atoms in optical lattices.
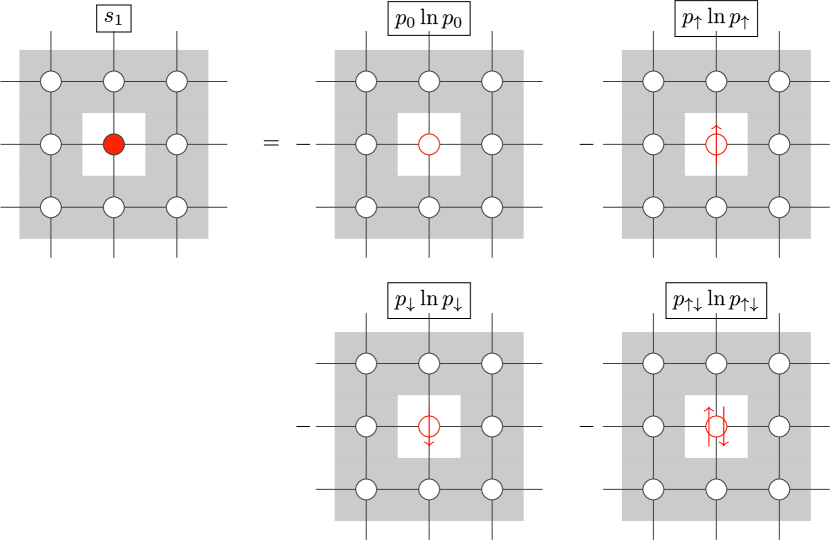
First, let us discuss how to find the single-site entanglement entropy, which we shall call from now on ‘local entropy’ (since we study finite temperatures, and is just a single site ). Particle and spin conservation require the reduced density matrix to be diagonal Zanardi (2002), , where the are the probabilities of finding the site doubly occupied, occupied with a spin up or down particle, or empty. We have , and . Hence is
| (2) |
Fig. 1 illustrates graphically the construction of using Eq. 2.
Hence knowledge of the occupancy and double occupancy suffice to determine . Both and can be accurately calculated in numerical simulations Zanardi (2002); Amico et al. (2008); Gu et al. (2004); Larsson and Johannesson (2005a, 2006); Anfossi et al. (2005, 2007); Byczuk et al. (2012); Lanatà et al. (2014); Udagawa and Motome (2015) and measured with ultracold atoms, thanks to advances in single site microscopy Bakr et al. (2009); Sherson et al. (2010); Cheuk et al. (2015); Haller et al. (2015); Parsons et al. (2015); Omran et al. (2015); Edge et al. (2015); Gross and Bloch (2017); Hartke et al. (2020).
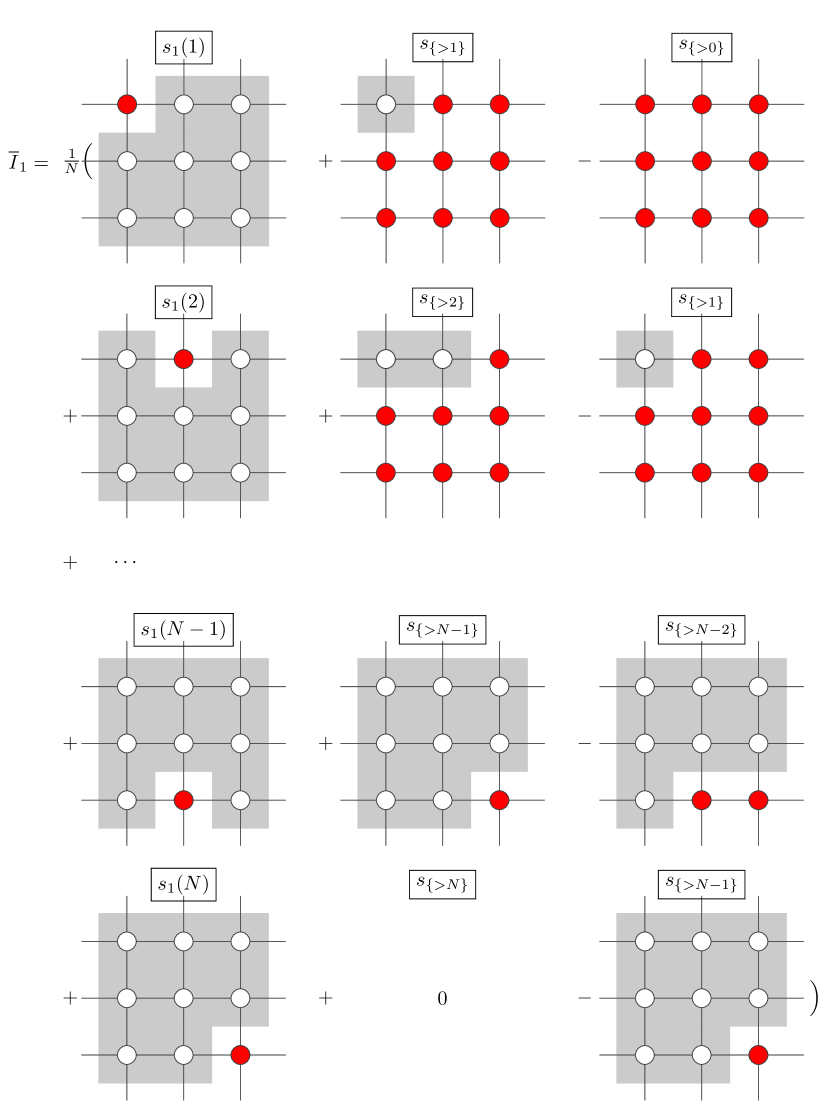
Next we turn to the calculation of the mutual information between a single site and the rest of the lattice. For the site , it is defined as , where is the set of sites with indices greater than (the set means the whole lattice). We previously showed in our work of Refs. Walsh et al. (2019a, b) that further simplifications and comparison with experiments become possible if we consider the mutual information between a single site and the rest of the lattice, averaged over all sites. We called this quantity total mutual information. It is defined as
| (3) |
Fig. 2 illustrates graphically the terms in the sum of Eq. 3. The first line of Fig. 2 is the standard definition of mutual information between the site and the rest of the lattice. The second line is the mutual information between the site and the rest of the lattice, but where the site has been traced over to avoid double counting the correlations between sites 1 and 2. This correlation has already been taken into account in . Note that the last term of the second line cancels the second term in the first line. This pattern repeats and the only terms in Fig. 2 that survive are , where is the thermodynamic entropy per site. In translationally invariant systems all are equal, so simplifies further to the difference of local entropy and thermodynamic entropy, . Since can be obtained using the Gibbs-Duhem relation (see Sec. V) from the knowledge of the occupancy , then also can be readily computed in numerical simulations.
Since mutual information is always positive, the total mutual information is a sum of positive terms. We have then an information-theoretic meaning for this quantity that was first proposed in an experimental context Cocchi et al. (2017).
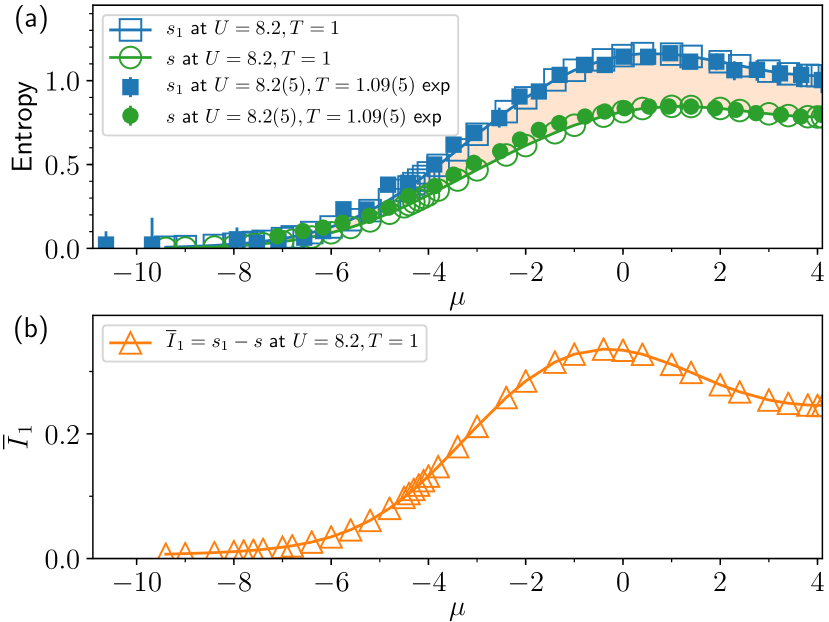
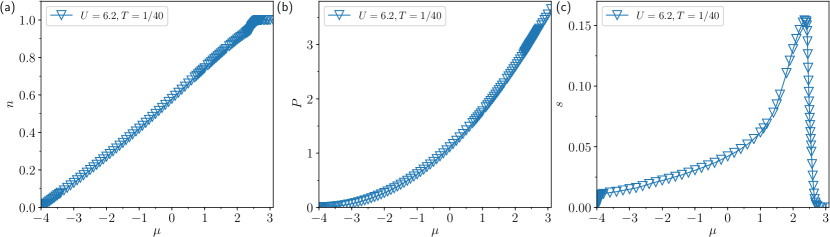
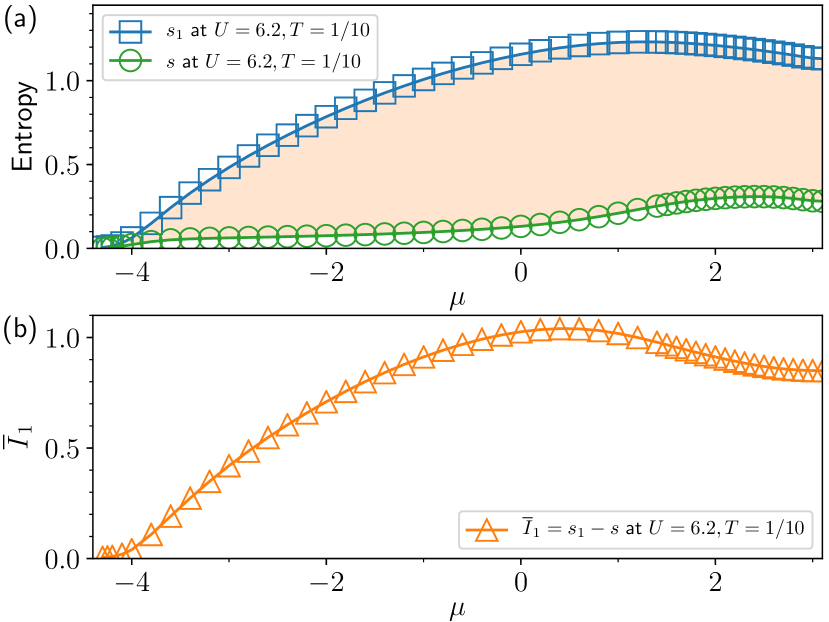
To illustrate our method, in Fig. 3a we compare our CDMFT results for the entropies and with the experimental data of Cocchi et al. Cocchi et al. (2017) using ultracold atoms. The overall agreement is excellent over the whole range of chemical potential . The shaded area indicates the total mutual information , and is shown in Fig. 3b.
III Phase diagram
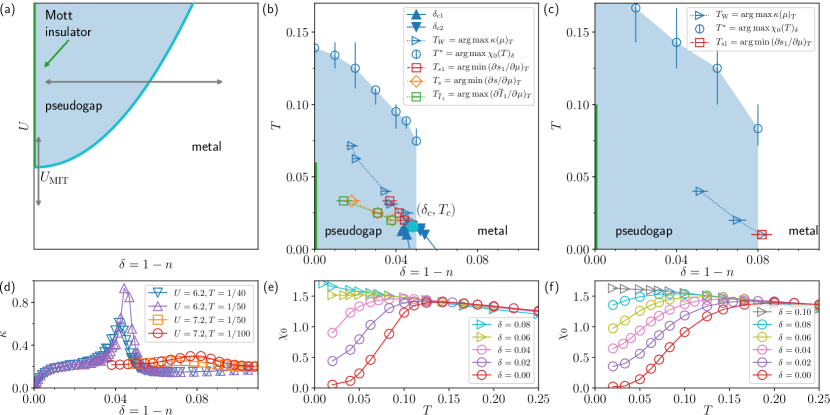
The phase diagram of the two-dimensional Hubbard model is spanned by , (or equivalently, ), and . As a result of intense work Sordi et al. (2010, 2011, 2012), the main thermodynamic features of the plaquette CDMFT solution for the normal state are known. In contrast, the entanglement properties are largely unexplored. Let us briefly review the key thermodynamic features Sordi et al. (2010, 2011, 2012, 2019). As sketched in the low temperature cross-section of Fig. 4a, the system features a first-order phase transition (see thick cyan line) originating at half filling and at a critical interaction and extending to progressively higher doping with increasing Sordi et al. (2010, 2011). The plaquette here constrains antiferromagnetic fluctuations to be short-range, as they would be in a frustrated lattice (Reymbaut et al., 2020).
At and on varying , this phase transition is between a metal and a Mott insulator Walsh et al. (2019b). This is the -driven Mott metal-insulator transition, and is indicated by a vertical double arrow in Fig. 4a. At constant and on varying , this first-order phase transition is between two metallic phases: a strongly correlated pseudogap at low and a correlated metal at high Sordi et al. (2012). These two phases share the same symmetry and are distinguished by their electronic density at the phase transition. Therefore, on varying for larger than the threshold for the Mott transition at , the system undergoes a continuous change between a Mott state and a pseudogap, and an abrupt (first-order) change between a pseudogap and a metal Sordi et al. (2012). With further increasing doping, this metal progressively becomes less correlated, and eventually the system becomes a band insulator at (, i.e. no particles). This sequence of phases realizes the -driven Mott metal-insulator transition, and is indicated by a horizontal double arrow in Fig. 4a.
By adding the temperature axis, the first-order transition line in the phase diagram evolves into a first-order surface in the phase diagram. On increasing , this transition surface is interrupted at a second-order critical line. Beyond this critical temperature, sharp crossovers emerge from the critical line. This is best shown by taking cross-sections of the phase diagram at constant , for , as shown in Figures 4b and 4c, which show our plaquette CDMFT results for and . The system features a first-order transition bounded by spinodal lines and , where the strongly correlated pseudogap and correlated metal disappear respectively. This transition ends in a second-order critical point at . Beyond this, a sharp crossover emerges – this is , the so-called Widom line (shown as open blue triangles). It is defined as the locus of the maxima of the correlation length Xu et al. (2005); McMillan and Stanley (2010); Sordi et al. (2012). Extrema of thermodynamic response functions converge to the Widom line upon asymptotically approaching the endpoint. It has been shown that charge compressibility Sordi et al. (2010, 2011, 2012), thermodynamic and nonlocal density fluctuations Walsh et al. (2019c), and specific heat Sordi et al. (2019) all show anomalous enhancement upon crossing the Widom line. Operationally, we define the Widom line using the doping level at which the isothermal compressibility peaks Sordi et al. (2012), see Fig. 4d.
Note that the second-order critical point moves to progressively larger doping and lower temperature with increasing Sordi et al. (2010, 2011): at it is below the lowest temperature we can access because of the sign problem, but the Widom line is clearly visible. This is where the Widom line proves as a useful indicator: when the endpoint and the underlying first-order transition lie below some inaccessible region, the Widom line is a high temperature predictor of these phenomena. The low temperature region may be inaccessible because the sign problem prevents us from probing low temperatures, but also experimentally it could be inaccessible because ordered phases hide the transition, for example.
The endpoint and the Widom line in the supercritical region have a high temperature precursor, the so-called line (open blue circles), which occurs for only. This crossover can be interpreted as the pseudogap temperature Sordi et al. (2013); Reymbaut et al. (2019). Operationally it can be defined as the loci of the temperatures where, on reducing , the spin susceptibility drops, or -axis resistivity increases Sordi et al. (2013). Since the finite doping first-order transition is continuously connected to the Mott transition at half filling, the pseudogap that arises because of the associated Widom line is a consequence of the Mott transition at half filling.
Overall the phase diagram of the two-dimensional Hubbard model shows many similarities with the phase diagram of hole-doped cuprates Alloul (2014); Sordi et al. (2012, 2019).
In Ref. Walsh et al. (2019a) we showed that the local entropy and total mutual information detect the -driven Mott transition of the half filled model, by showing characteristic inflections as a function of . Now we generalize the study of these entanglement-related properties to the metallic phases at nonzero doping.
IV Local entropy
We shall show that the local entropy defined in Sec. II.2 detects the first-order transition between pseudogap and metal, the second-order endpoint, and the crossover emerging from it.
IV.1 Doping dependence of
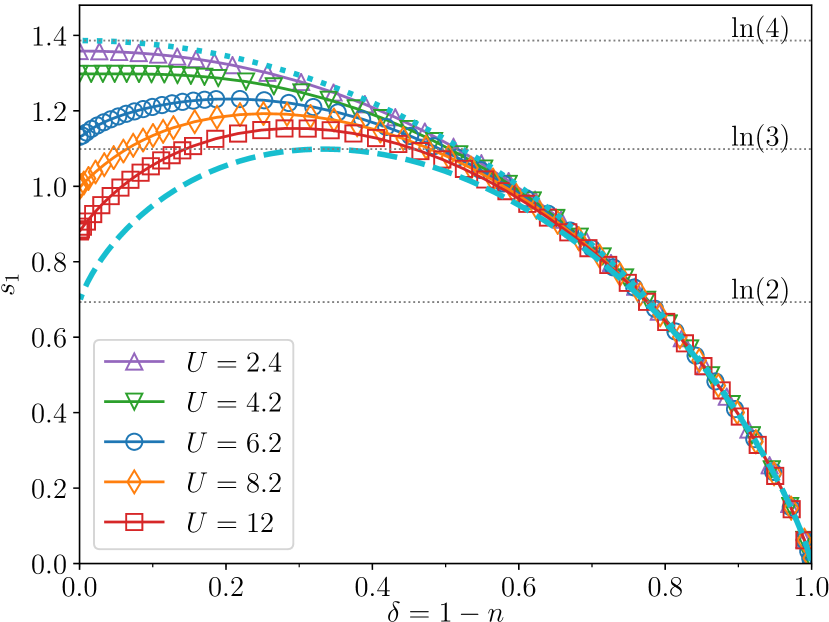
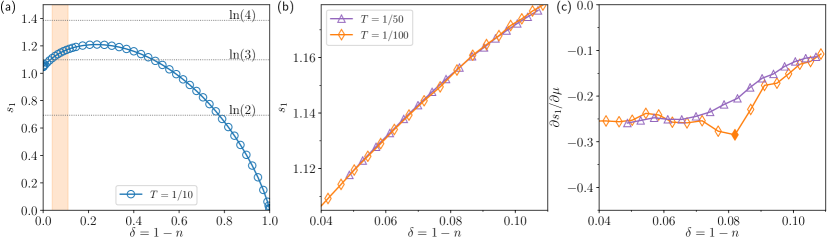
Figure 5 shows the local entropy as a function of for different values of , at the intermediate temperature . To understand the behavior of it is useful to consider the (cyan dotted line) and limits (cyan dashed line).
For , the probability of double occupancy , and thus monotonically decreases with increasing from to . Physically, less states become available with increasing . In information theory language, the uncertainty about the site occupation decreases and hence its entropy decreases.
In contrast, for , and is non-monotonic with . Exactly at half filling, the limit of is . This is the entropy of a free spin. Its value coincides with the entanglement entropy of a singlet. Then increases with increasing doping to , and subsequently decreases to zero. Indeed, suppresses the double occupancy and thus the number of available states on a single site and thus , especially close to the Mott insulator at . In information theory language, the suppression of double occupancy leads to less uncertainty about the site occupation, and hence to a decrease of the local entropy upon approaching .
Therefore the behavior of the CDMFT data for results from the competition between Fermi statistics and Mott localization. For CDMFT data are not very dependent on , suggesting that Fermi statistics dominate at large . At low , for larger than the critical interaction, Mott localization leads to a decrease in with decreasing .
IV.2 detects the first-order transition between strongly correlated pseudogap and correlated metal
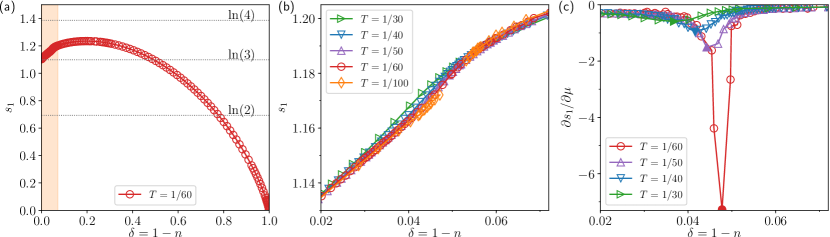
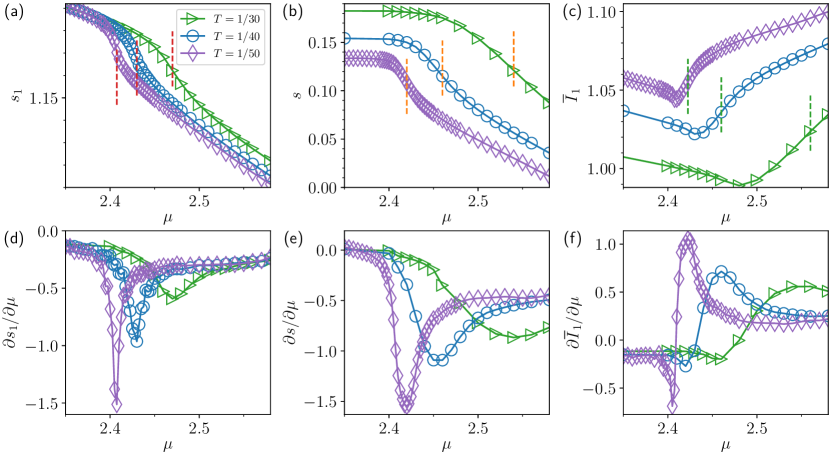
Next we investigate whether the pseudogap to correlated metal transition and its associated crossovers in the thermodynamic properties leave signatures in the local entropy. Figures 6a, b show the local entropy across the pseudogap to correlated metal transition at and for different temperatures –in other words, we are taking fixed cross sections of the phase diagram in Fig. 4b.
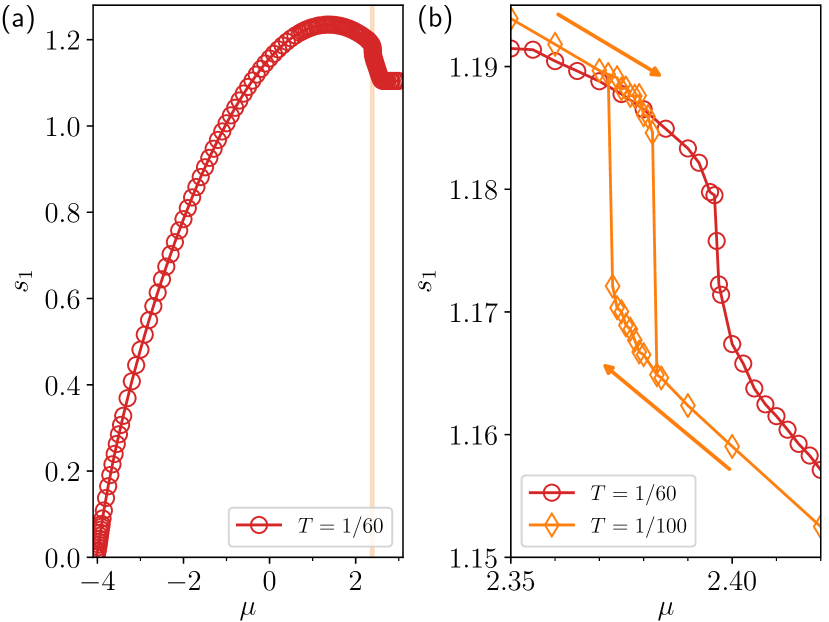
For , the transformation between two correlated metals -a strongly correlated pseudogap and a correlated metal- is first-order, with an abrupt jump in the density Sordi et al. (2010, 2011). This thermodynamic change is imprinted on the local entropy , which is also discontinuous: at the pseudogap disappears, and at the correlated metal disappears. The local entropy shows hysteresis as a function of the chemical potential , as seen in Fig. 12b of Appendix A. We found , since the double occupancy is smaller in the pseudogap (this result about can be obtained from Clausius-Clapeyron equation Sordi et al. (2011)).
Physically, in the strongly correlated pseudogap phase, doped holes (holons) move in a background of short-ranged singlet states caused by the superexchange mechanism. This is shown by the drop in the spin susceptibility (see Figs. 4e, f) and by analyzing the statistical weight of the plaquette eigenstates Haule and Kotliar (2007); Sordi et al. (2011, 2012). At larger doping, in the correlated metal, the carriers are quasiparticles. In summary, the sudden change in the many-body state between two correlated metals is captured by the discontinuous change in the local entropy across the transition.
IV.3 detects the critical endpoint and its Widom line
The first-order transition between two metals ends in a second-order endpoint at , where thermodynamic response functions such as charge compressibility Sordi et al. (2010, 2011, 2012), density fluctuations Walsh et al. (2019c), and specific heat Sordi et al. (2019) diverge. The local entropy detects the endpoint by showing an inflection as a function of with a vertical tangent. This can be understood by writing using the chain rule as a function of , as , where is regular and is singular. The charge compressibility is proportional to and indeed diverges at Sordi et al. (2012); Walsh et al. (2019c), and hence so does .
For , the singular behavior of the thermodynamic response functions is replaced by a sharp crossover, known as the Widom line. This thermodynamic signature also affects the local entropy , which shows inflections versus (that are not visible in versus ). The position of the inflections can be located by taking the derivative of with respect to . Fig. 6c shows as a function of for several above . The peaks narrow and sharpen as from above. This is the distinctive feature of the Widom line (see Figs. 16a, d of Appendix D for and versus ).
The loci of inflections of and of are close and converge at (see filled symbols in Fig. 6c showing the inflection points). Their location is represented as open red squares in the phase diagram of Fig. 4b. Similar results are obtained for (see Fig. 4c for the phase diagram at and Fig. 13 of Appendix A for the parallel to Fig. 6). Hence detects the critical endpoint of the first-order pseudogap-metal transition and its associated Widom line.
V Thermodynamic entropy
The thermodynamic entropy per site is , where is the density matrix. To find , we follow the protocol previously described in Refs. Walsh et al. (2019b); Cocchi et al. (2017). It exploits the Gibbs-Duhem relation
| (4) |
where is the area and the pressure. At constant and , it simplifies to . Therefore we extract by following three steps (as illustrated in Fig. 14 of Appendix B). First we calculate the occupation , then we integrate it over to obtain the pressure :
| (5) |
Finally, by differentiating the pressure with respect to temperature, we extract the thermodynamic entropy .
V.1 Doping dependence and maximum of
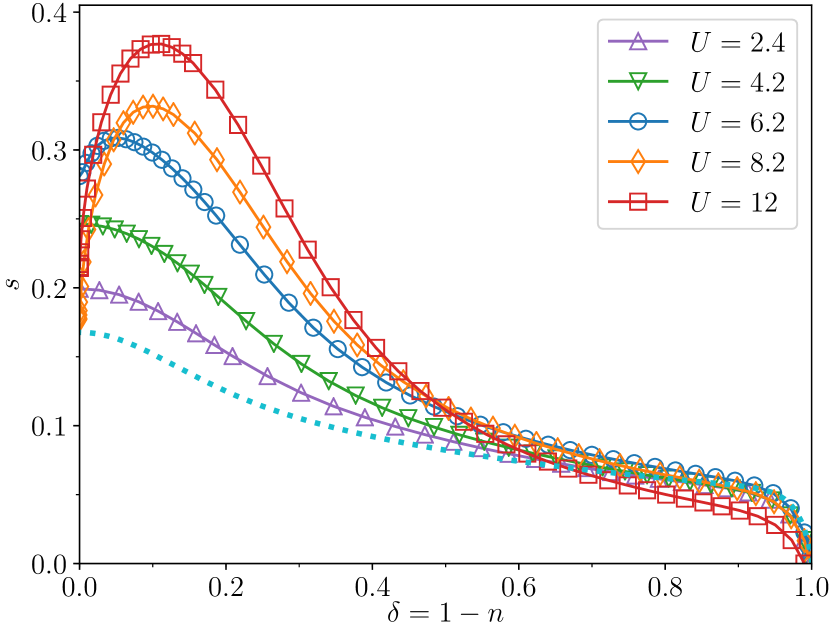
Figure 7 shows the entropy per site as a function of at for several values of . At small , is monotonically decreasing with increasing . In contrast, for large values of (i.e. upon doping the Mott insulator), increases until it reaches a maximum, and then decreases to as (). The increase of with increasing at large is due to the fact that in the Mott insulator charge fluctuations are suppressed and doping releases them, thereby increasing . On the other hand, upon further increasing doping, decreases with increasing doping. This is because the effect of interactions becomes negligible at large doping where the band is almost empty, as can be seen by comparison with the non-interacting case (cyan dotted line). Note that the interactions almost always increase the entropy compared with the non-interacting case. Also, interactions lead to a maximum in entropy in a region of doping where, in cuprates, ordered states are found at low temperature.
Previous work with CDMFT Sordi et al. (2010, 2011); Reymbaut et al. (2019) and other methods (such as the dynamical cluster approximation Mikelsons et al. (2009)) revealed the maximum in , which can also be found via Maxwell relations by the crossing of the isotherms . The maximum is also captured by the atomic limit, and is another manifestation of localisation/delocalisation physics.
V.2 detects the critical endpoint of the first-order transition and its Widom line
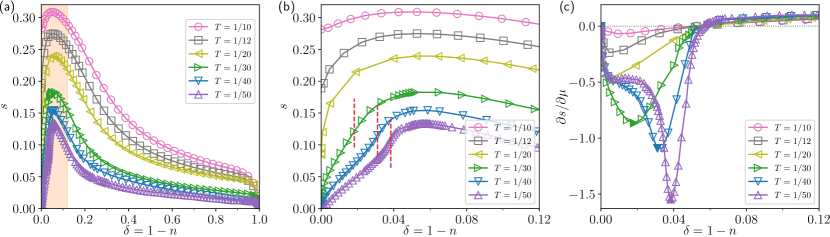
Fig. 8a shows for and different temperatures. Because the procedure of extracting is computationally expensive and both the sign problem and the error propagation in calculating degrade with lowering , we restrict our analysis to only, and for .
As noticed in earlier work Sordi et al. (2011); Reymbaut et al. (2019), the maximum in occurs at a doping larger than the transition . The central feature that we reveal here is the inflection in as a function of (see vertical bar in Fig. 8b), where the entropy shows the largest variation with . To locate the inflections, we perform the numerical derivative of with respect to . Fig. 8c shows the result plotted as a function of . Note that and are shown as functions of in Figs. 16b, e of Appendix D. The position of the inflection in is marked with a dashed vertical line in Fig. 8b as the inflection itself is not visible as a function of doping. The slope becomes steeper on approaching (see curves in Fig. 8c, where the minima become sharper and more negative). Thus we expect that the inflection becomes a vertical slope, hence shows singular behavior.
By tracking the doping level of the inflection point of at different temperatures we obtain a crossover line in the diagram. This crossover is denoted by (orange diamonds in Fig. 4b). Although the precise location of in the diagram is affected by the uncertainty introduced by our method of extracting , the important result we obtain is a crossover which extends into the supercritical region.
V.3 detects the first-order transition between strongly correlated pseudogap and correlated metal
For , the entropy will be discontinuous at the pseudogap to correlated metal transition. Using the Clausius-Clapeyron relation along the first-order transition, Refs. Sordi et al. (2010, 2011) inferred that the entropy of the pseudogap is smaller than that of the correlated metal, . The error propagation prevents us from obtaining below .
VI Total mutual information
Next we turn to the total mutual information between a single site and its environment, which measures classical and quantum correlations. It is simply . Figure 15 of Appendix C illustrates graphically the construction of .
VI.1 Doping dependence of
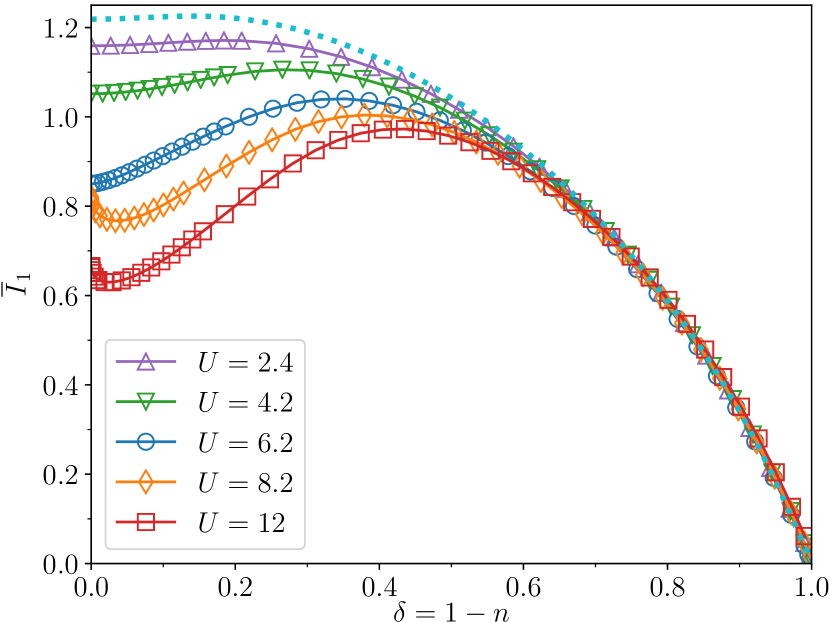
Figure 9 shows as a function of doping for several values of at . For large doping , is governed by , does not depend much on , and decreases with increasing . Physically, this reflects the decrease of quantum and classical correlations on approaching the full insulating hole band, or equivalently the empty electron band at . The dilution leads to a mutual information that does not depend on the interaction .
For , develops a local minimum (at or at finite depending on the interaction ) that occurs from the mismatch between the positions of the peaks in and in . Physically, at large the minimum comes from the competing spin and charge correlations. On the right side of the minimum, charge correlations win because states become more extended, hence the density matrix does not factor in position space, and hence correlations encoded in increase with increasing . In contrast, on the left side of the minimum, spin correlations win over charge correlations. This is because at large the superexchange coupling grows with decreasing , hence increases on approaching the Mott insulator at .
Note that is non-zero in the Mott state at , implying non-zero correlations between a single site and its surroundings Cocchi et al. (2017); Walsh et al. (2019a). Physically, this is due to the superexchange that locks the spins into singlet states.
Note that, again, at large doping the total mutual information returns to its non-interacting value (cyan dotted line). In addition, interactions decrease the total mutual information compared with the non-interacting case because they tend to make many-body states more localized, hence reducing the correlations between a site and its environment.
VI.2 detects the critical endpoint of the first-order transition and its Widom line
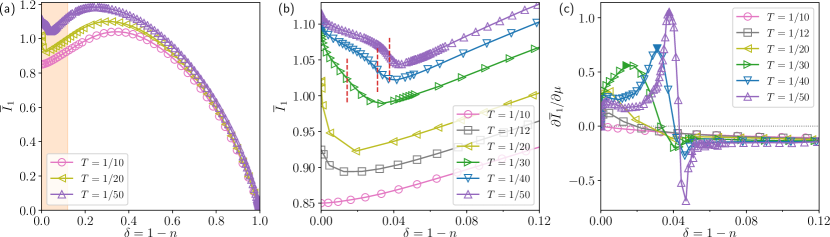
Fig. 10a shows for at different temperatures. Overall, increases with decreasing . Physically, this means that the correlations between a single site and its surroundings increase with decreasing . The temperature dependence is stronger close to the Mott insulator at and weakens at larger , where electrons are more diluted in the lattice. This reveals that superexchange physics comes into play upon lowering close to the Mott state.
Next we turn to the behavior of in the supercritical region emerging from the endpoint at , see Fig. 10b. The position of the local minimum in shifts to higher doping upon approaching the endpoint from above. Between the Mott insulator at and the locus of the minimum, develops an inflection as a function of the chemical potential . The dashed vertical line in Fig. 10b indicates the doping level of the inflection in , as the inflection itself does not occur in . The inflection marks a rapid change of in the vicinity of the endpoint and the Widom line. This rapid variation reflects the slopes in and , characterised by inflections, that become infinite slopes at , as discussed in Fig. 6c and Fig. 8c.
To locate the inflections in , we perform the numerical derivative with respect to – see plotted as a function of in Fig. 10c and as a function of in Fig. 16f of Appendix D. Note that among the different inflections in (or equivalently peaks in ), we have used the one showing the sharpest change in (i.e. the upward peak in Fig. 10c). Although the precise determination of the inflections suffers from the uncertainty in our evaluation of , this choice for the inflection is also consistent with our analysis at half filling in Ref. Walsh et al. (2019a).
Taking into account these limitations, the loci of these inflections marking the sharpest change of at different temperatures define the crossover line in the phase diagram in Fig. 4b (green squares). The loci of infinite slopes in and coincide at the endpoint , so that also has an infinite slope at the endpoint. Therefore detects the pseudogap to correlated metal crossover emerging from the critical endpoint.
For , will be discontinuous. However, since we cannot reliably extract below , we cannot conclude on whether . A hint may come from the study of across the -driven Mott transition as in Ref. Walsh et al. (2019a). At half filling, at the metal to Mott insulator transition we found . Since the pseudogap to metal transition is connected to the -driven Mott transition (see cyan line in the diagram of Fig. 4a), we can speculate that , although further work is needed to investigate this.
VI.3 Comparing the local entropy with and without tunneling to neighboring sites
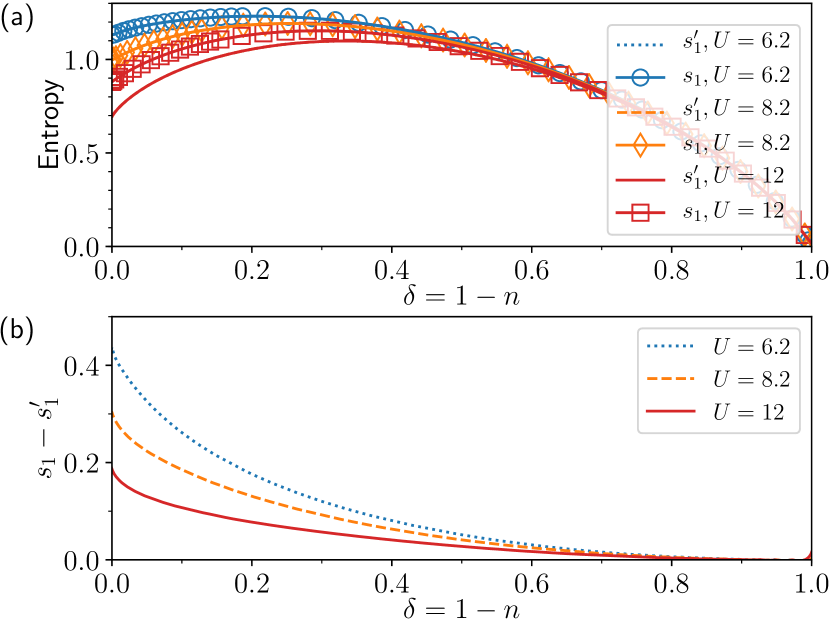
We can compute a different kind of mutual information, by calculating , where is the entropy of an isolated site in the grand canonical ensemble, see Figure 11. An advantage of calculating mutual information in this way is that captures only thermal contributions without any entanglement coming from quantum mechanical tunneling between the site and its neighbors. The vastly different behaviour of the two measures of correlation (cf Fig. 9 and Fig. 11b) demonstrates the importance of quantum mechanical correlations. In particular, note that tunneling is never turned off in the calculations of total mutual information in Fig. 9. That quantity is thus systematically larger than which compares the entropy of a single site with and without tunneling to the neighbors.
VII Conclusions and outlook
Our work brings a quantum information perspective to a central unresolved problem in quantum many-body systems: what is the role of entanglement and classical correlations at a key phase transition in interacting fermions, the doping-driven Mott transition.
Specifically we studied two entanglement-related properties, the local entropy and the total mutual information, in the normal state of the two-dimensional Hubbard model solved with plaquette CDMFT. We considered a wide range of interaction strength, doping, and temperature. This allowed us to reveal a complex interplay of quantum and classical correlations.
We focused on the doping-driven Mott transition that contains a finite- and finite- endpoint between two compressible (metallic) phases: a strongly correlated pseudogap and a correlated metal Sordi et al. (2010, 2011, 2012). Upon doping the Mott insulator, we showed that the local entropy , thermodynamic entropy , and total mutual information all detect the pseudogap to correlated metal transition, its endpoint at finite temperature and finite doping, and its associated Widom line. Discontinuity below evolves into inflections (versus ) with a vertical tangent at and with a decreasing slope for , up in the supercritical region. These sharp variations of correlations across the pseudogap to correlated metal transition indicate a dramatic electronic reorganisation, persisting up to high temperature.
Furthermore, our study provides a simple approach that is generically and immediately applicable to other computational methods, as it requires only the knowledge of the occupation and the double occupation. Our approach could also be generalized to other correlated many-body quantum systems, thereby paving the way for a deeper understanding of the signatures of entanglement and classical correlations in the properties of these systems.
On the quantum information theory side, our work is thus a contribution to the understanding of the behavior of entanglement-related properties across a first-order transition ending in a finite temperature critical endpoint. Probing entanglement at this type of phase transition Knaute and Kämpfer (2017); Walsh et al. (2019a) has received less attention than at transitions across quantum critical points Amico et al. (2008); Anfossi et al. (2005); Amico and Patanè (2007); Larsson and Johannesson (2006, 2005b); Amico and Patanè (2007); Gabbrielli et al. (2018); Frérot and Roscilde (2019) and finite temperature continuous transitions Melko et al. (2010); Singh et al. (2011); Kallin et al. (2011); Wilms et al. (2011, 2012); Iaconis et al. (2013); Wald et al. (2020), although it may have an impact on our understanding of critical behavior of correlated many-body quantum systems.
Indeed, contrary to zero temperature where the study of phase transitions through the lenses of quantum information theory is well developed Amico et al. (2008), at finite temperature the competition of quantum and classical correlations at phase transitions is less clear and remains one of the open challenges in this field and one that is receiving growing attention Gabbrielli et al. (2018); Frérot and Roscilde (2019); Wald et al. (2020); Lu and Grover (2019a, b). Our work contributes to unravelling this challenge. Note that at finite temperature the entanglement entropy is contaminated by thermodynamic entropy, and thus the quantities and in our study cannot separate the quantum and classical contributions. It is of great recent interest to try to separate pure quantum correlations from classical correlations at finite temperature phase transitions Lu and Grover (2019a, b); Wald et al. (2020). In light of the results of our work it would be an interesting open direction to understand this in all three of these regimes (low temperature phase transition, finite temperature endpoint, and crossover in the supercritical region).
Further work is needed to characterise the structure of the entanglement by varying the subsystem size. Here we considered only the entanglement between a single site and the rest of the lattice. Yet, we showed that and are a simple practical probe to characterise electronic phases in the Hubbard model. When the subsystem is larger than one site, one of the difficulties is that the reduced density matrix is no longer diagonal, and thus the procedure described in Sec. II.2 cannot be directly applied. A hint on how to overcome this problem could come from Ref. Udagawa and Motome (2015) where an algorithm is presented to extract the entanglement spectrum with cluster methods. Ref. Yeo and Phillips (2019) provides a scaling of the one-site and two-site entropies close to a Mott transition in a related model.
Going beyond this work and probing the entanglement entropy and the mutual information for different sizes of the subsystem could give new insights on the structure of the entanglement in the Mott insulator, the pseudogap, and the metallic phases. Such characterisation of the distribution of the entanglement could also be done with ultracold atom experiments, for instance see the pioneering results of Ref. Islam et al. (2015) in a Bose Hubbard model.
Our results establish a substantial link between quantum information theory and experiments with cold gases. This is because our results have the advantage that they could be tested with ultracold atom realisations of the two-dimensional fermionic Hubbard model Gross and Bloch (2017). This is an advantage because measurements of entanglement-related properties have often remained elusive because of the lack of experimental probes. Recent groundbreaking experiments with ultracold atoms changed this Islam et al. (2015); Kaufman et al. (2016); Cocchi et al. (2017); Lukin et al. (2019); Brydges et al. (2019). Our work thus provides a theoretical framework and new predictions for such experiments. Specifically, the high-temperature doping dependence of , , and are compatible with the experimental findings of Ref. Cocchi et al. (2017), and could be further explored with current experiments. On the other hand, at lower temperatures, a quantitative comparison may not be possible because some of the low temperature features revealed here may be hidden by long range orders like superconductivity and antiferromagnetism. However moderate frustration can reduce the ordered temperatures, hence qualitative comparison with experiments could be possible Reymbaut et al. (2020).
Finally, we comment on the implication of our analysis for the pseudogap problem in hole-doped cuprates. The driving mechanism of the pseudogap remains a central puzzle Keimer et al. (2015). In the plaquette CDMFT solution of the two-dimensional Hubbard model, the pseudogap originates from Mott physics plus short-range correlations locking electrons into singlets Kyung et al. (2006); Haule and Kotliar (2007); Sordi et al. (2012). Hence the pseudogap to metal transition is a purely electronic transition. Broken symmetry states Zhao et al. (2017) may also occur but they are not necessary for the appearance of a pseudogap at finite temperature.
Our work shows that the electronic rearrangement at the onset of the pseudogap as a function of doping is characterized by sharp variations in the local entropy and total mutual information (discontinuities at low temperatures and inflections at and above the finite-temperature endpoint). Growing research interest is devoted to studying the role of the entanglement close to the pseudogap in cuprates Scheurer et al. (2018); Zaanen (2019); Bagrov et al. (2019). Our findings suggest that changes in the entanglement-related properties - and not ordered phases - could be the key to understanding the finite temperature pseudogap in hole-doped cuprates.
Acknowledgments
This work has been supported by the Natural Sciences and Engineering Research Council of Canada (NSERC) under grants RGPIN-2019-05312, the Canada First Research Excellence Fund and by the Research Chair in the Theory of Quantum Materials. PS work was supported by the U.S. Department of Energy, Office of Science, Basic Energy Sciences as a part of the Computational Materials Science Program. Simulations were performed on computers provided by the Canadian Foundation for Innovation, the Ministère de l’Éducation des Loisirs et du Sport (Québec), Calcul Québec, and Compute Canada.
Appendix A Further analysis of the local entropy
In this appendix, we show further figures of to expand on the behavior discussed in the main text.
Figure 12 shows vs chemical potential for . This figure is a direct parallel of the results of versus in Figure 6 of the main text, where the symbols have the same meaning, but is displayed here as a function of in order to see the hysteresis and inflection.
Figure 13 is the equivalent of Figure 6 of the main text but for . It shows and as a function of doping.
Appendix B Construction of the thermodynamic entropy
In Section V of the main text, we discussed how to extract the pressure and the thermodynamic entropy from the occupation versus curves, using the Gibbs-Duhem relation. In this appendix we illustrate this procedure for and . Figure 14 shows the occupation , the pressure , and the thermodynamic entropy versus for these values.
Appendix C Construction of the total mutual information
In this appendix we show the entropy and total mutual information as a function of in order to show visually how is constructed as the difference between and . This is shown for and in Fig. 15, which complements the set of data shown versus in Figure 10 of the main text. In Figure 3 of the main text, we show a similar figure in which we compare our results at with experimental data obtained at high temperatures.
Appendix D Finding inflections
Inflections in the local entropy , the thermodynamic entropy , and the total mutual information occur as a function of . In Figures 6, 8, and 10 of the main text, we have shown these quantities as a function of doping where the position of the inflection vs is marked with a dashed vertical line. In this appendix, we illustrate these inflections as a function of . Figure 16 shows these quantities along with their numerical derivatives with respect to for and different temperatures.
References
- Cover and Thomas (2006) Thomas M. Cover and Joy A. Thomas, Elements of Information Theory (Wiley Series in Telecommunications and Signal Processing) (Wiley-Interscience, New York, NY, USA, 2006).
- Watrous (2018) John Watrous, The Theory of Quantum Information (Cambridge University Press, 2018).
- Amico et al. (2008) Luigi Amico, Rosario Fazio, Andreas Osterloh, and Vlatko Vedral, “Entanglement in many-body systems,” Rev. Mod. Phys. 80, 517–576 (2008).
- Eisert et al. (2010) J. Eisert, M. Cramer, and M. B. Plenio, “Colloquium: Area laws for the entanglement entropy,” Rev. Mod. Phys. 82, 277–306 (2010).
- Laflorencie (2016) Nicolas Laflorencie, “Quantum entanglement in condensed matter systems,” Physics Reports 646, 1–59 (2016).
- Zeng et al. (2019) B. Zeng, X. Chen, D.-L. Zhou, and X.-G. Wen, Quantum Information Meets Quantum Matter (Springer-Verlag, New York, 2019).
- Wen (2017) Xiao-Gang Wen, “Colloquium: Zoo of quantum-topological phases of matter,” Rev. Mod. Phys. 89, 041004 (2017).
- Islam et al. (2015) Rajibul Islam, Ruichao Ma, Philipp M Preiss, M Eric Tai, Alexander Lukin, Matthew Rispoli, and Markus Greiner, “Measuring entanglement entropy in a quantum many-body system,” Nature 528, 77 (2015).
- Kaufman et al. (2016) Adam M. Kaufman, M. Eric Tai, Alexander Lukin, Matthew Rispoli, Robert Schittko, Philipp M. Preiss, and Markus Greiner, “Quantum thermalization through entanglement in an isolated many-body system,” Science 353, 794–800 (2016).
- Cocchi et al. (2017) E. Cocchi, L. A. Miller, J. H. Drewes, C. F. Chan, D. Pertot, F. Brennecke, and M. Köhl, “Measuring Entropy and Short-Range Correlations in the Two-Dimensional Hubbard Model,” Phys. Rev. X 7, 031025 (2017).
- Lukin et al. (2019) Alexander Lukin, Matthew Rispoli, Robert Schittko, M. Eric Tai, Adam M. Kaufman, Soonwon Choi, Vedika Khemani, Julian Léonard, and Markus Greiner, “Probing entanglement in a many-body–localized system,” Science 364, 256–260 (2019).
- Brydges et al. (2019) Tiff Brydges, Andreas Elben, Petar Jurcevic, Benoît Vermersch, Christine Maier, Ben P. Lanyon, Peter Zoller, Rainer Blatt, and Christian F. Roos, “Probing rényi entanglement entropy via randomized measurements,” Science 364, 260–263 (2019).
- Jaksch and Zoller (2005) D. Jaksch and P. Zoller, “The cold atom hubbard toolbox,” Ann. Phys. 315, 52 (2005).
- Esslinger (2010) Tilman Esslinger, “Fermi-Hubbard Physics with Atoms in an Optical Lattice,” Annual Review of Condensed Matter Physics 1, 129–152 (2010).
- Jordens et al. (2008) Robert Jordens, Niels Strohmaier, Kenneth Gunter, Henning Moritz, and Tilman Esslinger, “A Mott insulator of fermionic atoms in an optical lattice,” Nature 455, 204–207 (2008).
- Schneider et al. (2008) U. Schneider, L. Hackermüller, S. Will, Th. Best, I. Bloch, T. A. Costi, R. W. Helmes, D. Rasch, and A. Rosch, “Metallic and Insulating Phases of Repulsively Interacting Fermions in a 3D Optical Lattice,” Science 322, 1520–1525 (2008).
- Hofrichter et al. (2016) Christian Hofrichter, Luis Riegger, Francesco Scazza, Moritz Höfer, Diogo Rio Fernandes, Immanuel Bloch, and Simon Fölling, “Direct Probing of the Mott Crossover in the Fermi-Hubbard Model,” Phys. Rev. X 6, 021030 (2016).
- Cocchi et al. (2016) Eugenio Cocchi, Luke A. Miller, Jan H. Drewes, Marco Koschorreck, Daniel Pertot, Ferdinand Brennecke, and Michael Köhl, “Equation of State of the Two-Dimensional Hubbard Model,” Phys. Rev. Lett. 116, 175301 (2016).
- Cheuk et al. (2016) Lawrence W. Cheuk, Matthew A. Nichols, Katherine R. Lawrence, Melih Okan, Hao Zhang, Ehsan Khatami, Nandini Trivedi, Thereza Paiva, Marcos Rigol, and Martin W. Zwierlein, “Observation of spatial charge and spin correlations in the 2D Fermi-Hubbard model,” Science 353, 1260–1264 (2016).
- Parsons et al. (2016) Maxwell F. Parsons, Anton Mazurenko, Christie S. Chiu, Geoffrey Ji, Daniel Greif, and Markus Greiner, “Site-resolved measurement of the spin-correlation function in the Fermi-Hubbard model,” Science 353, 1253–1256 (2016).
- Boll et al. (2016) Martin Boll, Timon A. Hilker, Guillaume Salomon, Ahmed Omran, Jacopo Nespolo, Lode Pollet, Immanuel Bloch, and Christian Gross, “Spin- and density-resolved microscopy of antiferromagnetic correlations in Fermi-Hubbard chains,” Science 353, 1257–1260 (2016).
- Drewes et al. (2016) J. H. Drewes, E. Cocchi, L. A. Miller, C. F. Chan, D. Pertot, F. Brennecke, and M. Köhl, “Thermodynamics versus Local Density Fluctuations in the Metal–Mott-Insulator Crossover,” Phys. Rev. Lett. 117, 135301 (2016).
- Drewes et al. (2017) J. H. Drewes, L. A. Miller, E. Cocchi, C. F. Chan, N. Wurz, M. Gall, D. Pertot, F. Brennecke, and M. Köhl, “Antiferromagnetic correlations in two-dimensional fermionic mott-insulating and metallic phases,” Phys. Rev. Lett. 118, 170401 (2017).
- Nichols et al. (2018) Matthew A. Nichols, Lawrence W. Cheuk, Melih Okan, Thomas R. Hartke, Enrique Mendez, T. Senthil, Ehsan Khatami, Hao Zhang, and Martin W. Zwierlein, “Spin transport in a mott insulator of ultracold fermions,” Science (2018), 10.1126/science.aat4387.
- Brown et al. (2019) Peter T. Brown, Debayan Mitra, Elmer Guardado-Sanchez, Reza Nourafkan, Alexis Reymbaut, Charles-David Hébert, Simon Bergeron, A.-M. S. Tremblay, Jure Kokalj, David A. Huse, Peter Schauß, and Waseem S. Bakr, “Bad metallic transport in a cold atom fermi-hubbard system,” Science 363, 379–382 (2019).
- Anderson (1987) P. W. Anderson, “The resonating valence bond state in La2CuO4 and superconductivity,” Science 235, 1196–1198 (1987).
- Walsh et al. (2019a) C. Walsh, P. Sémon, D. Poulin, G. Sordi, and A.-M. S. Tremblay, “Local entanglement entropy and mutual information across the mott transition in the two-dimensional hubbard model,” Phys. Rev. Lett. 122, 067203 (2019a).
- Groisman et al. (2005) Berry Groisman, Sandu Popescu, and Andreas Winter, “Quantum, classical, and total amount of correlations in a quantum state,” Phys. Rev. A 72, 032317 (2005).
- Lee et al. (2006) Patrick A. Lee, Naoto Nagaosa, and Xiao-Gang Wen, “Doping a mott insulator: Physics of high-temperature superconductivity,” Rev. Mod. Phys. 78, 17–85 (2006).
- Tremblay et al. (2006) A.-M. S. Tremblay, B. Kyung, and D. Sénéchal, “Pseudogap and high-temperature superconductivity from weak to strong coupling. Towards a quantitative theory,” Low Temp. Phys. 32, 424 (2006).
- Sordi et al. (2010) G. Sordi, K. Haule, and A.-M. S. Tremblay, “Finite Doping Signatures of the Mott Transition in the Two-Dimensional Hubbard Model,” Phys. Rev. Lett. 104, 226402 (2010).
- Wolf et al. (2008) Michael M. Wolf, Frank Verstraete, Matthew B. Hastings, and J. Ignacio Cirac, “Area laws in quantum systems: Mutual information and correlations,” Phys. Rev. Lett. 100, 070502 (2008).
- Amico and Patanè (2007) L. Amico and D. Patanè, “Entanglement crossover close to a quantum critical point,” EPL (Europhysics Letters) 77, 17001 (2007).
- Melko et al. (2010) Roger G. Melko, Ann B. Kallin, and Matthew B. Hastings, “Finite-size scaling of mutual information in Monte Carlo simulations: Application to the spin- model,” Phys. Rev. B 82, 100409 (2010).
- Singh et al. (2011) Rajiv R. P. Singh, Matthew B. Hastings, Ann B. Kallin, and Roger G. Melko, “Finite-temperature critical behavior of mutual information,” Phys. Rev. Lett. 106, 135701 (2011).
- Kallin et al. (2011) Ann B. Kallin, Matthew B. Hastings, Roger G. Melko, and Rajiv R. P. Singh, “Anomalies in the entanglement properties of the square-lattice Heisenberg model,” Phys. Rev. B 84, 165134 (2011).
- Wilms et al. (2011) Johannes Wilms, Matthias Troyer, and Frank Verstraete, “Mutual information in classical spin models,” Journal of Statistical Mechanics: Theory and Experiment 2011, P10011 (2011).
- Wilms et al. (2012) Johannes Wilms, Julien Vidal, Frank Verstraete, and Sébastien Dusuel, “Finite-temperature mutual information in a simple phase transition,” Journal of Statistical Mechanics: Theory and Experiment 2012, P01023 (2012).
- Iaconis et al. (2013) Jason Iaconis, Stephen Inglis, Ann B. Kallin, and Roger G. Melko, “Detecting classical phase transitions with Renyi mutual information,” Phys. Rev. B 87, 195134 (2013).
- Gabbrielli et al. (2018) Marco Gabbrielli, Augusto Smerzi, and Luca Pezzè, “Multipartite Entanglement at Finite Temperature,” Scientific Reports 8, 15663 (2018).
- Frérot and Roscilde (2019) Irénée Frérot and Tommaso Roscilde, “Reconstructing the quantum critical fan of strongly correlated systems using quantum correlations,” Nature Communications 10, 577 (2019).
- Wald et al. (2020) Sascha Wald, Raúl Arias, and Vincenzo Alba, “Entanglement and classical fluctuations at finite-temperature critical points,” Journal of Statistical Mechanics: Theory and Experiment 2020, 033105 (2020).
- Sordi et al. (2011) G. Sordi, K. Haule, and A.-M. S. Tremblay, “Mott physics and first-order transition between two metals in the normal-state phase diagram of the two-dimensional Hubbard model,” Phys. Rev. B 84, 075161 (2011).
- Sordi et al. (2012) G. Sordi, P. Sémon, K. Haule, and A.-M. S. Tremblay, “Pseudogap temperature as a Widom line in doped Mott insulators,” Sci. Rep. 2, 547 (2012).
- Sordi et al. (2013) G. Sordi, P. Sémon, K. Haule, and A.-M. S. Tremblay, “-axis resistivity, pseudogap, superconductivity, and Widom line in doped Mott insulators ,” Phys. Rev. B 87, 041101 (2013).
- Reymbaut et al. (2019) A. Reymbaut, S. Bergeron, R. Garioud, M. Thénault, M. Charlebois, P. Sémon, and A.-M. S. Tremblay, “Pseudogap, van hove singularity, maximum in entropy, and specific heat for hole-doped mott insulators,” Phys. Rev. Research 1, 023015 (2019).
- Alloul et al. (1989) H. Alloul, T. Ohno, and P. Mendels, “ NMR evidence for a fermi-liquid behavior in ,” Phys. Rev. Lett. 63, 1700–1703 (1989).
- Reymbaut et al. (2020) A. Reymbaut, M. Boulay, L. Fratino, P. Sémon, Wei Wu, G. Sordi, and A. M. S. Tremblay, “Mott transition and high-temperature crossovers at half-filling,” (2020), arXiv:2004.02302 [cond-mat.str-el] .
- Maier et al. (2005) Thomas Maier, Mark Jarrell, Thomas Pruschke, and Matthias H. Hettler, “Quantum cluster theories,” Rev. Mod. Phys. 77, 1027–1080 (2005).
- Kotliar et al. (2006) G. Kotliar, S. Y. Savrasov, K. Haule, V. S. Oudovenko, O. Parcollet, and C. A. Marianetti, “Electronic structure calculations with dynamical mean-field theory,” Rev. Mod. Phys. 78, 865 (2006).
- Georges et al. (1996) Antoine Georges, Gabriel Kotliar, Werner Krauth, and Marcelo J. Rozenberg, “Dynamical mean-field theory of strongly correlated fermion systems and the limit of infinite dimensions,” Rev. Mod. Phys. 68, 13 (1996).
- Gull et al. (2011) Emanuel Gull, Andrew J. Millis, Alexander I. Lichtenstein, Alexey N. Rubtsov, Matthias Troyer, and Philipp Werner, “Continuous-time Monte Carlo methods for quantum impurity models,” Rev. Mod. Phys. 83, 349–404 (2011).
- Sémon et al. (2014) P. Sémon, Chuck-Hou Yee, Kristjan Haule, and A.-M. S. Tremblay, “Lazy skip-lists: An algorithm for fast hybridization-expansion quantum Monte Carlo,” Phys. Rev. B 90, 075149 (2014).
- Walsh et al. (2019b) C. Walsh, P. Sémon, D. Poulin, G. Sordi, and A.-M. S. Tremblay, “Thermodynamic and information-theoretic description of the Mott transition in the two-dimensional Hubbard model,” Phys. Rev. B 99, 075122 (2019b).
- Schäfer et al. (2015) T. Schäfer, F. Geles, D. Rost, G. Rohringer, E. Arrigoni, K. Held, N. Blümer, M. Aichhorn, and A. Toschi, “Fate of the false Mott-Hubbard transition in two dimensions,” Phys. Rev. B 91, 125109 (2015).
- Biroli and Kotliar (2005) G. Biroli and G. Kotliar, “Reply to “comment on ‘cluster methods for strongly correlated electron systems’ ”,” Phys. Rev. B 71, 037102 (2005).
- Schäfer et al. (2020) Thomas Schäfer, Nils Wentzell, Fedor Šimkovic IV, Yuan-Yao He, Cornelia Hille, Marcel Klett, Christian J. Eckhardt, Behnam Arzhang, Viktor Harkov, François-Marie Le Régent, Alfred Kirsch, Yan Wang, Aaram J. Kim, Evgeny Kozik, Evgeny A. Stepanov, Anna Kauch, Sabine Andergassen, Philipp Hansmann, Daniel Rohe, Yuri M. Vilk, James P. F. LeBlanc, Shiwei Zhang, A. M. S. Tremblay, Michel Ferrero, Olivier Parcollet, and Antoine Georges, “Tracking the footprints of spin fluctuations: A multi-method, multi-messenger study of the two-dimensional hubbard model,” (2020), arXiv:2006.10769 [cond-mat.str-el] .
- Fratino et al. (2017) L. Fratino, P. Sémon, M. Charlebois, G. Sordi, and A.-M. S. Tremblay, “Signatures of the Mott transition in the antiferromagnetic state of the two-dimensional Hubbard model,” Phys. Rev. B 95, 235109 (2017).
- LeBlanc et al. (2015) J. P. F. LeBlanc, Andrey E. Antipov, Federico Becca, Ireneusz W. Bulik, Garnet Kin-Lic Chan, Chia-Min Chung, Youjin Deng, Michel Ferrero, Thomas M. Henderson, Carlos A. Jiménez-Hoyos, E. Kozik, Xuan-Wen Liu, Andrew J. Millis, N. V. Prokof’ev, Mingpu Qin, Gustavo E. Scuseria, Hao Shi, B. V. Svistunov, Luca F. Tocchio, I. S. Tupitsyn, Steven R. White, Shiwei Zhang, Bo-Xiao Zheng, Zhenyue Zhu, and Emanuel Gull (Simons Collaboration on the Many-Electron Problem), “Solutions of the Two-Dimensional Hubbard Model: Benchmarks and Results from a Wide Range of Numerical Algorithms,” Phys. Rev. X 5, 041041 (2015).
- Cardy and Herzog (2014) John Cardy and Christopher P. Herzog, “Universal thermal corrections to single interval entanglement entropy for two dimensional conformal field theories,” Phys. Rev. Lett. 112, 171603 (2014).
- Vedral (2004) Vlatko Vedral, “High-temperature macroscopic entanglement,” New Journal of Physics 6, 102 (2004).
- Anders and Vedral (2007) Janet Anders and Vlatko Vedral, “Macroscopic entanglement and phase transitions,” Open Systems & Information Dynamics 14, 1–16 (2007).
- Zanardi (2002) Paolo Zanardi, “Quantum entanglement in fermionic lattices,” Phys. Rev. A 65, 042101 (2002).
- Gu et al. (2004) Shi-Jian Gu, Shu-Sa Deng, You-Quan Li, and Hai-Qing Lin, “Entanglement and Quantum Phase Transition in the Extended Hubbard Model,” Phys. Rev. Lett. 93, 086402 (2004).
- Larsson and Johannesson (2005a) Daniel Larsson and Henrik Johannesson, “Entanglement Scaling in the One-Dimensional Hubbard Model at Criticality,” Phys. Rev. Lett. 95, 196406 (2005a).
- Larsson and Johannesson (2006) Daniel Larsson and Henrik Johannesson, “Single-site entanglement of fermions at a quantum phase transition,” Phys. Rev. A 73, 042320 (2006).
- Anfossi et al. (2005) Alberto Anfossi, Paolo Giorda, Arianna Montorsi, and Fabio Traversa, “Two-Point Versus Multipartite Entanglement in Quantum Phase Transitions,” Phys. Rev. Lett. 95, 056402 (2005).
- Anfossi et al. (2007) Alberto Anfossi, Paolo Giorda, and Arianna Montorsi, “Entanglement in extended Hubbard models and quantum phase transitions,” Phys. Rev. B 75, 165106 (2007).
- Byczuk et al. (2012) Krzysztof Byczuk, Jan Kuneš, Walter Hofstetter, and Dieter Vollhardt, “Quantification of correlations in quantum many-particle systems,” Phys. Rev. Lett. 108, 087004 (2012).
- Lanatà et al. (2014) Nicola Lanatà, Hugo U. R. Strand, Yongxin Yao, and Gabriel Kotliar, “Principle of maximum entanglement entropy and local physics of strongly correlated materials,” Phys. Rev. Lett. 113, 036402 (2014).
- Udagawa and Motome (2015) Masafumi Udagawa and Yukitoshi Motome, “Entanglement spectrum in cluster dynamical mean-field theory,” Journal of Statistical Mechanics: Theory and Experiment 2015, P01016 (2015).
- Bakr et al. (2009) Waseem S. Bakr, Jonathon I. Gillen, Amy Peng, Simon Fölling, and Markus Greiner, “A quantum gas microscope for detecting single atoms in a Hubbard-regime optical lattice,” Nature (London) 462, 74–77 (2009).
- Sherson et al. (2010) Jacob F. Sherson, Christof Weitenberg, Manuel Endres, Marc Cheneau, Immanuel Bloch, and Stefan Kuhr, “Single-atom-resolved fluorescence imaging of an atomic Mott insulator,” Nature (London) 467, 68–72 (2010).
- Cheuk et al. (2015) Lawrence W. Cheuk, Matthew A. Nichols, Melih Okan, Thomas Gersdorf, Vinay V. Ramasesh, Waseem S. Bakr, Thomas Lompe, and Martin W. Zwierlein, “Quantum-gas microscope for fermionic atoms,” Phys. Rev. Lett. 114, 193001 (2015).
- Haller et al. (2015) Elmar Haller, James Hudson, Andrew Kelly, Dylan A. Cotta, Bruno Peaudecerf, Graham D. Bruce, and Stefan Kuhr, “Single-atom imaging of fermions in a quantum-gas microscope,” Nature Physics 11, 738–742 (2015).
- Parsons et al. (2015) Maxwell F. Parsons, Florian Huber, Anton Mazurenko, Christie S. Chiu, Widagdo Setiawan, Katherine Wooley-Brown, Sebastian Blatt, and Markus Greiner, “Site-resolved imaging of fermionic in an optical lattice,” Phys. Rev. Lett. 114, 213002 (2015).
- Omran et al. (2015) Ahmed Omran, Martin Boll, Timon A. Hilker, Katharina Kleinlein, Guillaume Salomon, Immanuel Bloch, and Christian Gross, “Microscopic observation of pauli blocking in degenerate fermionic lattice gases,” Phys. Rev. Lett. 115, 263001 (2015).
- Edge et al. (2015) G. J. A. Edge, R. Anderson, D. Jervis, D. C. McKay, R. Day, S. Trotzky, and J. H. Thywissen, “Imaging and addressing of individual fermionic atoms in an optical lattice,” Phys. Rev. A 92, 063406 (2015).
- Gross and Bloch (2017) Christian Gross and Immanuel Bloch, “Quantum simulations with ultracold atoms in optical lattices,” Science 357, 995–1001 (2017).
- Hartke et al. (2020) Thomas Hartke, Botond Oreg, Ningyuan Jia, and Martin Zwierlein, “Measuring total density correlations in a fermi-hubbard gas via bilayer microscopy,” (2020), arXiv:2003.11669 [cond-mat.quant-gas] .
- Sordi et al. (2019) G. Sordi, C. Walsh, P. Sémon, and A.-M. S. Tremblay, “Specific heat maximum as a signature of mott physics in the two-dimensional hubbard model,” Phys. Rev. B 100, 121105 (2019).
- Xu et al. (2005) Limei Xu, Pradeep Kumar, S. V. Buldyrev, S.-H. Chen, P. H. Poole, F. Sciortino, and H. E. Stanley, “Relation between the Widom line and the dynamic crossover in systems with a liquid liquid phase transition,” Proc. Natl. Acad. Sci. USA 102, 16558–16562 (2005).
- McMillan and Stanley (2010) Paul F. McMillan and H. Eugene Stanley, “Fluid phases: Going supercritical,” Nat Phys 6, 479–480 (2010).
- Walsh et al. (2019c) C. Walsh, P. Sémon, G. Sordi, and A.-M. S. Tremblay, “Critical opalescence across the doping-driven mott transition in optical lattices of ultracold atoms,” Phys. Rev. B 99, 165151 (2019c).
- Alloul (2014) Henri Alloul, “What is the simplest model that captures the basic experimental facts of the physics of underdoped cuprates?” Comptes Rendus Physique 15, 519 – 524 (2014).
- Haule and Kotliar (2007) Kristjan Haule and Gabriel Kotliar, “Strongly correlated superconductivity: A plaquette dynamical mean-field theory study,” Phys. Rev. B 76, 104509 (2007).
- Mikelsons et al. (2009) K. Mikelsons, E. Khatami, D. Galanakis, A. Macridin, J. Moreno, and M. Jarrell, “Thermodynamics of the quantum critical point at finite doping in the two-dimensional hubbard model studied via the dynamical cluster approximation,” Phys. Rev. B 80, 140505 (2009).
- Knaute and Kämpfer (2017) J. Knaute and B. Kämpfer, “Holographic entanglement entropy in the qcd phase diagram with a critical point,” Phys. Rev. D 96, 106003 (2017).
- Larsson and Johannesson (2005b) Daniel Larsson and Henrik Johannesson, “Entanglement Scaling in the One-Dimensional Hubbard Model at Criticality,” Phys. Rev. Lett. 95, 196406 (2005b).
- Lu and Grover (2019a) Tsung-Cheng Lu and Tarun Grover, “Singularity in entanglement negativity across finite-temperature phase transitions,” Phys. Rev. B 99, 075157 (2019a).
- Lu and Grover (2019b) Tsung-Cheng Lu and Tarun Grover, “Structure of quantum entanglement at a finite temperature critical point,” (2019b), arXiv:1907.01569 [cond-mat.str-el] .
- Yeo and Phillips (2019) Luke Yeo and Philip W. Phillips, “Local entropies across the mott transition in an exactly solvable model,” Phys. Rev. D 99, 094030 (2019).
- Keimer et al. (2015) B. Keimer, S. A. Kivelson, M. R. Norman, S. Uchida, and J. Zaanen, “From quantum matter to high-temperature superconductivity in copper oxides,” Nature 518, 179–186 (2015).
- Kyung et al. (2006) B. Kyung, S. S. Kancharla, D. Sénéchal, A.-M. S. Tremblay, M. Civelli, and G. Kotliar, “Pseudogap induced by short-range spin correlations in a doped Mott insulator,” Phys. Rev. B 73, 165114 (2006).
- Zhao et al. (2017) L. Zhao, C. A. Belvin, R. Liang, D. A. Bonn, W. N. Hardy, N. P. Armitage, and D. Hsieh, “A global inversion-symmetry-broken phase inside the pseudogap region of YBa2Cu3Oy,” Nature Physics 13, 250–254 (2017).
- Scheurer et al. (2018) Mathias S. Scheurer, Shubhayu Chatterjee, Wei Wu, Michel Ferrero, Antoine Georges, and Subir Sachdev, “Topological order in the pseudogap metal,” Proceedings of the National Academy of Sciences 115, E3665–E3672 (2018).
- Zaanen (2019) Jan Zaanen, “Planckian dissipation, minimal viscosity and the transport in cuprate strange metals,” SciPost Phys. 6, 61 (2019).
- Bagrov et al. (2019) Andrey A. Bagrov, Mikhail Danilov, Sergey Brener, Malte Harland, Alexander I. Lichtenstein, and Mikhail I. Katsnelson, “Detecting quantum critical points in the fermi-hubbard model via complex network theory,” (2019), arXiv:1904.11463 [cond-mat.str-el] .