Mathematical model for the thermal enhancement of radiation response: Thermodynamic approach
Abstract
Radiotherapy can effectively kill malignant cells, but the doses required to cure cancer patients may inflict severe collateral damage to adjacent healthy tissues. Hyperthermia (HT) is a promising option to improve the outcome of radiation treatment (RT) and is increasingly applied in hospital. However, the synergistic effect of simultaneous thermoradiotherapy is not well understood yet, while its mathematical modelling is essential for treatment planning. To better understand this synergy, we propose a theoretical model in which the thermal enhancement ratio (TER) is explained by the fraction of cells being radiosensitised by the infliction of sublethal damage through mild HT. Further damage finally kills the cell or inhibits its proliferation in a non-reversible process. We suggest the TER to be proportional to the energy invested in the sensitisation, which is modelled as a simple rate process. Assuming protein denaturation as the main driver of HT-induced sublethal damage and considering the temperature dependence of the heat capacity of cellular proteins, the sensitisation rates were found to depend exponentially on temperature; in agreement with previous empirical observations. Our predictions well reproduce experimental data from in-vitro and in-vivo studies, explaining the thermal modulation of cellular radioresponse for simultaneous thermoradiotherapy.
*am.de259@uniandes.edu.co
I Introduction
Despite considerable efforts for decades towards the improvement of early diagnosis and therapy, cancer has remained a serious global health problem, with 18.1 million new cases and 9.6 million cancer deaths reported worldwide, just in 2018 Bray et al. (2018). Since the 1980s, mild hyperthermia (heating tumour tissue to 40.0 - 42.5 ∘C for 1 h) is known to enhance the therapeutic outcomes in cancer patients, when combined with radio-, chemo- and/or immunotherapy Yagawa et al. (2017); Cheng et al. (2019). Technological improvements in precise medical heating, imaging and non-invasive thermometry over the past decade have revived hyperthermia treatment (HT) as a precision cancer therapy Paulides et al. (2016); Cheng et al. (2019); Kang et al. (2020); Soares et al. (2011), particularly when used in simultaneous combination with ionizing radiation Moros et al. (2010); Oberacker et al. (2017); Kosterev et al. (2015). The number of ongoing HT clinical trials, either alone or in combination with different treatment modalities, evidences the increasing use of therapeutic HT (467 still ongoing clinical trials out of 1198 since 2000) CT . Radiotherapy (RT) is supposedly a curative treatment modality, but the radiation dose required to eradicate all cancer cell subpopulations in a tumour can often not be applied due to severe acute or long-term side effects, which include radiation-induced tissue fibrosis and second malignancies Dracham et al. (2018). Hyperthermia is known to be one of the most potent radiosensitisers Mei et al. (2020); Overgaard (2013); Elming et al. (2019); Datta et al. (2014); Datta and Bodis (2019a), meaning that less radiation is required to achieve the same local tumour cell kill, thereby reducing the adverse effects of radiation in the adjacent normal tissues e.g. van der Zee (2002); Datta et al. (2016a); Hurwitz et al. (2011); Datta et al. (2016b); Bakker et al. (2019).
The efficiency of combined HT+RT treatment clearly depends on the scheduled sequence of the two types of treatment and the time interval between them; best outcome for the patient is expected from a simultaneous application van Leeuwen et al. (2017, 2018a); Overgaard (2013, 1980). However, several theoretical and practical problems still need to be overcome to implement simultaneous HT+RT approaches in routine clinical practice worldwide Spirou et al. (2018). Indeed, in practical terms simultaneous treatment has remained challenging because spatially precise hyperthermia delivery is required to avoid unspecific synergistic, cytotoxic effects of HT+RT on the surrounding normal tissue, which would critically limit
the therapeutic benefit. Current standard clinical equipment is still not well-suited for such simultaneous and precise thermoradiotherapy. Accordingly there are only a few reports/completed trials, in which both forms of radiation were concomitantly applied in patients Peeken et al. (2017); Datta et al. (2015); Varma et al. (2012); Moros et al. (2010); Myerson et al. (1999). From the theoretical perspective, mathematical models to predict the therapeutic outcome of various combinatorial treatment schemes are essential for a better understanding of the synergistic potential and therapeutic window of the two sources of energy (HT and RT), and are highly relevant to the design of adequate and individualized treatment planning in the clinical setting Datta and Bodis (2019b); Crezee et al. (2016).
Several mathematical models for individual RT and HT have been proposed, but there is poor consensus when it comes to the efficacy of combined treatment regimes. For RT, the LQ-model is the most extensively used approach to predict the effect of irradiation on cell populations Bodgi et al. (2016); Joiner and van der
Kogel (2009). This model describes the surviving fraction of cells as a function of the applied radiation dose by means of two main variables, called “radiological parameters” and Joiner and van der
Kogel (2009). In the context of radiobiology, “survival” means the conservation of the cell’s proliferative capacity Zaider and Hanin (2011) (see definitions box). Regarding HT, there is considerable literature describing the impact of heat on different cellular components Lepock (2005); Lepock et al. (1993); Grimm et al. (2009); Kampinga and Dikomey (2001), and several models are aimed to predict the survival of cells under HT treatments Pearce (2013); Jung (1991). For thermal-radiosensitisation using temperatures of 40-46 ∘C, there is a general agreement on a relevant role of DNA repair impairment by heat-induced protein denaturation in the processes of radiosensitisation between 40-46 ∘C Mei et al. (2020); Kampinga and Dikomey (2001); Lepock (2005); Bodgi et al. (2016); Lepock et al. (1993); Oei et al. (2015). The majority of previous approaches to model the combined efficacy of hyperthermia and radiation on mammalian cells have implemented the thermal effects in the LQ-model by proposing empirical temperature dependencies for the radiological parameters Brüningk et al. (2018a, b); van Leeuwen et al. (2018b), but the physical principles and the detailed mechanisms underlying this empirical dose-lowering concept are still elusive Oei et al. (2015). The link between modelling concepts and plausible mechanistic explanations still needs to be established to serve as a more reliable framework for predictions.
Here, we propose a survival model for the simultaneous application of HT and RT that provides insights from a thermodynamic perspective. In our model, the modulation of the radiological parameters arises directly from the definition of the thermal enhancement ratio (TER). It compares the radiation dose required to achieve a specific endpoint with ionizing radiation alone (), e.g. surviving fraction of cells or tumour control probability, and the radiation dose required to achieve the same endpoint in combination with hyperthermia () Gillette (1984). We propose the enhancement to be a rate limiting process, proportional to the energy invested in sensitising a cell to die. Our approach presents a theoretical basis to understand how hyperthermia results in radiosensitisation, a process that depends on treatment time and temperature. Our findings are consistent with previous experimental studies in the range of RT combined with mild hyperthermia.
II Results and discussion:
Mathematical model for the outcome of simultaneous HT+RT
In the following we describe our theoretical model and its correspondence with different types of experimental data in the range of mild HT derived from mammalian cell models. Numerous in-vitro and in-vivo studies reveal the successful and promising combinatorial application of HT and RT for anticancer treatment (see e.g. Refs Franken et al. (2013); Peeken et al. (2017); Datta et al. (2015)). However, the majority of the documented data is quite limited or incomplete and thus insufficient to test our model. To this end, we chose three rather dated seminal studies because, to our knowledge, they are the only ones which compile complete sets of thermal enhancement ratios, systematically obtained for several temperatures or treatment times in the HT regime. Two of these data sets were collected in course of in-vitro 2D culture experiments using Chinese hamster ovary (CHO) Dikomey and Jung (1991) and murine mammary carcinoma (M8013) cells Havemann et al. (1987), respectively. Another set of data comes from an animal study with C3H murine mammary carcinoma xenografts Overgaard (1980).
II.1 Hyperthermia affects the radiation dose-response curve
The LQ-model for radiotherapy predicts the surviving fraction of cells as an exponential function of the radiation dose, Joiner and van der
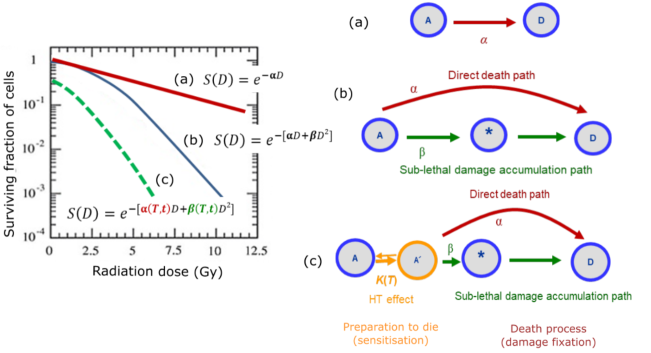
Kogel (2009). When HT is applied in combination with RT the parameters and are modulated by both the temperature , and the application time of heat Franken et al. (2013); Havemann et al. (1987); Kok et al. (2014); Myerson et al. (2004). As a result, the sensitivity of cells to RT is increased and the radiation dose required to produce the same surviving fraction is lower. HT affects the survival probability curves in three ways: 1. the curves are shifted down as a consequence of cell killing from HT itself (offset at ), 2. there is a steeper initial slope (), and 3. the shoulder of the curve () is changed as illustrated in Fig.1. In this work, the term “cell kill” is defined as the complete loss of proliferative capacity of a cell, regardless its membrane integrity.
The most accepted hypothesis for the radiosensitising effect of HT assumes the heat-induced denaturation of repair proteins impairs the DNA repair process upon irradiation Mei et al. (2020); Bodgi et al. (2016); Oei et al. (2015). In the LQ-model hyperthermia mainly affects , which is supposedly related to repairable DNA single-strand breaks (SSB), and the HT-induced sensitisation is generally associated with inhibition of DNA repair Datta and Bodis (2019b). Nevertheless, this description is incomplete because the change in is not negligible. Given that is not exclusively related to pairs of SSB but also to clusters of DNA lesions Joiner and van der
Kogel (2009), we propose to differentiate between repairable and sublethal DNA damage, which are not necessarily the same. We suggest to extend the hypothesis of repair inhibition to a more general explanation based on sublethal damage accumulation (whether reversible or not), to better understand the synergy between radiation and thermal energy when applied to biological tissue.
II.2 Modulation of and by HT as a function of TER
A portion of the thermal energy of HT goes into direct cell killing and another portion into radiosensitisation. For HT used for combinatorial therapy (40-46 C) only a minor fraction relates to direct cell-killing.
We therefore propose that the radiosensitising portion of the energy is invested in the accumulation of sublethal damage, facilitating radiation-induced cell death. In our model hyperthermia causes the cells to advance from an original undamaged state (A) to a more damaged state (A’) in the sequence of sublethal damage (SLD) accumulation, as is illustrated in Fig. 1(c). Starting from (A’) instead of (A), the radiation energy required to produce lethal and sublethal transitions is reduced, and hence, and are effectively rescaled to and . Further, we assume that this modulation comes directly from the definition of the TER, in such a way that the new parameter ( and ) become treatment-time and temperature dependent (see Methods section for details)
| (1) | ||||
| (2) |
II.3 Thermodynamic basis of TER
TER is expected to be proportional to the thermal energy absorbed by the cell, which is invested in the transition from (A) to (A’) (transition towards ’dead state’). We propose this energy to increase linearly with the time of heat exposure , and with the rate of energy absorption . In a simplified version of the SLD accumulation induced by hyperthermia, the step from (A) to (A’) is represented by a single rate process, with a net rate of transition (proportional to the rate of energy absorption) as depicted in Fig. 1(c) and expressed by
| (3) |
Here, is the onset of the thermal enhancement ratio, which should converge to one for no HT treatment (); is a parameter that accounts for the tumour size (or the amount of malignant cells) and the intrinsic sensitivity of the cells to RT and HT, and is the temperature-dependent rate of the sensitisation process. Based on the thermodynamics of protein denaturation, we found the transition rate of this process to increase exponentially with increasing temperature (see methods section for details of the model). Such exponential behavior with has been observed in previous works, but could not be explained Brüningk et al. (2018a); Overgaard (1984); Havemann et al. (1987). In this equation, and are cell-type dependent parameters and is the dominant transition temperature, i.e. the average melting point of cellular proteins undergoing denaturation. We achieve this theoretical prediction by considering the change of the heat capacity of the proteins as a linear function of the temperature, and not as a constant value as usually assumed in Arrhenius kinetics. The heat capacity of cellular proteins displays a Lorentzian-type function of the temperature Lepock (2005); Lepock et al. (1993), which can be approximated at first order as linear functions in the vicinity of the melting point Prabhu and Sharp (2005); Atkins and de Paula (2006). Remarkably, the melting point in both cases has good correspondence to the calorimetry studies performed by Lepock and collaborators Lepock (2005); Lepock et al. (1993) where they found the melting point in the mild-hyperthermia treatment to be in the range of C for different mammalian cells. Plugging the obtained transition rate into Eq.3, the TER reads
| (4) |
with for simplicity. This model predicts exponential increase of and with temperature, which is much more pronounced for . These predictions are consistent with experimental results in cell cultures Dikomey and Jung (1991); Havemann et al. (1987), and data from human clinical trials Datta and Bodis (2019b); Franken et al. (2013).
Radiosensitising effects are also reflected and quantified by reductions in the ratio, which is basically higher for intrinsically more radioresistant cells Joiner and van der
Kogel (2009); Datta and Bodis (2019b). For the combined RT+HT scheme the ratio is reduced as a consequence of the enhancement of the sublethal damage over the direct damage. The ratio for the combined treatment then reads .
II.4 Predictions of experimental data from literature
We tested the performance of our model (Eq.4) on three experimental data sets that document thermal enhancement values in simultaneous HT+RT treatments for different temperatures. In two of them TER was measured for different treatment times and temperatures, and the third data set presents and values obtained for various temperatures but just one treatment time.
Thermal enhancement ratio: The first data set was recorded in in-vitro 2D cell culture experiments (CHO cell line) Dikomey and Jung (1991), and the second one derived from an in-vivo animal study (C3H mammary carcinoma tumour xenograft mouse model) Overgaard (1980). For both datasets we found that our model well predicts the outcome of these studies. As shown in Fig.2(a) and Fig.2(c), both datasets display a linear dependency of the TER with treatment time for all tested temperatures, indicating a rate-dependent behaviour of the function. The slope of each linear function is proportional to a temperature-dependent rate, matching the exponential fit shown in Fig.2(b) and Fig.2(d) respectively. The parameters and the respective coefficients of determination are summarized in Table 1 for both examples.
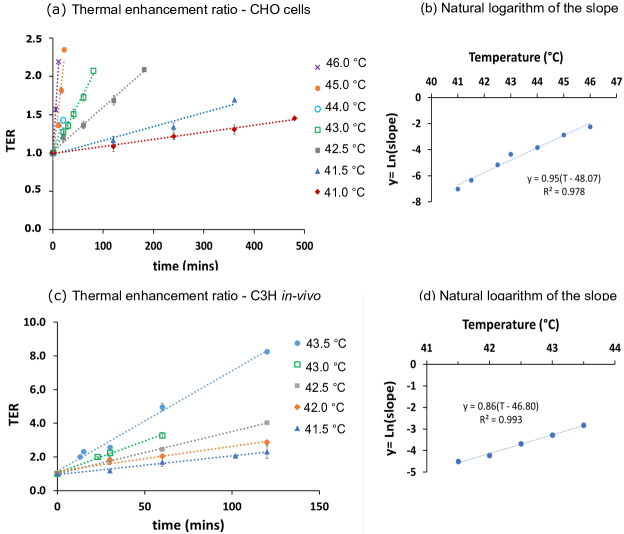
| Cell model | o | [∘C] | |||
|---|---|---|---|---|---|
| CHO (in vitro) | 0.97 | 1.00 | 0.95 | 48.07 | 0.978 |
| C3H (in vivo) | 1.07 | 1.00 | 0.86 | 46.80 | 0.993 |
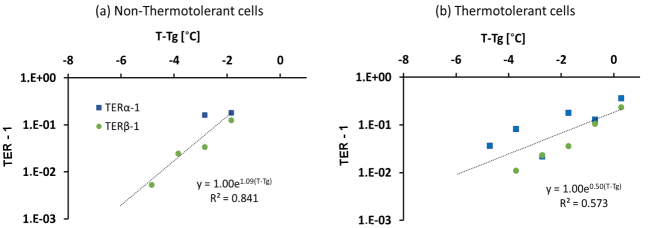
Thermal modulation of and : The third data set was documented in cultured M8013 murine mammary carcinoma cells Havemann et al. (1987). In this study, the normal (non-thermotolerant) cell-line was compared with a thermotolerant modification. The authors determined the radiobiological parameters and for cells irradiated halfway through a 30 min hyperthermia treatment (temperatures from 42 ∘C to 47 ∘C). In this case, we calculated the thermal enhancement of and from Eqs. 1 and 2 to test our model:
| (5) |
Here, and are the radiobiological parameters without HT. To assess the behaviour of the temperature-dependent rate , we calculated for every data point to compare with the result of eq. 4, which was rearranged for this purpose as follows:
| (6) |
The results shown in Fig.3 display an exponential dependency of with temperature in both cases - as predicted by our model. The model parameters (, , ) and the coefficients of determination are presented in Table 2. Notably, the melting temperatures are quite similar for the two sublines, but the main difference comes from the slope of the calorimetry function , reflecting a possible slower denaturation of cellular proteins in the thermotolerant subline in response to heat. The parameters were adjusted for all TER values obtained from Eqs. 5. However, it must be noted that the authors of this study reported problematic deviations in the measurements of Havemann et al. (1987), which may explain the low coefficients of determination shown in Table 2. When the adjustment is made using only the experimental points, it improves to = 0.986 and 0.951 for thermotolerant and non-thermotolerant M8013-cells, respectively.
| Cell model | [∘C] | |||
|---|---|---|---|---|
| M8013 Thermotolerant | 1.00 | 0.50 | 46.34 | 0.573 |
| M8013 Non-thermotolerant | 1.00 | 1.09 | 46.47 | 0.841 |
We must stress that this linear model is valid in the regime of non-ablative HT (40-46 ∘C), which is used for radiosensitisation purposes at which heat-induced damage is primarily sublethal Lepock et al. (1993); Jung (1991).
As can be seen in Tables 1 and 2, the parameter related to the number of cells () is set to one for all the tumour cell models. Doing so, one could speculate that the slope in equation 4 is completely modelled by the exponential factor which is solely a function of the thermodynamic quantities describing the heat capacity, namely the melting point and the slope of the calorimetry peak. Remarkably, this calorimetry peak is also very similar for the three non-thermotolerant tumour cell models, but lower for the thermotolerant one. This result may indicate the calorimetry peak as a possible marker for cellular thermotolerance. Moreover, we obtained different melting points for CHO (in-vitro), M8013 (in-vitro), and C3H (in-vivo), which are in the range of 46-49 ∘C. This result is consistent with the findings from Lepock and collaborators that show different melting points for distinct cell types Lepock et al. (1993) in that temperature range. This should be verified by meticulous future experimental work. Calorimetry assays together with systematic TER measurements in various tumour cell models will be particularly relevant in this context, and can lead to a considerable reduction in the number of adjustable parameters. Nonetheless, our model already quite well predicts and explains from thermodynamic principles the modulation of radioresponse caused by HT treatment with at most three adjustable parameters.
III Conclusions and perspectives
In this work, we have proposed the enhancement of radiotherapy by hyperthermia as the result of the increased vulnerability of a cell. It is achieved by the accumulation of sublethal damage either repairable or not. In our model, the radiosensitisation, quantified by TER, is proportional to the energy invested to induce this damage. We propose that in the range of mild HT, this energy and therefore the synergistic effect measured by TER, is a rate-dependent process that increases linearly with the time of heat application. We found the rate of the process to increase exponentially with temperature as a result of the chemical reactions involved in the protein denaturation process, which is induced by HT. This model offers a thermodynamics based approach to explain experimental results previously obtained in different studies.
Simultaneous thermoradiotherapy supposedly leads to higher TERs than sequential HT + RT modalities van Leeuwen et al. (2017, 2018a); Overgaard (2013, 1980). This is true for both tumour and normal tissue. Consequently, normal tissue has to be spared to achieve therapeutic gain, which requires precise application of heat to the tumour. This has remained challenging, due to blood flow, re-oxygenation and heat dispersion, despite the fact that precise real-time temperature control and monitoring techniques are already in place Crezee et al. (2016).
Today, various technologies, which are based on ultrasound, micro or electromagnetic waves, are available for simultaneous HT+RT treatment in the clinical setting and have for example been applied to treat breast cancer (reviewed in Moros et al. (2010)) and different types of superficial malignancies Myerson et al. (1999). Others are under further development and/or envisioned for the treatment of different types of surface and deep-tissue tumours (reviewed in Crezee et al. (2016)). In this vein, new methodologies such as nanoparticles-HT and the design of precise simultaneous applicators Moros et al. (2010); Oberacker et al. (2017); Kosterev et al. (2015) have opened attractive prospects for implementing simultaneous thermoradiotherapy in standard clinical practice. Comprehensive mathematical modelling to better predict treatment outcome - as presented in the present article - will critically contribute to this process towards clinical routine.
Our model for simultaneous treatment is based on the modulation of the radiobiological parameters of the LQ-model. It is suitable to reproduce clonogenic survival curves, and very well reproduces TERs of in vitro and in vivo experiments. However, translation into more relevant clinical outcomes is still required, i.e. tumour control probabilities or control doses, where “disease control” means the long-term extinction of replication-competent tumour cells in vivo after completion of the treatment Zaider and Hanin (2011). This translation is usually done by means of simple logistic functions. Since the extraction of systematic radiobiological parameters from humans is difficult, even unfeasible for different treatment times and temperatures, the underlying parameters often come from classical 2D cell cultures. However, these have been found to insufficiently estimate radiation response Hillen et al. (2010); Naqa et al. (2010). Indeed, more accurate translations require more elaborated approaches to reflect the treatment response in a more realistic and complex in vivo-like environment. Examples of factors that need to be considered include cell-cell and cell-matrix interactions, oxygen distributions, proliferative activity and cell cycle progression in a 3-D cellular context. We therefore intend to combine the present theoretical findings with cellular automaton simulations in a next step, to model the treatment outcome in 3D tumour cell models such as in-silico multicellular tumour spheroids.
The present study constitutes a crucial initial step for implementing more complex scenarios with respect to I. heterogeneous tumour cellular environment and micromileau in a 3D geometry and II. treatment modality, such as sequential application of HT and RT treatment, in which the thermodynamics of reversible/repairable effects needs to be included. Notably, sequential treatments are simpler in clinical handling and thus of high practical relevance. Our work paves the ground for a more elaborate unified model, which is in the focus of our ongoing work, with the aim to describe the individual treatments and their sequential application from common general principles.
IV Methods
IV.1 Thermal enhancement of radiotherapy
When a certain radiation dose is applied to a set of living cells, the reduction rate is proportional to the number of cells at the time of the treatment
| (7) |
Therefore, the direct transition from the alive state of the cell to the dead state obeys an exponential behavior , where is the survival fraction, and defines the transition rate per dose, as depicted in Fig.1(a) Joiner and van der Kogel (2009). If the killing effect is composed of a direct killing path , and a secondary path composed of two or more stages of sublethal damage (SLD) accumulation, the logarithmic survival curve acquires a shoulder, as depicted in Fig.1(b). In the particular case of the LQ-model, the exponent has a linear and a quadratic contribution, corresponding to direct killing and SLD accumulation respectively
| (8) |
The LQ-model was originally employed as an empirical approach Lea and Catcheside (1942); later Chadwick and Leenhouts Chadwick and Leenhouts (1973) proposed a molecular interpretation based on a statistical approach. In their interpretation cell death occurs due to double-strand breaks (DSB) of DNA, such that and account for the probability of producing irreparable DSB as a consequence of one or two photon/particle hits, respectively. As a consequence of the sensitisation effect of HT, the radiation dose required to produce the same surviving fraction is reduced. This reduction implies in Eq.8, that and are increased to and (in order to obtain the same therapeutic outcome), assessing the increased sensitivity of the cells as a consequence of heat
| (9) |
This radiosensitising effect of hyperthermia is quantified by the thermal enhancement ratio TER. It is defined as the ratio between the radiation dose required to achieve a specific endpoint with ionizing radiation alone (), and the radiation dose resulting in the same endpoint value when combined with hyperthermia ():
| (10) |
with and . The new linear and quadratic coefficients of the LQ-model are obtained by replacing with in Eq.8:
| (11) |
Comparing equations 9 and 11 shows how the radiobiological parameters are effectively rescaled by hyperthermia to and . Notably TER has a stronger effect on , bending the survival curves to lower survival values, in accordance with previous empirical data from experimental and clinical values studies Franken et al. (2013); Datta and Bodis (2019b), bending the survival curves to lower survival values. We propose a model for TER as a function of HT parameters, namely temperature and time, which is incorporated into the LQ-model to predict the survival probability of RT combined with mild HT. As detailed in the results section, TER is assumed to be proportional to the energy absorbed in the transition from the live state (A) to the more vulnerable state (A’) , which in turn is defined as a rate-limited process
| (12) |
where is the baseline of TER, and accounts for the cell-line specific radio- and thermal sensitivity. In the absence of hyperthermia , resulting in . The transition rate from (A) to (A’) is modelled assuming protein denaturation as the mechanism responsible for heat-induced cell damage, as described in the next section.
IV.2 Temperature dependence of the transition rate
The temperature dependency of the transition rate is modelled by means of the Eyring’s transition state theory Eyring (1935):
| (13) |
where and are the Boltzmann and Planck constants, respectively, and is the temperature in Kelvin. We next introduce a suitable model for the change in Gibbs energy consistent with protein denaturation.
All conformation changes during protein denaturation arise from the competition between formation and breakage of chemical bonds. Protein denaturation becomes thermodynamically more favourable with increasing temperature. The dynamics of protein bonds is quantified by the standard heat of reaction and the thermal work function respectively. We model the mixture of proteins sensitive to hyperthermia, as an average equivalent protein. Its overall heat capacity changes as a result of the state changes of individual proteins within the mixture. All the symbols refer to changes in the thermodynamic properties of this “equivalent” protein, before and after the transformation.
The energy source for bonds to break is the thermal content , which refers to the heat absorbed during the process of protein unfolding while temperature increases. Only a part of the absorbed heat can be converted into bond-breaking work, as restricted by the second law of thermodynamics. The unused proportion of thermal content goes into entropy –the thermal work– and is proportional to the absorbed heat and the relative temperature increment. The expressions for enthalpy and work content read as Benzinger (1983):
| (14) |
where is the enthalpy of the reaction, containing the bond forming energy and the sum of isothermal transfers of heat . Here is the heat capacity, which might vary with temperature, according to the third law of thermodynamics. The net driving energy is then given by the Gibbs free energy
| (15) |
where is the entropy change, with as reference value. Accordingly, the Gibbs energy is expressed as
| (16) |
where . The reference temperature can be chosen so that , , or . and are of particular interest since they define the melting and maximal stability temperatures of the protein, respectively. When bond formation and breakage reach a balanced state () the reaction does not progress anymore. The melting temperature is defined as the temperature at which the half of the proteins are denatured Bischof and He (2006). Due to the importance of protein denaturation, the melting point is used as the reference temperature from now on.
The next challenge is to model the heat capacity in aqueous solutions above physiological temperatures. The heat capacity is expected to increase with temperature before approaching the vicinity of the melting point, as a result of ongoing protein reconfigurations. Beyond the transition, exothermic co-aggregations of proteins occur and is expected to decrease due to the reduced degrees of freedom of more rigid proteins. With these arguments, we propose to consider the next order by introducing the heat capacity change as a linear function of Prabhu and Sharp (2005), , which is the same as for , leading to
| (17) |
Here , is the usual Gibbs energy resulting from the assumption of constant heat capacity change. By introducing Eq.17 in Eq.13, the transition rate for denaturation becomes
| (18) |
where the last term in Eq.17 should vanish, because is about one in the Kelvin scale for the hyperthermia temperature range (40-50∘C). The first two factors of Eq.18 slightly change () in these regimes, and then the transition rate is dominated by the exponential behavior. Based on these considerations, can be described as
| (19) |
with and as –cell dependent– adjustable parameters of the model.
Acknowledgements
This work was supported by the German Federal Ministry of Education and Research (BMBF; 03Z1N512). The authors would like to thank Dario Egloff for very interesting discussions and comments.
Authors’ contribution statement
A.D.M. conceived the presented idea and developed the theory. A.D.M., S.M., J.B., and J.K. performed the computations and analyzed the results. D.M. and L.K. supervised the findings of this work. All authors contributed to the interpretation of the results and designed, wrote and discussed the manuscript.
References
- Bray et al. (2018) F. Bray, J. Ferlay, I. Soerjomataram, R. L. Siegel, L. A. Torre, and A. Jemal, CA: A Cancer Journal for Clinicians 68, 394 (2018).
- Yagawa et al. (2017) Y. Yagawa, K. Tanigawa, Y. Kobayashi, and M. Yamamoto, Journal of Cancer Metastasis and Treatment 13, 218 (2017).
- Cheng et al. (2019) Y. Cheng, S. Weng, L. Yu, N. Zhu, M. Yang, and Y. Yuan, Integrative cancer therapies 18, 1 (2019).
- Paulides et al. (2016) M. M. Paulides, G. M. Verduijn, and N. Van Holthe, Radiation Oncology 11, 1 (2016).
- Kang et al. (2020) J. K. Kang, J. C. Kim, Y. Shin, S. M. Han, W. R. Won, J. Her, J. Y. Park, and K. T. Oh, Archives of Pharmacal Research 43, 46 (2020).
- Soares et al. (2011) P. I. P. Soares, I. M. M. Ferreira, R. A. G. B. N. Igreja, C. M. M. Novo, and J. P. M. R. Borges, Recent patents on anti-cancer drug discovery 7, 64 (2011).
- Moros et al. (2010) E. G. Moros, J. Peñagaricano, P. Novàk, W. L. Straube, and R. J. Myerson, International Journal of Hyperthermia 26, 699 (2010).
- Oberacker et al. (2017) E. Oberacker, A. Kuehne, J. Nadobny, S. Zschaeck, M. Weihrauch, H. Waiczies, P. Ghadjar, P. Wust, T. Niendorf, and L. Winter, Current Directions in Biomedical Engineering 3, 473 (2017).
- Kosterev et al. (2015) V. V. Kosterev, E. A. Kramer-Ageev, V. N. Mazokhin, G. C. van Rhoon, and J. Crezee, International Journal of Hyperthermia 31, 443 (2015).
- (10) “Clinicaltrials.gov,” http://ClinicalTrials.gov, accessed: 2020-05-14.
- Dracham et al. (2018) C. B. Dracham, A. Shankar, and R. Madan, Radiat Oncol J 36, 85 (2018).
- Mei et al. (2020) X. Mei, R. ten Cate, C. M. van Leeuwen, H. M. Rodermond, L. de Leeuw, D. Dimitrakopoulou, L. J. A. Stalpers, J. Crezee, H. P. Kok, N. A. P. Franken, and A. L. Oei, Cancers 12 (2020), 10.3390/cancers12030582.
- Overgaard (2013) J. Overgaard, Radiotherapy and Oncology 109, 185 (2013).
- Elming et al. (2019) P. B. Elming, B. S. Sørensen, A. L. Oei, N. A. P. Franken, J. Crezee, J. Overgaard, and M. R. Horsman, Cancers 11 (2019), 10.3390/cancers11010060.
- Datta et al. (2014) N. R. Datta, E. Puric, R. Schneider, D. C. Weber, S. Rogers, and S. Bodis, International Journal of Hyperthermia 30, 524 (2014).
- Datta and Bodis (2019a) N. R. Datta and S. Bodis, International Journal of Hyperthermia 36, 1072 (2019a).
- van der Zee (2002) J. van der Zee, Annals of Oncology 13, 1173 (2002).
- Datta et al. (2016a) N. R. Datta, R. Schneider, E. Puric, F. J. Ahlhelm, D. Marder, S. Bodis, and D. C. Weber, International Journal of Particle Therapy 3, 327 (2016a).
- Hurwitz et al. (2011) M. D. Hurwitz, J. L. Hansen, S. Prokopios-Davos, J. Manola, Q. Wang, B. A. Bornstein, K. Hynynen, and I. D. Kaplan, Cancer 117, 510 (2011).
- Datta et al. (2016b) N. R. Datta, E. Puric, D. Klingbiel, S. Gomez, and S. Bodis, International Journal of Radiation Oncology Biology Physics 94, 1073 (2016b).
- Bakker et al. (2019) A. Bakker, J. van der Zee, G. van Tienhoven, H. P. Kok, C. R. N. Rasch, and H. Crezee, International Journal of Hyperthermia 36, 1023 (2019).
- van Leeuwen et al. (2017) C. M. van Leeuwen, A. L. Oei, K. W. T. K. Chin, J. Crezee, A. Bel, A. M. Westermann, M. R. Buist, N. A. P. Franken, L. J. A. Stalpers, and H. P. Kok, Radiation Oncology 12, 1 (2017).
- van Leeuwen et al. (2018a) C. M. van Leeuwen, J. Crezee, A. L. Oei, N. A. P. Franken, L. J. A. Stalpers, A. Bel, and H. P. Kok, International Journal of Hyperthermia 34, 901 (2018a).
- Overgaard (1980) J. Overgaard, International Journal of Radiation Oncology*Biology*Physics 6, 1507 (1980).
- Spirou et al. (2018) S. V. Spirou, M. Basini, A. Lascialfari, C. Sangregorio, and C. Innocenti, Nanomaterials 8, 1 (2018).
- Peeken et al. (2017) J. C. Peeken, P. Vaupel, and S. E. Combs, Frontiers in oncology 7, 1 (2017).
- Datta et al. (2015) N. Datta, S. Gómez Ordóñez, U. Gaipl, M. Paulides, H. Crezee, J. Gellermann, D. Marder, E. Puric, and B. S., Cancer treatments reviews 41, 1 (2015).
- Varma et al. (2012) S. Varma, R. Myerson, E. Moros, M. Taylor, W. Straube, and I. Zoberi, International Journal of Hyperthermia 28, 583 (2012).
- Myerson et al. (1999) R. J. Myerson, E. G. Strause, W. L.and Moros, B. N. Emami, H. K. Lee, C. A. Perez, and T. M. E., International Journal of Hyperthermia 15, 251 (1999).
- Chadwick and Leenhouts (1973) K. H. Chadwick and H. P. Leenhouts, Physics in Medicine and Biology 18, 78 (1973).
- Datta and Bodis (2019b) N. R. Datta and S. Bodis, Radiotherapy and Oncology 138, 1 (2019b).
- Crezee et al. (2016) H. Crezee, C. M. van Leeuwen, A. L. Oei, L. J. Stalpers, A. Bel, N. A. Franken, and H. P. Kok, International Journal of Hyperthermia 32, 41 (2016).
- Bodgi et al. (2016) L. Bodgi, A. Canet, L. Pujo-Menjouet, A. Lesne, J.-M. Victor, and N. Foray, Journal of Theoretical Biology 394, 93 (2016).
- Joiner and van der Kogel (2009) C. Joiner, Michael and A. J. van der Kogel, Basic Clinical Radiobiology, 4th ed. (CRC Press, 2009).
- Zaider and Hanin (2011) M. Zaider and L. Hanin, Medical Physics 38, 574 (2011).
- Lepock (2005) J. R. Lepock, International Journal of Hyperthermia 21, 681 (2005).
- Lepock et al. (1993) J. Lepock, H. Frey, and K. Ritchie, Journal of Cell Biology 122, 1267 (1993).
- Grimm et al. (2009) M. Grimm, E. Zynda, and E. Repasky, “Prokaryotic and eukaryotic heat shock proteins in infectious disease,” (Springer,Dordrecht, 2009) Chap. Temperature Matters: Cellular Targets of Hyperthermia in Cancer Biology and Immunology.
- Kampinga and Dikomey (2001) H. H. Kampinga and E. Dikomey, International Journal of Radiation Biology 77, 399 (2001).
- Pearce (2013) J. A. Pearce, International Journal of Hyperthermia 29, 262 (2013).
- Jung (1991) H. Jung, Radiation Research 127, 235 (1991).
- Oei et al. (2015) A. L. Oei, L. E. M. Vriend, J. Crezee, N. A. P. Franken, and P. M. Krawczyk, Radiation Oncology 165 (2015), 10.1186/s13014-015-0462-0.
- Brüningk et al. (2018a) S. C. Brüningk, J. Ijaz, I. Rivens, S. Nill, G. t. Haar, and U. Oelfke, International Journal of Hyperthermia 34, 392 (2018a), pMID: 28641499.
- Brüningk et al. (2018b) S. Brüningk, G. Powathil, P. Ziegenhein, J. Ijaz, I. Rivens, S. Nill, M. Chaplain, U. Oelfke, and G. ter Haar, Journal of The Royal Society Interface 15, 20170681 (2018b).
- van Leeuwen et al. (2018b) C. M. van Leeuwen, A. L. Oei, R. ten Cate, N. A. P. Franken, A. Bel, L. J. A. Stalpers, J. Crezee, and H. P. Kok, International Journal of Hyperthermia 34, 30 (2018b), pMID: 28540813.
- Gillette (1984) E. L. Gillette, Cancer Research 44, 4836s (1984).
- Franken et al. (2013) N. A. Franken, A. L. Oei, H. P. Kok, H. M. Rodermond, P. Sminia, J. Crezee, L. J. Stalpers, and G. W. Barendsen, International Journal of Oncology 42, 1501 (2013).
- Dikomey and Jung (1991) E. Dikomey and H. W. Jung, International journal of radiation biology 59, 815 (1991).
- Havemann et al. (1987) J. Havemann, M. Luinenburg, J. Wondergem, and A. Hart, International Journal of Radiation Biology and Related Studies in Physics, Chemistry and Medicine 51, 561 (1987).
- Kok et al. (2014) H. P. Kok, J. Crezee, N. A. Franken, L. J. Stalpers, G. W. Barendsen, and A. Bel, International Journal of Radiation Oncology Biology Physics 88, 739 (2014).
- Myerson et al. (2004) R. J. Myerson, J. L. R. Roti, E. G. Moros, W. L. Straube, and M. Xu, International Journal of Hyperthermia 20, 201 (2004).
- Overgaard (1984) J. Overgaard, Acta Radiologica: Oncology 23, 135 (1984).
- Prabhu and Sharp (2005) N. V. Prabhu and K. A. Sharp, Annual Review of Physical Chemistry 56, 521 (2005), pMID: 15796710.
- Atkins and de Paula (2006) P. Atkins and J. de Paula, Atkins’ Pysical chemestry, 8th ed. (W. H. Freeman and Company, 2006).
- Hillen et al. (2010) T. Hillen, G. de Vries, J. Gong, and C. Finlay, Acta Oncologica 49, 1315 (2010).
- Naqa et al. (2010) I. E. Naqa, J. O. Deasy, Y. Mu, E. Huang, H. J., P. E. Lindsay, A. Apte, J. Alaly, and J. D. Bradley, Acta Oncologica 49, 1363 (2010).
- Lea and Catcheside (1942) D. E. Lea and D. G. Catcheside, Journal of Genetics 44, 216 (1942).
- Eyring (1935) H. Eyring, The Journal of Chemical Physics 3, 107 (1935).
- Benzinger (1983) T. H. Benzinger, American Journal of Physiology-Regulatory, Integrative and Comparative Physiology 244, R743 (1983), pMID: 6859287.
- Bischof and He (2006) J. C. Bischof and X. He, Annals of the New York Academy of Sciences 1066, 12 (2006).