Proceedings of CTD 2020 PROC-CTD2020-46
Track Seeding and Labelling with Embedded-space Graph Neural Networks
Nicholas Choma, Daniel Murnane, Xiangyang Ju, Paolo Calafiura, Sean Conlon,
Steven Farrell, Prabhat
Lawrence Berkeley National Laboratory
Berkeley, CA, USA
Giuseppe Cerati, Lindsey Gray, Thomas Klijnsma, Jim Kowalkowski, Panagiotis Spentzouris
Fermi National Accelerator Laboratory
Batavia, IL USA
Jean-Roch Vlimant, Maria Spiropulu
California Institute of Technology
Pasadena, CA USA
Adam Aurisano, Jeremy Hewes
University of Cincinnati
University of Cincinnati, OH USA
Aristeidis Tsaris
Oak Ridge National Laboratory
Oak Ridge, TN USA
and
Kazuhiro Terao, Tracy Usher
SLAC National Accelerator Laboratory
Menlo Park, CA USA
ABSTRACT
To address the unprecedented scale of HL-LHC data, the Exa.TrkX project is investigating a variety of machine learning approaches to particle track reconstruction. The most promising of these solutions, graph neural networks (GNN), process the event as a graph that connects track measurements (detector hits corresponding to nodes) with candidate line segments between the hits (corresponding to edges). Detector information can be associated with nodes and edges, enabling a GNN to propagate the embedded parameters around the graph and predict node-, edge- and graph-level observables.
Previously, message-passing GNNs have shown success in predicting doublet likelihood, and we here report updates on the state-of-the-art architectures for this task. In addition, the Exa.TrkX project has investigated innovations in both graph construction, and embedded representations, in an effort to achieve fully learned end-to-end track finding.
Hence, we present a suite of extensions to the original model, with encouraging results for hitgraph classification. In addition, we explore increased performance by constructing graphs from learned representations which contain non-linear metric structure, allowing for efficient clustering and neighborhood queries of data points. We demonstrate how this framework fits in with both traditional clustering pipelines, and GNN approaches. The embedded graphs feed into high-accuracy doublet and triplet classifiers, or can be used as an end-to-end track classifier by clustering in an embedded space. A set of post-processing methods improve performance with knowledge of the detector physics. Finally, we present numerical results on the TrackML particle tracking challenge dataset, where our framework shows favorable results in both seeding and track finding.
PRESENTED AT
Connecting the Dots Workshop (CTD 2020)
April 20-30, 2020
1 Introduction
High energy physics (HEP) experiments are designed to solve some of the most fundamental questions in the universe by probing the interactions of elementary particles in vast quantities of particle collision data. As the frontiers of known physics advance, experiments must increasingly search in regimes of higher energy, higher data volume, and higher data density. In experiments such as ATLAS [1] and CMS [2] at the High Luminosity Large Hadron Collider (HL-LHC) [3], giant particle detectors will collect measurements from 200 particle interactions per collision event on average. One critical component of the data analysis pipeline in HEP is the reconstruction of charged particle trajectories in high granularity tracking detectors (“particle tracking”). Tracking systems at the HL-LHC will have readout channels to record position measurements (referred to as “space-points” or “hits”) of charge particles per event. Tracking algorithms must be able to identify as many of these trajectories as possible while prioritizing the high-transverse momentum particles coming from the highest energy interactions.
Traditional tracking solutions in HEP are broken up into several steps. One of these is seed finding, in which small combinations of hits (e.g. three-hit “triplets”) are identified as likely track candidates through hand-crafted criteria. Another, track building, involves extrapolating the candidate seeds using Kalman Filters [4] and searching through likely hit candidates at each detector layer until reaching the end of the detector. The combinatorial nature of these algorithms means their computational cost will increase significantly with the expected increase in collision density in the HL-LHC.
Motivated by the high computational cost of existing tracking solutions in HEP, the HEP.TrkX pilot project [5] and now the Exa.TrkX [6] project have been investigating machine learning solutions. Applications using convolutional and recurrent neural networks have been explored but were deemed insufficient to address the challenges of realistic particle tracking [7, 8]. Graph neural network (GNN) [9, 10] models were then proposed and demonstrated to be effective at identifying tracks in realistic data [8, 11]. In these applications, graphs are constructed from the point cloud of hits in each event. Edges are drawn between hits that may come from the same particle track according to some loose heuristic criteria. The GNN model is then trained to classify the graph edges as real or fake, giving a pure and efficient sample of track segments which can be used to construct full track candidates.
This work builds off of the previous studies of GNNs applied to particle tracking, advancing in the areas of graph construction and formulation, model performance, and full track reconstruction. All methods are demonstrated on the TrackML dataset [12] using the same preprocessing procedure defined in [11], i.e. restricting to the barrel detector only and pre-filtering out the noise hits. Section 2 describes our new approaches for building graphs with learned hit embeddings. Section 3 represents the GNN edge classifier and its performance in correctly identifying edges in doublet graphs and triplet graphs, as well as a seeding algorithm transformed from the results of applying the GNN edge classifier on the triplet graphs. Section 4 shows the track labeling performance of our GNN model. Finally, the conclusion and future work is given in Section 5.
2 Graph Construction
We present a general graph construction approach where the objective is to place as many edges as possible between entities that belong together, and as few edges as possible between entities that do not. In doing so, we first find a good distance metric between pairs of 3D hit measurements, wherein pairs belonging to the same particle are nearby, and pairs belonging to different particles are further apart. Assuming the cost to compute the distance between a pair of points is , we can then construct a sparse graph efficiently by performing neighbor or neighborhood queries.
2.1 Embedding Architecture
Rather than learn a distance metric directly, we instead embed our hit measurements into a new Euclidean space , where is low enough that the embedded space is not too sparse. This formulation is an effort to leverage existing frameworks [13] which can perform efficient queries using common distance metrics, something we will need for graph construction.
We embed points using a learned model , parameterized by , which maps points into the new Euclidean space
| (1) |
In our experiments, includes the 3D hit position in cylindrical coordinates and the shape of the energy deposited by charge particles, is implemented as a multi-layer perceptron (MLP) and are the trainable parameters in MLP.
This stage is trained using a hinge embedding loss, pulling together points belonging to the same particle and pushing apart points which do not. So for a given sample , where
| (2) |
we compute the loss as
| (3) |
For our implementation, we use .
Upon completion of the learned embedding’s training, we now have a distance metric where for points ,
| (4) |
With , we can construct the input graph by querying, for each point , the set of points which are nearby. Then, for every point , we add a directed edge which connects node to node .
For efficient querying, we construct a kd-tree from the embedded points, a binary tree data structure which is constructed in time and can be queried in time. Once built, each point is queried using one of the following two strategies:
-
•
-nearest neighbors, which finds for each point a neighborhood
(5) -
•
-ball query, which finds for each point a neighborhood
(6) where for each neighbor
(7)
Graphs produced with -nearest neighbor queries are regular, thus they allow for grid-like data structures wherein there is no need for sparse matrix multiplication – something which allows for speedups on GPU. In practice, -ball queries typically exhibit superior graph construction performance, likely due to the non-uniform density of points in the embedded space.
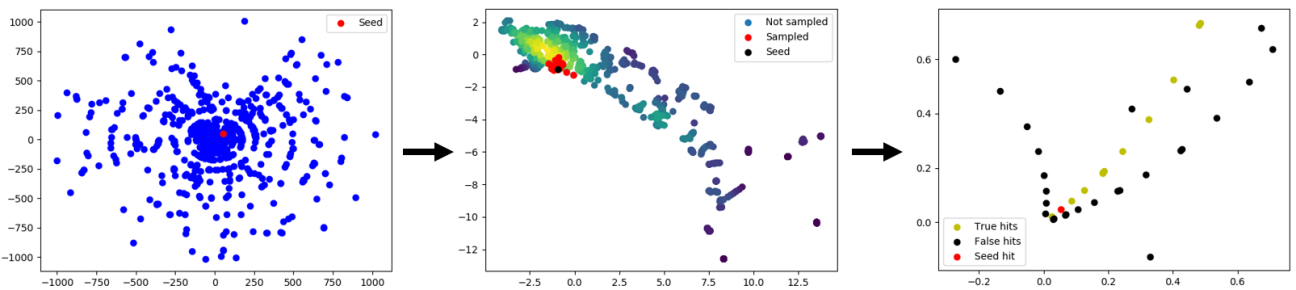
Figure 1 shows the process by which neighboring hits are selected from a seeded hit’s query to the embedded space.
2.2 Edge Refinement
Although graphs produced using the learned embeddings are sparse, further refinement can yield still much sparser graphs. Within the embedding model, we are only able to consider features derived from each point individually. Since we have now produced a relatively small set of edges, represented as pairs of points, we can now consider models which take as input pairs of points, as well as pairwise features derived from domain expertise.
We thus construct an edge refinement model , parameterized by , which operates on pairs of points and their pairwise features , and outputs the probability that the pair belongs to the same cluster.
| (8) |
is likewise parameterized as a multi-layer preceptron.
With our trained model, we compute for each produced during the embedding stage. Then, choosing a threshold hyperparameter , we are left with our final edge selection
| (9) |
2.3 Performance
To achieve competitive performance with traditional tracking algorithms, the graph construction stage must run in approximately one second or less while maintaining a sufficiently high portion of the graph’s true edges. Whereas the embedding model must only consider points, the edge refinement model must infer over pairs of points and as such acts as a bottleneck. To mediate this bottleneck, is a relatively small network containing just 3 hidden layers with 512 hidden units each. Additionally, uses half-precision parameters which is able to achieve a 2x speedup over full precision when run on Nvidia’s GPU architectures.
We also note the adaptability of our architecture to differing edge recovery and graph size requirements through the neighborhood and filtering hyperparameters, and , respectively. In our tests, we required 96% of the true edges to be recovered by the graph construction pipeline to maintain a high TrackML score. Respecting the timing requirements for this stage, our architecture was thus capable of graph construction where 30.3% of all edges were true edges. This result has significant implications for downstream GNN training and inference, allowing for vastly reduced computation in graph convolution, and a smaller memory footprint during training which eliminates the need to divide the domain onto multiple GPUs.
3 GNN Edge Classification
3.1 GNN Architecture
We extend the prototypical message passing Graph Neural Network architecture as described in [14], with an attention mechanism [15] and a ResNet-style [16] addition operation between message passing layers to help reduce the vanishing gradient effect. Once hits are assembled into input graphs in embedded space (section 2), the hit coordinates of the node are passed through a input MLP, where are the number of fully connected layers between cylindrical coordinates and the latent node features , and is the width of these layers (generally, we take MLPs as having the same number of parameters in each layer).
We then include a recurrent set of , iterating times through (fig. 2). In its forward pass, the concatenates the features of the nodes on either end of each edge and passes this through a edge MLP, with one fully connected layer outputting a scalar value for each edge. For an edge connecting nodes and , this value is called the edge score , defined for the iteration as
| (10) |
where is a concatenation of the hidden features, and MLP is a sequence of multiplications by weight matrices and operations of non-linear activations, in this case Tanh functions. This edge score is used in an attention mechanism. The implements a message passing forward pass, such that for each node, the neighboring node features of all incoming edges are aggregated with a weighted sum. The same is done with outgoing edges, then these two pooled vectors are concatenated and passed through a node MLP.
| (11) |
As can be seen, the the output of the MLP is summed with the hidden features of the previous iteration (a "skip connection"). After iterations, the node features are passed through the Edge Network a final time, to determine the edge scores, which are interpreted as a truth likelihood and handled by a binary cross entropy loss function.
In order to determine the best set of model hyperparameters, we perform Bayesian optimisation over them, with the goal of optimising both edge classification efficiency and purity. In practice, we aim to maximise the value introduced in [17], where
| (12) |
3.2 Doublet GNN Performance
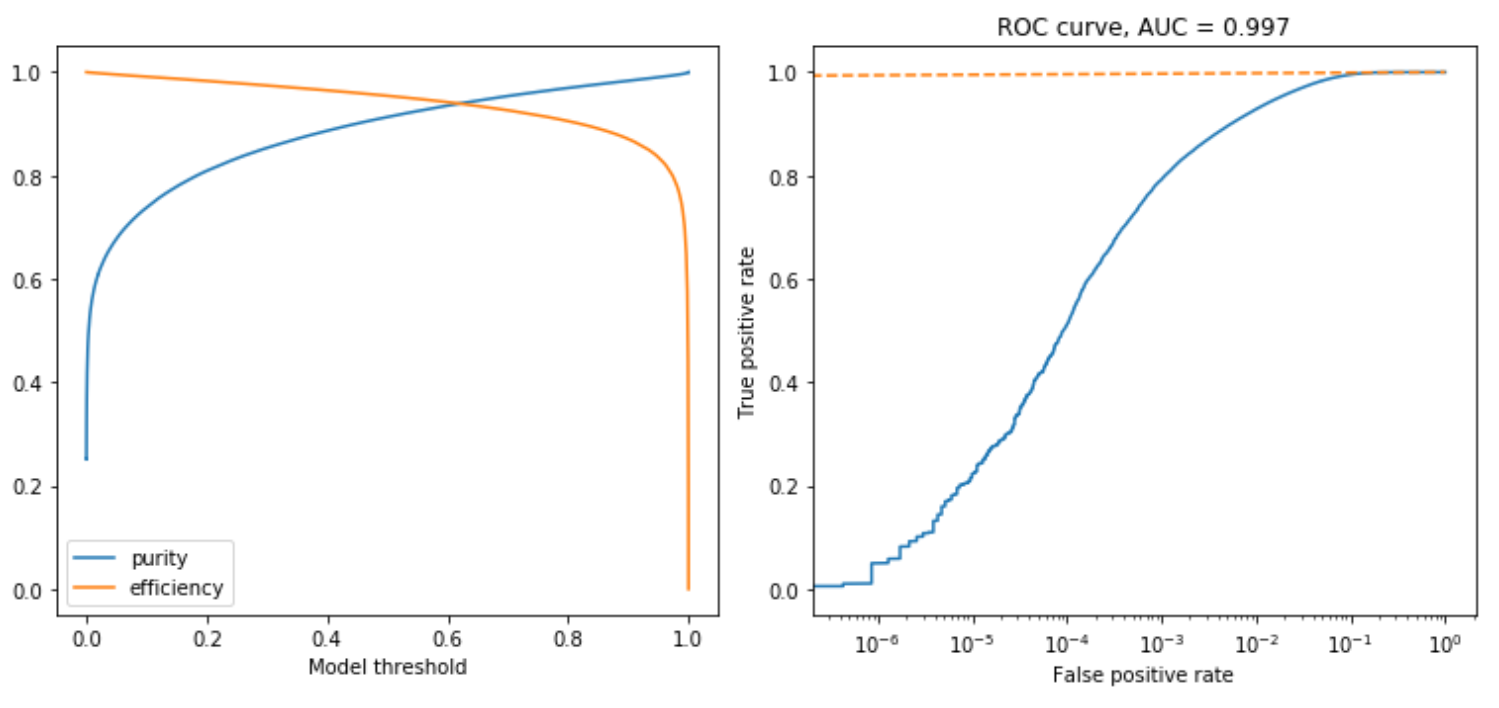
Given the above architecture, we present the results of edge classification. Figure 3 gives the efficiency and purity at different choices of edge score threshold (ROC curve). The ROC area under curve (AUC) for the best doublet GNN hyperparameter configuration is 0.997. As a matter of memory management, the hit graphs must be split into subgraphs. We find that 8 subgraphs, segmented around the -direction. To preserve edges, each full graph is first constructed, hits in each slice are assigned to subgraphs, as are copies of hits connected by an edge to those hits.
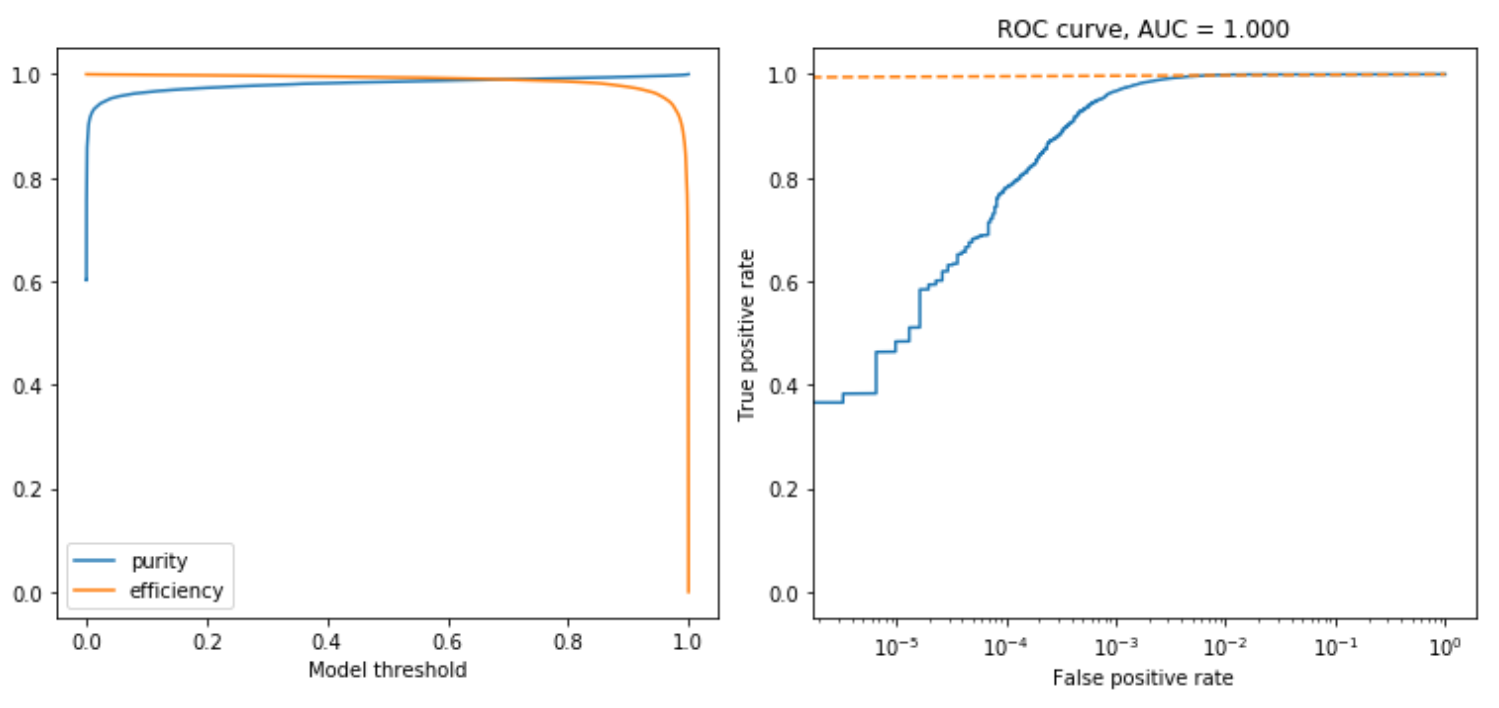
3.3 Triplet GNN Performance
To perform classification of triplets using the same approach as the doublet classification, we need to identify hitgraph doublets as nodes in a new "triplet graph", and combinations of triplets as edges in a triplet graph. To accelerate this transformation, we first convert the edge list (the standard Pytorch Geometric COO format [18]) to sparse row matrices (CSR format) on a GPU with CuPy [19]. These two matrices, one incoming, on outgoing, are multiplied to produce a square CSR matrix that represents triplet edges. That is,
| (13) |
This efficient transformation is able to decrease the time taken for each event, from the inbuilt methods of Pytorch Geometric of , to , thereby making the prospect of sub-second triplet classification possible. Once the triplet graph is constructed, the same GNN architecture of the previous section is used in training and edge classification. Node features in the triplet graph are defined by concatenating the node features of each doublet, along with the classification score of the associated edge, such that for two nodes and connected by an edge
| (14) |
A cut is placed on the edges used in the triplet graph construction, so as to limit combinatorial growth. Cutting doublet edges below a score of boosts the graph purity from 30% to 60%, while retaining 99.12% efficiency. Training the triplet GNN on the hyperparameter configuration given above produces the performance given in table 1.
| Doublet GNN | Triplet GNN | ||||
|---|---|---|---|---|---|
| Threshold | 0.5 | 0.8 | 0.5 | 0.8 | |
| Accuracy | 0.9761 | 0.9784 | 0.9960 | 0.9957 | |
| Purity | 0.9133 | 0.9694 | 0.9854 | 0.9923 | |
| Efficiency | 0.9542 | 0.9052 | 0.9939 | 0.9850 | |
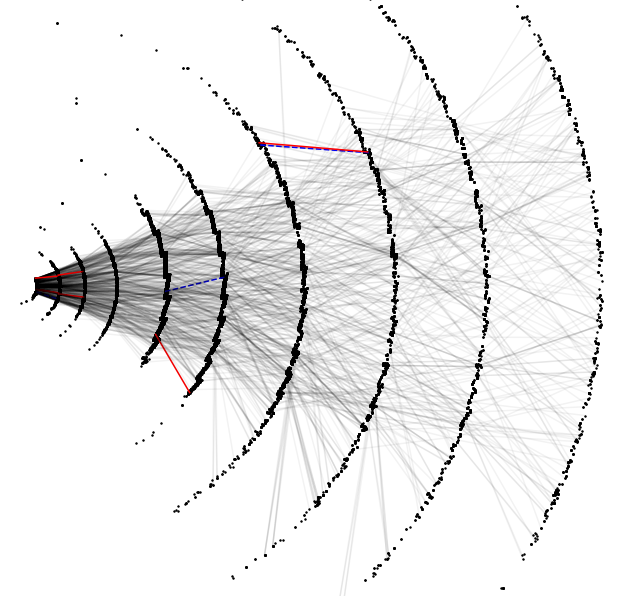
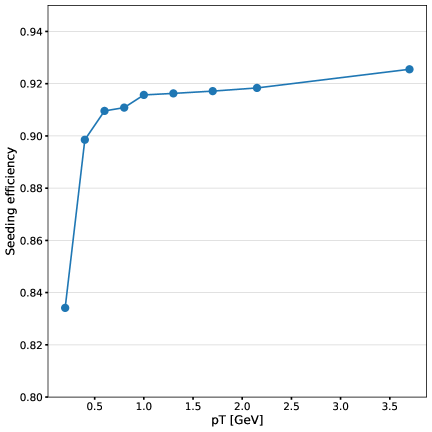
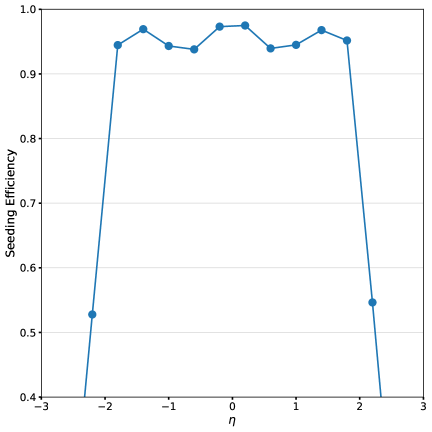
Seeds, defined as a set of at least three hits recorded by consecutively different layers, are the crucial inputs for the existing tracking reconstruction algorithms [20]. The triplet GNN was turned into a seeding algorithm in which the edges with a high GNN score are selected and the nodes connecting each edge form a seed candidate. The performance of the GNN-based seeding algorithm is evaluated in terms of seeding efficiency, defined as the ratio of the number of good tracks matched to at least one seed candidate over the total number of good tracks, and seeding purity, defined as the number of seed candidates matched to a good track over the total number of seed candidates. Good tracks are defined as the tracks that are resulted from particles leaving at least three hits in different layers and having at least five hits in the triplet graph. Evaluated on 100 testing events, the GNN-based seeding algorithm renders a seeding efficiency of ()% and a seeding purity of ()%. Only statistical uncertainties are taken into account. The seeding efficiency is further evaluated as a function of the transverse momentum () and the pseudo-rapidity ***, where is the polar angle. () of the particle that the track is associated with, shown in Figure 5. The GNN-based seeding algorithm has an efficiency of 83% for particles of in [0.1, 0.3] GeV and increases to 92% for particles with at or above 0.7 GeV.
4 Track Labeling Performance
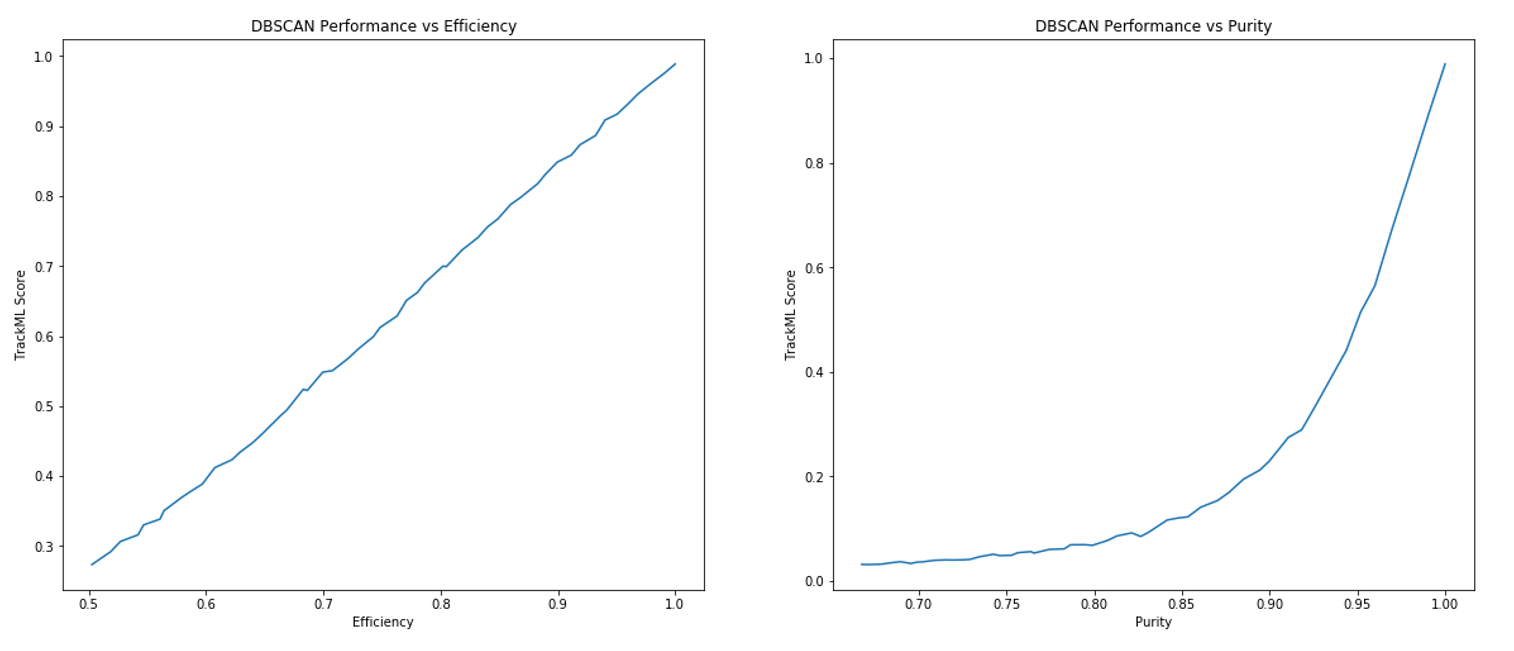
Given a graph of classified (doublet or triplet) edges, we would like to use these scores to assign unique track labels to each hit. The approach we use here is to apply DBSCAN (Density-Based Spatial Clustering of Applications with Noise) [13], with . Recent releases of DBSCAN allow a sparse matrix as a precomputed metric input. In practice, we take the COO-format edge list, convert it to a CSR-format sparse matrix as described in section 3.3, and assign each entry a distance , defined as . The neighborhood distance is left as a hyperparameter to be tuned for the best track labelling performance. This performance we measure according to the TrackML Score as defined in the TrackML Challenge Kaggle Competition (cite). The score is a weighted sum of each correctly labelled hit, giving more importance to straighter and longer tracks, and particularly hits at the beginning and end of these tracks that could be used as seeds. DBSCAN outputs integer cluster labels, which are used directly for calculating the TrackML Score against the truth labels. For a graph created from truth, with efficiency and purity artificially tuned, the TrackML score produced with the DBSCAN method scales as in fig. 6. We see that, provided purity is close to 100%, DBSCAN will generally deliver a faithful score. The score produced with this method drops exponentially with purity, but is robust (dropping linearly) against inefficiency. There are methods that will cluster more robustly for drops in efficiency and purity, and these should be explored in future works. In this work, we settle on DBSCAN for its simplicity and fast performance, being careful to note when a drop in score is merely an artifact of DBSCAN or some more intrinsic failure of the GNN classification or embedding construction.
| TrackML Score | ||
|---|---|---|
| Condition | Truth | Prediction |
| Doublet GNN | 0.935 | 0.805 |
| Triplet GNN | 0.846 | 0.815 |
| and | 0.912 | 0.876 |
| and 5 hits adjacent | - | 0.932 |
We calculate the TrackML score against various possible conditions on the dataset. Each condition and its corresponding maximum score is given in table 2. As we are only classifying hits in the barrel, we normalise against this condition. The table gives the maximum score attainable with the edges provided from the metric learning neighbourhood construction stage, and applying DBSCAN to truth-level classification. This stems from the efficiency of the construction stage, leading to a loss in TrackML score. This is consistent with the generic scaling seen in fig. 6. The actual performance of the doublet GNN is given as .
The maximum score attainable with the triplets constructed from the doublet classification stage (as a reminder, all hits connected in a graph are constrained to adjacent layers in the detector), again using truth-level classification is . This is another large reduction in possible score, this time from heavily-weighted doublets that are not included in the triplet construction as they are not joined by likely edges. These are predominantly at the edges of the barrel, where they are part of a track dominated by endcap layer hits. By narrowing the pseudo-rapidity range of possible hits to and removing a small number of "fragments" (these tails of longer tracks in the endcaps) we reclaim much of the maximum possible score lost in the triplet construction. Finally, given that we artificially restrict our study to adjacent layers, we restrict tracks with greater than five hits to contain at least five adjacent hits, giving the final adjusted score of .
5 Conclusion
The pipeline presented here represents a significant improvement in track labelling and seeding performance. To apply the stages of preprocessing, KNN clustering in learned embedded space, pair filtering, GNN classification of doublets and triplets, then either seed generation or track finding requires per event. Restricting the pseudorapidity to focus on the barrel (), we have seed efficiency and purity , while the track finding gives a TrackML score of given reconstructability constraints. These metrics compare favourably with traditional methods of seeding and track finding, and moreover allow for fast performance and parallelizability – features often lacking due to the scaling problems inherent in many traditional algorithms.
We note that several artificial advantages were incorporated into the work, including ignoring noise hits and excluding data from the endcaps. Current work is focused on incorporating that data back into the classification pipeline and further advancing the computational and physics performance of the models, including testing our pipeline on data simulated by HL-LHC experiments. We will also study the robustness of our solution against various systematical effects such as detector noise and misalignment. To meet the requirements of HL-LHC tracking we need to improve the physics and computational performance of our models. To this end, we are exploring the utilization of more advanced GNN architectures, next-generation GP-GPUs and Google Cloud TPUs, and of distributed training and inference.
Software Availability
The software and the documentation needed to reproduce the results of this article are available at https://github.com/exatrkx/exatrkx-ctd2020
Acknowledgments
This research was supported in part by the Office of Science, Office of High Energy Physics, of the US Department of Energy under Contracts No. DE-AC02-05CH11231 (CompHEP Exa.TrkX) and No. DE-AC02-07CH11359 (FNAL LDRD 2019.017).
This research used resources of the National Energy Research Scientific Computing Center (NERSC), a U.S. Department of Energy Office of Science User Facility operated under Contract No. DE-AC02-05CH11231.
References
- [1] G. Aad “The ATLAS Experiment at the CERN Large Hadron Collider” In JINST 3, 2008, pp. S08003 DOI: 10.1088/1748-0221/3/08/S08003
- [2] S. Chatrchyan “The CMS experiment at the CERN LHC” In JINST 3, 2008, pp. S08004 DOI: 10.1088/1748-0221/3/08/S08004
- [3] G. Apollinari, O. Brüning, T. Nakamoto and Lucio Rossi “High Luminosity Large Hadron Collider HL-LHC” In CERN Yellow Report, 2015, pp. 1–19 DOI: 10.5170/CERN-2015-005.1
- [4] R. Fruhwirth “Application of Kalman filtering to track and vertex fitting” In Nucl. Instrum. Meth. A 262, 1987, pp. 444–450 DOI: 10.1016/0168-9002(87)90887-4
- [5] The HEP.TrkX Collaboration “HEP advanced tracking algorithms with cross-cutting applications”, 2016 URL: https://heptrkx.github.io/
- [6] The Exa.TrkX Collaboration “HEP advanced tracking algorithms at the exascale”, 2019 URL: https://exatrkx.github.io/
- [7] Steven Farrell “The HEP.TrkX Project: deep neural networks for HL-LHC online and offline tracking” In Proceedings, Connecting The Dots / Intelligent Tracker (CTD/WIT 2017): Orsay, France, March 6-9, 2017 150, 2017, pp. 00003 DOI: 10.1051/epjconf/201715000003
- [8] Steven Farrell “Novel deep learning methods for track reconstruction” In 4th International Workshop Connecting The Dots 2018 (CTD2018) Seattle, Washington, USA, March 20-22, 2018, 2018 arXiv:1810.06111 [hep-ex]
- [9] Jie Zhou et al. “Graph Neural Networks: A Review of Methods and Applications”, 2019 arXiv:1812.08434
- [10] Michael M. Bronstein et al. “Geometric deep learning: going beyond Euclidean data” In CoRR abs/1611.08097, 2016 arXiv:1611.08097
- [11] Xiangyang Ju “Graph Neural Networks for Particle Reconstruction in High Energy Physics detectors” In 33rd Annual Conference on Neural Information Processing Systems, 2020 arXiv:2003.11603 [physics.ins-det]
- [12] “TrackML Particle Tracking Challenge” URL: https://www.kaggle.com/c/trackml-particle-identification
- [13] F. Pedregosa et al. “Scikit-learn: Machine Learning in Python” In Journal of Machine Learning Research 12, 2011, pp. 2825–2830
- [14] Thomas N. Kipf and Max Welling “Semi-Supervised Classification with Graph Convolutional Networks” In CoRR abs/1609.02907, 2016 arXiv: http://arxiv.org/abs/1609.02907
- [15] Petar Veličković et al. “Graph attention networks” In arXiv preprint arXiv:1710.10903, 2017
- [16] Kaiming He, Xiangyu Zhang, Shaoqing Ren and Jian Sun “Deep residual learning for image recognition” In Proceedings of the IEEE conference on computer vision and pattern recognition, 2016, pp. 770–778
- [17] Nancy Chinchor “MUC-4 Evaluation Metrics” In Proceedings of the 4th Conference on Message Understanding, MUC4 ’92 McLean, Virginia: Association for Computational Linguistics, 1992, pp. 22–29 DOI: 10.3115/1072064.1072067
- [18] Matthias Fey and Jan Eric Lenssen “Fast Graph Representation Learning with PyTorch Geometric” In arXiv e-prints, 2019, pp. arXiv:1903.02428 arXiv:1903.02428 [cs.LG]
- [19] Ryosuke Okuta et al. “CuPy : A NumPy-Compatible Library for NVIDIA GPU Calculations”, 2017
- [20] T Cornelissen et al. “The new ATLAS track reconstruction (NEWT)” In Journal of Physics: Conference Series 119.3 IOP Publishing, 2008, pp. 032014 DOI: 10.1088/1742-6596/119/3/032014