A data science approach to drug safety:
Semantic and visual mining of adverse drug events from clinical trials
of pain treatments
Abstract
Clinical trials are the basis of Evidence-Based Medicine. Trial results are reviewed by experts and consensus panels for producing meta-analyses and clinical practice guidelines. However, reviewing these results is a long and tedious task, hence the meta-analyses and guidelines are not updated each time a new trial is published. Moreover, the independence of experts may be difficult to appraise. On the contrary, in many other domains, including medical risk analysis, the advent of data science, big data and visual analytics allowed moving from expert-based to fact-based knowledge. Since 12 years, many trial results are publicly available online in trial registries. Nevertheless, data science methods have not yet been applied widely to trial data.
In this paper, we present a platform for analyzing the safety events reported during clinical trials and published in trial registries. This platform is based on an ontological model including 582 trials on pain treatments, and uses semantic web technologies for querying this dataset at various levels of granularity. It also relies on a 26-dimensional flower glyph for the visualization of the Adverse Drug Events (ADE) rates in 13 categories and 2 levels of seriousness. We illustrate the interest of this platform through several use cases and we were able to find back conclusions that were initially found during meta-analyses. The platform was presented to four experts in drug safety, and is publicly available online, with the ontology of pain treatment ADE.
keywords:
Data mining , Ontology , Visual analytics , Glyph , Drug safety , Adverse drug events , Pain treatments , Painkillers1 Introduction
Clinical trials are the basis of Evidence-Based Medicine (EBM) [1]. In particular, they provide evidence of the efficacy and the safety of drug treatments. Trial results are reviewed by medical experts and consensus panels during the process of performing meta-analyses and writing clinical practice guidelines. These processes remain widely manual and based on human expertise.
However, reviewing trial results is a tedious task, and the independence of experts is somehow questionable [2], e.g. it has been shown that up to 90% of guidelines authors have ties to drug firms [3]. Independent experts are rare: to be an expert, one has to work on industry-funded trials, and disclosing links of interests does not necessarily prevent biases [4]. Beyond independence, human expertise is not reproducible [5], leading to variability in the recommendations across countries and organizations [3]. Finally, the analysis of trial data relies heavily on statistical methods that have known limits [6, 7], e.g. a significant difference may actually be very small.
For example, a recent meta-analysis on tapentadol, a new opioid drug for acute pain, included 8 randomized clinical trials and 3,706 patients, and showed that tapentadol was associated with fewer gastrointestinal adverse drug events (ADE) [8]. However, such a meta-analysis requires months of tedious expert work [9], and is not updated each time a new trial is published. Moreover, clinicians might have difficulties to assess the quality of the study and the independence of the authors, despite two investigators were involved in the process. Indeed, lack of confidence and trust, and lack of time to appraise evidence have been identified as barriers to the use of EBM by GPs [10].
In many domains, the advent of data science, big data and visual analytics allowed moving from expert-based to fact-based knowledge [11]. These methods have been shown to be efficient for the analysis of medical risk [7]. Today, regarding clinical trials, a lot of data is publicly available. Trial registration is mandatory since 2005 (International Committee of Medical Journal Editors) and 2008 (revised Declaration of Helsinki). Moreover, the publication of most trial results is mandatory in the US since 2017 (FDAAA 801, Final Rule). In May 2020, more than 42,000 study results are available in ClinicalTrials.gov, the largest trial registry.
Nevertheless, methods from the field of data science have not yet been widely applied to clinical trial data. This may be explained by the fact that the full, per-patient, outcomes data are not publicly available. Only aggregated data are available in trial registries, such as the number of patients having a given ADE or the mean value of a biological marker. However, data science methods are often not suited for such aggregated data, and in particular the data aggregation prevents the application of machine learning algorithms, e.g. one cannot learn a model to predict patient outcomes from patient characteristics using aggregated data. Consequently, the automated computer-based treatment of publicly available trial data is particularly challenging.
In previous studies, we showed that semantic web technologies and visual analytics were an interesting option for accessing and comparing drug knowledge [12] and for ranking and visualizing the properties of antibiotic agents [13, 14, 15]. Here, our hypothesis is that similar methods could be applied to aggregated trial result data found in trial registries, and could complement the currently used statistical methods.
Information visualization and visual analytics have been proposed as a solution to deal with mass of data in medicine [16]. Two strategies can be distinguished when designing visual analytics-based systems. The first one consists of using well-known generic visual techniques, often in combination. For example, W. Wang et al. [17] applied interactive bubble charts and scatter plots to non-aggregated trial safety data. H. Ltifi et al. [18] combined graphs and 3D bar charts for the analysis of nosocomial infections in intensive care units. D.J. Feller et al. [19] combined heatmaps and density plots in Glucolyzer, a tool for helping dieticians identify patterns between blood glucose levels and meal composition in type 2 diabetes. ClinOmicsTrailbc [20] combined radar charts, scatter plots, histograms and circular sun plots for breast cancer treatment stratification. The second strategy, more rarely employed, consists of designing visual approaches that are specifically adapted to the desired domain. As stated by L. Chittaro [16], a key research problem is to discover new visual metaphors for representing medical information and to understand what task they can support. For example, CareVis [21] proposed a novel PlanningLine glyph for visualizing temporal care plan. J.M. Juarez et al. [22] designed a multiple temporal axis model for the visualization of the activity of a single patient for homecare monitoring. J. Bernard et al. [23] designed a specific dashboard for representing patient history, and used dashboard networks for visualizing multiple patients histories. Here, we will propose a specific visual metaphor for viewing and comparing ADE rates, grouped in 13 categories.
In the previous example on tapentadol, data science methods may be used to easily and automatically produce rapid results on ADE rates. A data mining platform may contain all ADE observed during trials with publicly available results. A semantic search engine may allow to automatically search for trials testing tapentadol or other opioids for acute pain. Finally, the platform may aggregate and compare the results of the retrieved trials, using specifically designed visual analytics, showing within minutes that tapentadol has a lower risk of digestive ADE. Of course, the generated evidence will still need to be interpreted, and it would not have the strength of a full meta-analysis. Nevertheless, such a platform could help experts while performing meta-analyses, allowing to quickly test various hypotheses (e.g. what about comparing tapentadol to morphine?). In addition, it could also be used by non-expert clinicians for verifying the results of a published meta-analysis and assessing its reproducibility, or for obtaining up-to-date results including the latest studies.
The objective of this work is to design a web platform for the semantic and visual mining of ADE observed in clinical trials and published in trial registries, and to apply this platform to pain treatments. This platform aims at helping experts and clinicians, but also at illustrating what data science applied to trial public data may bring to drug safety.
The rest of the paper is organized as follows. Section 2 describes related works on trial data and visualization. Section 3 describes the methods used for building the platform, including trial selection, ontology modeling and population, ontology querying, data correction and normalization, and visualization. Section 4 presents the resulting ontology of pain treatment ADE and the proposed platform, and details several use cases and the comments of experts in drug safety. Section 5 discusses the methods and the results, and, finally, section 6 concludes with perspectives.
2 Related works
2.1 Usage of clinical trial registries
Clinical trial data is available publicly in online registries, such as ClinicalTrials.gov [24]. For some trials, it includes trial results, with the list of ADE observed in the various patient groups of the study. Today, trial registries are used for systematic reviews [25] and network meta-analyses [26, 27], comparing several treatments by chaining trial results. But the efforts to standardize information from trials have not yet resulted in improvements in the dissemination of trial evidence [9].
Similarly, in drug safety, many works focused on clinical data collection from EHR and hospitals, but a recent review [28] highlighted that most of these works focused on extracting, representing and integrating information, rather than the use and the dissemination of this information. For instance, C. Zhan et al. applied computational methods to prescription data for detecting ADE signals [29]. On the contrary, clinical trial data is mostly analyzed with statistical methods, and few computational methods were proposed.
A few pioneering works focused on the direct use of trial data. I. Atal et al. proposed a visual approach for viewing on a mapping the research effort and the health needs of low-income regions [30]. J. Warner et al. proposed a network visualization of chemotherapy treatment regimens [31]. Z. He et al. proposed the use of text mining, bar charts and diagrams for the analysis of clinical trial target populations [32]. Finally, J. Sjöbergh et al. combined maps, parallel coordinates and diagrams for visualizing the individual patient data in a single trial [33].
Ontologies and semantic web technologies consist of formal and unambiguous models; they have been widely applied to the medical domain [34]. An ontology was proposed for structuring clinical trial data, named OCRe [35]. However, this ontology is very complex, and no tool exists for the automatic population of the ontology from trial registries.
2.2 Multidimensional visualization techniques
Many techniques exist for the visualization of multidimensional numeric data; in this section we will briefly review the three main approaches. First, dimension reduction consists of reducing the number of dimensions to 2 or 3, at the price of an information loss. Then, the data can be visualized using a simple scatter plot. The main dimension reduction techniques are Principal Component Analysis (PCA), Multidimensional Scaling (MDS) [36], Self-Organizing Map (SOM) [37] and t-distributed Stochastic Neighbor Embedding (t-SNE) [38]. Dimension reduction techniques are particularly useful for grouping similar items in clusters. t-SNE is commonly used in bioinformatics, e.g. for the visualization of transcriptomic [39], but in medicine, it was also used for the classification of patients with Parkinson’s disease [40].
Second, parallel coordinates [41] consist of representing each dimension by a parallel axis (usually vertical), and each data point by a broken line that crosses each axis at the corresponding value of the point in that dimension. Parallel coordinates are often associated with interactive interfaces allowing the selection of a subset of data points. They are particularly good at facilitating the discovery of patterns across the dimensions. Recently, parallel coordinates were proposed for the study of exposure to oxides of nitrogen and its relation to adverse birth outcomes [42]. Other applications include the visualization of multi-omics networks [43].

Third, glyphs consist of representing each data point by a small icon called a glyph, and each dimension by a characteristic of the glyph, e.g. the length or the color of a given element [44]. Two kinds of glyphs can be distinguished: metaphoric glyphs that aim at looking like a common object, often related to the data visualized but not necessarily, and abstract glyphs that are geometric construction with no similarity to any common object. An example of metaphoric glyph is Chernoff’s faces [45]: these glyphs look like human faces. An example of abstract glyph is the “stardinates” [46] or star glyphs [47] (see examples in Figure 1), which are similar to parallel coordinates but with the coordinates organized in a star. Each dimension is represented by an axis that crosses at the center, and each data point is represented by a polygon. Contrary to parallel coordinates, each data point is represented in a separate glyph. Flower glyphs [48, 49, 50, 51] are close to star glyphs but follows a “flower” metaphor : each glyph is a flower having one petal per dimension, the size of the petal being proportional to the value of the data point in that dimension. An interest of flower glyphs is that they are less dependent on the order in which the dimensions are displayed. In Figure 1, glyphs A and B are the same but the order of the dimensions differs. Notice that A and B have the same inner area with flower glyphs, but not with star glyphs.
3 Materials and methods
3.1 Materials
Clinical trials were searched and extracted from ClinicalTrials.gov. We focused on pain, but we also considered fever, because of the large overlap between the two, both in terms of symptoms (fever is often associated with pain) and drugs (e.g. paracetamol and ibuprofen are both antipyretics and painkillers). We used the following query: Condition (i.e. “pain” or “fever”) + Completed Studies + Studies With Results + Phase 3 or 4. Searches were performed on the 18th January 2020.
From the resulting list of trials, we manually excluded: (1) trials not involving the treatment of pain or fever (e.g. trial evaluating the pain associated with the injection of a given vaccine, in which pain is an outcome measure but not an indication, or trials focused on insomnia caused by chronic low back pain), (2) trials whose protocol does not allow comparing treatments (e.g. trials comparing two care protocols where each patient in a group did not receive the same treatment, or trials during which drug labeling errors occurred), (3) trials testing non-drug treatment (e.g. behavioral training or surgery), (4) trials testing homeopathic drugs, (5) trials where pain is treated by disorder-specific drugs (e.g. chest pain caused by angina pectoris and treated by cardiac drugs), and (6) trials testing anesthetic agents or painkillers used during surgical operation. Trials comparing a drug treatment with a non-drug treatment were included, but only the groups receiving drug treatments were considered in the present study.
3.2 Ontology modeling
We designed an ontology of pain treatment ADE in clinical trials. Its purpose was not to fully model the domain of clinical trials, as does OCRe for example. On the contrary, it aimed at being a simple model, limited to the needs of data mining of ADE, and allowing us to handle ADE data as semantically linked data. The use of the ontological formalism was motivated by the reuse of existing tools designed for ontologies, and by the fact that ontologies are good at dealing with inheritance, i.e. various levels of granularity. Here, we widely used inheritance in the modeling of indications (e.g. post-vaccination fever is more specific than fever) and active principles (e.g. ibuprofen is more specific than NSAI, Non-Steroid Anti-Inflammatory drugs). This will allow querying the ontology at various levels of granularity.
In the ontology, the central class, Group, represents a group of similar patients, receiving the same treatment(s) for the same indication. ADE are observed in groups. On the contrary, individual patients are not present in the ontology. ADE were classified in 2 levels of seriousness and 13 categories, including 12 anatomo-functional categories and 1 “Unclassified” category for general symptoms (such as fatigue or unspecified infectious diseases). These categories are more general than the 27 MedDRA top-level System Organ Classes (SOC). A given ADE was allowed to belong to more than one category, e.g. allergic rhinitis belongs to both respiratory system and blood and immune system.
We manually mapped the MedDRA terms to these 13 categories. Most MedDRA SOC could directly be mapped to a single category (e.g. respiratory system). However, the “Investigations” SOC required more work, in order to associate each abnormal test result to the right category (e.g. “Tidal volume decreased” was associated with the respiratory system category).
3.3 Ontology population
The pain treatment ADE ontology was populated from ClinicalTrials.org XML data, using a semi-automatic process. In ClinicalTrials.org, trials, groups and ADE observations are well structured, and ADE are classified according to the 27 System Organ Class (SOC) of the MedDRA terminology, and in 2 classes of seriousness (serious vs non-serious). In most cases, the ADE label corresponds to a MedDRA term. Consequently, we automatically extracted and inserted these pieces of data in the ontology, using Python scripts.
On the contrary, the treatments received by the patient groups are not coded in ClinicalTrials.org, but only present in free-text fields. Similarly, the precise indications of these treatments are available only in free text; although MeSH (Medical Subject Headings) terms are provided, they often remain too general (e.g. pain without more precision). Thus, treatments and indications cannot be extracted without a manual intervention.
We wrote Python scripts for extracting the free-text values, and automatically recognizing named entities and dose regimens. The output was formatted in CSV files (Comma-Separated Values). Then these files were opened in a spreadsheet software (LibreOffice Calc) and manually reviewed by a pharmacist working in medical informatics (JBL). The entire process took about 1 month.
A first script aimed at automatically detecting the names of active principles (using a list extracted from UMLS, Unified Medical Language System), their dose, dose unit and number of intakes per day (using regular expressions targeting common expressions such as “bid” : bis in die, i.e. twice per day). A second script aimed at automatically extracting indication, from trial summary, description and MeSH terms. We measured the performance of the two scripts, by comparing the data extracted automatically by the scripts with the same data after correction during the manual review.
When coding doses and numbers of intakes per day, we allowed the use of a range with a minimum and a maximum value (e.g. 5-10 mg or 1-2 intakes per day). In addition, when the dose varied over time, we kept only the maintenance dose.
The active principles and indications identified were added to the ontology, and hierarchically structured. Active principles were classified according to three dimensions: chemical structure (e.g. steroid), pharmacological activity (e.g. antihistamine) and main indication (e.g. anti-epileptics). Indications were classified according to four dimensions: anatomy (e.g. musculoskeletal pain), etiology (e.g. neuropathic pain), chronicity (i.e. chronic or acute pain) and severity (i.e. mild, moderate or severe pain). These classifications were highly inspired by existing terminologies such as ATC (Anatomical Therapeutical Chemical classification of drugs) or ICD10 (International Classification of Diseases, release 10).
ADE terms were extracted from ClinicalTrials.gov and automatically mapped to MedDRA terms using their textual English label. When no corresponding MedDRA term was found, the term was simply associated with the MedDRA SOC present in ClinicalTrials.gov. While more general, the SOC still permits relating the ADE to one of our 13 categories of ADE.
Several trials include a titration period, mainly for opioid painkillers. A typical design study for comparing a given opioid with a placebo is as follows: an open-label titration period with the test drug, including all patients, then randomization followed by a maintenance period with two groups, one taking the test drug and the other taking a placebo. In this case, we chose to include in the ontology the ADE observed during the titration period, but without mixing them with those observed in the maintenance period, because there is no titration period for placebo and thus no comparison is possible.
The ontology population was performed by a pharmacist working in medical informatics (JBL), and took about 1 month.
3.4 Ontology querying
We designed a query procedure for searching the ontology. The procedure takes as input one or more group definitions. Each group definition may include criteria regarding the trial (e.g. restrict to randomized trials), the indication (e.g. restrict to cancer pain) and the active principles (e.g. opioid or morphine). The ontology allows the use of various levels of granularity in the formulation of the query, as in the latter example. Several active principles may be mentioned for a given group (corresponding to a bi- or tritherapy), and, for each, a specific release (immediate or modified), range of dose (e.g. 5-10 mg) and number of intakes per day (e.g. 1-2 times per day) may be specified.
In addition, we considered two particular situations when querying on active principles. First, we also allowed an “open list” search, that returns groups with the active principles queried possibly in association with others, e.g. morphine alone or associated with any other active principle. This “open list” search comes in addition to the usual “closed list” search, which is the default. Second, it is sometimes interesting to perform a comparison between two treatments defined at different levels of granularity, e.g. to compare tapentadol vs opioids. In this comparison, “opioids” implicitly means “opioids other than tapentadol”, since tapentadol is an opioid. Thus, we also supported exclusion in the search process.
For a single query, the procedure returns three sets of results. The first one, direct comparisons, includes only direct comparisons, i.e. trials in which all the groups queried are present. The second one, direct and indirect comparisons, includes both direct comparisons and indirect comparisons via placebo, i.e. trials in which only some of the groups queried are present, and where a placebo group is present for performing an indirect comparison normalized by placebo (see next section). The third one, absolute values, includes all trials containing at least one of the groups queried, without any correction or normalization.
As a consequence, the first result set (direct comparisons) has the fewest number of trials and patients but the highest data quality. On the contrary, the third result set (absolute values) has the highest number of trials and patients but the lowest data quality. The user may choose the desired result sets, e.g. one may use the direct comparisons and defaults to the other result sets when there are not enough patients.
3.5 Data correction and normalization
We implemented three data correction and normalization methods. First, per-trial number of patients correction was implemented for direct comparisons when more than one trial is involved in the comparison. For example, let us consider two trials and , both comparing two drugs and . includes 100 patients treated with and 100 patients treated with , and includes 100 patients treated with but 200 patients treated with . Without correction, a higher weight is given to the group -, since patients are more numerous in this group. This is a potential bias if is at higher (or lower) risk of ADE, e.g. because the trial involves post-vaccination fever and the vaccine may cause additional ADE. Consequently, we need to normalize the data.
We propose to reduce the weight given to each group using a correction factor, so as the weight given to each group is equivalent to the weight of the smallest group in the same trial. In the previous example, the correction factors will be 1.0 for groups -, - and -, but 0.5 for -. This gives an equivalent weight to for both and . In the general case, for a trial with groups to , the correction factor for group is:
where is the number of patients in the group with drug in trial .
When computing the correction factor , we used the minimum group size and not the average, because using the average would reduce the weight of the larger groups but also increase the weight of the smaller groups. In case of very small groups, using the average would give a disproportional importance to the rare events occurring in these small groups (e.g. 1 stroke in a group of 10 patients). On the contrary, using the minimum ensures that no patient counts for “more than one”.
Second, placebo normalization was implemented for indirect comparisons. In indirect comparisons, the number of ADE observed needs to be adjusted according to the number of ADE observed in placebo groups. For example, let us consider an indirect comparison between two drugs and , using two trials and . In , is compared to placebo , and, in , is compared to , each group including 100 patients. Let us consider , a given ADE, e.g. vomiting. We denote by the number of occurrences of in trial in the group taking drug . Let , , , . These numbers suggest that, despite more vomitings were observed with than , is at lower risk of causing vomiting because it caused as much vomitings as placebo, while caused more. In facts, the difference observed between and is partially due to the difference in clinical conditions between and .
Here, the average rate of in the placebo group is . But, in , the rate of in the placebo group is , thus there is another missing. Adding these to the rate of in the leads to a corrected number of occurrences of . Similarly, for in trial , the corrected number of occurrences will be .
In the general case, the corrected number of occurrences of for the group is:
where is the number of trials, is the average rate of in placebo over all trials, and the average rate of in placebo in the considered trial .
Third, when direct and indirect comparisons are mixed, we need to ensure that the proportion of patients coming from direct comparisons is the same in each of the compared groups. Let us consider a mixed comparison between two drugs and , including (direct comparison) with , , , , but also two indirect comparisons: with , and with , (after applying the placebo normalization described above). Despite the fact that is associated with lower ADE rate than in both direct () and indirect ( vs ) comparisons, the uncorrected mean ADE rate is higher for () than for (). Actually, it gives a higher weight to for , and is associated with a higher overall rate of ADE (possibly due to the trial conditions).
We correct the data as follows. We compute the overall indirect / direct patient ratio . In the previous example, . Then, for each of the compared group , we weighted the direct comparisons with a factor and the indirect comparisons with a factor in order to obtain a ratio equal to . Let us note and the number of patients in the direct and indirect comparisons for group , respectively. We have:
As previously, the weight given to a patient cannot be higher than 1. In the previous example, we have , , and .
3.6 Visual analytics
Let us consider a 26-dimensional numeric dataset, with 2 dimensions for each ADE category, one for all ADE in the category and the other for serious ADE only. In this dataset, each group of similar patients in the query corresponds to a data point. We chose glyphs for the visualization of the dataset, because they are particularly efficient for identifying differences between data points. Moreover, dimension reduction techniques would imply an important information loss (see section 2.2), and parallel coordinates consider each dimension in the same way, while our 26 dimensions are organized in corresponding to the 13 ADE categories and the 2 levels of seriousness.
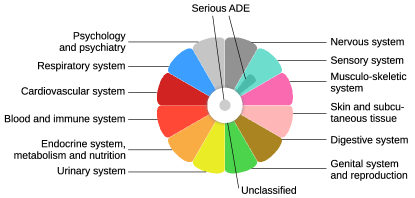
We adapted flower glyphs for visualizing the per-category and per-seriousness level rates of ADE observed in a group. Unclassified ADE are represented by a white circle at the center of the flower, and each of the 12 remnant categories is represented by a colored petal. Both the position of the petal and its color were chosen in order to facilitate the understanding and the memorization of the category. For example, nervous system is at the top and in gray (think of the brain and the “gray matter”), while the urinary system is in yellow at the bottom. When no “obvious” colors were available, arbitrary colors were used, e.g. green for genital system and reproduction. Figure 2 shows the structure of the flower glyph and the color and position of the 13 ADE categories.
Contrary to what was found in the literature, we encoded the ADE rate by the area of the petal, and not by its length. The area of the center circle and the petals is thus proportional to the observed rate of the corresponding ADE (including both serious and non-serious ADE). When present, serious ADE were represented by a darker central circle or a darker smaller petal. The area of this darker region is proportional to the observed rate of serious ADE in the given category.
This flower glyph takes advantage of the ability of the human vision to distinguish at least 12 directions, as in an analog clock, and its higher sensitivity to area rather than to distance [56]. In addition, compared to a bar chart, the overall triangular shape of petals associated with area proportionality allows giving more attention to small values, i.e. if the rate of ADE is multiplied by 2, the length of the petal is multiplied by less than 2, because the area increases faster than the length. This acts similarly to a logarithmic scale, although not logarithmic from a mathematical point of view. Consequently, small values remain visible when much higher values are present.
We added interactivity to flower glyphs, as follows. When the mouse is over a region (the central circle or a petal), a popup bubble displays the ADE category label and the associated rate of ADE and serious ADE, with the most frequent ADE and serious ADE in the category. When the mouse is clicked, the webpage is scrolled down to display the entire list of ADE in this category. Finally, when several glyphs are present, we added a (delta) button. When this button is mouse-hovered, the outline of the selected glyph is drawn as a wire frame over the other glyphs, in order to facilitate comparison.
3.7 Implementation details
The search procedure was implemented with Owlready, which translates the query into an SQL query. The visual analytics was implemented in a web platform, using Python 3 with Flask and Owlready, web technology (HTML, CSS) and Brython, a client-side Python interpreter.
3.8 Use cases and expert opinions
Several use cases were designed for the platform. Most of them were focused on trying to find back already known results, e.g. from meta-analysis, in order to validate our approach. An additional use case was designed by selecting an indication in the ontology and comparing the available drugs, in order to search for possible new insights.
The proposed platform was presented to four experts in drug safety, from the French drug agency (Agence Nationnale de Sécurité du Médicament et des produits de santé, ANSM), using the use cases. Then, the comments, opinions and suggestions of the experts were collected during a focus group session.
4 Results
4.1 The ontology of pain treatment ADE
Figure 3 shows the general model of the pain treatment ADE ontology, in UML (Unified Modeling Language). In this model, Group is the central class and represents a group of similar patients, in terms of clinical conditions and treatments received. A clinical trial contains one or more periods; most trials either include a single period or an open-label titration period followed by a maintenance period. A few also include an open-label continuation or pick-up period. Each period includes one or more comparable group. Each group has one or more drug treatments, prescribed for one or more indications. ADE are observed in groups, and are associated with a MedDRA term and a seriousness Boolean status. 18,090 ADE terms were extracted from ClinicalTrials.gov. 17,304 (95.7%) were automatically mapped to MedDRA terms using their label, the others being associated with the MedDRA SOC present in ClinicalTrials.gov. ADE with the same MedDRA term may differ in seriousness, e.g. diarrhea might be serious for newborns but not for adults. Finally, each MedDRA term is associated with one or two of the 13 ADE categories.
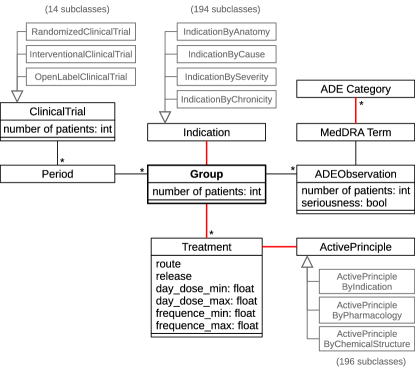

Inheritance is present at three levels: ClinicalTrial, Indication and ActivePrinciple. Notice that OWL ontologies allow multiple instantiation in addition to multiple inheritance, i.e. a given clinical trial can belong to several classes, e.g. RandomizedClinicalTrial and InterventionalClinicalTrial. In Figure 3, relations in red were extracted from ClinicalTrials.org semi-automatically, with manual intervention, while those in black were extracted automatically.
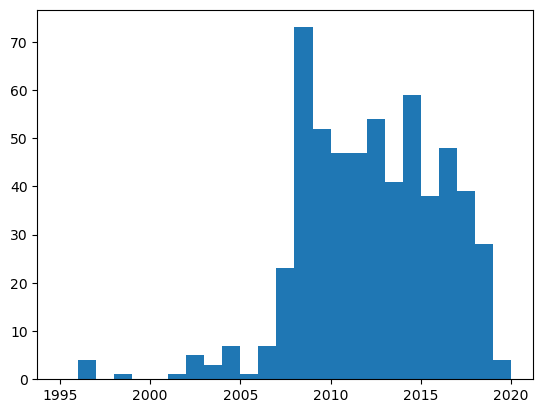
Figure 4 shows the selection and exclusion of clinical trials during the study. 582 clinical trials were included. In addition to the criteria mentioned in section 3.1, one trial was excluded because results data was not present in ClinicalTrials.gov (investigators lost data during flooding, NCT01401049), and two trials because they contain only results related to efficacy. Figure 5 shows a histogram of the completion date of the selected trials. Most trials were completed after 2007.
During the ontology population, 1,394 groups were extracted with 1,653 individual drug treatments (a group may have several treatments, e.g. 2 in case of a bitherapy). The Python script extracted the right indication for 77.3% of the groups, the right severity for 97.1%, and the right chronicity for 71.2%. It also extracted the right active principle for 77.7% of the individual drug treatments, the right release for 90.1%, the right route for 70.3%, the right dose for 55.3%, the right dose unit for 61.4%, and the right number of intakes per day for 74.2%.
The resulting ontology includes 582 trials, 1,354 groups and 157,665 patients, 201 active principle classes, 194 indication classes, and 148,843 reported individual ADE. It was formalized in OWL 2.0 and saved in RDF/XML, and it contains 299,341 RDF triples. The ontology is publicly available at http://www.lesfleursdunormal.fr/static/appliweb/pain/pain_onto.zip.
4.2 The data mining web platform
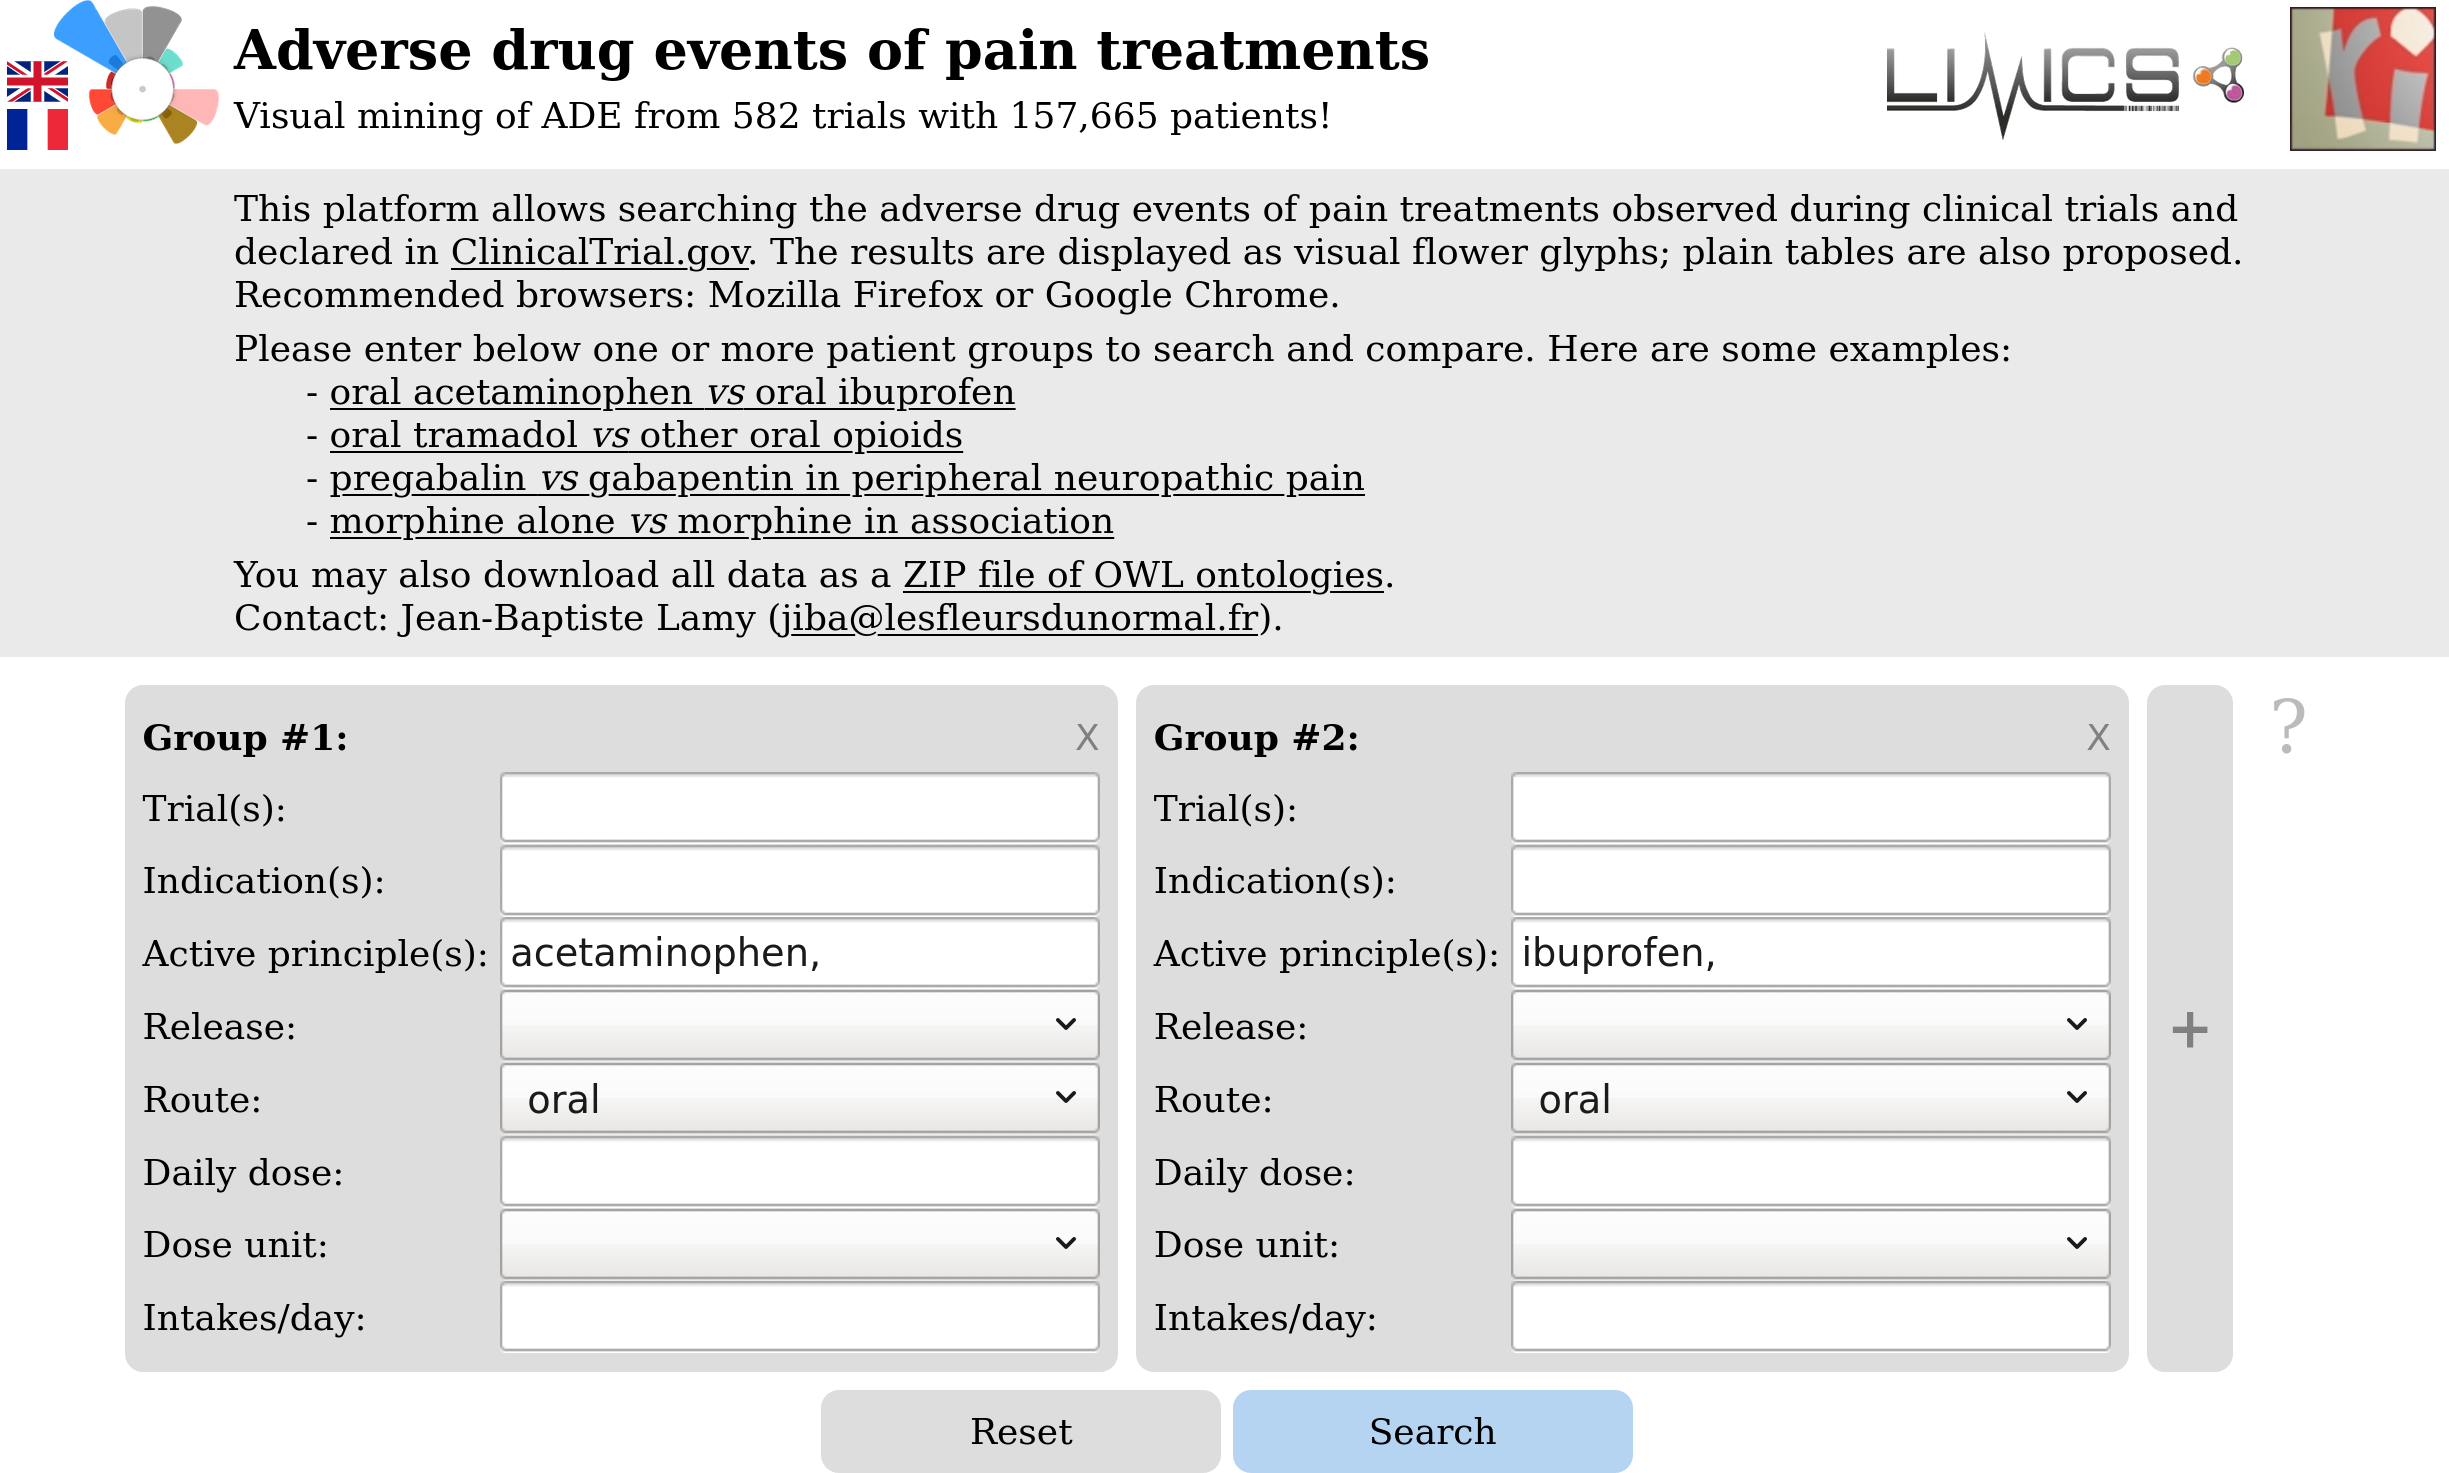
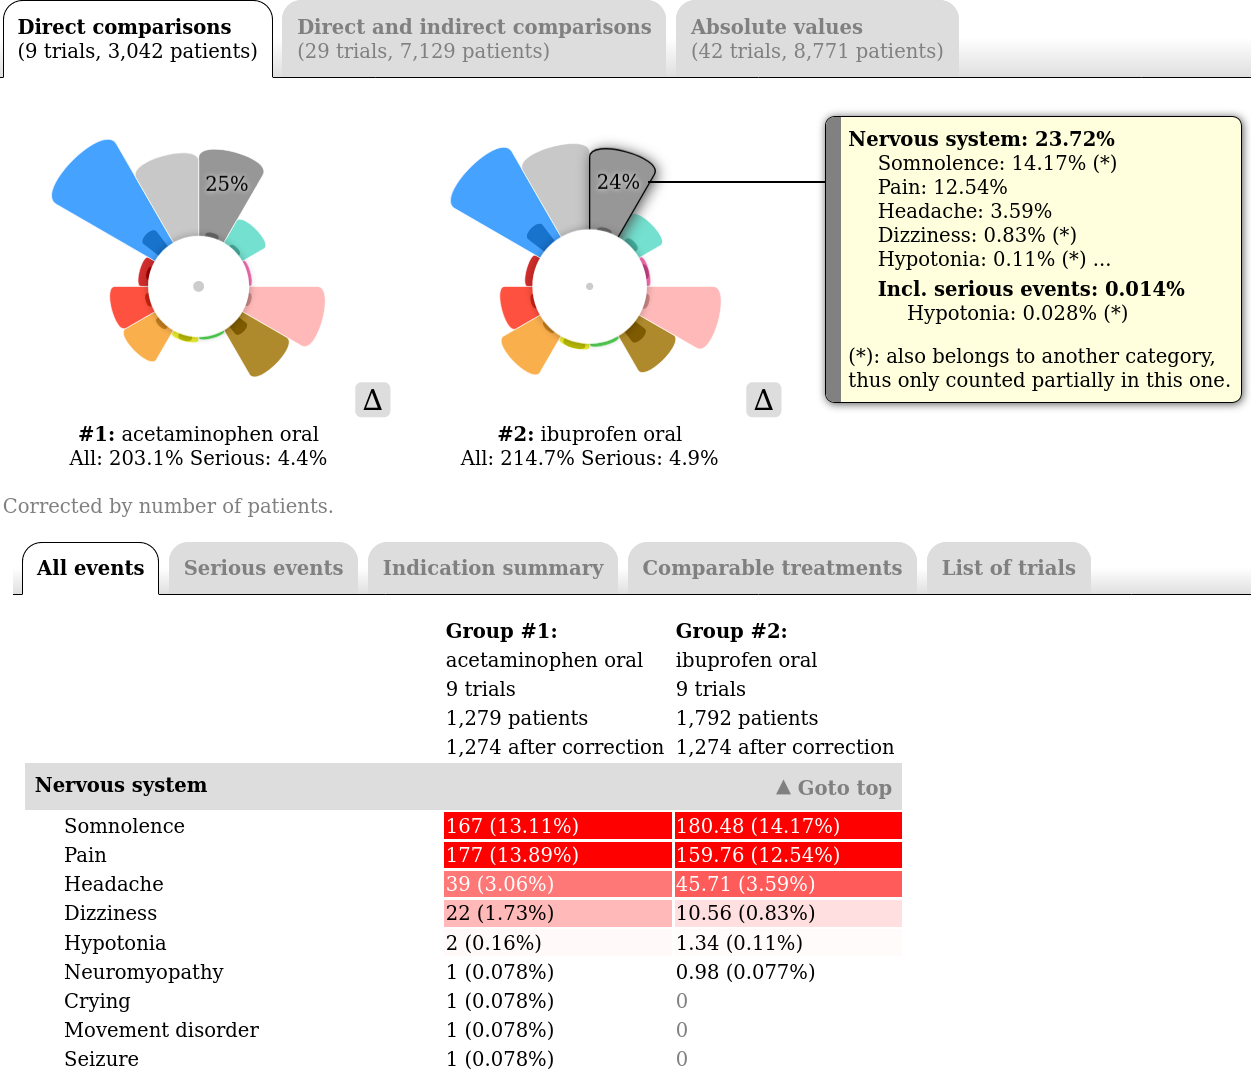
The proposed platform is available online at http://www.lesfleursdunormal.fr/appliweb/pain, and is fully bilingual (English and French). It has been tested with both Mozilla Firefox and Google Chrome. Figure 6 shows a screenshot of the search interface. The user can enter one or more groups. Each group may contain one or several comma-separated classes of trial, indication and active principle. Auto-completion is used for facilitating the entry of trial types, indications and active principles, and the entire hierarchies can be displayed by clinking on the field labels. If several active principles are entered for a given group, the per-drug fields (i.e. release, route, daily dose, dose unit and intakes/day) are subdivided with one field for each active principle. In the results, each group will be displayed in a separate flower glyph. In Figure 6, the user defined two groups: “oral acetaminophen” and “oral ibuprofen”.
When entering active principles, the “etc” special label can be used for defining an “open list” of active principles, e.g. “morphine, etc” for any treatment that includes morphine (possibly with other active principles). In addition, when a group’s active principles are more general than a previous group, we automatically exclude the results of the more specific group from the result of the more general group. For example, when comparing tapentadol with opioids, the search will automatically consider “opioids other than tapentadol” (labeled “other opioid” in the results, for brevity).
Figure 7 shows a screenshot of the results interface, after the user performed the query shown in Figure 6. The results interface includes three parts, organized vertically. First, the three tabs at the top of the screen allows selecting the result sets: direct comparisons, direct and indirect comparisons, or absolute values. The first one includes only trials with all searched groups, the second one also includes trials with only some of the queried groups and a placebo group allowing adjusting the ADE observed according to the values observed for the placebo (as explained in section 3.5), and the third one includes all groups found independently from the trial they belong to, without any corrections. The number of trials and patients increase from the left to the right tab, but the quality of the data decreases. The “absolute values” result set is surely not sufficient for drawing conclusions; however, it is very useful for confirming or invalidating the conclusions observed in the other result sets, or for obtaining general trends when the other result sets are not available.
Second, flower glyphs display the rates of the various categories of ADE, for each group. The user can mouse over the region of the glyph to obtain more detail in a popup bubble, or click to scroll down to the entire list of ADE in the chosen category. At the bottom right of the glyph, the button allows drawing the outline of the select glyph on top of the other glyphs. This permits fine comparison and facilitates the identification of small differences. At the bottom of the flower glyphs, a line of text summarizes the corrections that were applied to the data.
Notice the very high ADE rates shown in Figure 7: more than 200%, i.e. more than 2 ADE per patients on average. These rates correspond to the number of events observed during trials, but may not correspond to the real rate of ADE caused by the drug in normal clinical use: of course, the ADE rate of acetaminophen and ibuprofen is not 200%. In particular, the ADE may be observed during a long period (several months or even years, i.e. for acetaminophen and ibuprofen, some trials on post-vaccination fever cover all vaccinations during childhood), and the events observed may be due to the drug taken, but also to the patient disorders or the conditions of the trial (e.g. ADE may be caused by the vaccine in the previous example) and to random hazards (e.g. an infection may occur during the trial, unrelated to the treatment). However, the rates given by the platform are comparable for the “direct” and “direct + indirect” result sets, allowing the comparison of the various treatment options.
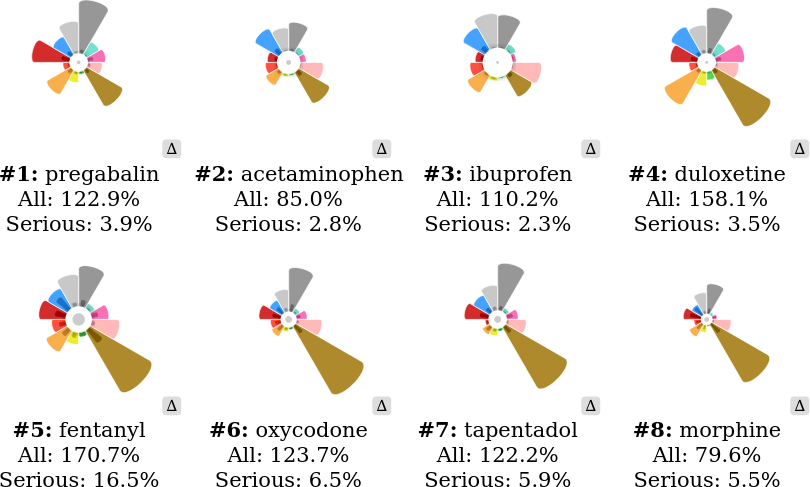
The size of the flower glyphs reduces when the number of glyphs increases. Figure 8 shows a “bouquet” of flower glyphs for the 8 most common pain treatments in the ontology. We can observe that digestive ADE are the most frequent, followed by neurologic ADE.
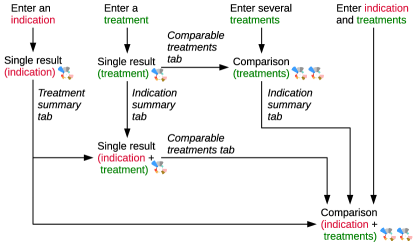
Third, a second set of tabs allows displaying various tabular information. The tabs are: (1) “All events”: this tab displays the entire list of all ADE, sorted by category and then by rate. Background reddish colors are used to represent frequencies visually, from white (0%) to red (5% or more) on a logarithmic scale. (2) “Serious events”: this tab is similar to the previous one, but displays only serious ADE. (3) “Indication summary”: this tab displays the indications of the selected trials, ordered by frequency. Radio buttons allow selecting one of the indications, in order to restrict the search to the chosen indication. (4) “Treatment summary”: this tab displays the list of treatments tested in the selected trials, ordered by frequency. It is present only if no active principles were entered in the query, e.g. the user may search for “cancer pain” and will find in this tab the most frequently tested treatments for cancer pain. Checkboxes allow selecting all or part of these treatments, with a button for performing a new search comparing the selected treatments in the previously entered indication. (5) “Comparable treatments”: this tab displays similar treatments used as comparators in trials, ordered by frequency. It is present only if active principles were entered in the query. For example, the user may search for “tramadol”, and will get in this tab the list of treatments compared to tramadol. Checkboxes allow selecting some comparable treatments, with a button for adding the selected treatment into the current search. (6) “List of trials”: this tab lists all the trials in the current result set, with links to pages displaying the ADE observed in each trial. It also displays the per-trial rate of ADE for each group, allowing the identification of outlier trials. Finally, it includes checkboxes, allowing the exclusion of some trials from the result set. Figure 9 shows several search strategies made possible using tabs 3-5.
4.3 Use cases
4.3.1 Acetaminophen vs ibuprofen
Acetaminophen, ibuprofen and aspirin are the three main OTC (Over The Counter, i.e. without medical prescriptions) painkillers taken by patients. However, aspirin is no longer recommended for such use. Thus, we found no recent trial involving aspirin as a painkiller. Figure 7 shows the direct comparison of oral acetaminophen vs oral ibuprofen, including 9 trials and 3,042 patients111Available online at http://www.lesfleursdunormal.fr/appliweb/pain? group_1_ap=acetaminophen&group_1_route=oral&group_2_ap=ibuprofen &group_2_route=oral. The results show slightly fewer ADE with acetaminophen (203.1% vs 214.7%), as well as for serious ADE (4.4% vs 4.9%). In particular, acetaminophen is associated with fewer unclassified ADE (mostly fevers, 54% vs 70%). Nevertheless, the difference is low and probably not significant, and the ADE profile of both drugs is very similar. These results are consistent with a meta-analysis that concluded, 10 years ago, that acetaminophen and ibuprofen are equally safe [57], but the results presented here include more recent trials.
Two main indications are present in the “Indication summary” tab: post-vaccination fever in children and pain following dental extraction. Interestingly, separate analyses (easily available using the radio buttons in the tab) suggest that acetaminophen has fewer ADE in the former indication and ibuprofen in the latter.
4.3.2 Elagolix
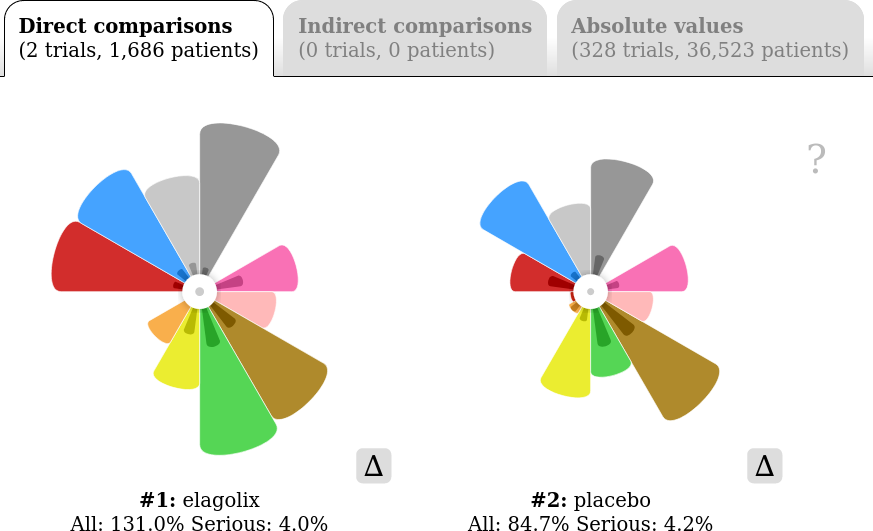
Elagolix is a gonadotropin-releasing hormone antagonist drug approved in 2018 in US, for the treatment of pain associated with endometriosis in women [58]. However, elagolix is known to be associated with frequent ADE such as hot flushes [59].
After searching for elagolix alone, the “comparable treatments” tab shows that elagolix was only compared with placebo, during two trials. The tab’s checkbox permits the addition of placebo to the query, leading to Figure 10222Available online at http://www.lesfleursdunormal.fr/appliweb/pain? group_1_ap=elagolix&group_2_ap=placebo. We can clearly see that the ADE rate is higher for elagolix, especially for cardiovascular and genital/reproductive ADE (corresponding to the red and green petals). In particular, elagolix is associated with 34% risk of hot flush (classified in both cardiovascular and genital/reproductive ADE categories, and thus counting for half in each) and a 5.6% risk of amenorrhea. For placebo, these risks are 8.6% and 0.27%, respectively. These values can be easily obtained in the petal popup bubbles. These results clearly illustrate the high ADE rate with elagolix.
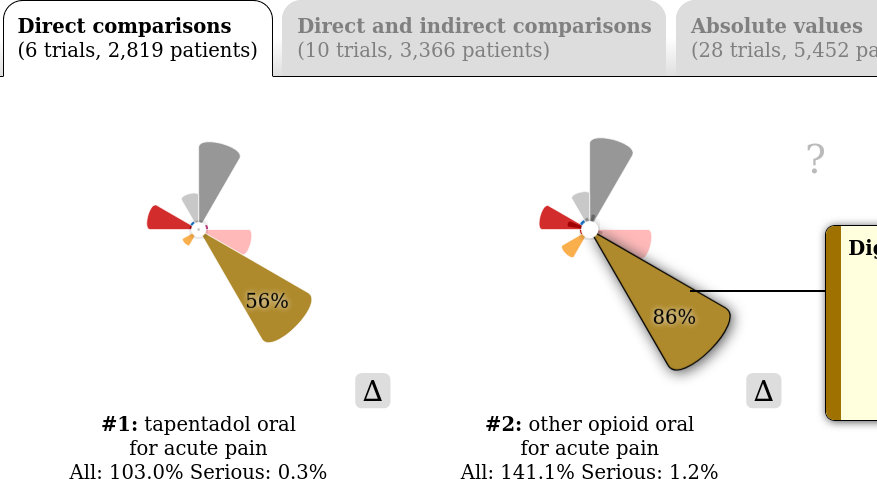
4.3.3 Tapentadol
As said in the introduction, a recent meta-analysis showed that tapentadol was associated with less digestive ADE than other opioids when prescribed for acute pain [8]. Figure 11 shows the direct comparison of oral tapentadol with other oral opioids333Available online at http://www.lesfleursdunormal.fr/appliweb/pain? group_1_indication=acute pain&group_1_ap=tapentadol&group_1_route=oral &group_2_indication=acute pain&group_2_ap=opioid&group_2_route=oral. Six trials were found, involving 2,819 patients. On the flower glyphs, we can clearly see the difference in digestive ADE (56% vs 86%).
Contrary to the meta-analysis, the other opioids involved in the comparison are not limited to a single option, but include both oxycodone and morphine, as shown in the “Treatment summary” tab. One may perform additional searches to compare tapentadol to oxycodone and morphine separately, showing that tapentadol has fewer digestive ADE in each comparison.
4.3.4 Tramadol
Tramadol is an opioid painkiller used to treat moderate pain. It is classified as a level-2 painkiller (out of 3 levels). Tramadol was considered as having fewer risks of ADE compared with other more powerful opioids. However, it appeared that tramadol was involved in an important number of ADE, including serotoninergic syndrome [60], vomiting and sleep disorders, and was at risks of misuses and dependence. A recent study involving Egyptian students showed that 12.3% of them were taking tramadol, and that 30% of the tramadol-consumers had dependence [61]. Another study showed that patients receiving tramadol after surgery had similar, or even higher, risks of prolonged opioid use compared with patients receiving other opioids [62]. In France, the French drug agency (Agence Nationale de Sécurité du Médicament et des produits de santé, ANSM) recently published a communicate444“TRAMADOL : une mesure pour limiter le mésusage en France - Point d’information”, 16/01/2020, https://www.ansm.sante.fr/S-informer/Points-d-information-Points-d-information/TRAMADOL-une-mesure-pour-limiter-le-mesusage-en-France-Point-d-information, and reduced the maximum prescription duration for tramadol, from 12 to 3 months.
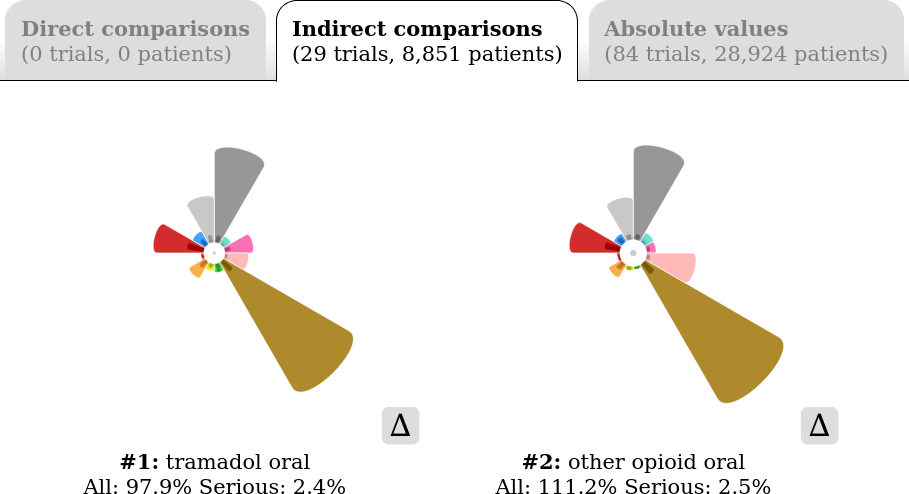
Figure 12 shows the comparison of oral tramadol with other oral opioids555Available online at http://www.lesfleursdunormal.fr/appliweb/pain/? group_1_ap=tramadol&group_1_route=oral&group_2_ap=opioid&group_2_route=oral. Here, no direct comparisons were found; this was expected since tramadol is not considered as comparable with level-3 opioids like morphine. The indirect comparison result set, normalized by placebo, includes 29 trials (5 for tramadol and 24 for other opioids) and 8,851 patients. It clearly appears that the ADE profile of tramadol is very similar to the one of other oral opioids, with a high ADE rate and many digestive and nervous ADE. This supports the facts that tramadol is potentially as dangerous as other opioids.
On the contrary, when looking at the details of the psychological ADE, no occurrences of drug abuse were found for tramadol. But this may be due to the conditions of clinical trials, which often have relatively short durations, and very controlled doses and protocols that limit the risk of drug abuse. Moreover, certain trials may exclude participants with a history of substance abuse.
4.3.5 Peripheral neuropathic pain and gabapentinoids
Peripheral neuropathic pain is a pain caused by damages to peripheral nerves. Typical causes of damages are diabetic neuropathy, postherpetic neuralgia and trauma. The 2010 guidelines on the pharmacological treatment of neuropathic pain [63] from EFNS (European Federation of Neurological Societies) recommends duloxetine, pregabalin, gabapentin, tricyclic antidepressants or venlafaxine as first-line treatment for painful polyneuropathy (including diabetic neuropathic pain) and pregabalin, gabapentin, tricyclic antidepressants or lidocaine for post-herpetic neuralgia. In 2015, a systematic review and meta-analysis recommended gabapentin, gabapentin enacarbil, pregabalin, duloxetine, venlafaxine or tricyclic antidepressants as first-line treatment for neuropathic pain in adults [64]. In 2013, a meta-analysis concluded that gabapentin has the most favorable balance between efficacy and safety for diabetic neuropathic pain [27], but since this study did not analyze efficacy and safety separately, it is difficult to know whether this conclusion is due to efficacy, safety or a mix of both.
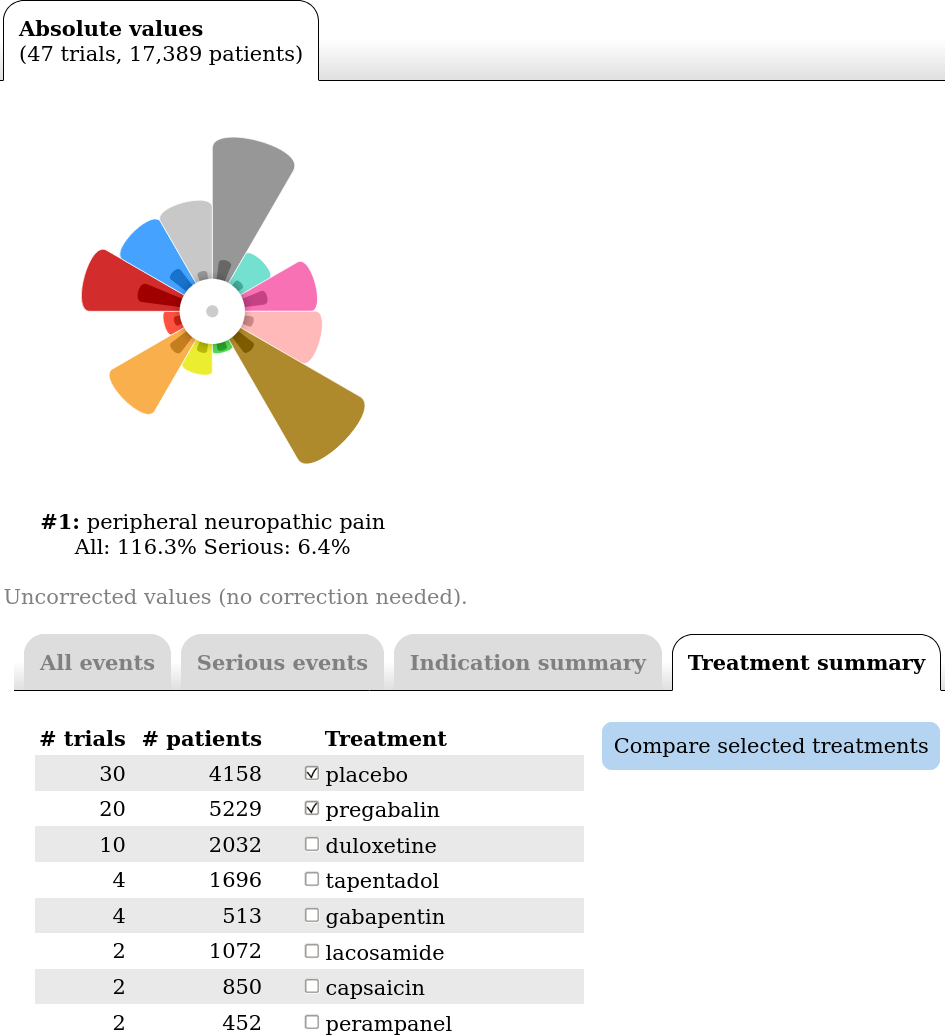
Figure 13 shows the results obtained when searching for “peripheral neuropathic pain” in the platform666Available online at http://www.lesfleursdunormal.fr/appliweb/pain? group_1_indication=peripheral neuropathic pain. It shows the ADE caused by all drug treatments prescribed for peripheral neuropathic pain in the ontology. The “Treatment summary” tab can be used for finding the most prescribed active principles in that indication.
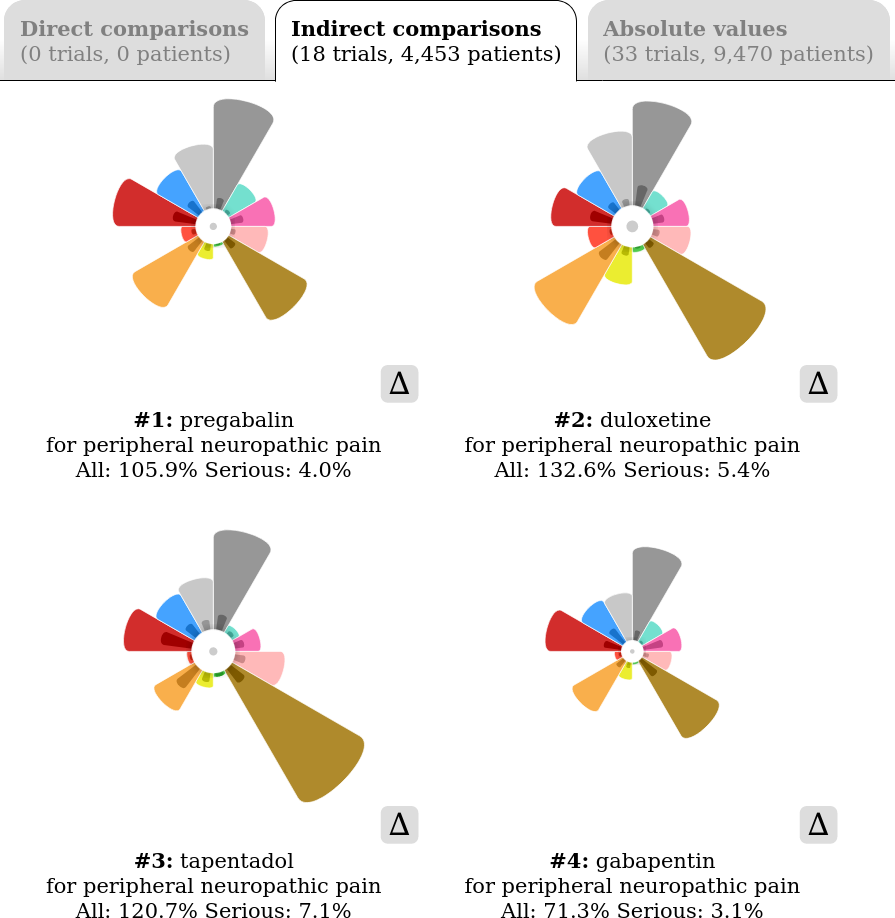
Figure 14 shows the indirect comparison obtained after selecting the first four treatments in the “Treatment summary” tab (excluding placebo)777Available online at http://www.lesfleursdunormal.fr/appliweb/pain? group_1_indication=peripheral neuropathic pain,&group_1_ap=pregabalin &group_2_indication=peripheral neuropathic pain,&group_2_ap=duloxetine &group_3_indication=peripheral neuropathic pain,&group_3_ap=tapentadol &group_4_indication=peripheral neuropathic pain,&group_4_ap=gabapentin. There are 12 trials for pregabalin, 3 for duloxetine, 2 for tapentadol and 1 for gabapentin (Notice that these numbers are lower than those shown in Figure 13, because only trials with a placebo could be included in the indirect comparison of Figure 14). We can see that all treatments are not equal in terms of ADE, despite the fact that three of them were recommended as first-line treatment (pregabalin, duloxetine and gabapentin). Duloxetine and tapentadol have the highest ADE rates, with a lot of digestive ADE for both, and of endocrine / metabolic / nutritional ADE for duloxetine, in addition to the nervous ADE present with all four treatments.
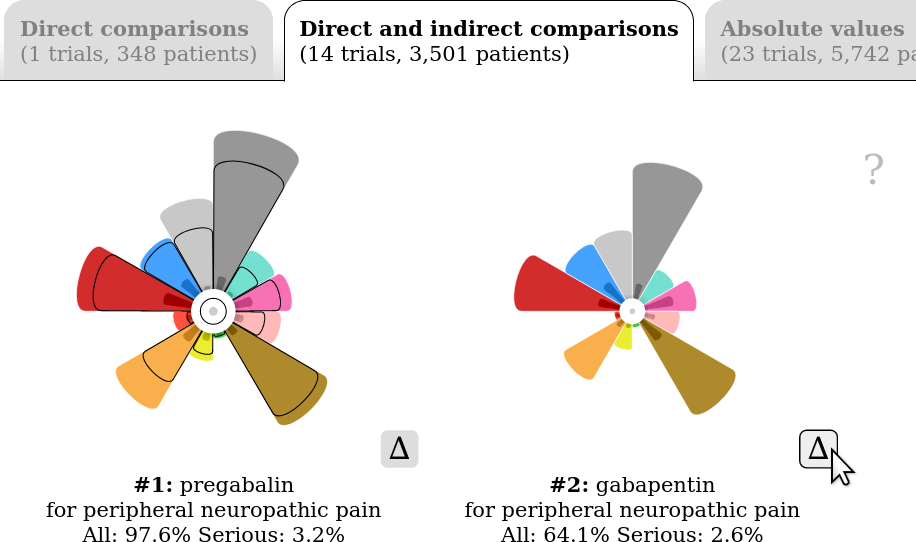
Pregabalin and gabapentin seems better tolerated. Both belong to gabapentinoids, a family of antiepileptic drugs which are also prescribed for pain. Their mechanism of action is not fully known, but an auxiliary subunit of voltage-gated calcium channels seems to be involved [65]. In Figure 14, gabapentin has the fewest ADE, but the evidence is weak because the gabapentin group includes only 1 trial and 221 patients. Figure 15 shows a direct and indirect mixed comparison of pregabalin vs gabapentin, including 13 trials for pregabalin and 2 for gabapentin (one trial compare pregabalin to gabapentin with no placebo, and was thus not present in the previous indirect comparison)888Available online at http://www.lesfleursdunormal.fr/appliweb/pain? group_1_indication=peripheral neuropathic pain&group_1_ap=pregabalin &group_2_indication=peripheral neuropathic pain&group_2_ap=gabapentin&tab=1. The flower glyphs show that both drugs have a similar ADE profile, but with fewer ADE for gabapentin (64.1% vs 97.6%). This suggests that gabapentin might be preferable in terms of safety. It also suggests that performing a comparative trial between pregabalin and gabapentin, or a network meta-analysis, may be a valuable study.
4.4 Expert opinions
The four experts were very interested by this work. They found the proposed platform innovative and original, both in its approach and its presentation. They agreed that trial data are insufficiently exploited today by computer programs, and they found the visual interface easy to understand and very nice.
They made several interesting suggestions. First, one expert asked for additional statistical computations, such as relative risks. Second, they suggested the use of the platform for approved drugs, but also before drug approval, in order to help regulators to take the decision to approve (or not) a new drug by comparing its adverse event profile with the other drugs already available in the same indication. Third, they also proposed to compare the adverse event profile of a given drug in various indications, when a drug is initially approved for an indication and then prescribed in others. For example, it might be interesting to compare the ADE of gabapentinoids when prescribed for epilepsy and for pain: since they were initially approved for epilepsy, their summaries of product characteristics (SPC) describe the ADE observed in epilepsy studies, but they might differ from those occurring when prescribed for pain. Finally, they suggested using the flower glyph to visualize the adverse effects described in SPC, and to compare them with those observed during clinical trials.
5 Discussion
In this paper, we described how ADE mentioned in publicly available clinical trial results could be integrated in a data mining platform for drug safety. This platform relies on semantic web technologies for allowing queries at various levels of granularity, and on visual analytics, and in particular flower glyphs, for the presentation of the results. We illustrated the interest of this approach through case studies, and we showed that we were able to find back results already known in the literature (e.g. regarding elagolix, tapentadol and tramadol) but also to suggest new results (e.g. on gabapentinoids) that would require further confirmation. The key points of this work are the original approach producing fact-based evidence on drug safety, by applying data science to trial data, and the association of semantic methods with visual analytics.
We found that there is a strong synergy between the semantic and the visual nature of the proposed data mining platform. The semantic nature allows searching the entire dataset in many ways, using the links and options proposed in the various tabs. The visual nature makes the platform ludic and enjoyable, thus giving the user the desire to test the many possibilities offered by the platform.
A potential problem in meta-analyses is the confirmation bias [66], i.e. the tendency to search for, interpret and favor information in a way that confirms the investigator hypothesis. Since meta-analyses are performed with a hypothesis in mind, this hypothesis might bias the process. On the contrary, in the present work, the selection of clinical trials and their coding were performed in a systematic manner, without aiming at answering a specific medical question. In addition, the query procedure and the visualization are fully automatic. As a consequence, this might reduce the confirmation bias.
The main limitation of the proposed approach is that it highly depends on the availability and the quality of clinical trial data. In particular, limited data are available for older drugs. For example, aspirin has been used for treating pain for long, but is no longer recommended. As a consequence, there is no recent trial involving aspirin as a painkiller, and thus we have no data in the proposed system. Thus our platform fails to identify the risks associated with the use of aspirin as a painkiller. Similarly, we have seen in section 4.3.4 that limited data was available for situations of drug abuse or drug overdose.
Another limitation is the training needed for using the proposed platform properly. The platform was presented to the experts during a guided tour. It includes contextual helps, but the ability of a naive user to understand it without the guided tour still need to be evaluated.
The performances of the automatic scripts for populating the ontology from the trial registry are not good enough to allow a fully automatic process. Consequently, an automatic update of the ontology is not possible. Most sophisticated Natural Language Processing (NLP) methods, e.g. Recurrent Neural Network (RNN) [67], might achieve better performances. These machine learning methods require a manually labeled training dataset, which was not available in our case. However, the ontology populated here could now be used as a training set, and, in future work, we plan to experiment RNN based NLP techniques.
The model we proposed for structuring trials matches the needs of pain treatments, but remains very limited. A more complex model would be required for generalizing the platform beyond pain treatment, e.g. a model able to represent chemotherapy regimen or time of drug intake. We designed specific classifications for indications and active principles, instead of reusing existing terminologies such as ATC, ICD10 or SNOMED CT. This was motivated by the known limits of publicly available classifications (e.g. ATC and ICD10 do not have multiple inheritance and thus would be more limited for searching) and the fact that more sophisticated terminologies are not publicly available (e.g. SNOMED CT in our country, France). Nevertheless, in the near future, we plan to map those specific classifications to existing classifications, such as ATC and ICD10.
In the literature, the closest use of flower glyphs is the work of Pilato et al. for the analysis of social sensing on Twitter [49]. The authors proposed flower glyphs with 7 colored petals and a center part, corresponding to various emotions (joy, fear,…). In the present work, we extended flower glyphs for the visualization of all vs serious ADE, using an inner, darker, petal. Color blind people may not be able to distinguish the various colors of flower glyphs. However, the information carried by the color is redundant with the information carried by the orientation of the petal, thus color blind people should still be able to use flower glyphs efficiently. Most colors on the flower glyph are culturally independent (e.g. red for blood). A notable exception is the color of the “skin and subcutaneous tissue” category.
The proposed platform is limited to descriptive and visual analysis, but does not perform statistical tests, e.g. in order to test whether a difference observed in ADE rate is significant or not. While theoretically feasible, implementing statistical tests raises a problem: each test is associated with a risk (usually 5%) and a risk , and multiplying the test cumulates these risks. It is commonly accepted that, above 5-10 tests, a correction is necessary. Therefore, we decided not to propose statistical tests for now. For indirect comparison, we used placebo as a reference. This works well for mild to moderate pain, however, for severe pain such as cancer pain, placebo may not be a valid option from an ethical point of view. In this case, other references should be considered, e.g. morphine.
6 Conclusion
In conclusion, we proposed a method and a platform for the analysis of adverse events observed during clinical trials, and published in trial registries. We applied the platform to pain treatment, and we showed that we were able to obtain results already known from meta-analyses, but also to suggest new insights. These results interested drug safety experts.
This work opens many perspectives for future research. First, the automatization of the ontology population from trial registries could be improved, e.g. using deep learning and text mining for extracting drug treatments and their indication. Second, the proposed system could be extended to the visualization of patient outcomes in trials, in order to evaluate drug treatment efficacy, or to other data sources, such as ADE declared in pharmacovigilance databases, or ADE observed in real-world prescription data such as health records and OHDSI (Observational Health Data Sciences and Informatics). In this context, the proposed system should be connected to a data warehouse, in addition to an ontology. Third, flower glyphs could be adapted to the presentation of the rate of potential adverse effects described in drug summaries of product characteristics (SPC) or patient leaflets. Fourth, the proposed approach could be applied to other medical domains beyond pain treatment. Finally, the use of the proposed web platform could be experimented in medical initial and continuing education, or associated with decision support tools for prescriptions.
References
- [1] D. J. Sheridan, D. G. Julian, Achievements and Limitations of Evidence-Based Medicine, J Am Coll Cardiol 68 (2) (2016) 204–13.
- [2] Moynihan R, Key opinion leaders: independent experts or drug representatives in disguise?, BMJ (Clinical research ed.) 336 (7658) (2008) 1402–3. doi:10.1136/bmj.39575.675787.651.
- [3] L. Cosgrove, E. E. Wheeler, Drug firms, the codification of diagnostic categories, and bias in clinical guidelines, The Journal of law, medicine & ethics : a journal of the American Society of Law, Medicine & Ethics 41 (3) (2013) 644–53. doi:10.1111/jlme.12074.
- [4] Elliott C, Ethics and the Business of Biomedicine, Cambridge University Press, Cambridge; New York, 2009, Ch. Industry-funded bioethics and the limits of disclosure, pp. 150–168.
- [5] Baker M, 1,500 scientists lift the lid on reproducibility, Nature 533 (7604) (2016) 452–4.
- [6] A. Gelman, H. Stern, The difference between “significant” and “not significant” is not itself statistically significant, The American Statistician 60 (2006) 328–331.
- [7] Cerrito PB, Data mining to determine risk in medical decision, IOS Press, 2011.
- [8] X. Wang, S. W. Narayan, J. Penm, A. E. Patanwala, Efficacy and Safety of Tapentadol Immediate Release for Acute Pain: A Systematic Review and Meta-Analysis, The Clinical journal of pain 36 (5) (2020) 399–409. doi:10.1097/AJP.0000000000000809.
- [9] G. V. Valkenhoef, T. Tervonen, B. D. Brock, H. Hillege, Deficiencies in the transfer and availability of clinical trials evidence: a review of existing systems and standards, BMC medical informatics and decision making 12 (2012) 95. doi:10.1186/1472-6947-12-95.
- [10] S. Zwolsman, E. te Pas, L. Hooft, M. Wieringa-de Waard, N. van Dijk, Barriers to GPs’ use of evidence-based medicine: a systematic review, The British journal of general practice 62 (600) (2012) e511–21. doi:10.3399/bjgp12X652382.
- [11] Daniel JP, Data science: supporting decision-making, Journal of decision systems 25 (4) (2016) 345–356. doi:10.1080/12460125.2016.1171610.
- [12] J. B. Lamy, H. Berthelot, M. Favre, A. Ugon, C. Duclos, A. Venot, Using visual analytics for presenting comparative information on new drugs, J Biomed Inform 71 (2017) 58–69.
- [13] R. Tsopra, J. B. Lamy, K. Sedki, Using preference learning for detecting inconsistencies in clinical practice guidelines: methods and application to antibiotherapy, Artif Intell Med 89 (2018) 24–33.
- [14] J. B. Lamy, K. Sedki, R. Tsopra, Explainable decision support through the learning and visualization of preferences from a formal ontology of antibiotic treatments, J Biomed Inform 104C (2020) 103407.
- [15] R. Tsopra, F. Mechaï, K. Sedki, J. B. Lamy, AntibioHelp®, an innovative clinical decision support system for improving antibiotic prescriptions in primary care (2019).
- [16] Chittaro L, Information visualization and its application to medicine, Artif Intell Med 22 (2) (2001) 81–88.
- [17] W. Wang, R. Revis, M. Nilsson, B. Crowe, Clinical trial drug safety assessment with interactive visual analytics (2020). doi:10.1080/19466315.2020.1736142.
- [18] H. Ltifi, E. Benmohamed, C. Kolski, M. B. Ayed, Adapted Visual Analytics Process for Intelligent Decision-Making: Application in a Medical Context, International journal of information technology & decision making 19 (01) (2020) 241–282.
- [19] D. J. Feller, M. Burgermaster, M. E. Levine, A. Smaldone, P. G. Davidson, D. J. Albers, L. Mamykina, A visual analytics approach for pattern-recognition in patient-generated data, J Am Med Inform Assoc 25 (10) (2018) 1366–1374. doi:10.1093/jamia/ocy054.
- [20] L. Schneider, T. Kehl, K. Thedinga, N. L. Grammes, C. Backes, C. Mohr, B. Schubert, K. Lenhof, N. Gerstner, A. D. Hartkopf, M. Wallwiener, O. Kohlbacher, A. Keller, E. Meese, N. Graf, H. P. Lenhof, ClinOmicsTrailbc: a visual analytics tool for breast cancer treatment stratification, Bioinformatics (Oxford, England) 35 (24) (2019) 5171–5181. doi:10.1093/bioinformatics/btz302.
- [21] W. Aigner, S. Miksch, CareVis: Integrated visualization of computerized protocols and temporal patient data, Artif Intell Med 37 (3) (2006) 203–218.
- [22] J. M. Juarez, J. M. Ochotorena, M. Campos, C. Combi, Spatiotemporal data visualisation for homecare monitoring of elderly people, Artif Intell Med 65 (2) (2015) 97–111. doi:10.1016/j.artmed.2015.05.008.
- [23] J. Bernard, D. Sessler, J. Kohlhammer, R. A. Ruddle, Using Dashboard Networks to Visualize Multiple Patient Histories: A Design Study on Post-Operative Prostate Cancer, IEEE transactions on visualization and computer graphics 25 (3) (2019) 1615–1628. doi:10.1109/TVCG.2018.2803829.
- [24] D. A. Zarin, T. Tse, R. J. Williams, R. M. Califf, N. C. Ide, The ClinicalTrials.gov results database–update and key issues, The New England journal of medicine 364 (9) (2011) 852–60. doi:10.1056/NEJMsa1012065.
- [25] Honig P K, Systematic reviews and meta-analyses in the new age of transparency, Clin Pharmacol Ther 88 (2) (2010) 155–8. doi:10.1038/clpt.2010.124.
- [26] W. Zarin, A. A. Veroniki, V. Nincic, A. Vafaei, E. Reynen, S. S. Motiwala, J. Antony, S. M. Sullivan, P. Rios, C. Daly, J. Ewusie, M. Petropoulou, A. Nikolakopoulou, A. Chaimani, G. Salanti, S. E. Straus, A. C. Tricco, Characteristics and knowledge synthesis approach for 456 network meta-analyses: a scoping review, BMC medicine 15 (1) (2017) 3. doi:10.1186/s12916-016-0764-6.
- [27] N. Rudroju, D. Bansal, S. T. Talakokkula, K. Gudala, D. Hota, A. Bhansali, B. Ghai, Comparative efficacy and safety of six antidepressants and anticonvulsants in painful diabetic neuropathy: a network meta-analysis, Pain physician 16 (6) (2013) E705–14.
- [28] P. Natsiavas, A. Malousi, C. Bousquet, M. C. Jaulent, V. Koutkias, Computational advances in drug safety: Systematic and mapping review of knowledge engineering based approaches, Frontiers in Pharmacology 10 (2019) 415.
- [29] C. Zhan, E. Roughead, L. Liu, N. Pratt, J. Li, Detecting potential signals of adverse drug events from prescription data, Artif Intell Med 104 (2020) 101839. doi:10.1016/j.artmed.2020.101839.
- [30] I. Atal, L. Trinquart, P. Ravaud, R. Porcher, A mapping of 115,000 randomized trials revealed a mismatch between research effort and health needs in non-high-income regions, J Clin Epidemiol 98 (2018) 123–132. doi:10.1016/j.jclinepi.2018.01.006.
- [31] J. Warner, P. Yang, G. Alterovitz, Automated synthesis and visualization of a chemotherapy treatment regimen network, Stud Health Technol Inform 192 (2013) 62–6.
- [32] Z. He, S. Carini, I. Sim, C. Weng, Visual aggregate analysis of eligibility features of clinical trials, J Biomed Inform 54 (2015) 241–55. doi:10.1016/j.jbi.2015.01.005.
- [33] J. Sjöbergh, M. Kuwahara, Y. Tanaka, Visualizing clinical trial data using pluggable components, in: 16th International Conference on Information Visualisation, 2012, pp. 291–296.
- [34] S. Schulz, L. Jansen, Formal ontologies in biomedical knowledge representation, Yearb Med Inform 8 (2013) 132–46.
- [35] I. Sim, S. W. Tu, S. Carini, H. P. Lehmann, B. H. Pollock, M. Peleg, K. M. Wittkowski, The Ontology of Clinical Research (OCRe): An Informatics Foundation for the Science of Clinical Research, J Biomed Inform 52 (2013) 78–91.
- [36] I. Borg, P. J. F. Groenen, P. Mair, Applied multidimensional scaling, Springer, 2013.
- [37] Kohonen T, Self-organizing maps, Springer-Verlag, Berlin, 1995.
- [38] L. J. P. van der Maaten, G. E. Hinton, Visualizing high-dimensional data using t-SNE, Journal of Machine Learning Research 9 (2008) 2579–2605.
- [39] M. C. Cieslak, A. M. Castelfranco, V. Roncalli, P. H. Lenz, D. K. Hartline, t-Distributed Stochastic Neighbor Embedding (t-SNE): A tool for eco-physiological transcriptomic analysis, Marine genomics 51 (2020) 100723. doi:10.1016/j.margen.2019.100723.
- [40] F. H. M. Oliveira, A. R. P. Machado, A. O. Andrade, t-Distributed Stochastic Neighbor Embedding for Data Visualization and Classification of Individuals with Parkinson’s Disease, Computational and mathematical methods in medicine 2018 (2018) 8019232. doi:10.1155/2018/8019232.
- [41] Inselberg A, Parallel coordinates, Springer, 2009.
- [42] A. A. Mitku, T. Zewotir, D. North, R. N. Naidoo, Exploratory Data Analysis of Adverse Birth Outcomes and Exposure to Oxides of Nitrogen Using Interactive Parallel Coordinates Plot Technique, Scientific reports 10 (1) (2020) 7363. doi:10.1038/s41598-020-64471-w.
- [43] M. Kanai, Y. Maeda, Y. Okada, Grimon: graphical interface to visualize multi-omics networks, Bioinformatics (Oxford, England) 34 (22) (2018) 3934–3936. doi:10.1093/bioinformatics/bty488.
- [44] Ward MO, Handbook of data visualization, Springer, Berlin Heidelberg, 2008, Ch. Multivariate data glyphs: Principles and practice, pp. 179–198.
- [45] Chernoff H, Using faces to represent points in k-dimensional space graphically, Journal of the American Statistical Association 68 (342) (1973) 361–368.
- [46] Lanzenberger M, The Interactive Stardinates - Design Considerations, in: Proceeding of Human-Computer Interaction (INTERACT’03), IOS Press, Zurich, Switzerland, 2003, pp. 688–693.
- [47] J. Fuchs, P. Isenberg, A. Bezerianos, F. Fischer, E. Bertini, The Influence of Contour on Similarity Perception of Star Glyphs, IEEE transactions on visualization and computer graphics 20 (12) (2014) 2251–2260. doi:10.1109/TVCG.2014.2346426.
- [48] Chau M, Visualizing web search results using glyphs: Design and evaluation of a flower metaphor, Acm transactions on management information systems (tmis) 2 (1) (2011) 1–27.
- [49] G. Pilato, U. Maniscalco, A framework based on semantic spaces and glyphs for social sensing on twitter, Procedia computer science 88 (2016) 107–114.
- [50] M. Keck, D. Kammer, T. Gründer, T. Thom, M. Kleinsteuber, A. Maasch, R. Groh, Towards glyph-based visualizations for big data clustering, in: Proceedings of the 10th international symposium on visual information communication and interaction, 2017, pp. 129–136.
- [51] M. Keck, D. Kammer, R. Groh, Visual Version Comparison of Multidimensional Data Sets Using Glyphs, in: IEEE InfoVis, 2018.
- [52] J. Yang, D. Hubball, M. O. Ward, E. A. Rundensteiner, W. Ribarsky, Value and relation display: interactive visual exploration of large data sets with hundreds of dimensions, IEEE transactions on visualization and computer graphics 13 (3) (2007) 494–507.
- [53] B. Duffy, J. Thiyagalingam, S. Walton, D. J. Smith, A. Trefethen, J. C. Kirkman-Brown, E. A. Gaffney, M. Chen, Glyph-Based Video Visualization for Semen Analysis, IEEE transactions on visualization and computer graphics 21 (8) (2015) 980–93. doi:10.1109/TVCG.2013.265.
- [54] Lamy JB, Owlready: Ontology-oriented programming in Python with automatic classification and high level constructs for biomedical ontologies, Artif Intell Med 80 (2017) 11–28.
- [55] Lamy JB, Ontology-Oriented Programming for Biomedical Informatics, Studies in health technology and informatics (STC) 221 (2016) 64–68.
- [56] Ware C, Visual thinking for design, Morgan Kaufmann, Burlington, USA, 2008.
- [57] C. A. Pierce, B. Voss, Efficacy and safety of ibuprofen and acetaminophen in children and adults: a meta-analysis and qualitative review, The Annals of pharmacotherapy 44 (3) (2010) 489–506. doi:10.1345/aph.1M332.
- [58] Lamb YN, Correction to: Elagolix: First Global Approval, Drugs 78 (17) (2018) 1855. doi:10.1007/s40265-018-1014-3.
- [59] P. Vercellini, P. Viganò, G. Barbara, L. Buggio, E. Somigliana, Elagolix for endometriosis: all that glitters is not gold, Human reproduction (Oxford, England) 34 (2) (2019) 193–199. doi:10.1093/humrep/dey368.
- [60] B. D. Beakley, A. M. Kaye, A. D. Kaye, Tramadol, Pharmacology, Side Effects, and Serotonin Syndrome: A Review, Pain physician 18 (4) (2015) 395–400.
- [61] M. M. Bassiony, M. Abdelghani, G. M. Salah El-Deen, M. S. Hassan, H. El-Gohari, U. M. Youssef, Opioid Use Disorders Attributed to Tramadol Among Egyptian University Students, Journal of addiction medicine 12 (2) (2018) 150–155. doi:10.1097/ADM.0000000000000380.
- [62] C. A. Thiels, E. B. Habermann, W. M. Hooten, M. M. Jeffery, Chronic use of tramadol after acute pain episode: cohort study, BMJ (Clinical research ed.) 365 (2019) l1849. doi:10.1136/bmj.l1849.
- [63] N. Attal, G. Cruccu, R. Baron, M. Haanpää, P. Hansson, S. Jensen T, T. Nurmikko, EFNS guidelines on the pharmacological treatment of neuropathic pain: 2010 revision, Eur J Neurol 17 (9) (2010) 1113–e88. doi:10.1111/j.1468-1331.2010.02999.x.
- [64] N. B. Finnerup, N. Attal, S. Haroutounian, E. McNicol, R. Baron, R. H. Dworkin, I. Gilron, M. Haanpää, P. Hansson, T. S. Jensen, P. R. Kamerman, K. Lund, A. Moore, S. N. Raja, A. S. C. Rice, M. Rowbotham, E. Sena, P. Siddall, B. H. Smith, M. Wallace, Pharmacotherapy for neuropathic pain in adults: a systematic review and meta-analysis, The Lancet. Neurology 14 (2) (2015) 162–73. doi:10.1016/S1474-4422(14)70251-0.
- [65] C. P. Taylor, E. W. Harris, Analgesia with Gabapentin and Pregabalin May Involve NMDA Receptors, Neurexins and Thrombospondins, The Journal of pharmacology and experimental therapeutics (2020). doi:10.1124/jpet.120.266056.
- [66] F. A. Goodyear-Smith, M. L. van Driel, B. Arroll, C. Del Mar, Analysis of decisions made in meta-analyses of depression screening and the risk of confirmation bias: a case study, BMC medical research methodology 12 (2012) 76. doi:10.1186/1471-2288-12-76.
- [67] T. Mikolov, M. Karafiát, L. Burget, J. Černocký, S. Khudanpur, Recurrent neural network based language model, in: Conference of the international speech communication association, 2010.