Quantum well states in fractured crystals of the heavy fermion material CeCoIn5
Abstract
Quantum well states appear in metallic thin films due to the confinement of the wave function by the film interfaces. Using angle-resolved photoemission spectroscopy, we unexpectedly observe quantum well states in fractured single crystals of CeCoIn5. We confirm that confinement occurs by showing that these states’ binding energies are photon-energy independent and are well described with a phase accumulation model, commonly applied to quantum well states in thin films. This indicates that atomically flat thin films can be formed by fracturing hard single crystals. For the two samples studied, our observations are explained by free-standing flakes with thicknesses of 206 and 101 Å. We extend our analysis to extract bulk properties of CeCoIn5. Specifically, we obtain the dispersion of a three-dimensional band near the zone center along in-plane and out-of-plane momenta. We establish part of its Fermi surface, which corresponds to a hole pocket centered at . We also reveal a change of its dispersion with temperature, a signature that may be caused by the Kondo hybridization.
I Introduction
The quantum well is a simple introduction to quantum mechanics that demonstrates the quantization of confined states. Yet, this simple problem is directly relevant in important applications such as diode lasers and quantum dots. The discretization of the energy levels due to confinement occurs in a variety of systems in particle and condensed matter physics. For example, in one-dimensional spin chain systems, the interchain interactions generate a potential well that confines the magnetic domain walls [1]. In metals, the electronic states can be confined by interfaces, a subject that has been studied thoroughly using photoemission spectroscopy [2].
In metallic thin films, the electronic states dispersing perpendicular to the film plane are confined by the top and bottom interfaces. The resulting potential boundaries force the formation of quantized wave functions. The study of quantum well states (QWSs) is a well-established and powerful technique that can provide accurate information about single-particle lifetimes and dispersions of three-dimensional bands [2]. The approach was initially applied to elemental metals, such as Cu [3] and Ag [4, 5], and can be used to characterize properties such as electron-phonon coupling. Tuning the quantum well states by varying the film thickness has also been shown to modify the superconducting temperature in Pb [6]. More recent works used QWSs to get further insights on correlated oxides [7, 8, 9] and characterize topological states in Bi, Sb and Bi2Se3 [10, 11, 12].
Here we report the observation of QWSs, signatures typically associated with thin films, via angle-resolved photoemission spectroscopy (ARPES) of fractured single crystals of CeCoIn5. This result is surprising, as a well-defined confinement potential is required to form QWSs. We demonstrate in section III.2 that the states’ binding energies are photon-energy independent, as expected for photoemission from two-dimensional (2D) QWSs. In section III.3, we analyze the observed states using a phase accumulation model, typically employed in thin films. We first obtain the shape of the dispersion along the confined direction without any assumption. The film thickness and quantum numbers of the QWSs are then determined by calibrating our results to previous measurements [13]. The results in sections III.2 and III.3 confirm that the observed states are QWSs. In sections III.4 and III.5, we exploit the QWS properties to extract bulk properties of CeCoIn5.
The material studied, CeCoIn5, is a prototypical heavy fermion with a superconducting state below K [14]. Magnetic interactions, dependent on the degree of itineracy of the -electrons [15], have been proposed to mediate to formation of Cooper pairs in this material [14] similar to other heavy-fermion materials [16, 17]. Theoretical calculations with itinerant -electrons indicate that the electronic structure of CeCoIn5 is composed of three bands crossing the Fermi level [18, 19, 20]. These have been investigated with quantum oscillations [18] and angle-resolved photoemission spectroscopy (ARPES) [21, 22, 23, 24, 25, 26, 13, 27]. Most experimental observations of the Fermi surface are attributed to the nearly 2D -sheet and the quasi-2D -sheet. However, theory also predicts multiple three-dimensional (3D) sheets [18, 19, 20, 28, 29]. First, there is a 3D oblate pocket centered at , which is labeled in Ref. [18] and in some ARPES works [13, 27]. We will use the notation in this work. Second, there is also a 3D ellipsoidal pocket centered at . Finally, there is a more complex 3D sheet around the plane, labeled in Ref. [13]. A confinement potential along the -axis will mostly affect those 3D bands. Therefore, the QWSs observed in CeCoIn5 must originate from one of these 3D bands. As explained in section III.4, our results indicate that the QWSs originate from the 3D pocket centered at .
II EXPERIMENTAL DETAILS
Large high quality samples of CeCoIn5 were grown by flux as reported previously in Ref. [14]. The typical dimensions of the sample used in the experiment are mm3. Samples were fixed on a copper post with Silver Epoxy Epo-tek H20E and oriented to expose a (001) surface. A ceramic post was fixed on top of the sample surface with the same silver epoxy and samples were fractured in situ at temperatures below 20 K. We note that a large transverse force, of the order of a few Newtons, applied on the ceramic post was required to fracture the samples. ARPES measurements were performed at the beamlines 5-4 and 5-2 at Stanford Synchrotron Radiation Lightsource (SSRL). The chamber pressure remained below Torr during the measurements. Measurements on sample A, and six other samples, were performed at the beamline 5-2 with a beam spot of m2. Linear horizontal (LH) polarized light with a photon energy of 25 eV was used. Complementary measurements were performed with photon energies ranging from to 127 eV. Measurements on sample B were performed at the beamline 5-4 with a beam spot of m2. Measurements were acquired with circular right (CR), linear vertical (LV) and LH polarized light, for photon energies ranging from to 40 eV. Unless otherwise noted explicitly, measurements shown were taken with eV in LH polarization. For both beamline geometries, LV and LH polarizations correspond to -polarized and -polarized light, respectively.
III EXPERIMENTAL RESULTS
III.1 Quantum well states in CeCoIn5
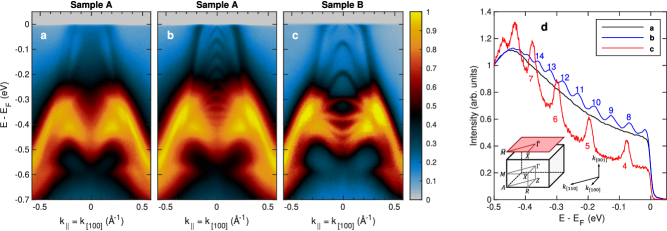
A typical ARPES spectrum of CeCoIn5 measured with 25 eV photons on sample A along the direction is presented in Fig. 1a. Based on the inner potential value of 12 eV [25], the perpendicular momentum is at the Brillouin zone boundary. Therefore, this spectrum corresponds to a cut along the direction and compares well with previous measurements along the same direction with 100 eV photons, also resulting in near the Brillouin zone boundary [22]. The spectrum is characterized by an intense M-shaped feature between and eV, a sharp band extending from it to reach the Fermi level , and a continuum filling the region between the M-shaped feature and the Fermi level near . The observation of a continuum can be explained by a broadening of due to final state effects [30]. It must then originate from a 3D band dispersing along the direction.
The spectrum presented in Fig. 1a with its characteristic signatures has been consistently observed on many regions of sample A (see Appendix I) and on other samples. However, from the eight samples we measured, three of them exhibited different spectra in small regions of the surface. Examples of those uncommon spectra in samples A and B are shown in Fig. 1b-c. In those spectra, numerous new bands appear near in the energy range between and about eV. We demonstrate in the following that these new bands in CeCoIn5 are QWSs due to confinement along the -axis. We will show in section III.2 that those states are photon-energy independent and in section III.3 that they are well described by a phase accumulation model. In this model, the different number of bands between samples, as seen in Fig. 1b-c, is understood from different thicknesses of the confinement region.
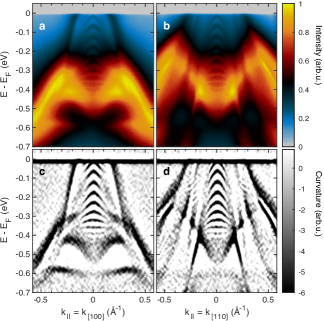
The spectrum in Fig. 1b is reproduced in Fig. 2a and the QWSs are made more apparent by presenting the 2D curvature of the photoemission intensity [31] in Fig. 2c. Note that closely spaced levels only appear near down to about eV, in the same energy and momentum range where the continuum is observed in Fig. 1a. A spectrum along , shown in Fig. 2b, also exhibits the QWSs near . Its 2D curvature plot (Fig. 2d) also reveals less prominent QWSs around and eV. Only wavevectors in the confined direction, i.e. along , become quantized. In our geometry, this corresponds to the direction while is aligned either along the () or () direction. The QWSs that are observed near in Fig. 2 are associated with a 3D band dispersing along the direction. This corresponds either to the 3D -pocket centered at or the concave -pocket centered at . On the other hand, the QWSs identified in Fig. 2d, around , most likely originates from the quasi-2D -sheet, which exhibits some dispersion along .
III.2 Photon energy dependence
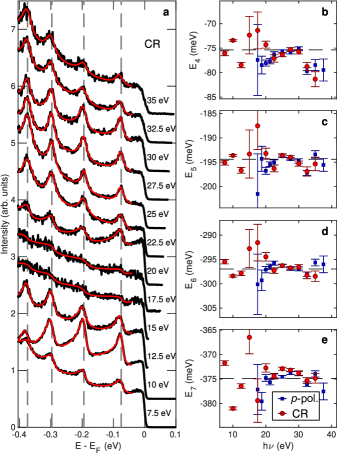
Due to their confinement along one direction, QWSs can be understood as 2D states that do not change their binding energy as function of photon energy, in contrast to 3D bulk bands [30]. The binding energies observed in CeCoIn5 indeed are independent of the photon energy from 7.5 eV up to 37.5 eV, as shown in Fig. 3. The photon energy dependence reported here was performed on sample B with -polarized and CR polarized light. The energy distribution curves (EDCs) measured at are qualitatively similar for both polarizations and result in the same binding energy of the QWSs.
To extract the energies of the QWSs, the EDCs at were fitted with
| (1) |
where is a Doniach-Šunjić (DS) lineshape [32] at energy with a linewidth and an asymmetry characterized by the parameter , which is caused by the creation of electron-hole pairs. The functions and are quadratic polynomials accounting for the peak intensity variation and background, respectively. We fix the asymmetry parameter to be the same for all peaks of an EDC. The resulting fits are presented in Fig. 3a for the measurements performed with CR polarized light with photon energy from 7.5 eV up to 35 eV.
It is noteworthy that the position of the peak maximum of the DS lineshape is different than the excitation energy . They only coincide when either or tends toward zero. Experimentally, there are small shifts in the position of the peak maximum with photon energy but these can be related to a change of the asymmetry parameter . The peak energies extracted from the fit, presented in Fig. 3b-e, are effectively independent of the photon energy as expected for QWSs. In the following section, we use the binding energies averaged over all the photon energies to describe the QWSs of sample B at . For sample A, a comparable photon energy dependence was not performed and the QWS binding energies at were instead determined from fitting its EDC in Fig. 1 with Eq. 1 using .
III.3 Phase accumulation model
The binding energies of QWSs in thin films are defined by three important quantities: the film thickness , the band dispersion of the bulk material in the direction perpendicular to the film plane and the total phase shift occurring at the top and bottom boundaries of the confinement potential. This is expressed mathematically in a phase accumulation model by the Bohr-Sommerfeld quantization rule [2]:
| (2) |
This equation establishes the conditions to obtain a standing wave in the film. Here, is the quantum number of the QWS and the next state is reached by adding one node in the standing wave. Typically, measurements are performed on many thin films with different known thicknesses [33]. These can be used together with Eq. 2 to determine the dispersion . Here, the nature and size of the confinement potential is a priori unknown. However, the existence of confined states constrains the characteristics of the interfaces. An interface of CeCoIn5 with another metal would lead to a leakage of the electronic wavefunction into that metal, hindering the formation of QWSs. The top and bottom interfaces must therefore be formed with an insulating medium. The top interface can confidently be assigned to a CeCoIn5-vacuum interface. For simplicity, we assume that the bottom interface is also a CeCoIn5-vacuum interface. While metallic indium inclusions from excess flux can exist in CeCoIn5 samples, no intergrowth of insulating material is expected. This further supports the assumption of a CeCoIn5-vacuum interface at the bottom, as vacuum is the only insulating medium present. This assumption allows to define the total phase shift . The phase shift at a metal-vacuum interface is approximated by:
| (3) |
where is the vacuum level defined by [34, 35, 36]. Here, is the metal workfunction. We measured eV with the experimental setup and the method described in Ref. [37].
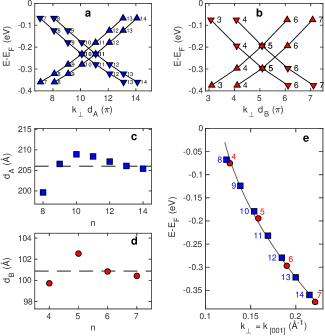
The total phase shift ranges from at eV to at eV. This change in the region of interest is small in comparison to the phase accumulated by each increment of the quantum number. Accordingly, the phase shift has a negligible contribution to the dispersion along in Eq. 2. Furthermore, in the infinite box limit , the shape of the dispersion is entirely given by the energy spacing between the QWSs. The thickness and the quantum numbers can only scale or shift the dispersion on the momentum axis. We illustrate this important point in Fig. 4a-b. While we can safely assume that the observed states correspond to a consecutive sequence of quantum numbers, we do not know the offset value or whether this sequence is increasing or decreasing with energy. Using Eqs. 2 and 3, we evaluate the quantity for the determined energies of the QWSs at using four different sets of quantum numbers. The quantity corresponds to the dispersion scaled by the unknown film thickness. The lines in Fig. 4a-b connect the data points from one set of quantum numbers and provide a guide to the eye of this scaled dispersion. We observe that choosing increasing or decreasing quantum numbers as function of binding energy changes the sign of the band velocity. The dispersion is shifted along the horizontal axis when the offset in the quantum number series is varied. This shows that the shape of the dispersion is determined by the experimental results without any model parameters.
To pursue our analysis, we rely on data from literature to establish the sign and magnitude of the band velocity as well as its absolute momentum. Cleaving CeCoIn5 to expose a (100) surface, Jang et al. measured the dispersion along (Fig. S3b in Ref. [13]), corresponding to the dispersion along at in our geometry. A well-defined hole-band centered at and a weaker diffuse hole-band centered at are observed. The former agrees with the expectation of the oblate pocket centered at from theory [38, 19] and de Haas-van Alphen measurements [18]. For our analysis, we assume that the QWSs are associated with this hole-band centered at . Our choice is justified in section III.4. We parametrize the measured dispersion [13] between eV and eV by a second order polynomial with , and .
Using this dispersion and Eq. 2, we evaluate the sample thickness for each QWS using a range of consecutive quantum numbers. The objective is to identify a set of quantum numbers for which the calculated thicknesses do not change from one QWS to the next. The set of quantum numbers that lead to the smallest standard deviation of the calculated thicknesses is chosen. The thickness variation for the selected sets of for samples A and B are presented in Fig. 4c-d. We obtain an average thickness of 206 Å, or 27.3 unit cells, for sample A and 101 Å, or 13.4 unit cells, for sample B. The obtained thicknesses are very sensitive to the parametrized dispersion and their absolute values should be taken with caution. Thickness values change by for a shift of the parametrized dispersion by 0.005 Å-1. Larger shifts or changes in the slope can also modify the optimal quantum numbers, leading to more significant changes in the thickness values. Using the average thickness values and the selected sets of quantum numbers, we present the dispersion along obtained from the QWSs at in Fig. 4e. The agreement with the parametrized dispersion, shown by the black solid line, confirms the validity of the approach.
III.4 3D band structure and Fermi surface
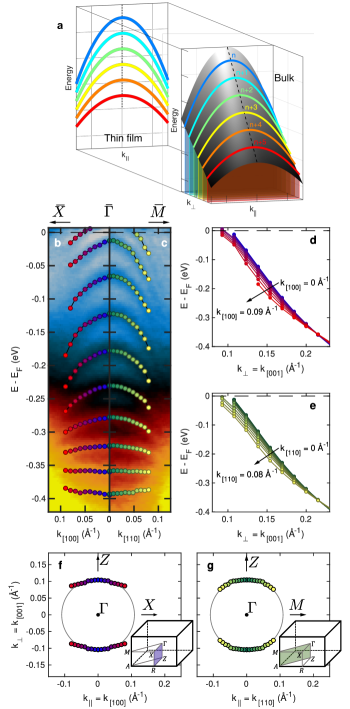
Fig. 5a illustrates the effect of confinement along on a bulk band dispersing along and . The confinement selects specific values of the bulk band, as shown by the colored lines. These sections of the bulk dispersion, or QWSs, are projected on a 2D plane that is measured in thin films. Effectively, 2D spectra of QWSs such as the ones in Fig. 2a-b provide the structure of a 3D object, i.e. the band energy as a function of two different momenta. Up to now, we applied the phase accumulation model only at to characterize the dispersion along the direction, represented by the black dashed line in Fig. 5a. In the following, we extract the complete surface illustrated in gray. Specifically, we determine the band structure and from the spectra in Fig. 2a-b. Those spectra are reproduced in Fig. 5b-c, after a division by a Fermi-Dirac distribution convoluted with the energy resolution. The QWS positions, indicated by the circles, were determined by fitting EDCs to Eq. 1 with . Using Eq. 2 together with the determined quantum numbers and thickness, the dispersion along at each values of is calculated and shown in Fig. 5d. These dispersions taken together form the surface . The same data treatment is performed for values of and is shown in Fig. 5e.
With the established surfaces , we are able to determine sections of the Fermi surface associated with this band in two reciprocal lattice planes. For a fixed value of , the four data points of closest to are fitted to a second order polynomial. The perpendicular component of the Fermi momentum is determined by the intersection of this polynomial with . The associated parallel component of the Fermi momentum corresponds to the fixed value of . This procedure is repeated at all values of and the Fermi momenta forming the Fermi surface are traced in Fig. 5f and g for the and planes, respectively. In both planes, the Fermi surface follows closely the arc of a sphere centered at , although there is a small but visible anisotropy. As discussed in section III.3, we assigned the band forming the QWSs to the oblate hole pocket centered at [18, 19]. The theoretical calculations indicate that this pocket is slightly more extended along the direction than along the direction [19]. This is in agreement with the general tendency observed for the largest values in Fig. 5f-g and supports our analysis.
As indicated in section III.3, a hole band centered at is also observed in CeCoIn5 [13] and it is associated to the -pocket. We performed the same analysis of sections III.3 and III.4 assuming that this band is responsible for the QWSs, instead of the -pocket centered at . This analysis results in a Fermi surface that is inconsistent with the theoretical results. It indicates the formation of an ellipsoidal pocket centered at while the theoretical calculations predict a concave pocket with the opposite curvature (see Fig. S2a in Ref. [13]). This disagreement by considering the band and the agreement by considering the band justify the choice made in section III.3.
III.5 Temperature dependence
We characterize the temperature dependence of the QWSs for sample B using -polarized light with 20 eV photons. By increasing temperature, there is a continuous shift of the QWS binding energy, as shown on Fig. 6a-d. However, the shift is more pronounced for the states closer to . The temperature dependence of the QWSs suggests a change in the band structure, which can be caused by a change of the chemical potential as well as a modification of the band dispersion.
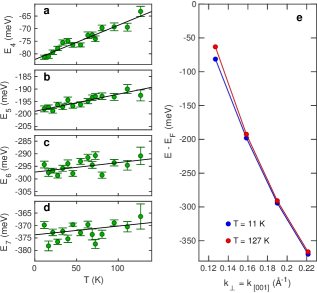
Note that each QWS has a fixed value of which is enforced by Eq. 2 for a fixed quantum number , assuming that the total phase shift is unchanged. This assumption is reasonable as does not change with temperature for vacuum-metal interfaces and its energy dependence is negligible. The only parameter that is allowed to change is the energy associated to a specific value. A rigid band shift caused by a change of the chemical potential would therefore appear as an identical shift of all the QWSs. Experimentally, all the QWSs move towards with increasing temperature, suggesting a change of the chemical potential, but their shift is not identical indicating the contribution from another effect. By reconstructing the dispersion at at K and 127 K, as shown in Fig. 6e, we clearly observe a change in the dispersion, concurrently with a small chemical potential shift. This change in dispersion could be related to the formation of the heavy electronic liquid at low temperatures. Previous ARPES measurements on CeCoIn5 [27, 13] and YbRh2Si2 [39, 40] have shown (i) that the Kondo hybridization decreases continuously as function of increasing temperature and (ii) that the spectral signatures of the Kondo effect can be observed far above the Kondo coherence temperature, of 45 K in CeCoIn5. A fading Kondo effect leads to a decrease of the hybridization gap between the renormalized -band and the conduction band. These changes occur close to . In CeCoIn5 one then expects the binding energy of the conduction band to decrease with increasing temperature close to but be temperature-independent further away from . This is consistent with our observation. The size of the hybridization gap was found to be linear in temperature up to 200 K for YbRh2Si2 [40], which is also consistent with our observation (Fig. 6a-d).
IV Discussion
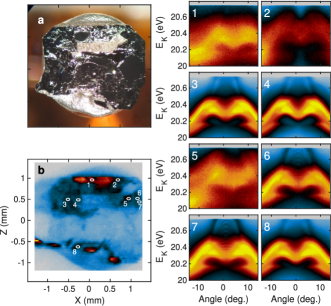
It is surprising that QWSs have not been reported previously in fractured CeCoIn5 crystals, considering the numerous ARPES works present in the literature [21, 22, 23, 24, 25, 26, 13, 27]. This is most likely because a specific set of conditions is required to observe them. In particular, a small beam spot was important to observe the QWSs in our experiments on CeCoIn5. For example, we used a beam spot of m2 at beamline 5-2 and QWSs were only observed in a small region of sample A (see Appendix I). Using a large beam spot or exploring only limited parts of the sample could prevent their observation.
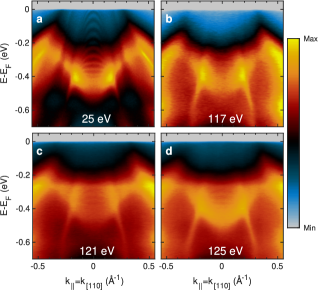
The characteristics of the light also play a role in the observation of the QWSs. For example, the QWSs were not observed using -polarized light (not shown). In -polarization, they were hardly visible at 15 eV and 17.5 eV. Previous works have been mostly performed at photon energies higher than 40 eV. In particular, ARPES measurements on CeCoIn5 are often carried out in the vicinity of the Ce resonance at eV, in search of hybridization effects [21, 24, 26, 13, 27]. We also performed measurements on the QWSs for photon energies of 117 up to 127 eV in -polarization on sample A (see Appendix II). We observed that the photoemission cross-section of the QWSs is strongly reduced at these larger photon energies and they only appear in a narrow energy range, from eV to eV. Thus, they can easily be overlooked and it could explain why QWSs were not reported earlier. We point out that the QWS photoemission intensity is unaffected by the Ce-resonance at 121 eV. This is not surprising considering that -spectral weight is not expected in the energy range where the QWSs are observed at this photon energy.
One of the most intriguing aspects of our results is the observation, in fractured single crystals, of spectroscopic signatures typically associated to thin films. This suggests that thin film-like structures are formed during the fracturing process. Our results indicate that we measure structures that are of comparable size to the beam spot ( m2 at beamline 5-2 and m2 at beamline 5-4) and that are atomically flat in order to create well-confined QWSs. Previous STM results showed flat terraces of only tens of nanometers in CeCoIn5 samples cleaved at room temperature [41]. Thin films grown by molecular beam epitaxy (MBE) also exhibit terraces significantly smaller than 1 m [42]. In contrast, the observation of QWSs requires the presence of two parallel, atomically flat interfaces much larger than those seen in STM on cleaved crystals or MBE-grown films. The coexistence of different thicknesses in the regions probed in our samples is excluded as a single set of QWSs is observed. The coexistence of two thicknesses different by only one unit cell would exhibit QWSs separated by energies similar or larger than the experimental full width at half maximum.
The fracturing of our CeCoIn5 crystals was performed at low temperatures ( K) by applying a large lateral force on a ceramic post glued to the sample surface. We note that fracturing our samples was rather difficult and required multiple attempts, due to the material hardness, the 3D nature of its structure and the large surface-area-to-thickness ratio of the samples. The unsuccessful attempts could have created cracks, easing the formation of flakes during fracturing. The high load applied is also more likely to induce branching effects known to occur in dynamic fractures [43]. In that case, a single crack dynamically splits in two cracks, which are expected to follow crystal planes [44]. Such a process could create free-standing thin flakes with parallel atomically flat surfaces. Assuming that such flakes are supported on their edges, vacuum on both sides of the flakes will prevent leakage of the electronic wavefunctions, leading to confinement. This interpretation suggests that the creation of thin films supporting QWSs might occur more generally in hard crystals when fracturing occurs under high mechanical load.
The physics of dynamical fractures in materials is rather complex but relevant for their mechanical properties. However, fracturing and its possible consequences are generally not addressed in strongly correlated systems such as CeCoIn5. Recently, the effect of fracturing was also considered in the correlated material URu2Si2. In this case, it was shown that a one-dimensional charge density wave can be induced by fracturing at low temperatures [45]. This result, together with our observations, highlights that crystal fracturing can reveal unexpected phenomena in strongly correlated systems.
V Conclusions
In summary, we reported the observation of spectroscopic signatures associated to QWSs in fractured single crystals of CeCoIn5. We confirmed that those signatures are photon-energy independent and are described by a phase accumulation model, as expected for 2D QWSs. The dispersion of the 3D hole band along in-plane and out-of-plane momenta was obtained from a detailed analysis of the QWS spectra. From this result, sections of the Fermi surface were extracted and they are in agreement with theory. Finally, a temperature dependence of the QWSs revealed a change of the 3D dispersion that is consistent with a reduction of the Kondo hybridization with increasing temperature.
The observation of QWSs in a fractured single crystal is perhaps the most surprising result of our work. Indeed, a well-defined confinement potential is required to form sharp QWSs. Therefore, our work suggest that fracturing hard crystals at low temperatures can create large atomically flat thin film structures. This interesting observation is however not practical to do a systematic study of QWSs in CeCoIn5. Further work with thin films obtained with controlled growth, which are available for CeCoIn5 and related materials [46, 47, 48, 42], would be of interest for a deeper investigation on how the Kondo hybridization is affecting the -band.
The data from this study are available at the Stanford Digital Repository [49].
Acknowledgements.
This work was supported by the Department of Energy, Office of Basic Energy Sciences. N.G. acknowledges support from the Swiss National Science Foundation (fellowship no. P2EZP2 178542). H.P. acknowledges support from the German Science Foundation (DFG) under reference PF 947/1-1 and from the Advance Light Source funded through U.S. Department of Energy, Office of Science. The Stanford Synchrotron Radiation Lightsource, SLAC National Accelerator Laboratory, is supported by the U.S. Department of Energy, Office of Science, Office of Basic Energy Sciences. Work at Los Alamos was performed under the auspices of the U.S. DOE, Basic Energy Sciences, Division of Materials Sciences and Engineering. N.G. is thankful to D.G. Mazzone for fruitful discussions.Appendix I
Spectra obtained at different regions of the sample A are presented in Fig. 7. Regions 1, 2 and 5 have diffuse spectra, while sharp bands are observed in regions 3, 4, 6, 7 and 8. From these spectra, only regions 6 and 7 exhibit QWSs. Regions 3,4 and 8 instead have diffuse intensity near .
Appendix II
In the main text, the measurements of QWSs for photon energies below 40 eV are reported. Here, we present measurements at photon energies around the Ce-resonance of 121 eV on sample A along the direction. The QWSs are also observed in this energy range, as shown in Fig. 8b-d. The contrast between the QWSs and the background is however strongly reduced, in comparison to the spectrum measured at 25 eV (Fig. 8a).
References
- Coldea et al. [2010] R. Coldea, D. A. Tennant, E. M. Wheeler, E. Wawrzynska, D. Prabhakaran, M. Telling, K. Habicht, P. Smeibidl, and K. Kiefer, Quantum criticality in an Ising chain: experimental evidence for emergent E8 symmetry., Science 327, 177 (2010).
- Chiang [2000] T. C. Chiang, Photoemission studies of quantum well states in thin films, Surface Science Reports 39, 181 (2000).
- Kawakami et al. [1999] R. K. Kawakami, E. Rotenberg, H. J. Choi, E. J. Escorcia-Aparicio, M. O. Bowen, J. H. Wolfe, E. Arenholz, Z. D. Zhang, N. V. Smith, and Z. Q. Qiu, Quantum-well states in copper thin films, Nature 398, 132 (1999).
- Paggel et al. [1999a] J. J. Paggel, T. Miller, and T. C. Chiang, Quantum-well states as Fabry-Perot modes in a thin-film electron interferometer, Science 283, 1709 (1999a).
- Paggel et al. [1999b] J. J. Paggel, T. Miller, and T. C. Chiang, Temperature dependent complex band structure and electron-phonon coupling in Ag, Physical Review Letters 83, 1415 (1999b).
- Guo et al. [2004] Y. Guo, Y. F. Zhang, X. Y. Bao, T. Z. Han, Z. Tang, L. X. Zhang, W. G. Zhu, E. G. Wang, Q. Niu, Z. Q. Qiu, J. F. Jia, Z. X. Zhao, and Q. K. Xue, Superconductivity modulated by quantum size effects, Science 306, 1915 (2004).
- Yoshimatsu et al. [2011] K. Yoshimatsu, K. Horiba, H. Kumigashira, T. Yoshida, A. Fujimori, and M. Oshima, Metallic Quantum Well States in Artificial Structures of Strongly Correlated Oxide, Science 333, 319 (2011).
- Santander-Syro et al. [2011] A. F. Santander-Syro, O. Copie, T. Kondo, F. Fortuna, S. Pailhés, R. Weht, X. G. Qiu, F. Bertran, A. Nicolaou, A. Taleb-Ibrahimi, P. Le Fèvre, G. Herranz, M. Bibes, N. Reyren, Y. Apertet, P. Lecoeur, A. Barthélémy, and M. J. Rozenberg, Two-dimensional electron gas with universal subbands at the surface of SrTiO3, Nature 469, 189 (2011).
- Meevasana et al. [2011] W. Meevasana, P. D. King, R. H. He, S. K. Mo, M. Hashimoto, A. Tamai, P. Songsiriritthigul, F. Baumberger, and Z. X. Shen, Creation and control of a two-dimensional electron liquid at the bare SrTiO3 surface, Nature Materials 10, 114 (2011).
- Zhang et al. [2012] P. Zhang, Z. Liu, W. Duan, F. Liu, and J. Wu, Topological and electronic transitions in a Sb(111) nanofilm: The interplay between quantum confinement and surface effect, Physical Review B 85, 201410(R) (2012).
- Ito et al. [2016] S. Ito, B. Feng, M. Arita, A. Takayama, R.-Y. Liu, T. Someya, W.-C. Chen, T. Iimori, H. Namatame, M. Taniguchi, C.-M. Cheng, S.-J. Tang, F. Komori, K. Kobayashi, T.-C. Chiang, and I. Matsuda, Proving Nontrivial Topology of Pure Bismuth by Quantum Confinement, Physical Review Letters 117, 236402 (2016).
- Zhang et al. [2010] Y. Zhang, K. He, C. Z. Chang, C. L. Song, L. L. Wang, X. Chen, J. F. Jia, Z. Fang, X. Dai, W. Y. Shan, S. Q. Shen, Q. Niu, X. L. Qi, S. C. Zhang, X. C. Ma, and Q. K. Xue, Crossover of the three-dimensional topological insulator Bi2Se3 to the two-dimensional limit, Nature Physics 6, 584 (2010).
- Jang et al. [2017] S. Jang, J. D. Denlinger, J. W. Allen, V. S. Zapf, M. B. Maple, J. N. Kim, B. G. Jang, and J. H. Shim, Evolution of the Kondo lattice electronic structure above the transport coherence temperature, (2017), arXiv:1704.08247 .
- Petrovic et al. [2001] C. Petrovic, P. G. Pagliuso, M. F. Hundley, R. Movshovich, J. L. Sarrao, J. D. Thompson, Z. Fisk, and P. Monthoux, Heavy-fermion superconductivity in CeCoIn5 at 2.3 K, Journal of Physics: Condensed Matter 13, L337 (2001).
- Mazzone et al. [2019] D. G. Mazzone, N. Gauthier, D. T. Maimone, R. Yadav, M. Bartkowiak, J. L. Gavilano, S. Raymond, V. Pomjakushin, N. Casati, Z. Revay, G. Lapertot, R. Sibille, and M. Kenzelmann, Evolution of Magnetic Order from the Localized to the Itinerant Limit, Physical Review Letters 123, 97201 (2019).
- Mathur et al. [1998] N. D. Mathur, F. M. Grosche, S. R. Julian, I. R. Walker, D. M. Freye, R. K. W. Haselwimmer, and G. G. Lonzarich, Magnetically mediated superconductivity in heavy fermion compounds, Nature 394, 39 (1998).
- Monthoux et al. [2007] P. Monthoux, D. Pines, and G. G. Lonzarich, Superconductivity without phonons., Nature 450, 1177 (2007).
- Settai et al. [2001] R. Settai, H. Shishido, S. Ikeda, Y. Murakawa, M. Nakashima, D. Aoki, Y. Haga, H. Harima, and Y. Onuki, Quasi-two-dimensional Fermi surfaces and the de Haas-van Alphen oscillation in both the normal and superconducting mixed states of CeCoIn5, Journal of Physics: Condensed Matter 13, L627 (2001).
- Oppeneer et al. [2007] P. M. Oppeneer, S. Elgazzar, A. B. Shick, I. Opahle, J. Rusz, and R. Hayn, Fermi surface changes due to localized-delocalized f-state transitions in Ce-115 and Pu-115 compounds, Journal of Magnetism and Magnetic Materials 310, 1684 (2007).
- Nomoto and Ikeda [2014] T. Nomoto and H. Ikeda, Fermi surface evolution and -wave superconductivity in CeCoIn5: Analysis based on LDA+DMFT method, Physical Review B 90, 125147 (2014).
- Koitzsch et al. [2008] A. Koitzsch, S. V. Borisenko, D. Inosov, J. Geck, V. B. Zabolotnyy, H. Shiozawa, M. Knupfer, J. Fink, B. Büchner, E. D. Bauer, J. L. Sarrao, and R. Follath, Hybridization effects in CeCoIn5 observed by angle-resolved photoemission, Physical Review B 77, 155128 (2008).
- Koitzsch et al. [2009] A. Koitzsch, I. Opahle, S. Elgazzar, S. V. Borisenko, J. Geck, V. B. Zabolotnyy, D. Inosov, H. Shiozawa, M. Richter, M. Knupfer, J. Fink, B. Büchner, E. D. Bauer, J. L. Sarrao, and R. Follath, Electronic structure of CeCoIn5 from angle-resolved photoemission spectroscopy, Physical Review B 79, 075104 (2009).
- Jia et al. [2011] X.-W. Jia, Y. Liu, L. Yu, J.-F. He, L. Zhao, W.-T. Zhang, H.-Y. Liu, G.-D. Liu, S.-L. He, J. Zhang, W. Lu, Y. Wu, X.-L. Dong, L.-L. Sun, G.-L. Wang, Y. Zhu, X.-Y. Wang, Q.-J. Peng, Z.-M. Wang, S.-J. Zhang, F. Yang, Z.-Y. Xu, C.-T. Chen, and X.-J. Zhou, Growth, Characterization and Fermi Surface of Heavy Fermion CeCoIn5 Superconductor, Chinese Physics Letters 28, 57401 (2011).
- Booth et al. [2011] C. H. Booth, T. Durakiewicz, C. Capan, D. Hurt, A. D. Bianchi, J. J. Joyce, and Z. Fisk, Electronic structure and f-orbital occupancy in Yb-substituted CeCoIn5, Physical Review B 83, 235117 (2011).
- Dudy et al. [2013] L. Dudy, J. D. Denlinger, L. Shu, M. Janoschek, J. W. Allen, and M. B. Maple, Yb valence change in Ce1-xYbxCoIn5 from spectroscopy and bulk properties, Physical Review B 88, 165118 (2013).
- Koitzsch et al. [2013] A. Koitzsch, T. K. Kim, U. Treske, M. Knupfer, B. Büchner, M. Richter, I. Opahle, R. Follath, E. D. Bauer, and J. L. Sarrao, Band-dependent emergence of heavy quasiparticles in CeCoIn5, Physical Review B 88, 035124 (2013).
- Chen et al. [2017] Q. Y. Chen, D. F. Xu, X. H. Niu, J. Jiang, R. Peng, H. C. Xu, C. H. P. Wen, Z. F. Ding, K. Huang, L. Shu, Y. J. Zhang, H. Lee, V. N. Strocov, M. Shi, F. Bisti, T. Schmitt, Y. B. Huang, P. Dudin, X. C. Lai, S. Kirchner, H. Q. Yuan, and D. L. Feng, Direct observation of how the heavy-fermion state develops in CeCoIn5, Physical Review B 96, 045107 (2017).
- Polyakov et al. [2012] A. Polyakov, O. Ignatchik, B. Bergk, K. Götze, A. D. Bianchi, S. Blackburn, B. Prévost, G. Seyfarth, M. Côté, D. Hurt, C. Capan, Z. Fisk, R. G. Goodrich, I. Sheikin, M. Richter, and J. Wosnitza, Fermi-surface evolution in Yb-substituted CeCoIn5, Physical Review B 85, 245119 (2012).
- Klotz et al. [2018] J. Klotz, K. Götze, I. Sheikin, T. Förster, D. Graf, J.-H. Park, E. S. Choi, R. Hu, C. Petrovic, J. Wosnitza, and E. L. Green, Fermi surface reconstruction and dimensional topology change in Nd-doped CeCoIn5, Physical Review B 98, 081105(R) (2018).
- Strocov [2003] V. N. Strocov, Intrinsic accuracy in 3-dimensional photoemission band mapping, Journal of Electron Spectroscopy and Related Phenomena 130, 65 (2003).
- Zhang et al. [2011] P. Zhang, P. Richard, T. Qian, Y.-M. Xu, X. Dai, and H. Ding, A precise method for visualizing dispersive features in image plots, Review of Scientific Instruments 82, 043712 (2011).
- Doniach and Sunjic [1970] S. Doniach and M. Sunjic, Many-electron singularity in X-ray photoemission and X-ray line spectra from metals, Journal of Physics C: Solid State Physics 3, 285 (1970).
- Kirchmann et al. [2010] P. S. Kirchmann, L. Rettig, X. Zubizarreta, V. M. Silkin, E. V. Chulkov, and U. Bovensiepen, Quasiparticle lifetimes in metallic quantum-well nanostructures, Nature Physics 6, 782 (2010).
- McRae [1979] E. G. McRae, Electronic surface resonances of crystals, Reviews of Modern Physics 51, 541 (1979).
- McRae and Kane [1981] E. McRae and M. Kane, Calculations on the effect of the surface potential barrier in LEED, Surface Science 108, 435 (1981).
- Milun et al. [2002] M. Milun, P. Pervan, and D. P. Woodruff, Quantum well structures in thin metal films: simple model physics in reality?, Reports on Progress in Physics 65, 99 (2002).
- Pfau et al. [2020] H. Pfau, H. Soifer, J. A. Sobota, A. Gauthier, C. R. Rotundu, J. C. Palmstrom, I. R. Fisher, G.-Y. Chen, H.-H. Wen, Z.-X. Shen, and P. S. Kirchmann, Low work function in the 122-family of iron-based superconductors, Physical Review Materials 4, 034801 (2020).
- Elgazzar et al. [2004] S. Elgazzar, I. Opahle, R. Hayn, and P. M. Oppeneer, Calculated de Haas–van Alphen quantities of CeIn5 (=Co, Rh, and Ir) compounds, Physical Review B 69, 214510 (2004).
- Kummer et al. [2015] K. Kummer, S. Patil, A. Chikina, M. Güttler, M. Höppner, A. Generalov, S. Danzenbächer, S. Seiro, A. Hannaske, C. Krellner, Y. Kucherenko, M. Shi, M. Radovic, E. Rienks, G. Zwicknagl, K. Matho, J. W. Allen, C. Laubschat, C. Geibel, and D. V. Vyalikh, Temperature-independent fermi surface in the kondo lattice YbRh2Si2, Physical Review X 5, 011028 (2015).
- Leuenberger et al. [2018] D. Leuenberger, J. A. Sobota, S.-L. Yang, H. Pfau, D.-J. Kim, S.-K. Mo, Z. Fisk, P. S. Kirchmann, and Z.-X. Shen, Dehybridization of and states in the heavy-fermion system YbRh2Si2, Physical Review B 97, 165108 (2018).
- Kim et al. [2017] H. Kim, Y. Yoshida, C.-C. Lee, T.-R. Chang, H.-T. Jeng, H. Lin, Y. Haga, Z. Fisk, and Y. Hasegawa, Atomic-scale visualization of surface-assisted orbital order, Science Advances 3, eaao0362 (2017).
- Haze et al. [2018] M. Haze, Y. Torii, R. Peters, S. Kasahara, Y. Kasahara, T. Shibauchi, T. Terashima, and Y. Matsuda, In Situ STM Observation of Nonmagnetic Impurity Effect in MBE-grown CeCoIn5 Films, Journal of the Physical Society of Japan 87, 034702 (2018).
- Bobaru and Zhang [2015] F. Bobaru and G. Zhang, Why do cracks branch? A peridynamic investigation of dynamic brittle fracture, International Journal of Fracture 196, 59 (2015).
- Marder [2004] M. Marder, Cracks cleave crystals, Europhysics Letters 66, 364 (2004).
- Herrera et al. [2020] E. Herrera, V. Barrena, I. Guillamon, J. A. Galvis, W. J. Herrera, J. Castilla, D. Aoki, J. Flouquet, and H. Suderow, One-dimensional moire charge density wave in the hidden order state of URu2Si2 induced by fracture, (2020), arXiv:2003.07881 .
- Shishido et al. [2010] H. Shishido, T. Shibauchi, K. Yasu, T. Kato, H. Kontani, T. Terashima, and Y. Matsuda, Tuning the dimensionality of the heavy fermion compound Celn3, Science 327, 980 (2010).
- Mizukami et al. [2011] Y. Mizukami, H. Shishido, T. Shibauchi, M. Shimozawa, S. Yasumoto, D. Watanabe, M. Yamashita, H. Ikeda, T. Terashima, H. Kontani, and Y. Matsuda, Extremely strong-coupling superconductivity in artificial two-dimensional Kondo lattices, Nature Physics 7, 849 (2011).
- Shimozawa et al. [2012] M. Shimozawa, T. Watashige, S. Yasumoto, Y. Mizukami, M. Nakamura, H. Shishido, S. K. Goh, T. Terashima, T. Shibauchi, and Y. Matsuda, Strong suppression of superconductivity by divalent ytterbium Kondo holes in CeCoIn5, Physical Review B 86, 144526 (2012).
- Gauthier et al. [2020] N. Gauthier, J. A. Sobota, M. Hashimoto, H. Pfau, D.-H. Lu, E. D. Bauer, F. Ronning, P. S. Kirchmann, and Z.-X. Shen, Data for “Quantum well states in fractured crystals of the heavy fermion material CeCoIn5”, Stanford Digital Repository. Available at: https://doi.org/10.25740/px092px3282 (2020).