1Kavli Institute for Astronomy and Astrophysics, Peking University, Yi He Yuan Lu 5, Hai Dian District, Beijing 100871, China.
High-precision distance measurements with classical pulsating stars
Abstract
Classical Cepheid and RR Lyrae variables are radially pulsating stars that trace young and old-age stellar populations, respectively. These classical pulsating stars are the most sensitive probes for the precision stellar astrophysics and the extragalactic distance measurements. Despite their extensive use as standard candles thanks to their well-defined Period-Luminosity relations, distance measurements based on these objects suffer from their absolute primary calibrations, metallicity effects, and other systematic uncertainties. Here, I present a review of classical Cepheid, RR Lyrae, and type II Cepheid variables starting with a historical introduction and describing their basic evolutionary and pulsational properties. I will focus on recent theoretical and observational efforts to establish absolute scale for these standard candles at multiple wavelengths. The application of these classical pulsating stars to high-precision cosmic distance scale will be discussed along with observational systematics. I will summarize with an outlook for further improvements in our understanding of these classical pulsators in the upcoming era of extremely large telescopes.
keywords:
Stars: Variables: Cepheids, RR Lyrae, Type II Cepheids, Stars: evolution, Stars: oscillations, Cosmology: distance scaleanupam.bhardwajj@gmail.com
21 Jun 202029 Jun 2020. In original form 12 May 2020.
12.3456/s78910-011-012-3 \artcitid#### \volnum000 0000 \pgrange1– \lp1
1 Introduction
Stars are primary engines of cosmic evolution and play a crucial role in our understanding of the Universe. Variable stars, in particular, provide information about the stellar properties including physical parameters, internal and external envelope structure and composition, and probe both the stellar evolution and cosmic distances. The first variable star was discovered more than four centuries back in 1596 by David Fabricius which was later named as Omicron Ceti or Mira and now represents one of the subclasses belonging to the long-period variables. The short-period, typically fainter, variable stars were not well-known until two British astronomers, Edward Pigott and John Goodricke started observations of Persei (Algol) in 1782 (Goodricke, 1783). A few years later, Pigott detected the variability in Aquilae, the first known Cepheid variable. At the same time, Goodricke discovered Cephei (Goodricke, 1786), which represents classical Cepheid variables as one of the most important classes of pulsating variables in the modern astronomy.
About a century later the first variable stars within a Galactic globular cluster (GGC) were discovered by Wilhelmina Flemming and reported in Pickering (1889). Following this discovery, Solon Bailey initiated a search for variable stars in the GGCs from the Harvard College Observatory in 1893 and discovered hundreds of “cluster variables”. Bailey later separated the cluster variables as RR Lyrae subtypes but the RR Lyrae itself was discovered by Wilhelmina Flemming (Pickering et al., 1901). Historically, W Virginis was the prototype of Type II Cepheids (T2Cs) and it was discovered by Schönfeld (1866). The short-period representative of T2Cs, BL Herculis was discovered by Hoffmeister (1929) and the variability of long-period RV Tauri was first observed by Ceraski (1905)111https://www.aavso.org. A more detailed historical overview of classical Cepheids, RR Lyrae and T2Cs can be found in Catelan & Smith (2015) but this brief introduction demonstrates that the Cepheid and RR Lyrae stars represent two of the oldest and therefore well-studied subtypes of variable stars.
The observations of Cepheids in the Magellanic Clouds (Leavitt, 1908) led to the discovery of a relation between their pulsation period and luminosity (Leavitt & Pickering, 1912). This relation is commonly known as “Cepheid Period-Luminosity relation (PLR)” or the Leavitt Law honouring the discoverer. Ever since, classical Cepheids have played a fundamental role in the extragalactic distance measurements. Edwin Hubble used Cepheid PLR to determine reliable distance to the M31 and discovered that Andromeda, assumed to be a gaseous nebula at that time, is another galaxy beyond our Milky Way (Hubble, 1926). Cepheid-based distances to the galaxies as far as the Virgo cluster allowed Hubble to discover a linear correlation between the apparent distances to galaxies and their recessional velocities (Hubble, 1929) - the more distant the galaxy, the faster it moves away from us - now known as the Hubble-Lemaître law, providing the first evidence of the expanding universe. The slope of the velocity over distance is the Hubble constant (), which parameterizes the current expansion rate of the Universe. The current values in the late evolutionary universe are in tension with early universe measurements (Riess et al., 2018a; Planck Collaboration et al., 2018) and therefore understanding the systematics involved in standard candles is critical to resolve the tension, and improve the precision of cosmic distance scale. On the other hand, RR Lyrae, which are exclusively old and metal-poor stars, have been used as stellar tracers of the age, metallicity, extinction and structure of our Galaxy but their use as robust distance indicators gained importance more recently thanks to the boost of near-infrared (NIR) observations over the last two decades.
The goal of this review is to focus on recent progress on absolute calibration of classical Cepheids, RR Lyrae and T2Cs, and their application to the extragalactic distance scale. I strongly emphasize here that a short review can not fully describe all the aspects of these classical pulsating stars as standard candles. The interested readers are referred to the books, for example, Catelan & Smith (2015) on pulsating variables and de Grijs (2011) on introduction to the cosmic distance scale. Additionally, several excellent reviews are also available in the literature (Madore & Freedman, 1991; Feast, 1999; Wallerstein, 2002; Sandage & Tammann, 2006; Catelan, 2009; Feast, 2013; Subramanian et al., 2017; Beaton et al., 2018, and references within). McWilliam (2011) published an excellent set of online conference review articles on RR Lyrae stars focussed on different aspects beyond their use as distance indicators while a recent review of Cepheid and RR Lyrae as young and old stellar population tracers of the Galactic structure can be found in Matsunaga et al. (2018) and Kunder et al. (2018), respectively. Note that while classical and T2Cs will be discussed extensively here, Anomalous Cepheids (see, Wallerstein, 2002; Fiorentino et al., 2006; Groenewegen & Jurkovic, 2017b; Jurkovic, 2018, and references therein) are not included in this review.
This review is organised as follows: I describe briefly the description of evolutionary and pulsational scenario for classical pulsating stars in Section 2 and their light curve variations in Section 3. The Sections 4 to 6 focus on classical Cepheids, RR Lyrae and T2Cs as distance indicators both from the observational and theoretical perspectives at multiple wavelengths. The absolute scale for each standard candle and associated systematics is also addressed. Finally, summary with an outlook for the future will be briefly presented in Section 7.
2 Evolutionary and Pulsational Scenario
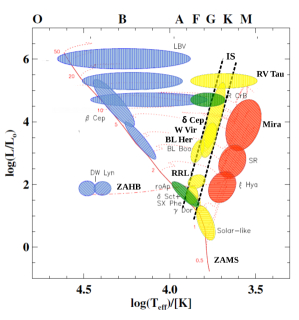
Cepheid and RR Lyrae represent radially pulsating class of variable stars. Classical Cepheids are young (10-300 Myr), intermediate-mass (3-10), metal-rich stars while RR Lyrae are old ( Gyr), low-mass (0.5-0.8) metal-poor stars. T2Cs also belong to old, low-mass, metal-poor stellar populations. Classical pulsating variables populate a well-defined narrow vertical region in temperature in the Hertzsprung-Russell (HR) diagram, known as the instability strip (IS). Fig. 1 shows the location of classical pulsating stars including Cepheid and RR Lyrae within the IS in the HR diagram. Classical Cepheids, represented by the prototype Cep, are luminous yellow giant variables that pulsate in fundamental (FU), first-overtone (FO), second-overtone harmonics and multiperiodic (double/triple) modes (Soszyński et al., 2015). RR Lyrae occupy the region between the cross-section of the Horizontal Branch (HB) and the IS. Although RR Lyrae stars also pulsate primarily in the fundamental-mode (RRab) and first-overtone modes (RRc), few variables pulsating in more than one mode simultaneously (RRd) have also been discovered (for example, Soszyński et al., 2017b).
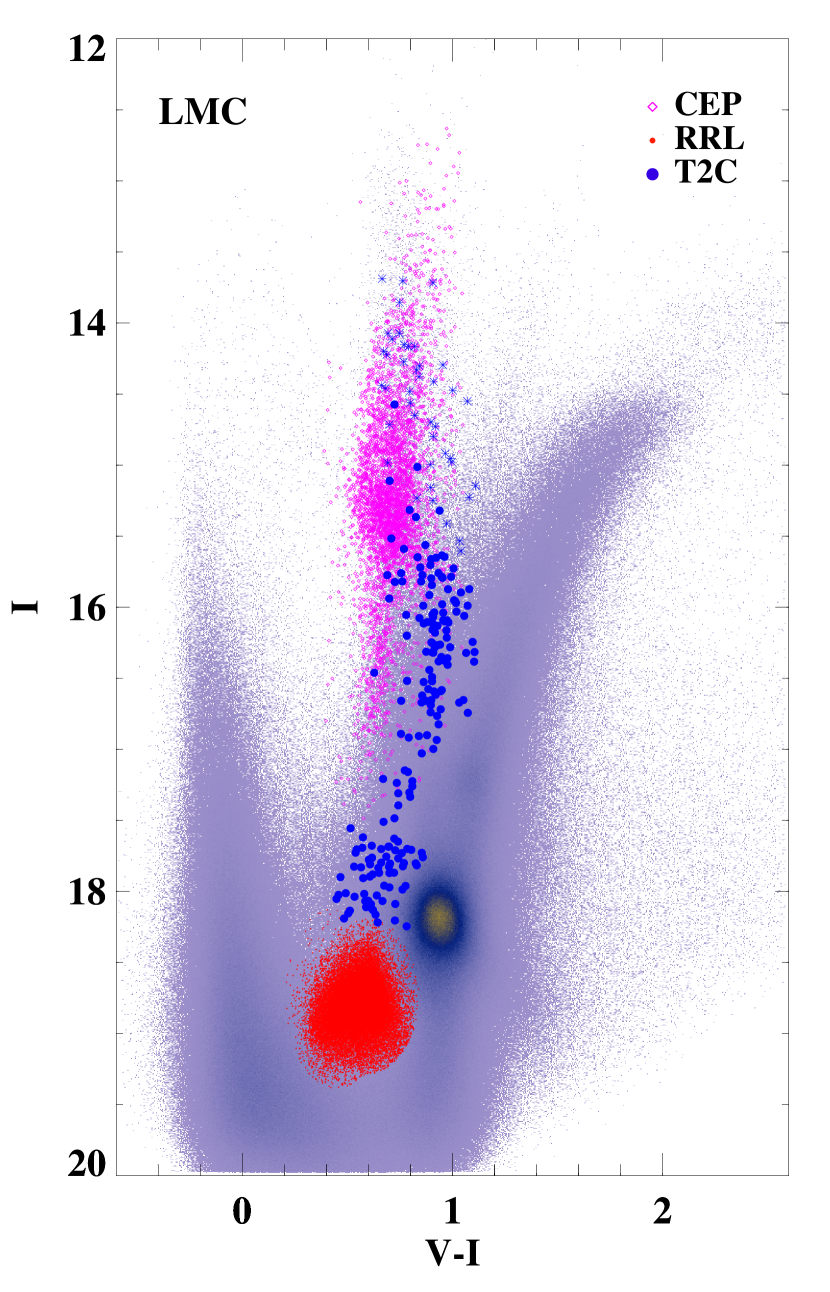
The T2Cs represent different evolutionary states from post HB to the asymptotic giant branch (AGB) phase and a preliminary classification is done based on their pulsation periods: BL Herculis (BL Her, d), W Virginis (W Vir, d) and RV Tauri (RV Tau, d). Soszyński et al. (2008) suggested another subtype, peculiar W Virginis (pW Vir, d), with distinct light curves and these peculiar stars are mostly brighter and bluer than W Vir. T2Cs primarily pulsate in the fundamental mode but BL Hers pulsating in the first-overtone mode have also been discovered by Soszyński et al. (2019). Fig. 2 shows distribution of classical Cepheids, RR Lyrae, and T2Cs on the observed color-magnitude diagram in the Large Magellanic Cloud (LMC) from the optical gravitational lensing experiment (OGLE, Udalski et al., 1993; Soszyński et al., 2015, 2016, 2018). The T2C population is located along the IS and have luminosities that are intermediate between classical cepheids and RR Lyrae. However, the RV Tau and some W Vir overlap the region of classical Cepheids but the T2Cs are typically significantly less abundant than classical Cepheids and RR Lyrae. The basic properties of Cepheids and RR Lyrae are given in Table 1. Depending on the pulsation periods, classical Cepheids are systematically 2-3 magnitude brighter than T2Cs at a fixed period and up to mag brighter than RR Lyrae.
| \toplineStar | Subtype | Mass | Period range | Period | ||||
| M⊙ | days | days | mag | mag | mag | |||
| \midlineClassical Cepheids | Pop I | Fundamental mode (FU) | 3-10 | 1 - 100 | 1 | -1.5 | -2.5 | 0.45 |
| 10 | -4.0 | -6.0 | 0.20 | |||||
| 50 | -6.0 | -8.0 | 0.65 | |||||
| First-overtone mode (FO) | 3-10 | 0.5 - 6 | 1 | -1.5 | -3.0 | 0.20 | ||
| 5 | -4.0 | -5.5 | 0.20 | |||||
| RR Lyrae | Pop II | Fundamental mode (RRab) | 0.5-0.8 | 0.3 - 1.0 | 0.4 | +0.8 | -0.1 | 0.80 |
| 0.6 | +0.8 | -0.5 | 0.35 | |||||
| First-overtone mode (RRc) | 0.5-0.8 | 0.2 - 0.5 | 0.3 | +0.7 | -0.1 | 0.25 | ||
| Type II Cepheids | Pop II | BL Herculis (BL Her) | 0.5-0.6 | 1 - 4 | 1 | +0.2 | -1.0 | 0.50 |
| W Virginis (W Vir) | 1 | 4 - 20 | 10 | -1.3 | -3.5 | 0.25 | ||
| RV Tauri (RV Tau) | 1 | 20 - 80 | 50 | -4.0 | -5.5 | 0.30 |
Notes: The reader should be cautious regarding numbers shown in this table which are only crude approximation and presented here for a relative comparison. Population I Cepheids are young (10-300 Myr) and Population II RR Lyrae are old ( 10 Gyr) stellar populations. The period-range and -band amplitudes corresponding to the period listed in the column 4 are estimated within 90% percentile range from the OGLE-LMC data (Soszyński et al., 2015, 2016, 2018). Absolute -band and -band magnitudes for the given period in the column 4 are derived from the LMC PLRs discussed in the next sections.
2.1 Stellar evolutionary states
Let us first consider the evolution of Cepheid-like intermediate-mass (M⊙) stars in their post main-sequence phase and going through the IS. Once a star has exhausted hydrogen in the core, it expands to become a red giant with a temporarily inert helium core that is surrounded by a hydrogen burning shell. The expansion of a star happens very rapidly, and therefore, it is difficult to observe it during this short evolutionary phase which reflects in the Hertzsprung gap between main sequence and red giant stars (Kippenhahn & Weigert, 1991). For a classical Cepheid-like star (say M⊙) the expansion of stellar envelope moves star to cooler temperature in the HR diagram during the first crossing through the IS. The first crossing is usually very rapid ( years) and the star exits the red edge of the IS while the hydrogen shell is still burning. Once the ignition of the helium starts, the star contracts and heats up, and makes a loop towards the hotter effective temperature in the HR diagram. During this phase, the star crosses the IS for the second time and undergoes a “blue loop” (See Chapter 31, Figures 31.2 & 31.4 in Kippenhahn & Weigert, 1991). Since the central helium burning evolutionary phase lasts for a longer time-scale, the star remains in the IS for a greater time than the first crossing. The star can undergo a third crossing through the IS during the blue loop or return without crossing the blue edge of the IS. The exact location of the blue loops is a function of stellar mass and of the chemical composition. For higher mass stars, the extent of blue loops increases while the low-mass stars can undergo only one crossing through the IS (see Fig. 1). At the late stage of evolution of high mass stars, the stellar core contains a degenerate mixture of carbon and oxygen which can ignite a supernova explosion if the mass limit reaches 1.4. While the initial mass of Cepheids for this to happen is not well constrained, typically an intermediate-mass star evolves onto the AGB while the most massive Cepheid can become a supernova. Interested readers are referred to Kippenhahn & Weigert (1991, and references therein); Chiosi et al. (1992, and references therein); Bono et al. (2000, and references therein); Salaris & Cassisi (2005, and references therein); Anderson et al. (2014, and references therein); Catelan & Smith (2015, and references therein) for more details regarding the evolution of intermediate-mass star in the central-helium burning phase. Similar to the stellar evolutionary timescale, the time spent in a Cepheid phase decreases dramatically as a function of mass. Note that the higher mass stars have longer pulsation periods. Therefore, short-period Cepheid variables are discovered in greater numbers than long-period ones if both are within the observational limits.
RR Lyrae, similar to classical Cepheids, are core helium burning stars and occupy a region in the HR diagram which is the intersection between the Cepheid IS and the HB. A low-mass (M⊙) star evolves to become a red giant in its post main-sequence phase and enters the HB evolutionary phase with helium burning core. The morphology of the HB itself is quite complex and a broad spectrum of HB-related topics are covered in the review by Catelan (2009). The zero-age HB (ZAHB) star is characterized by the helium-burning in the core and the hydrogen shell burning surrounding the helium core. The location of ZAHB stars on an almost horizontal locus in the HR diagram for given helium core mass and envelope composition depends on the total mass (or the envelope mass). These stars have a wide range of effective temperatures such that massive envelopes lead to cooler temperatures. After the onset of degenerate central helium burning, only stars with initial main-sequence masses of achieve the temperatures that place them within the IS. Such stars pulsate and become RR Lyrae variables either when they are close to the ZAHB or else when they evolve to the blue or red side in the HR diagram. The blue edge of the IS of RR Lyrae is located at an effective temperature of K at the ZAHB luminosity level which decreases with increasing luminosity. The red edge of the IS is located somewhere around 5900 K and is very sensitive to the efficiency of convection, and the topology of the IS is also dependent on the metal abundance (see details in Bono & Stellingwerf, 1994; Bono, Incerpi & Marconi, 1996; Bono et al., 1997; Salaris & Cassisi, 2005; Catelan & Smith, 2015; Marconi et al., 2015, 2018).
T2Cs are in a post-HB evolutionary phase of low-mass stars evolving up the AGB. After the exhaustion of helium in the core, HB stars move towards brighter luminosities in the HR diagram evolving mainly into AGB. The post-HB evolution of star depends on its location on the HB or on the effective temperature. T2Cs represent the class of those pulsating stars that evolve from the blue tail of the HB and reach the IS at higher luminosities than those of RR Lyrae. These stars suffer shell flashes at the boundary between degenerate CO core and the helium region. Short-period BL Her stars evolve from the HB, bluer than the RR Lyrae gap, to AGB i.e., towards higher luminosity and larger radius in the process of depleting helium in their core. The intermediate period W Vir stars begin to undergo helium shell flashes as they reach AGB phase and make temporary excursions into the IS (Wallerstein, 2002). However, Groenewegen & Jurkovic (2017a) showed that the evolution of the W Vir subclass is not clear and they may have the binarity origin similar to pW Vir. The long-period RV Tau are thought to represent post-AGB evolution (Wallerstein, 2002). However, RV Tau may also evolve from the more massive and younger objects or represent binary evolution (Groenewegen & Jurkovic, 2017b; Manick et al., 2018). The evolutionary tracks of T2Cs were pioneered by Gingold (1976) and the updated theoretical calculations were presented by Bono, Caputo & Santolamazza (1997); Bono et al. (2016) and Smolec (2016).
2.2 Stellar pulsation mechanism
I will briefly discuss the physical mechanism driving the pulsations in Cepheid and RR Lyrae variables. The classical relation between the pulsation period and the mean-density of a pulsating gaseous sphere was first developed by Ritter (1879) who demonstrated that for a homogeneous sphere experiencing adiabatic radial pulsation-
| (1) |
where is the pulsation period, is the radius and is the surface gravity of gaseous sphere. Since, and using relation between mean density (), mass and radius-
| (2) |
where is the pulsational constant and the equation is known as the pulsation equation or the period-mean-density equation. However, the hypothesis of radial pulsations in stars came much later when more detailed investigations showed that the above relation is also valid for real stars.
Around early twentieth century, the periodic changes in the light and velocity curves of Cephei favoured the explanation that Cepheids were binary stars but the light variations of Cephei were significantly different from the confirmed spectroscopic binary Algol. Later, Shapley (1914) presented strong evidence against binary hypothesis noting that small parallaxes of Cepheids suggest the luminosities and radii of primary stars are on average and , respectively. These results favoured stellar pulsation for causing light variations in Cepheid-like variables. The pulsation hypothesis for a single star was also used by Martin & Plummer (1915) to explain the radial velocity variations of a RR Lyrae, then known as cluster variable. Finally, the most significant progress for the pulsating star hypothesis was made by Eddington (1918, 1919), who developed a theory of adiabatic oscillations of a stellar atmosphere. He suggested that every star of intermediate mass will go through a Cepheid phase for a brief time during its life-cycle, and the physics of radial oscillations was presented in Eddington (1926). Note that a PLR for pulsating stars follows directly from the Stefan-Boltzmann law and the pulsation equation (2) such that the bolometric magnitudes can be written as:
| (3) |
where pulsation period () is used assuming its dependence on stellar mass and radius through equation (1). The observable color term can replace the which results in a Period-Luminosity-Color (PLC) relation. In a two-dimensional plane, neglecting color-term, the PLRs in a given wavelength () takes the form:
| (4) |
The physical scenarios regarding the main driving mechanism behind Cepheid pulsation and stellar structure and evolution were explored by various authors (Christy, 1966; Stobie, 1969a; Cox, 1980b). The pulsation occurs in the stellar envelope for a specific range of surface effective temperatures i.e., within the IS, a region where stars are unstable to pulsation. For example, in a Cepheid-like star with temperature near 6000K, hydrogen ionization zone occurs close to the surface of the star. Further, helium becomes doubly ionized in another zone deeper in the stellar envelope. The increase in the opacity () increases the ionization in both the hydrogen and helium ionization zones. Due to cyclic variations in the opacity, the energy is trapped during contraction, favouring instability. Since the ionization occurs deep inside the surface of the star, the pressure or excitation beneath drives stellar envelope expansion. The phenomena works as a mechanical valve and the expansion reduces the opacity and the energy is released. The temperature and pressure drop and the expansion occurs only due to momentum of the envelope structure. Finally, star starts contracting again and the temperature regains its initial value, thus re-starting the pulsation cycle. Since the mechanism responsible for pulsation is mainly the increase in the opacity of the ionization zones, it is known as the “ mechanism” (Kippenhahn & Weigert, 1991; Salaris & Cassisi, 2005; Catelan & Smith, 2015). In the case of radial pulsations, if all parts of a star move in and out together, the pulsation occurs in fundamental-mode but the star can have an infinite number of modes. Within the IS, classical Cepheid and RR Lyrae variables exhibit pulsations during their long-lasting central helium burning evolutionary phase and the pulsations in T2Cs occur during post-HB evolution. As a passing remark, non-radial pulsation and light curve modulations have also been discovered in classical pulsating stars (for example see, Dziembowski & Mizerski, 2004; Netzel, Smolec & Moskalik, 2015; Moskalik et al., 2015; Smolec & Śniegowska, 2016; Anderson, 2016, and reference within for more details).
It is important to emphasize here that for classical Cepheids, evolutionary masses are systematically larger at the level of than the pulsation masses or masses derived from other independent methods (Cox, 1980a; Caputo et al., 2005; Prada Moroni et al., 2012; Neilson, Cantiello & Langer, 2011; Marconi et al., 2013a, and references therein). This Cepheid mass discrepancy originally proposed by Christy (1968); Stobie (1969a, b) is an open problem. Discovery of classical Cepheid in the binary system (Pietrzyński et al., 2010) allowed precise dynamical mass estimates which were found to be consistent with masses derived from the pulsation models (see also, Pilecki et al., 2018). Therefore, non-standard phenomena like mass-loss, core overshooting and rotation have been explored in evolutionary models for consistency with pulsation masses (Prada Moroni et al., 2012; Anderson et al., 2014).
3 Light curve morphology
 |
 |
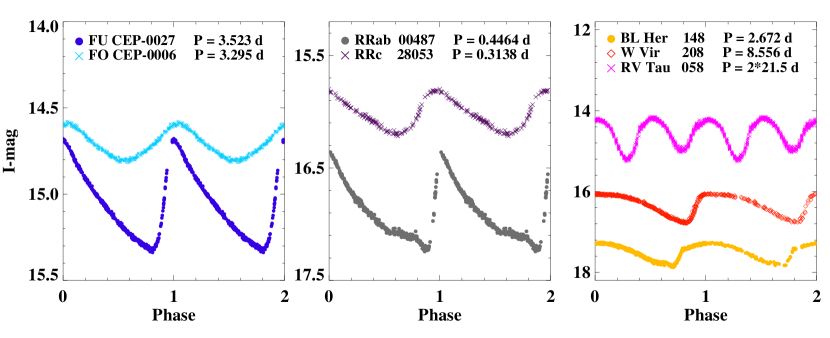
The analysis of the light curve structure of Cepheid and RR Lyrae variables is very useful for their identification and classification. At the same time, pulsation models can also be used to successfully predict the multiband light and radial velocity variations. Therefore, quantification of light curve structure can allow a rigorous comparison between observations and theory and provide constraints for the stellar pulsation models (Wood, Arnold & Sebo, 1997; Marconi et al., 2013b, 2017). Top panels of Fig. 3 show the -band light curves of classical Cepheids, RR Lyrae and T2Cs in the LMC from the OGLE survey (Soszyński et al., 2015, 2016, 2018). Typical optical light curves of fundamental mode Cepheids are symmetric with a saw-tooth feature while some Cepheids also exhibit “bump” along their light curves. Hertzsprung (1926) discovered that Galactic Cepheids present a relationship between the pulsation period and the location of the bump along the light curve - known as “Hertzsprung Progression”. Classical Cepheids show a bump on the descending branch of both the light and velocity curves for periods between 6 and 16 days and it appears around the phases of maximum light for periods between 9 and 12 days. For longer period Cepheids, the bump feature appears on the rising branch. The central period of the Hertzsprung progression has been used to constrain models (Bono, Marconi & Stellingwerf, 2000). It depends on the metal-abundance and wavelength such that it shifts to longer periods with decreasing metallicity or increasing wavelengths (Bhardwaj et al., 2017a). Note that “bump Cepheids” are single mode variables with strong regularity in their light curves while the so called “Beat Cepheids’ are mixed-mode variables that pulsate in two or more modes simultaneously.
The shape of fundamental-mode RR Lyrae optical light curves is more saw-toothed than that of classical Cepheids. The RRab light curves also exhibit a sharp rise from minima to maxima and a distinct bump near the minimum light. The first-overtone Cepheid and RR Lyrae variables display near-sinusoidal variations in the light curves even at optical wavelengths. T2Cs generally display complex light curve variations with BL Her showing variations similar to RRab while W Vir sometimes complement fundamental-mode classical Cepheids. RV Tau stars exhibit complex light curves with varying maxima and minima from cycle-to-cycle. At longer wavelengths, both amplitude and phase variations decrease significantly and the skewness and acuteness of Cepheid and RR Lyrae light curves attain a value close to unity implying a nearly symmetric sinusoidal variations as a function of pulsation phase.
Simon & Lee (1981) used Fourier analysis method to study light curve of periodic variables and showed that the lower order Fourier coefficients can be used to describe the structure of Cepheid and RR Lyrae variables. In brief, a Fourier series can be fitted to the periodic light curves in the following form:
| (5) |
where, is the magnitude as a function of the pulsation phase (). The Fourier-fit results in a mean-magnitude () and amplitude () and phase () coefficients which are used to construct Fourier amplitude ratios and phase differences: (Bhardwaj et al., 2015). Fourier analysis of classical Cepheid, RR Lyrae, and T2C light curves were first carried out by Simon & Lee (1981), Simon & Teays (1982) and Petersen & Diethelm (1986), respectively. A comparison of the observed light and velocity curves of classical Cepheids with theoretical models was followed in a number of studies (Simon & Davis, 1983; Simon & Moffett, 1985; Stellingwerf & Donohoe, 1986). The phase lag obtained from Fourier decomposition of light curves was found to be the most useful parameter for comparison with observations. Later, Jurcsik & Kovacs (1996) derived an empirical relation between period, Fourier phase parameter (), and metallicity for fundamental mode RR Lyrae variables, which is used extensively in deriving photometric metallicities of the statistical samples of RR Lyrae with well-sampled light curves (for example, Pietrukowicz et al., 2015). Fourier analysis of Cepheid and RR Lyrae have also been used for the classification of these variables (for example, Deb & Singh, 2009; Kains et al., 2019). The lower-order Fourier parameters contain the most characteristic information about the light curve structure and occupy different regions in period and Fourier parameter planes.
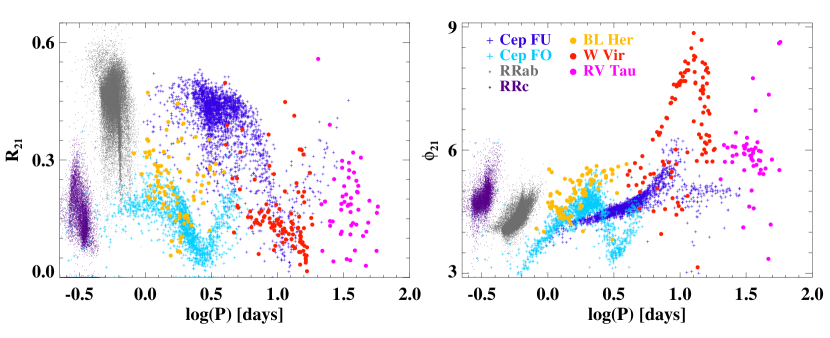
In the bottom panel of Fig. 3, Fourier amplitude and phase parameters are plotted against the pulsation period. Classical Cepheids display a distinct progression at 10 days in the case of fundamental mode Cepheids and at 2.5 days in the case of first-overtone mode Cepheids. The sharp changes in the Fourier plane at 10 days are attributed to the resonance , in the normal mode spectrum (Simon & Schmidt, 1976; Simon & Lee, 1981). In case of multiwavelength light curves of Cepheids, the phase of maximum-light shifts to later phases as a function of wavelength (Madore & Freedman, 1991). Similarly, the Fourier amplitude parameters decrease while the Fourier phase parameters increase with wavelength at a given period for both Cepheid and RR Lyrae variables (Bhardwaj et al., 2017a; Das et al., 2018). The Fourier parameters of RR Lyrae do not exhibit any significant structure within short-period range, as can be seen in Fig. 3. However, each subclass of T2Cs display a distinct structure on the Fourier parameter plane, and the amplitude and phase parameters also overlap with those of classical Cepheids.
The modern stellar pulsation models are based on nonlinear, radial pulsation codes that account for nonlocal and time-dependent treatment of turbulent convection (Stellingwerf, 1982; Bono & Stellingwerf, 1994; Bono, Marconi & Stellingwerf, 1999). These models accurately predict the observables, including the topology of the IS, pulsation modes, amplitudes, multiband light and radial velocity variations (Bono et al., 2000; Marconi et al., 2013b, 2015). The model-fitting of observed light curves with pulsation models was first carried out by Wood, Arnold & Sebo (1997) resulting in a robust distance to the LMC. Marconi et al. (2013a) performed model-fitting of Cepheids in an eclipsing binary system and predicted pulsation masses that are consistent with dynamical estimates, and later extended model-fitting to multiband light curves of Cepheids in the Small Magellanic Cloud (SMC, Marconi et al., 2017). Bhardwaj et al. (2017a) and Das et al. (2018) performed a multiwavelength comparison of Cepheid and RR Lyrae light curve parameters and found that models are consistent with observations in most period bins. While the theoretical amplitudes are systematically larger than the observed amplitudes, this discrepancy can be remedied by increasing the convective efficiency in the models. Using a machine-learning approach, Bellinger et al. (2020) compared observed and modelled Fourier light curve parameters of Cepheid and RR Lyrae and provided a preliminary estimates of physical parameters such as mass, luminosity, temperature, radius, and distances to the observed stars in the Galaxy and the Magellanic Clouds with a precision limited by a finer grid of models covering entire period range.
At shorter wavelengths, ultravoilet (UV) and X-ray studies of classical pulsators are very limited, and aimed at exploring evolutionary, pulsational and atmospheric properties of these variables (for example, Downes et al., 2004; Engle, 2015; Siegel et al., 2015; Neilson et al., 2016; Sachkov, Bertone & Chavez, 2018, and references therein). At UV wavelengths, the amplitudes of classical pulsators are significantly large (up to 4 mag in RR Lyrae, Kinman & Brown, 2014; Siegel et al., 2015), which makes their identification and classification easier provided sufficient time coverage is available. Combining with the light curves at longer wavelengths, the large amplitudes of UV light curves can be used to constrain the impact of convective efficiency in the non-linear pulsation models. Furthermore, simultaneous model-fits to UV, optical and IR data can also provide insight into the physical parameters of these pulsating stars (Wheatley, Welsh & Browne, 2012).
4 Classical Cepheids as distance indicators
Over the past century, Cepheid variables have been used as standard candles with considerable interest in determining distances to star-forming galaxies out to Mpc. The Cepheid PLRs in the Galaxy and the LMC have played a vital role in calibrating the distant type Ia supernovae in the local universe, and connecting to the Hubble flow to determine a value of (see the review by Freedman & Madore, 2010). The Hubble Space Telescope (HST) key project on extragalactic distance scale utilized traditional Cepheid-Supernovae distance ladder to estimate a 10 precise (Freedman et al., 2001), thus, settling a debate on the factor of two uncertainty in the expansion rate of the universe. In the past decade, Supernovae and for the Equation of State (SH0ES) project has made a significant progress in reducing the systematics in Cepheid-Supernovae distance ladder to (Riess et al., 2011, 2016, 2019). However, improved precision of local measurements have resulted in a tension with cosmic microwave background based Plank mission results (Planck Collaboration et al., 2018). The current discord in the measurements between two extreme ends of the universe hints at possible new physics in the standard model and is one of the key ongoing problems in modern cosmology (Freedman et al., 2019; Riess et al., 2019; Verde, Treu & Riess, 2019).
Although Cepheids have been used successfully for the cosmic distance scale, their PLRs suffer from several systematic uncertainties that limit achieving a sub-percent precision in distance determination. The primary source of uncertainty arises from the lack of precise absolute calibration of Cepheid PLRs in our own Galaxy. Apart from the statistical photometric uncertainties, metallicity effects on PLRs and extinction corrections also contribute to the scatter in the Leavitt law thus limiting the precision of distance estimates to individual Cepheids. I will now discuss the recent progress in the Cepheid PLRs and some possible sources of uncertainties both from theoretical and observational side, wherever possible, in the following sections.
4.1 Multiband Period-Luminosity Relations
4.1.1 LMC calibrations:
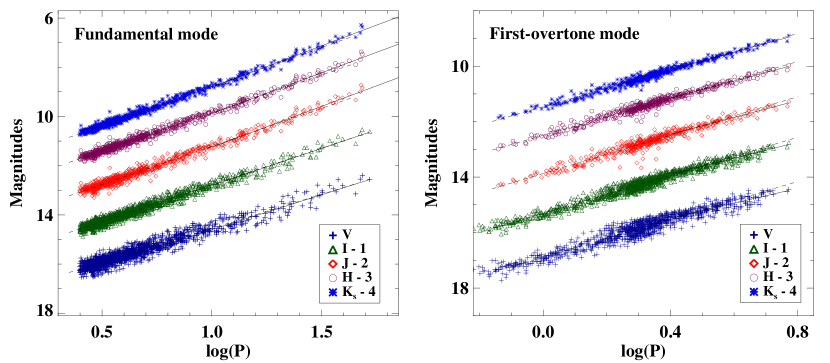
Classical Cepheids in the LMC have played a crucial role in providing the calibration of the first-rung of the cosmic distance ladder. More than a century after the discovery of Cepheid PLR, Soszyński et al. (2017a) claimed to have concluded the work by Heneritta Leavitt on identifying Cepheid variables in the Magellanic Clouds. OGLE survey has discovered more than 9500 classical Cepheids in the Magellanic Clouds allowing an empirical derivation of precise PLRs at optical wavelengths. Fig. 4 shows PLRs for classical Cepheids at optical and NIR wavelengths. The scatter in the optical band Cepheid PLRs is significant ( mag in and mag in ) due to the finite width of the IS. Once a color term as a proxy for temperature is included (extinction corrections are already applied), the scatter in these relations is reduced to within the observational uncertainties. Optical data for classical Cepheids in the Magellanic Clouds from the OGLE survey have been used to derive PLRs independently in several studies (Ngeow et al., 2015; Bhardwaj et al., 2016a, c; Wielgórski et al., 2017; Gieren et al., 2018). We list the -band PLRs for fundamental-mode Cepheids in the Magellanic Clouds for a relative comparison in the form of equation (4):
| (6) |
These relations are adopted from Wielgórski et al. (2017) and the statistical uncertainties on the slopes and zero-points are mag. Generally, the zero-point of the PLRs is adopted at 10 days or at the mean of underlying period range to minimize the correlated errors due the derived slopes. The slopes of -band Cepheid PLRs in the LMC and SMC are consistent within uncertainties. The optical PLRs of Cepheids have been used extensively for the distance determination (see reviews by Madore & Freedman, 1991; Feast, 1999; Sandage & Tammann, 2006; Freedman & Madore, 2010). However, significant scatter ( mag) in the optical PLRs due to the temperature variations, extinction, and metallicity limits their use in the era of precision cosmology.
In the past two decades, significant progress has been made in deriving precise PLRs for classical Cepheids at NIR wavelengths. The pioneering work of McGonegal et al. (1982) showed that the scatter of Cepheid PLRs even with random phase observations at NIR wavelengths is almost times smaller than at bluer wavelengths. It is well known that temperature variations are significantly smaller at longer wavelengths and the impact of extinction is about ten times less in -band compared to optical wavelenghts (Madore & Freedman, 1991). Therefore, both the impact of differential extinction and the measurement uncertainties on reddening are reduced significantly. Further, the pulsation amplitudes are smaller than in the optical bands allowing accurate mean-magnitude determination with sparsely sampled light curves. Also, the light curves in the infrared are typically sinusoidal and thus easier to model generating excellent templates. This allows for more precise measurement of period and mean magnitudes from fewer epochs which is particularly important for more distant systems where deep observations are very limited. While all these advantages and less sensitivity to metallicity effects makes infrared PLRs excellent tools for distance determination, smaller amplitude variations also create difficulty in their identification and classification.
One of the earliest statistically significant sample of 92 LMC Cepheids with NIR light curves was provided by Persson et al. (2004). The authors also derived Cepheid PLRs and PLC relations with a scatter of mag but their sample predominantly included long-period Cepheids. The increasingly larger sample of Cepheids with NIR time-series are available with time-domain surveys such as VISTA NIR survey of the Magellanic Clouds (VMC, Cioni et al., 2011) which is targetting almost all OGLE fields in the -bands. Preliminary results on Cepheid PLRs in the LMC in -bands from the VMC survey were provided by Ripepi et al. (2012) and Moretti et al. (2014a). Although, the VMC survey does not cover -band, it is expected to provide near-complete complementary sample of observations to OGLE Cepheids in the Magellanic Clouds (Ripepi et al., 2017).
Another excellent sample of NIR light curves of Cepheids in the central bar of the LMC was provided by the LMC NIR synoptic survey (Macri et al., 2015). Fig. 4 shows the Cepheid PLRs from the survey of Macri et al. (2015) where the scatter in band PLR is only mag. While this survey provided homogeneous time-series of Cepheids in the LMC, single-epoch NIR observations of larger samples of Cepheids have also been used extensively in deriving PLRs and Cepheid-based distance determinations (for example, Ita et al., 2004b, a; Inno et al., 2013). Ripepi et al. (2017) also provided time-series NIR photometry for Cepheids in the SMC from the VMC survey. The -band PLRs for Cepheids in the LMC (Macri et al., 2015) and SMC (Ripepi et al., 2017) in the form of equation (4) are listed below.
| (7) |
In the -band, the slopes of the PLRs are similar within the uncertainties ( mag) for LMC and SMC Cepheids. The scatter in the -band PLRs has reduced significantly ( for LMC Cepheids and for SMC Cepheids) as compared to -band (equation 4.1.1). The difference in the zero-points gives a relative distance between the Clouds and a precise calibration of LMC Cepheid PLRs can be used to estimate robust distance to the SMC. At present, the most precise primary calibration of Cepheid PLRs for distance scale studies is based on LMC anchored using its accurate late-type eclipsing binary distance ( (statistical) (systematic) mag Pietrzyński et al., 2019).
4.1.2 Galactic calibrations:
Despite the significant use of Cepheids for extragalactic distance determinations, the calibrations of Galactic Cepheid PLRs are not as precise as their LMC counterparts. The main reason is that the precise geometric distances to Galactic Cepheids were available only for a small sample with parallaxes from Hipparcos (van Leeuwen, 2007) and HST (Benedict et al., 2007; Riess et al., 2014). This is changing with increasingly accurate parallaxes from progressive Gaia data releases providing unprecedently precise astrometry (Lindegren et al., 2016; Clementini et al., 2017; Ripepi et al., 2018). In the pre-Gaia era, the most accurate parallaxes for Cepheids were limited to nearby objects ( kpc with HST, Benedict et al., 2007; Riess et al., 2014, 2018a). Cepheid distances have also been measured to relatively high precision by a number of independent-methods such as the Infrared Surface Brightness technique and Baade-Wesselink methods, cluster main-sequence fitting, and SpectroPhoto-Interferometry (see, Gieren, Fouque & Gomez, 1998; Kervella et al., 2004; Fouqué et al., 2007; Turner, 2010; Storm et al., 2011; Mérand et al., 2015; Gieren et al., 2018, and references therein for more details).
The uncertainties in the available Galactic calibrations of Cepheid PLRs are evident from the fact that their application results in a Cepheid-based LMC distance having systematics typically more than using most empirical calibrations, while a geometric distance to the LMC is now known to precision (Pietrzyński et al., 2019). The different calibrations of Galactic Cepheid PLRs lead to an active debate regarding the universality of Cepheid PLRs between the Galaxy and the LMC as the metallicity and extinction effects may change the slope as well as the intercept of the PLRs (Sandage & Tammann, 2006). For example, a multiwavelength calibration of Galactic Cepheid PLRs was carried out by Fouqué et al. (2007) using distances to Cepheids based on several independent methods mentioned previously, including trigonometric parallaxes. The authors did not find any significant variation in the Cepheid PLRs between the Galaxy and the LMC. Storm et al. (2011) calibrated PLRs using distances derived from infrared surface brightness method and found no variation in the slope and a marginal change in the zero-point between Galactic and LMC Cepheid PLRs in the NIR bands. Several other studies also provided calibration of Galactic Cepheid PLRs (Ngeow, 2012; Groenewegen, 2013; Bhardwaj et al., 2016b) but they all used nearly the same sample of distances to nearby Cepheids. The Galactic Cepheid PLRs based on Baade-Wesselink distances from Gieren et al. (2018) differ from their Magellanic Cloud counterparts at all wavelengths. The and -band PLRs from Gieren et al. (2018) are given here in the form of equation (4):
| (8) |
where the uncertainties on the slopes and zero-points are mag and mag, respectively. Comparing with the equations (4.1.1) and (4.1.1), it is evident that the slopes of -band PLRs are similar between the Galaxy and the Magellanic Clouds while the slopes of -band PLRs in the Milky Way differs from the ones in the Magellanic Clouds but still consistent within uncertainty. Bhardwaj et al. (2016b) also provided absolute calibration of the Galactic relations based on several distance determination methods accounting for the intrinsic scatter of each technique. The authors derived a -band PLR similar to the equation (4.1.2) and determined an independent distance to the LMC of (statistical) mag based on NIR photometry of Cepheid from Macri et al. (2015) in concordance with the geometric distance.
4.1.3 Theoretical calibrations:
Multiwavelength calibrations of Cepheid PLRs based on stellar pulsation models have been used to provide comparison with the empirical relations and explore possible systematics in the predicted distance scale. The nonlinear modelling of Cepheids incorporating coupling between hydrodynamical equations and time-dependent convection by Stellingwerf (1982, 1984); Bono & Stellingwerf (1994) formed a solid basis for such comparisons. Bono et al. (1999) derived theoretical PLR and PLC relations for models representative of Cepheids in the Galaxy and the LMC and showed that theoretical -band relations are consistent with empirical investigations. Caputo et al. (2000) extended model computations to multiple wavelengths and their PLRs were also fairly consistent with observations but also displayed some dependence on metallicity. Bono et al. (2002) also presented first-overtone Cepheid models in the Magellanic Clouds and suggested that a mild overshooting in pulsation models is needed for the consistency between empirical and theoretical PLRs. They did not find any metallicity dependence and estimated distance to the Magellanic Clouds that agree at the 2% level with empirical results.
In stellar pulsation models, for a given chemical composition, the major systematics in the absolute calibration of Cepheid PLRs arises due to poorly understood phenomenon like mass-loss, core overshooting and rotation. It is very difficult to disentangle the effects of these phenomenon on the mass-luminosity relation of classical Cepheids adopted as input to the pulsation models. Note that the canonical mass-luminosity relations are those that come from stellar evolutionary calculations and the non-canonical mass-luminosity relations typically have brighter luminosity levels by 0.25 dex to account for non-standard phenomenon (Marconi et al., 2013b). However, the zero-point of the adopted mass-luminosity also affects the zero-point of PLRs. For example, an increase in the luminosity level by 0.25 dex at fixed mass, due to one or more of the above mentioned non-standard phenomena, implies a decrease of 0.2 mag ( on distance) in the estimated distance moduli from the PLRs (Marconi, Musella & Fiorentino, 2005; Fiorentino et al., 2007). Furthermore, the zero-point of theoretical PLRs is also dependent on the treatment of convective efficiency through the variation in the mixing-length parameter in the pulsation models (Fiorentino et al., 2007). I will also discuss the theoretical predictions of chemical composition on Cepheid PLRs later when comparing to empirical investigations.
Using stellar evolutionary models, Anderson et al. (2014) investigated the effect of rotation on Cepheids and found that it affects the mass-luminosity relations particularly during the blue loop phase. The authors showed that the difference in Cepheid luminosities between different crossings of the IS also increases with faster rotation. Furthermore, rotation also contributes to the dispersion in Cepheid PLRs (Anderson et al., 2014, 2016), and more importantly, can also resolve the Cepheid mass discrepancy problem (Stobie, 1969a, b).
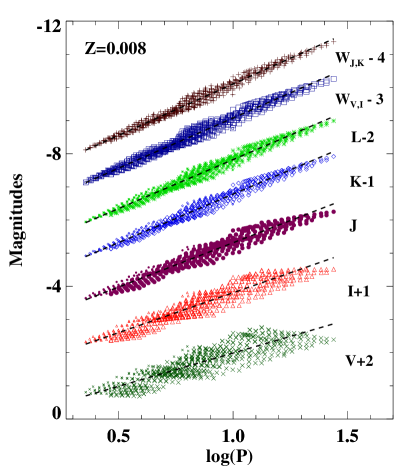
Fig. 5 displays PLRs at multiple wavelengths for metal-abundance (Z=0.008, Y=0.25) representative of Cepheids in the LMC. The first-overtone mode Cepheids are fundamentalized using the equation: . The Cepheid models are adopted from Marconi et al. (2013a) and used in Bhardwaj et al. (2017a). These models include Cepheid masses from adopting both canonical and non-canonical mass-luminosity relations, and both the standard () and increased convective efficiency (). The PLRs for fundamental mode Cepheids in the period range, days, are listed below:
| (9) |
While the theoretical & -band Cepheid PLRs in the LMC are shallower than the empirical calibrations in the Magellanic Clouds, -band PLR is consistent with the empirical calibration in the Galaxy. Note that the slopes of & -band theoretical PLRs listed in Bono et al. (Table 2, 2010) are in excellent agreement with empirical relations but vary significantly between short ( day) and long-period ( day) Cepheids. The slopes of PLRs in the equation (4.1.3) are also in agreement with those of long-period Cepheids from Bono et al. (2010). Apart from the period range under consideration, theoretical PLRs also depend on the composition, adopted mass-luminosity relation and the efficiency of convection in the pulsation models.
4.1.4 Mid-infrared calibrations:
The mid-infrared (MIR) observations of Cepheids hold a significant advantage with respect to shorter wavelengths because the extinction is more than an order of magnitude smaller () at 3.6m band. Furthermore, the luminosity variations due to pulsations are mostly insensitive to effective temperature. Therefore, amplitude variations, which are smaller than -band, predominantly occur from small radius fluctuations. The infrared Cepheid spectra are also mostly free from line blanketing thus reducing the dependence of the PLRs on metallicity, although CO band-head at is very sensitive to temperature variations (see Scowcroft et al., 2016b, for details). Given increasing MIR observations in the past decade, several investigations were aimed at providing empirical calibrations of MIR PLRs for Cepheid variables, in particular, with InfraRed Array Camera (IRAC, Fazio et al., 2004) onboard Spitzer Space Telescope.
High-precision MIR photometry for Cepheids in the Galaxy and the LMC have been used to derive empirical PLRs at these wavelengths (Freedman et al., 2008; Ngeow, Kanbur & Nanthakumar, 2008; Madore & Freedman, 2009; Marengo et al., 2010). Most of these studies utilized single-epoch photometry at 3.6, 4.5, 5.8 and 8.0 m for Cepheids and the resulting PLRs exhibited a dispersion of mag, better than the optical counterparts with mean-magnitudes from well-sampled light curves. Marengo et al. (2010) used two random epochs of photometry and provided Cepheid MIR PLRs including first-time ever at 24 and 70 m wavelengths. The zero-points of their Galactic calibrations were primarily anchored using the HST parallaxes from Benedict et al. (2007). The MIR PLRs of Cepheids were extended to NGC 6822 (Madore & Freedman, 2009), IC 1613 Freedman et al. (2009), and for the OGLE sample of fundamental-mode (Ngeow et al., 2009, 2015) and first-overtone mode Cepheids in the Magellanic Clouds (Bhardwaj et al., 2016c).
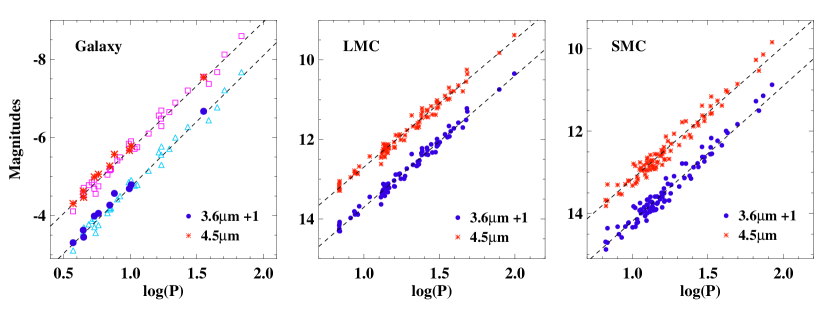
Due to significant advantages of MIR observations, Carnegie Hubble Program was aimed at measuring a with a precision of using the absolute calibration of Cepheid PLRs at and (Freedman et al., 2011). Time-series observations of Galactic and Magellanic Clouds Cepheids spanning over 24 epochs were obtained as part of this program. Fig. 6 shows MIR Cepheid PLRs in the Galaxy, LMC and the SMC from Monson et al. (2012), Scowcroft et al. (2011) and Scowcroft et al. (2016a). The -band PLRs in these three galaxies are listed below:
| (10) |
Note that the Galactic calibration was still based on the HST parallaxes and other independent methods discussed previously but the scatter in MIR Cepheid PLRs was reduced to 0.1 mag with a zero-point uncertainty of only . Equation 4.1.4 suggests that -band PLR in the Galaxy and Magellanic Clouds is universal. The Galactic calibration leads to a precise distance to the LMC ( mag) and SMC ( mag). Scowcroft et al. (2016b) also found that ([3.6]-[4.5]) colour is a reliable metallicity indicator for Cepheids. The Galactic (zero-point) and LMC (slope) calibrations of Cepheid MIR PLRs led to a factor of three decrease in the systematic uncertainties resulting in a precise measurement (Freedman et al., 2012). The absolute calibrations of Cepheid PLRs at MIR wavelengths will be critical in the era of James Webb Space Telescope (JWST) thanks to the higher resolution and higher sensitivity enabling access to crowded and extincted regions of more distant supernovae host galaxies.
4.2 Period-Wesenheit relations
Multiwavelength observations of Cepheids (or RR Lyrae) allow us to obtain distances and color excess simultaneously. Given a reddening law and photometry in at least two filters, PLRs can be used to solve for two unknowns - distance modulus () and extinction (). Similar to this approach, to circumvent the problem of extinction, van den Bergh (1975); Madore (1982) constructed reddening free Wesenheit magnitudes that are used in deriving Period-Wesenheit relations (PWRs). At given wavelengths, say , , , the Wesenheit functions can be written in the following form:
| (11) |
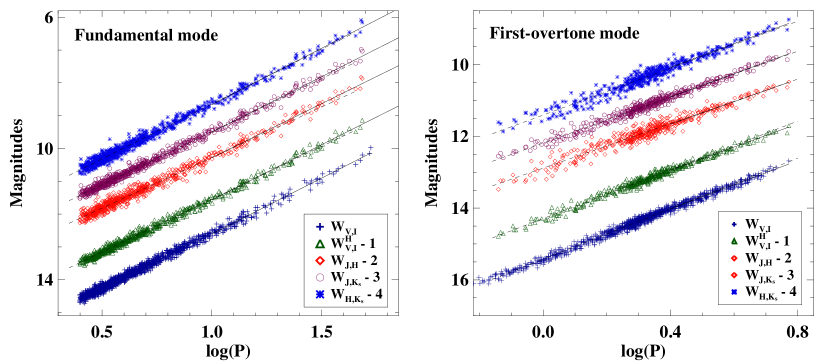
where represents the mean magnitude at wavelength and . Generally, the superscript is dropped from for simplicity when . The total-to-selective absorption ratios are adopted based on a reddening law (for example, Cardelli, Clayton & Mathis, 1989) assuming a value of (Fouqué et al., 2007; Inno et al., 2013). The Wesenheit relations are a proxy for PLC relations such that the effects of the width of the IS are reduced due to the additional color term. Fig. 7 displays optical and NIR PWRs for classical Cepheids in the LMC from Bhardwaj et al. (2016b). The optical PWRs for Cepheids in the Magellanic Clouds from the OGLE survey are derived as , and the empirical relations are listed as follows:
| (12) |
The dispersion in the optical Wesenheit () is significantly smaller when compared to optical LMC Cepheid PLRs in the and -bands ( and , respectively, see Fig. 4). Theoretically, NIR and optical-NIR PWRs have additional advantage because these relations are independent of metal-abundance and linear over the entire period range (Bono et al., 2010). The most commonly used NIR PWR is defined as , and these relations in the Galaxy and the Magellanic Clouds are:
| (13) |
which are adopted from Gieren et al. (MW, 2018), Bhardwaj et al. (LMC, 2016b) and Ripepi et al. (SMC, 2017), respectively. The slopes of the PWRs are consistent within their uncertainties ( mag for the MW and mag for the Magellanic Clouds). Several theoretical and empirical studies have employed different combinations of filters to derive PLRs and subsequently estimate Cepheid-based distances (Fiorentino et al., 2007; Bono et al., 2010; Ngeow, 2012; Inno et al., 2013; Bhardwaj et al., 2016b, and references therein).
It is important to emphasize that SH0ES project utilizes W Wesenheit magnitudes in deriving PWRs (see Fig. 7) for determination. The use of three band PWRs leads to smaller dispersion possibly due to lower correlated systematics in photometry used in the color term. The total-to-selective absorption ratio () is small and any possible variations in this parameter, due to the choice of adopted reddening law, do not lead to large systematics in PWRs. Based on stellar evolutionary models, Anderson et al. (2016) also suggested that W Wesenheit leads to smallest scatter in the PWRs.
4.2.1 Comparison of multiband slopes:
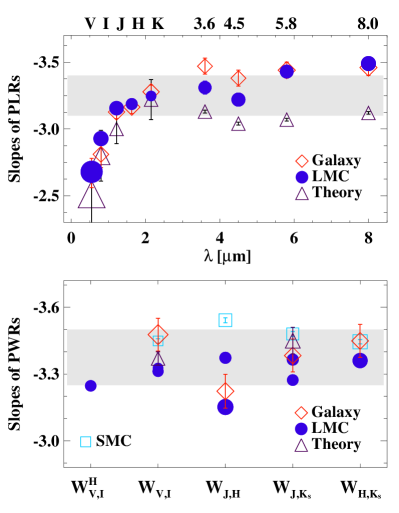
The slopes of fundamental-mode Cepheid PLRs as a function of wavelength are shown in Fig. 8. The slopes of LMC Cepheid PLRs are adopted from Bhardwaj et al. (, 2016c), Macri et al. (, 2015), Scowcroft et al. (, 2011) and Madore et al. (, 2009). The Galactic calibrations are adopted from Storm et al. (, 2011), Bhardwaj et al. (, 2016b), and Marengo et al. (, 2010). The slopes of the empirical PLRs for Cepheids in the Galaxy and LMC from different studies are consistent within uncertainties. The theoretical calibrations are adopted from Bono et al. (, 2010) and Marengo et al. (, 2010) for metal-abundance (Z=0.02) representative of Cepheids in the Galaxy. The theoretical slopes of the -band PLRs also agree well with empirical relations but difference in the slopes is relatively larger at wavelengths longer than -band. However, Marengo et al. (2010) also found that the slopes of Galactic MIR PLRs calibrated based on the astrometric distances are in excellent agreement with the theoretical predictions.
The bottom panel of Fig. 8 displays the slopes of PWRs from Inno et al. (2013) and Bhardwaj et al. (2016b) for LMC Cepheids, Storm et al. (2011) and Bhardwaj et al. (2016a) for Galactic calibrations, and Inno et al. (2013) for the SMC Cepheids. The theoretical calibrations are adopted from Bono et al. (2010). The slopes of PWRs are in good agreement among different studies except in the case of Wesenheit. The inconsistency in slopes of PLRs and PWRs may be due to, for example, different sample sizes, different photometric systems, the uncertainty on the reddening correction, and single-epoch versus time-domain data in different studies. Regardless, the range of slopes of the optical and NIR PWRs is significantly smaller than the multiwavelength Cepheid PLRs suggesting that the PWRs are indeed excellent tools for Cepheid-based distance measurements. An example of application of different Cepheid PLRs and PWRs is the Araucaria Project (Pietrzyński & Gieren, 2006) that has utilized variable stars as standard candles to measure distances to several Local Group galaxies (for example, Pietrzyński et al., 2007; Gieren et al., 2013; Zgirski et al., 2017), Sculptor Group galaxies (Gieren et al., 2005, 2009), and improve the calibration of extragalactic distance scale.
4.3 Systematic uncertainties in the Cepheid-based distance scale
4.3.1 Photometric mean-magnitudes:
The photometric uncertainties in individual measurements for Cepheid variables contribute to the observed dispersion in the PLRs through the estimates of mean-magnitudes. Despite the increase in NIR observational facilities in the past decade, infrared time-series is limited and the light curves are typically sparsely sampled. Since Cepheids cover a wide period range, optimizing a cadence to obtain well-sampled light curves without large phase gaps is difficult when having only a few epochs of measurements. In the case of HST observations of Cepheids in the supernovae host galaxies at a distance of 20-40 Mpc, photometric uncertainties due to blending alone can be a few tenths of magnitudes and the random phase corrections can also amount to mag of additional errors (Riess et al., 2016). The photometric uncertainties in the nearby galaxies are typically smaller ( mag) on individual measurements.
The templates for Cepheid light curves are useful to estimate precise mean-magnitudes from sparsely sampled light curves. Soszyński, Gieren & Pietrzyński (2005) provided NIR templates for classical Cepheids based on a small sample of calibrating Cepheids in the Galaxy and LMC. The new NIR templates for Cepheids were provided by Inno et al. (2015) based on a very large set of Galactic and Magellanic Cloud Cepheids. These templates are divided in ten period bins to account for a wide range of Cepheid periods and allow mean-magnitude estimates with a precision ( mag) only limited by the intrinsic accuracy of the templates. One new addition to these templates was the use of the phase of mean-magnitude along the rising branch as an anchor of phase zero-point which allows proper sampling of the light-curves of bump Cepheids.
4.3.2 Linear versus non-linear period-luminosity relations:
The application of Cepheid PLRs to the distance scale follows a basic assumption that these relations are linear over the entire period range. The non-linearity of the PLRs has been a subject of many studies in the past decade (Tammann, Sandage & Reindl, 2003; Sandage, Tammann & Reindl, 2004; Ngeow et al., 2005; Ngeow & Kanbur, 2006a; Ngeow, Kanbur & Nanthakumar, 2008; García-Varela, Sabogal & Ramírez-Tannus, 2013; Bhardwaj et al., 2016a). The Cepheid PLRs in the LMC exhibit a change in the slope at 10 days for fundamental-mode Cepheids and at 2.5 days for first-overtone mode Cepheids at optical wavelengths (Bhardwaj et al., 2016a). The short-period break at 2.5 days has been noted for both fundamental and first-overtone mode Cepheids in the SMC (Bauer et al., 1999; Ngeow et al., 2015; Bhardwaj et al., 2016c). The break in the PLRs at 10 days has also been observed for Cepheids in M31 (Kodric et al., 2015, 2018). Furthermore, possible non-linearities in Cepheid PLRs have been investigated using a number of independent methods including both parametric and non-parametric statistical tests (Kanbur et al., 2007; García-Varela, Sabogal & Ramírez-Tannus, 2013; Bhardwaj et al., 2016a). Bhardwaj et al. (2016a) found evidence of a break at 10 days in optical Cepheid PLRs and around 18 days in the NIR PLRs in the LMC. However, the authors did not find any significant bias between distance estimates using linear and non-linear models of PLRs when combining the LMC sample with Cepheids in the supernovae host galaxies.
Ngeow & Kanbur (2006b) estimated distances to the type Ia supernovae using calibrated linear and non-linear Cepheid PLRs and found marginal difference in the values and corresponding systematic uncertainties. In the traditional distance ladder, only long-period Cepheids in the LMC were used for the calibration of zero-point since distant Cepheids observed in the supernovae host galaxies predominantly have periods greater than 10 days (for example in the SH0ES project, Riess et al., 2011). However, a two-slope model for the calibrated Cepheid PLRs can provide a stronger constraint on the global slope of the PLR and also reduce corresponding systematic uncertainty (Bhardwaj et al., 2016a). Riess et al. (2016) included several variants of non-linear PWR in their analysis for the determination of the including two-slope model with possible break periods at 10 days or 60 days. The authors found negligible contribution to the systematic uncertainties on the estimates between the linear and non-linear model of Cepheid PLRs. However, considering that Cepheid PLRs in the supernovae host galaxies presently have a typical dispersion more than three times the scatter in the calibrator LMC PLRs, any possible changes in the slope of PLRs need careful investigation when precise relations become available with JWST and the extremely large ground-based telescopes.
The theoretical explanation for the cause of possible non-linearities in the Cepheid PLRs is not well-understood. Kanbur & Ngeow (2005); Ngeow & Kanbur (2006a); Kanbur et al. (2010) argued that the changes in the slope of LMC Cepheid period-color relation (and subsequently PLR) as a function of pulsation phase contribute to the observed non-linearities. The period-color and amplitude-color relations of long-period ( days) classical Cepheids in the LMC exhibit a nearly flat slope at maximum light but a non-zero slope at minimum-light (Bhardwaj et al., 2014). Kanbur et al. (2010, and references therein) related these variations in the period-color relations with the interaction of hydrogen ionization front and the stellar photosphere and the properties of the Saha ionization equation, and suggested that the changes in the period-color relations affect the PLRs through PLC relations. However, the changes in the slope of Cepheid PLRs are also strongly correlated with the sharp structural changes in the Fourier parameters at the break periods (Bhardwaj et al., 2016a, c). At the same time, metallicity is also expected to play a crucial role as metal-poor Cepheids are brighter than their metal-rich counterparts at fixed period (Romaniello et al., 2008, see next subsection). The observed non-linearity at the long-period end can be an observational bias as including brightest LMC Cepheids from the OGLE shallow survey (Ulaczyk et al., 2013) masks the evidence of non-linearity in optical Cepheid PLRs at 10 days (Bhardwaj et al., 2016a).
4.3.3 Metallicity effects:
One of the most crucial issues in the Cepheid distance scale is the dependence on metallicity of both the slope and zero-point of the PLRs and PWRs. The validity of the basic assumption regarding universality of the Cepheid PLRs in different stellar environment critically depends on negligible metallicity effects. Theoretical studies by Bono et al. (1999); Caputo, Marconi & Musella (2000) based on non-linear convective models showed that both the zero point and the slope of the predicted PLRs are significantly dependent on metallicity with the amplitude of the metallicity effect decreasing at the longer wavelengths. At a given wavelength, the slope becomes steeper for lower metal-abundances. These models predicted that at a fixed period, metal-rich Cepheids should be fainter than the metal-poor ones (Bono et al., 1999). Interestingly, the slope of the optical and NIR PWRs is independent of the metal-content (Fiorentino et al., 2007; Bono et al., 2010). However, the metallicity dependence of the zero-point of the PWRs depends on the adopted filters and needs to taken into account. Theoretical models also predict a dependence on helium of Cepheid PLRs (Fiorentino et al., 2002; Marconi, Musella & Fiorentino, 2005) which was further investigated by Carini et al. (2017). The latter found negligible effect on PLRs based distance estimates and a systematic uncertainty of up to on PWRs based distances. Metallicity and helium variations simultaneously affect Cepheid (and RR Lyrae) pulsation properties, light curves and the PLRs thus it is difficult to disentangle the two contributions.
Empirically, several independent observations have suggested a wide range of estimates for the metallicity sensitivity on Cepheid distance scale (see Table 1, Romaniello et al., 2008) that vary from -0.9 mag/dex to negligible dependence on metallicity at optical wavelengths. The indirect measurements of the metallicity in external galaxies mostly based on oxygen nebular abundances of H II regions showed that the metal-rich Cepheids are brighter than metal-poor ones (Kennicutt et al., 1998; Macri et al., 2006), inconsistent with the predictions of nonlinear convective models (Bono et al., 2010). Several other investigations based on empirical Cepheid PLRs also found similar results (Tammann, Sandage & Reindl, 2003; Sandage, Tammann & Reindl, 2004; Storm et al., 2004; Groenewegen et al., 2004) or negligible metallicity effects Fouqué et al. (2007). Based on direct measurements of iron abundances for individual Cepheids, Romaniello et al. (2005, 2008) found that Cepheids become fainter as metallicity increases. They found significant metallicity effects on -band PLRs such that metal-rich stars are fainter, a result consistent with theoretical predictions. However, no firm conclusion concerning the metallicity dependence on the -band PLR has been achieved (Romaniello et al., 2008; Bono et al., 2010).
In the last few years, Wielgórski et al. (2017) utilized precise Cepheid PLRs in the Magellanic Clouds and found metallicity effects compatible with zero in all bands on PLRs and PWRs. Gieren et al. (2018) employed Baade-Wesselink method to determine distances to Cepheids in the Galaxy and the Magellanic Clouds and quantified the strictly differential effect of metallicity on Cepheid PLRs by minimizing systematic zero-point uncertainties. The authors found a metallicity dependence in all bands ( mag/dex in -band) such that the more metal-poor Cepheids are intrinsically fainter than their metal-rich counterparts with similar pulsation periods. Groenewegen (2018) used parallaxes for Galactic Cepheids from Gaia second data release to investigate period-luminosity-metallicity relations and found no significant metallicity term. The author argued that the significant parallax zero-point offset present in Gaia data leads to systematic uncertainties of the order of 0.15 mag on the distance scale (see also Riess et al., 2018b).
In more distant supernovae host galaxies, it is impossible to measure directly Cepheid metallicity from individual stars. Hence, the mean-metallicity of the host (and target) galaxy is adopted to constrain systematics due to metallicity effect on the estimates. Riess et al. (2016) found a metallicity dependence ( mag/dex) similar to Kennicutt et al. (1998) which ultimately contributes to 0.5 systematics in determinations. Even after decades of effort the metallicity effects on Cepheid PLRs are not well-understood and even the sign of metallicity sensitivity is debated. The precise parallaxes from the future Gaia data releases for Galactic Cepheids with high-resolution spectra (for example, Andrievsky et al., 2002; Lemasle et al., 2013; Genovali et al., 2013, 2014, 2015; Proxauf et al., 2018) and spectroscopic abundances for Magellanic Cloud Cepheids (Lemasle et al., 2017; Mancino et al., 2020) are essential to resolve metallicity systematics in Galactic and LMC calibration on the Cepheid distance scale.
4.3.4 Other systematic uncertainties:
The impact of extinction on Cepheid-based distance measurements has been mitigated by using either Wesenheit functions or PLRs at the infrared wavelengths. However, the choice of adopted reddening law also contributes to the possible systematics due to extinction, specially in the regions with differential reddening where the reddening law may not be universal (Nishiyama et al., 2006, 2009; Nataf et al., 2016). For example, Dékány et al. (2015) identified 35 classical Cepheids in the inner part of the Galactic disc but Matsunaga et al. (2016) showed that there is lack of young population in the inner 2.5 kpc region of the Galactic disc except the nuclear stellar disk (Matsunaga et al., 2011). Matsunaga et al. (2016) estimated a large impact of the reddening correction based on different reddening laws even at NIR wavelengths leading to an overestimate of distances to Cepheids in Dékány et al. (2015) thus locating those in the inner part of the Galactic disc.
Cepheids in the wide binaries and in open clusters can also contribute to a possible bias in distance estimates with additional light contribution to photometric measurements of extragalactic Cepheids due to blending and changing spatial resolution along the distance ladder (Anderson & Riess, 2018). The authors found a negligible effect due to stellar companions and a relatively larger effect due to cluster populations which amounts to an overestimate of in determinations.
Anderson (2019) investigated the impact of time-dilation on Cepheid light curves because redshift dilates the periods of variables in distant supernova-host galaxies relative to periods of those in the calibrator galaxies. He estimated a bias of 0.27% in the values and argued that this effect will become increasingly relevant for Cepheids in more distant galaxies in the near-future.
5 RR Lyrae variables as distance indicators
RR Lyrae, being fainter than classical Cepheids, have been used less for distance determinations. This is changing thanks to larger telescopes used for the time-domain surveys and increasing use of infrared observations. RR Lyrae are population II distance indicators and provide an independent primary calibration, and an alternate distance ladder to the traditional Cepheid-Supernovae distance scale. Carnegie-Chicago Hubble Program aims to use population II RR Lyraes and the tip of the red giant branch stars, and estimate distances to the supernovae host galaxies determining with a precision comparable to current Cepheid-based estimates (Beaton et al., 2016; Freedman et al., 2019). Recently, Freedman et al. (2019) determined the tip of the red giant branch and supernovae based value of with a precision of that sits midway the Cepheid-based and Planck measurements. Considering ongoing Hubble tension, it is important to independently test or complement tip of the red giant branch based distance estimates using independent population II distance indicators such as RR Lyrae variables. I will discuss basic properties of RR Lyrae that are relevant for distance scale studies and focus on NIR PLRs as useful tools to determine robust individual distances in the following sections.
5.1 Period-amplitude diagrams
At the beginning of the nineteenth century, Solon Bailey discovered hundreds of variable stars in the globular clusters and introduced RR Lyrae variables of a, b, and c Bailey types (Bailey, 1902). These types are now typically separated in two classes based on their pulsation mode: RRab (or RR0) are pulsating in the fundamental radial mode while RRc (or RR1) are pulsating in the first-overtone radial mode. Bailey constructed period-amplitude diagrams (or ‘Bailey’ diagrams) for RR Lyrae in the globular clusters and found that these diagrams differ from cluster to cluster. These differences in the Bailey diagrams can be associated with the Oosterhoff type (Oosterhoff, 1939) of the globular cluster. RRab in Oosterhoff I (OoI) clusters have an average period of 0.55 days and [Fe/H] dex while RRab in Oosterhoff II (OoII) have average period of 0.65 days and [Fe/H] dex (Oosterhoff, 1939; Smith, 1995; Catelan, 2009; Catelan & Smith, 2015).
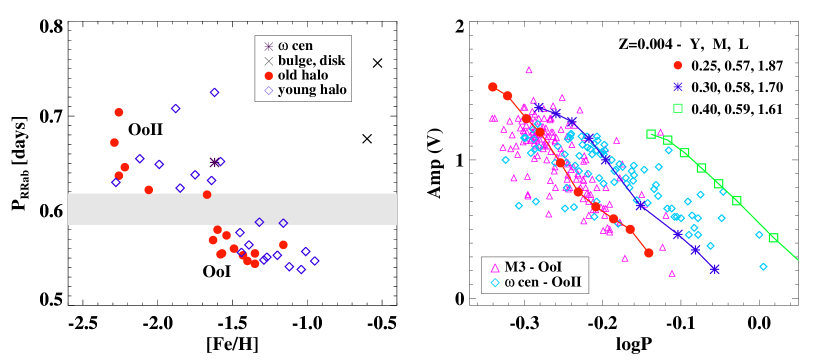
Fig. 9 displays Oosterhoff dichotomy in the GGCs. There is a distinct gap between OoI and OoII clusters in the periods versus metallicity plot. However, some metal-rich bulge clusters (for example, NGC 6441, NGC 6388, [Fe/H] -0.6 dex) have a larger value of mean-period of RRab than OoII clusters. While GGCs display an Oosterhoff gap, globular clusters and dwarf galaxies in the Milky Way satellite systems do not show such dichotomy (see Catelan, 2009, for more details). Sandage (1958), using equation (2), showed that the absolute magnitude of the horizontal branches differ by 0.2 mag in -band between OoII and OoI clusters, former being the brighter cluster. Oosterhoff dichotomy can be explained as the difference in the intrinsic luminosity for the RR Lyrae in two clusters, with the higher metallicity OoI clusters being fainter.
The right panel of Fig. 9 shows period-amplitude diagram of RRab variables in a OoI and OoII cluster respectively. It is evident that RR Lyrae in the OoII type cluster have longer periods for a given amplitude. Note that several RR Lyrae stars display modulations in their amplitudes and phases from cycle-to-cycle, a phenomenon known as the Blazhko effect (Blažko, 1907), but the origin of these effects is still unexplained despite a number of investigations including those with unprecedently high-precision photometry from Kepler (Jurcsik et al., 2009; Kolenberg et al., 2010; Szabó et al., 2010; Buchler & Kolláth, 2011; Skarka, Prudil & Jurcsik, 2020). The Blazhko effect in RR Lyrae is one of the main sources of scatter in the observational period-amplitude diagram shown in Fig. 9. The RR Lyrae models from Marconi et al. (2015); Marconi & Minniti (2018); Das et al. (2018), computed at fixed metal content (Z=0.004) and primordial helium contents ranging from Y=0.25 to Y=0.40, are also shown in Fig. 9. Theoretically, Bailey diagrams can also be used to constrain the helium content of RR Lyrae stars. The helium-enhancement leads to a systematic shift in periods which primarily occurs due to increased luminosity levels for similar masses (see, Rood, 1973; Sweigart & Catelan, 1998; Marconi et al., 2018, and references therein). Marconi & Minniti (2018) recently derived helium-abundance (Y=0.245) of RR Lyrae population in the Galactic bulge by comparing their minimum period with pulsation models. Bailey diagrams for RR Lyrae have also been constructed at near UV wavelengths (Siegel et al., 2015). The large amplitudes in UV can be useful to constrain the composition effects on RR Lyrae pulsation properties. Further investigations are needed to examine the dependence of UV pulsation properties on metallicity and Oosterhoff classification.
5.2 The visual magnitude-metallicity relation
The Oosterhoff dichotomy was later extended to investigate empirical relations between the location of RR Lyrae stars in the period-amplitude diagram and both absolute magnitude and [Fe/H]. Sandage (1982) derived an empirical relation between the period shift of a star with a given amplitude from the mean period-amplitude relation and the metallicity. Later, period-amplitude-[Fe/H] relations were used to determine metallicities for RRab stars (see, Kinemuchi et al., 2006; Kunder & Chaboyer, 2009). However, the correlation between Bailey diagram and [Fe/H] is debated, for example, Bono, Caputo & Di Criscienzo (2007) showed that the Oosterhoff dichotomy plays a key role in determination of period-amplitude diagram rather than the [Fe/H].
The period-amplitude-[Fe/H] relations suggest a continuous correlation between period and both the luminosity and metallicity for RR Lyrae. An empirical relation between RR Lyrae -band absolute magnitude () and stellar metallicity is usually written in the following form:
| (14) |
where, the slope () and the zero-point () have been determined through several calibrations in the literature (Fernley et al., 1998; Caputo et al., 2000; Clementini et al., 2003; Bono et al., 2003; Muraveva et al., 2018a, and references therein). Several investigations have also suggested deviations from the linear form of -[Fe/H] relation (see, Caputo et al., 2000; Bono et al., 2003; Catelan, Pritzl & Smith, 2004; Bono, Caputo & Di Criscienzo, 2007), and also proposed a quadratic form of RR Lyrae -[Fe/H] relation (Catelan, Pritzl & Smith, 2004; Sandage & Tammann, 2006; Bono, Caputo & Di Criscienzo, 2007; Muraveva et al., 2018a). With Gaia second data release, Muraveva et al. (2018a) suggested that the coefficients of metallicity on luminosity is much higher than previous studies in the literature. Although Gaia parallaxes suffer from systematic zero-point offset which varies with magnitudes, colors and position in the sky (Muraveva et al., 2018a; Riess et al., 2018b), the improvement in the precision of parallaxes is significant. For interested readers, linear and quadratic form of -[Fe/H] relation from Muraveva et al. (2018a) are provided here -
| (15) |
The coefficient of quadratic metallicity term in the -[Fe/H] relation is not significant and the zero-points are consistent between both linear and quadratic versions. While this empirical relation is very simple and useful tool to determine distances, several sources of uncertainties affect the precision of distance measurements based on this method. Firstly, the reddening effects are significant at optical wavelengths due to a large total-to-selective absorption ratio in -band, (Cardelli, Clayton & Mathis, 1989). Even in moderately extincted regions, the effect of reddening on optical luminosities is typically larger than the metallicity effects. In regions with heavy and differential extinction, reddening effects are a major drawback in using -[Fe/H] relation for distance diagnostics. Another important concern is the evolutionary effects on RR Lyrae population. Typically the evolved-RR Lyrae have higher luminosities than those of ZAHB RR Lyrae for a given metallicity. However, there is significant overlap in the color-space for RR Lyrae evolving off the ZAHB and the stars on the ZAHB. This evolutionary effect results in the broadening of the HB and the distribution of optical magnitudes (Bono et al., 1995). Further, systematic uncertainties in the metallicity measurements due to different metallicity scales and methodologies add another source of uncertainty in distance measurements with the visual magnitude metallicity relation. Note that the extinction and metallicity effects lead to large scatter in the PLRs at wavelengths shorter than -band if the dependence on period is significant. For example, Siegel et al. (2015) found a significant dependence of NUV PLRs on metallicity with difference of up to half a magnitude between coolest RRab stars in M3 and M15 clusters.
5.3 Multiband Period-Luminosity relations
RR Lyrae are known to exhibit a very tight PLR at infrared wavelengths which makes them excellent standard candles. Longmore, Fernley & Jameson (1986) were the first to derive an empirical RR Lyrae PLR in the -band. The pulsation equation implies a Period-Luminosity-color relation for RR Lyrae but the use of such relation suffers from uncertainties due to evolutionary effects, effective temperature and metallicity predominantly at optical wavelengths. Longmore, Fernley & Jameson (1986) showed that a PLR in -band comes naturally from pulsation equation because bolometric corrections increase with effective temperature such that redder RR Lyrae are brighter in -band. This results in an empirical period-magnitude relation in -band. Later, Bono et al. (2001) derived theoretical -band Period-Luminosity-Metallicity (PLZ) relation and showed that the uncertainties on the mass and luminosity also do not effect the PLRs significantly at this wavelength.
The empirical NIR PLRs of RR Lyrae have been a subject of several investigations, particularly in the globular clusters and the Magellanic Clouds (Nemec, Nemec & Lutz, 1994; Butler, 2003; Dall’Ora et al., 2004; Sollima, Cacciari & Valenti, 2006; Borissova et al., 2009; Coppola et al., 2011; Braga et al., 2015; Muraveva et al., 2015, 2018b, and references therein). Similar to Cepheids, NIR observations of RR Lyrae in most of these studies are limited to few epochs or sparsely sampled light curves. Therefore, NIR templates for RR Lyrae are crucial to determine accurate mean-magnitudes and derive precise PLRs. Using well-sampled -band light curves of RR Lyrae from the VISTA VVV survey (Minniti et al., 2010), Hajdu et al. (2018) used principal component analysis to generate and -band mean-magnitudes from single-epoch measurements. Recently, Braga et al. (2019) derived NIR templates of RR Lyrae and showed that 2% precise mean-magnitudes can be estimated even from single-epoch NIR observations.
Figure 10 shows empirical PLRs in Centauri and theoretical PLRs for RR Lyrae variables at multiple wavelengths. The Cen is a well-studied cluster in terms of RR Lyrae populations (Navarrete et al., 2015; Braga et al., 2016, 2018) which exhibits a spread in metallicity. Regardless of the metallicity contribution, the infrared PLRs do not exhibit large intrinsic dispersion. The apparent magnitudes in -band for RR Lyrae luminosities are nearly constant as a function of period. Since the bolometric correction sensitivity to effective temperature starts playing a role -band onwards, a true PLR is observed at longer wavelengths (Catelan, Pritzl & Smith, 2004). The empirical PLRs for the global sample of RRab and RRc variables in -bands from Braga et al. (2016) and Braga et al. (2018) are presented:
| (16) |
where the uncertainties in the slopes and zero-points are and mag, respectively. For a reference zero-point, a distance modulus to Cen is mag (Braga et al., 2018). The spectroscopic metallicities for RR Lyrae in Cen (Sollima et al., 2006) were used by Braga et al. (2018) to investigate metallicity dependence on NIR PLRs. The authors found a correlation between PLR residuals with [Fe/H]. In GGCs with marginal metallicity spread, the dispersion in NIR PLRs of RR Lyrae is typically mag implying an uncertainty of 2.5% in individual distance determination. The right panel of Figure 10 displays theoretical PLRs based on RR Lyrae pulsation models of Marconi et al. (2015) for a fixed metal-abundance. It is evident that the -band absolute magnitude is nearly constant as a function of period for different mass-luminosity levels. The theoretical and empirical investigations on metallicity effects on RR Lyrae PLRs will be discussed in the next subsection.
Mid-infrared observations of RR Lyrae, similar to classical Cepheids, have indisputable advantages as discussed previously. Klein et al. (2011) utilized Wide Field Infrared Survey Explorer (WISE) catalog of RR Lyrae to derive PLRs at MIR wavelengths. The calibrations of RR Lyrae PLRs in MIR bands using WISE data were further improved by Madore et al. (2013); Klein et al. (2014) and the latter found the dispersion in these relations to be mag. Using theoretical approach, Neeley et al. (2017) used Spitzer observations of RR Lyrae in M4 to derive PLRs with a dispersion of mag in 3.6m and 4.5m bands. Recently, Muraveva et al. (2018a) also used Spitzer data in LMC old cluster Reticulum to derive PLRs and estimate a distance to the LMC as part of the Carnegie RR Lyrae Program.
5.3.1 Metallicity effects:
Although extinction and metallicity effects are expected to be smaller at longer wavelengths, the impact of metal and helium abundance on RR Lyrae PLRs is actively debated. Theoretically, Bono et al. (2001) found that the dependence on the metallicity is quantitatively smaller (0.17 mag/dex) in -band than that in the optical bands ( mag/dex). Catelan, Pritzl & Smith (2004) derived metal-dependent PLRs for RR Lyrae based on the calculations of synthetic horizontal branch models and found a significant metallicity term (0.21-0.17 mag/dex) in -bands. Using a new theoretical framework of RR Lyrae, Marconi et al. (2015) generated pulsation models covering a broad range of metal-abundance (Z=0.02 to 0.0001) and derived PLRs. They found a metallicity dependence (0. 18 mag/dex) similar to Bono et al. (2001), on RR Lyrae NIR PLRs. The PLZ relations for RR Lyrae are written in the following form:
| (17) |
For a relative comparison, -band PLZ relations are provided in the form of equation (17):
| (18) |
where represents theory and the uncertainties in the coefficients of PLZ relations are negligible. While the theoretical studies consistently predict an appreciable metallicity dependence on RR Lyrae PLRs, empirical investigations have most often resulted in a marginal dependence on metallicity.
Sollima, Cacciari & Valenti (2006) used RR Lyrae in several GGCs to constrain the metallicity dependence and quantified a relatively small dependence of 0.08 mag/dex on [Fe/H]. In the case of LMC RR Lyrae, Borissova et al. (2009) also found a very mild dependence on metallicity in -band by combining NIR photometry and spectroscopic metallicities for a homogeneous sample of 50 RR stars in the inner regions. Similarly, Muraveva et al. (2015) utilized low-dispersion spectroscopic metallicities of 70 RRLs in the bar of the LMC with NIR photometry from VISTA VMC survey (Cioni et al., 2011) and found a marginal dependence ( mag/dex) on [Fe/H] in RR Lyrae PLRs. More recently, Neeley et al. (2019) used Gaia parallaxes for Galactic field RR Lyrae to derive multiband PLZ relations and found that the dispersion in these relations is dominated by the uncertainties in the parallaxes despite reproducing the metallicity dependence predicted from models. The high-resolution spectroscopy of RR Lyrae has been obtained mostly for the field (Clementini et al., 1995; For, Sneden & Preston, 2011; Nemec et al., 2013; Pancino et al., 2015, and references therein) and globular cluster variables (for example, Sollima et al., 2006; Magurno et al., 2018, 2019). In the case of Magellanic Clouds, low-resolution spectroscopy has been limited to small samples of RR Lyrae stars (e.g. Gratton et al., 2004; Borissova et al., 2004, 2006; Haschke et al., 2012).
5.3.2 Period-Wesenheit relations:
The PWRs for RR Lyrae have also been used for distance determinations to negate the issues related with reddening corrections. Marconi et al. (2015) presented new optical and NIR PWRs adopting Cardelli, Clayton & Mathis (1989) reddening law and a total-to-selective absorption ratio, . The dual-band PWRs from Marconi et al. (2015) are listed in the form of equation (17):
| (19) |
where the NIR Wesenheits display metallicity dependence similar to PLRs. Interestingly, optical Wesenheit using combination of and -band is nearly metallicity independent and this is not true for other combination of filters used to construct Wesenheit functions. Using this Wesenheit function, it is possible to estimate precise distance independent of the uncertainties on the metallicity measurements (see equation (5.3.2) and Braga et al., 2016, for an application to Cen). However, the dispersion in this optical Wesenheit function is twice as large compared to NIR PLRs and PWRs. Marconi et al. (2015) derived several combinations of triple-band PWRs relations, similar to function used in SH0ES project, but those require mean-magnitudes in three independent filters.
As a passing remark, the theoretically predicted first-overtone blue edge (FOBE) on the plane is also a useful distance indicator for stellar systems that host a statistically significant number of RRc stars (Caputo, 1997). The FOBE is independent of the metallicity. If the blue part of the IS is well-populated and the metallicity is known, assuming the mass, a period-luminosity-metallicity relation can be derived for the evolutionary FOBE pulsators (see, Caputo, 1997; Caputo et al., 2000; Bono et al., 2003; Beaton et al., 2018, for details).
5.3.3 Absolute calibrations:
The lack of accurate parallax measurements for RR Lyrae limits the precision of the absolute calibration of PLRs at infrared wavelengths. Unlike classical Cepheids, the calibration based on the LMC exhibits large dispersion due to spread in metallicity distribution of RR Lyrae and its effect on the PLRs. Feast et al. (2008) utilized Hipparcos and HST parallaxes of RR Lyrae itself to provide a zero-point calibration. Benedict et al. (2011) presented HST parallaxes for 5 RR Lyrae variables and provided absolute calibrations in -band for a PLZ relation. Recently, Muraveva et al. (2018a) provided absolute magnitudes for RR Lyrae in several bands using Gaia astrometry for stars but also noted a significant zero-point offset in the Gaia parallaxes.
The calibration of MIR PLRs of RR Lyrae in the GGCs were first provided by Dambis, Rastorguev & Zabolotskikh (2014) using WISE data. The authors found two significantly different estimates for the zero-points based on statistical and HST trigonometric parallaxes. Neeley et al. (2019) calibrated multiband PLZ relations of RR Lyrae using photometry obtained from the Carnegie RR Lyrae Program and parallaxes from the Gaia second data release for a sample of 55 Galactic field RR Lyrae stars. They found that the scatter in the PLZ relations is significantly large ( 0.2 mag) when compared to theoretical predictions, and is still dominated by uncertainties in the parallaxes from current Gaia data.
Despite the metallicity uncertainties, NIR PLRs of RR Lyrae have been used extensively to determine distances to several stellar systems, for example, GGCs M92 (Del Principe et al., 2005), M5 (Coppola et al., 2011), cen (Navarrete et al., 2015; Braga et al., 2018), M4 (Braga et al., 2015), Galactic center (Dékány et al., 2013), LMC old cluster Reticulum (Dall’Ora et al., 2004), Magellanic Clouds (Ripepi et al., 2012; Moretti et al., 2014b; Muraveva et al., 2018a), Carina Dwarf (Karczmarek et al., 2015), Fornax (Karczmarek et al., 2017), and IC 1613 (Hatt et al., 2017). While the application of RR Lyrae PLRs and PWRs to measure distances to individual system is not discussed here, the interested readers are referred to the above mentioned papers.
6 Type II Cepheids as distance indicators
The discovery of T2Cs played a critical role in the revision of the extragalactic distance scale. In his pioneering work, Baade (1944) showed that stellar populations of the galaxies are either similar to those in the solar neighborhood (the slow-moving stars i.e. disk stars) or those in the globular clusters. This eventually led to the classification of Population I and Population II stars. In his seminal papers, Baade (1958a, b, c) introduced a difference in the PLRs of the population II Cepheids in the globular clusters and the classical or population I Cepheids in the spiral arms of the galaxies. The former are T2Cs that represent old, low-mass stellar populations. Before their discovery, both young and old Cepheid populations had been used in the PLRs and distance scale. The distinction of the PLRs for two classes of Cepheids eventually resolved a major issue in the determination at that time, which led to the reduction of the spatial and temporal scales of the universe by a factor of two (Baade, 1956). While the T2Cs have not been used extensively as distance indicators being fainter than classical Cepheids, they have played crucial roles as excellent tracers of stellar evolution and Galactic structure. I will discuss some empirical properties of T2Cs and focus on recent updates in their PLRs for distance measurements. There are several excellent reviews on T2Cs (Harris, 1985; Wallerstein, 2002; Sandage & Tammann, 2006; Welch, 2012; Feast, 2010, 2013; Beaton et al., 2018) that are recommended to the interested readers.
6.1 Pulsation properties of T2Cs
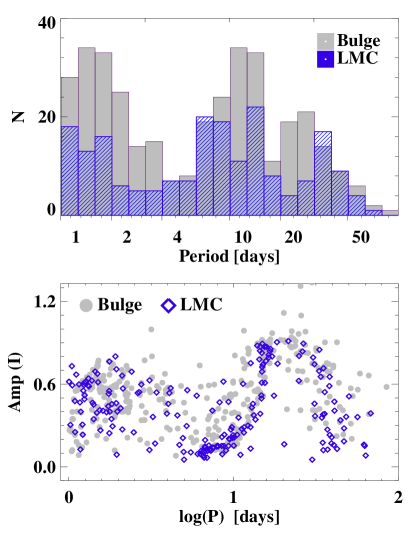
Similar to the evolutionary status, the pulsation properties of T2Cs are distinct among the three subclasses. The classification into BL Her, W Vir and RV Tau is predominantly based on the pulsation period. However, the period range for each group is not universal and depends on the stellar environment. The top panel of Fig. 11 shows the period distribution for T2Cs in the Milky Way bulge and the Magellanic Clouds. It is evident that the minima in the period distributions vary between bulge and LMC due to their significantly different metallicities. Soszyński et al. (2011) found that bulge T2Cs are dominated by short-period BL Her stars which are more luminous than their counterparts in the Magellanic Clouds. The bottom panel of Fig. 11 displays the period-amplitude diagram for T2Cs in different stellar environments and exhibits different structures for each subclass. The amplitudes of BL Her exhibit large scatter at a given period similar to RR Lyrae variables. A sharp rise in the amplitudes for W Vir stars with days can be seen while the amplitudes decrease quickly as a function of period for RV Tau stars. The light curves of T2Cs are also quite different from classical Cepheids or RR Lyrae as they exhibit complex variations depending on the subclasses.
Unlike classical Cepheids and RR Lyrae, theoretical studies on T2C pulsation properties are very limited. Earlier studies were limited to linear models (Wallerstein & Cox, 1984) and non-linear pulsation models without accounting for the convective transport (Fadeev & Fokin, 1985). Full time-dependent convective pulsation models of BL Her stars were provided by Bono, Caputo & Santolamazza (1997); Marconi & Di Criscienzo (2007); Di Criscienzo et al. (2007). Bono, Caputo & Santolamazza (1997) showed that T2Cs pulsate primarily in the fundamental mode and their masses decrease with increasing period, and also derived metallicity independent period-luminosity-amplitude relations. Marconi & Di Criscienzo (2007) presented the topology of the IS, and light and radial velocity curves for BL Her stars. They showed that the first-overtone IS is very narrow and therefore most T2Cs are fundamental pulsators which was also seen empirically for T2Cs in the Magellanic Clouds (Soszynski et al., 2008; Soszyński et al., 2018). Similar to classical Cepheids and RR Lyrae, T2Cs also follow a PLR that can be derived from the pulsation equation (see, Section 3.3 of Matsunaga et al., 2006; Di Criscienzo et al., 2007).
6.2 Period-Luminosity and Period-Wesenheit relations
The optical studies of T2Cs in the GGCs provided evidence of a PLRs (Harris, 1985; McNamara, 1995) but their investigations as useful distance indicators peaked with modern data from large photometric surveys (Nemec, Nemec & Lutz, 1994; Alcock et al., 1998; Kubiak & Udalski, 2003; Majaess, Turner & Lane, 2009; Schmidt et al., 2009, and references therein). For example, Alcock et al. (1998) used MACHO microlensing survey data to discover T2Cs in the Magellanic Clouds and determined PLC relations for W Vir and RV Tau variables. In the past decade, OGLE survey has discovered several Galactic and Magellanic Clouds T2Cs and derived solid, optical-band PLRs (Soszyński et al., 2008, 2010, 2011, 2017b). Similar to classical Cepheids and RR Lyrae, increased availability of NIR observations have allowed several investigations on T2C PLRs at these wavelengths, where less sensitivity to metallicity and extinction leads to tighter PLRs (Matsunaga et al., 2006; Feast et al., 2008; Groenewegen, Udalski & Bono, 2008; Ciechanowska et al., 2010; Ripepi et al., 2015; Bhardwaj et al., 2017a, and references within).
At NIR wavelengths, Matsunaga et al. (2006); Matsunaga, Feast & Menzies (2009); Matsunaga, Feast & Soszyński (2011) derived NIR PLRs for T2Cs in the GGCs and the Magellanic Clouds. The authors found non-universal slopes of the PLRs in different systems and also noted varying frequency of each subtype. Matsunaga et al. (2006) derived PLRs for T2Cs in the GGCs and found a linear relation over entire period range with a typical dispersion of 0.15 mag in bands. They obtained distances to individual GGCs using -[Fe/H] relation for horizontal branch stars and showed a consistency between RR Lyrae and T2C distance scale. Groenewegen, Udalski & Bono (2008) utilized NIR photometry of T2Cs in the Galactic bulge to estimate a distance to the Galactic center. In the LMC, Ripepi et al. (2015) derived T2C PLRs in using data from VISTA VMC survey with intrinsic dispersion of 0.13 mag in and 0.09 mag in -band. More recently, Bhardwaj et al. (2017b) used data from the LMC NIR synoptic survey to derive PLRs in -bands. Combining with literature data, they presented the largest sample to date of T2Cs with observations and used it to derive PLRs as well as absolute calibration with the known late-type eclipsing binary distance to the LMC. Furthermore, distance estimates to several GGCs from Matsunaga et al. (2006) based on the horizontal branch morphology are within of the distances obtained by applying the LMC calibrations of T2Cs PLRs (Bhardwaj et al., 2017c).
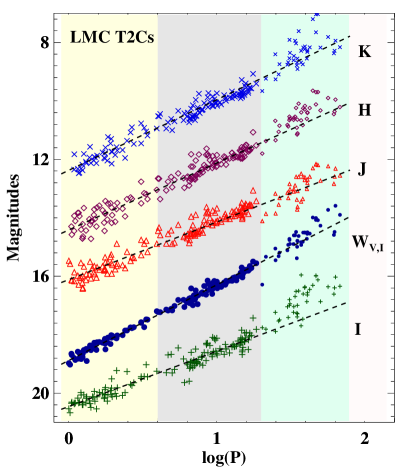
Figure 12 shows optical PWR and -band PLRs for T2Cs in the LMC. It can be seen that the PLRs are not linear throughout the period range i.e. for all subclasses as an ensemble. A linear regression over entire period range results in a large dispersion of mag in and -band PLRs for T2Cs in the LMC, which is not useful for precision distance measurements. Even after excluding RV Tau that are distinctly brighter than the BL Her and W Vir stars, resulting PLR fits exhibit large dispersion. This suggests that the contribution to the intrinsic scatter in T2C PLRs at optical bands may have some dependence on metallicity and stellar environment. The presence of peculiar W Vir stars that have distinct light curve shapes also contributes to the scatter in the PLRs as they are systematically brighter than W Vir stars. Soszyński et al. (2017b) found that a significant fraction of W Vir are in the eclipsing binary systems and thus should be excluded from the PLR fits to obtain a better distance estimates using T2Cs. In Figure 12, the PLRs in NIR bands do not show a significant deviation in the slope between BL Her and W Vir subclasses. However, pW Vir and RV Tau are systematically brighter than the PLRs followed by short-period T2Cs. The T2C PLRs and PWRs for a combined sample of BL Her and W Vir stars in different stellar systems are provided here.
| (20) |
where the optical photometry is taken from Soszyński et al. (2018). A significant reduction in dispersion is evident in the case of the optical PWR when compared to optical PLRs. The -band PLRs from Matsunaga et al. (2006), Bhardwaj et al. (2017a), and Braga et al. (2018) are:
| (21) |
The slopes of the -band PLRs are very similar between the LMC and bulge short-period B Her + W Vir T2Cs. In -band, Bhardwaj et al. (2017b) did not find a significant deviation in the slope of PLRs for RV Tau from the B Her + W Vir sample but their photometry for BL Her showed evidence of crowding effects as their target fields were in the central bar of the LMC.
At present, T2C PLRs are mainly calibrated with zero-point anchored to the LMC thanks to a very precise 1% late-type eclipsing binary distance. The HST parallaxes are available for only two T2Cs ( Pav and VY Pyx) and there are two T2Cs with Baade-Wesselink distance (Feast et al., 2008). Therefore, a robust Galactic calibration is still lacking but is expected to be delivered with increasingly accurate astrometric data from the Gaia mission.
Using T2Cs in the Galactic bulge from the VISTA VVV survey, Bhardwaj et al. (2017c) derived PLRs in -bands and estimated a robust distance to the Galactic center. T2Cs are particularly interesting in the extremely crowded regions like the Galactic bulge because their multiband NIR PLR and PWRs can be used to constrain the individual distances and extinction simultaneously without accounting for the metallicity effects. For example, the distance distribution derived using PLRs without accounting metallicity effects is much broader for RR Lyrae in the bulge than T2Cs (Bhardwaj et al., 2017c) implying a better precision for individual T2C distances. Recently, Braga et al. (2018) extended this work with a larger sample of T2Cs in the bulge and derived individual distances to trace the structure and kinematics of old stellar populations (see also, Dékány et al., 2019).
From theoretical point of view, Di Criscienzo et al. (2007) derived PLR and PWRs for T2Cs and estimated distances to several GGCs that were found to be consistent with RR Lyrae based estimates. They also predicted that the slope of the overall PLRs for T2Cs is less steep than that of classical Cepheids, which is also seen in the empirical PLRs. The fact that T2Cs follow similar PLRs as that of RR Lyrae in NIR (Matsunaga et al., 2006; Feast et al., 2012; Bhardwaj et al., 2017b) suggests a continuous transition between evolved RR Lyrae and BL Her evolutionary and pulsational properties. Recent findings have confirmed that BL Her and W Vir show similar PLRs provided pW Vir are excluded from the sample (Ripepi et al., 2015; Bhardwaj et al., 2017b, c). However, RV Tau are found to be systematically brighter than the PLRs followed by BL Her and W Vir stars. RV Tau are post-AGB stars and they may have circumstellar envelopes which can make them fainter. However, this can lead to significant variation in luminosities in different pulsation cycles and subsequently contribute to the scatter in the PLRs.
6.2.1 Metallicity effects:
The theoretical and observational investigations of T2Cs suggest minimal or no dependence of metal-abundances on NIR PLRs unlike RR Lyrae. The metallicity effects on NIR PLRs of T2Cs are at the level of mag/dex according to the theoretical predictions (Bono, Caputo & Santolamazza, 1997; Di Criscienzo et al., 2007; Marconi & Di Criscienzo, 2007). Empirically, Matsunaga et al. (2006) found negligible effect of metallicity dependence on NIR PLRs for T2Cs in the GGCs. Bhardwaj et al. (2017c) showed that the slope of -band PLR of T2C is statistically similar between GGCs, bulge, LMC and for the Milky Way T2Cs having good parallax measurements. Spectroscopic measurements for T2Cs are very limited (for example, Maas, Giridhar & Lambert, 2007; Lemasle et al., 2015; Kovtyukh et al., 2018, and references therein) to investigate metallicity effects but these stars are known to cover a range of metallicities similar to that of RRLs. Without accounting metallicity effects, Ripepi et al. (2015); Bhardwaj et al. (2017b) determined a distance to the LMC based on empirical relations that is in excellent agreement with classical Cepheid and RR Lyrae based estimates.
Apart from the Magellanic Clouds (Soszynski et al., 2008), T2Cs have also been discovered in several other extragalactic stellar systems, for example, IC1613, M31, M33 (Majaess, Turner & Lane, 2009), and in dwarf spheroidal galaxy Fornax (Bersier & Wood, 2002). Given that T2Cs are brighter than RR Lyrae, BL Her and W Vir can be used to estimate distances to the galaxies beyond the Local Group up to ( 10 Mpc). However, long-term time-domain surveys are critical to identify and classify the T2Cs because of the complex light variations and a broad period range.
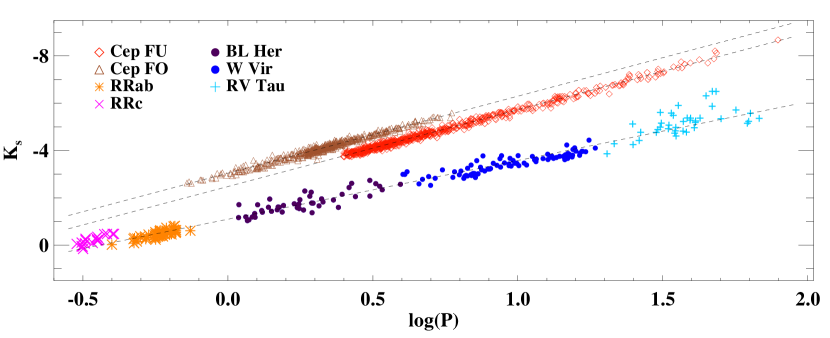
6.3 Comparison with classical Cepheids and RR Lyrae
T2Cs are not as abundant as classical Cepheids and RR Lyrae due to their short evolutionary timescales, which limits a detailed investigation of their pulsation properties. The evolutionary time scales of T2Cs are roughly two orders of magnitude faster than RR Lyrae (Marconi et al., 2015). Unlike classical Cepheids, the optical PLRs of T2Cs are non-linear and lack the precision to be useful distance indicators. T2C observations in NIR, where their PLRs do not show significant metallicity dependence (see Sec 6.2), are increasing as there are more NIR variability surveys. They are used both as population tracers and distance indicators complementing RR Lyrae variables. T2Cs are brighter than RR Lyrae and therefore can extend the use of population II standard candles to galaxies beyond 2 Mpc where the application of RR Lyrae is presently limited (Da Costa et al., 2010). The light curves of T2Cs are not as distinct as classical Cepheids and RR Lyrae, and a significant overlap with classical Cepheids can be seen on the Fourier plane and color-magnitude diagrams.
Fig. 13 displays calibrated PLR in -band for classical pulsating stars in the LMC. Classical Cepheids are systematically 1.5-3 magnitude brighter than T2Cs at a fixed period but the exact difference is period-dependent. Depending on the period of T2Cs, these are up to mag brighter than population II RR Lyrae. The BL Her and W Vir subclasses of T2Cs follow a linear PLRs. Extending their PLR to shorter periods (1 day) clearly suggests that RRab are also located on this relation while the overtone RRc seem to be brighter than the PLR of T2Cs. The RV Tau are typically not included in the PLRs fits for T2Cs. The calibration of PLRs for classical Cepheids, RR Lyrae and T2Cs in the LMC is based on the eclipsing binary distance to the LMC (Pietrzyński et al., 2019).
7 Summary and Future Prospects
I discussed observational and theoretical pulsational properties of classical Cepheid, RR Lyrae and T2Cs, and their application to extragalactic distance measurements. The first two sections presented a historical overview and explained the evolutionary and pulsational scenario related to these classical pulsating stars. The section that describes the light curve properties provides an overview of their identification and classification as well as emphasises how their multi-wavelength observations can constrain the stellar evolution and pulsation models. The last three sections are focussed on the use of classical pulsating stars for cosmic distance scale delineating both population I and population II distance indicators. These standard candles have a long history dating back to more than a century and their theoretical and empirical investigations have persistently played significant roles in our understanding of the stellar evolution, Galactic structure and the Universe.
A discussion on primary calibrations for classical Cepheids, RR Lyrae and T2Cs reveals two major issues that are yet to be addressed properly. First, the lack of robust geometric distances that limits the precision of calibrated PLRs of these standard candles in our own Galaxy. The HST parallaxes are available for a small sample of 16 classical Cepheids (Benedict et al., 2007; Riess et al., 2014, 2018a), 5 RR Lyrae and 2 T2Cs (Benedict et al., 2011). With such small statistics even the precise determination of slope and zero-point of PLRs is not possible let alone quantification of other systematics, for example, due to age or metallicity. Therefore, either the theoretical calibrations are adopted or these standard candles in the LMC serve as primary calibrators. In case of the former, theoretical predictions suffer from the lack of observational constraints while in the case of latter, lack of high precision abundances for these stellar populations (Mancino et al., 2020) in the LMC precludes quantification of other systematic uncertainties. However, Gaia mission is already providing unprecedently precise astrometry for stellar populations in the solar neighbourhood (Lindegren et al., 2018). The final Gaia parallaxes are predicted to have 10% precise parallaxes at a distance of 10 kpc and within a few kpc distance. Therefore, a robust calibration of nearby Cepheid and RR Lyrae populations will eventually be derived with a percent-level precision. While some of the results from Gaia second data release are presented in this manuscript, it became apparent that the current data release suffers from a significant zero-point offset in parallaxes for both Cepheid and RR Lyrae (for example, Muraveva et al., 2018a; Riess et al., 2018b). Regardless, the plethora of Gaia astrometric data, spectro-photometry, variability and spectroscopy of bright sources will lead to potential breakthroughs in the studies of classical pulsating variable stars.
The second outstanding question is related to the impact of composition, metallicity and helium effects in particular, age and evolutionary effects on the primary calibration of the classical pulsating stars. In the course of writing this manuscript, it became evident that the metallicity effects on both the theoretical and empirical PLRs are not well constrained despite decades of efforts. The high-resolution spectroscopic observations for Cepheids and RR Lyrae are very limited and will not be available even with Gaia data. Therefore, complementary large scale ongoing spectroscopic surveys (e.g. APOGEE (Majewski et al., 2017), LAMOST (Zhao et al., 2012)) and future facilities (e.g. 4MOST, de Jong, 2019) will provide stellar parameters for a statistically significant sample of pulsating stars. In case of the highly extincted and crowded extragalactic systems, a deeper insight in our understanding of the physics and chemistry of the classical pulsating stars will come with higher sensitivity and resolution of JWST in space and 30-m class ground-based extremely large telescopes.
High-precision space-based photometry has revealed interesting additional non-radial modes, period-doubling and amplitude/phase modulations in classical pulsating stars (Kolenberg et al., 2010; Derekas et al., 2017; Molnár, 2018). The photometric revolution with ongoing missions such as Gaia and TESS, and future PLATO mission will continue to explore these phenomena in pulsating variables. The classical pulsators are less explored at UV and X-ray wavelengths where new insights can be gained into evolution and pulsation, and heating and dynamics of their atmospheres (Engle, 2015; Neilson et al., 2016). At UV wavelengths, the large amplitudes are particularly interesting not only for the identification but also to provide constraints for the pulsation models, for example, by simultaneous model-fitting of multiband light curves. While the focus of this review is on distance measurements, classical pulsating stars are also used extensively as stellar population tracers for extinction, metallicity, and morphology of their host galaxies. For example, minimum light color of RR Lyrae is an excellent tool for reddening diagnostics (Sturch, 1966; Ngeow et al., 2017; Saha et al., 2019). Classical Cepheid and RR Lyrae (and T2Cs) have been used to trace the spatial distribution and kinematics of young (metal-rich) and old (metal-poor) stellar populations in the Galaxy and the Magellanic Clouds (see Subramanian & Subramaniam, 2012; Dékány et al., 2013; Deb & Singh, 2014; Subramanian & Subramaniam, 2015; Pietrukowicz et al., 2015; Jacyszyn-Dobrzeniecka et al., 2016, 2017; Ripepi et al., 2017; Muraveva et al., 2018b; Skowron et al., 2019, and reference therein for more details). Improved absolute calibrations of classical pulsating stars will enable precise individual distance measurements allowing new insights into the structure and kinematics of their underlying stellar populations in the host galaxies.
A most complete census of classical pulsating stars in the Local Group and beyond will be produced by the upcoming revolutionary Vera C. Rubin Observatory Legacy Survey of Space and Time previously referred to as the Large Synoptic Survey Telescope. The optical time-domain observations from LSST will be complemented with infrared observations with JWST and large-aperture ground-based telescopes. In the infrared regime, where extinction and metallicity effects and the intrinsic variations are minimized, standard candles have reached to unprecedented precision and accuracy in the past decade. At these precisions, every possible source of known or unknown systematics becomes relevant and careful investigations are needed, for example, regarding the universality of extinction law, evolutionary effects, differences in the photometric systems (ground versus space-based), possible contributions of additional parameters to the intrinsic dispersion in the PLRs. With predominantly infrared observational facilities in the future, classical pulsating variables will enable potential scientific discoveries related to the structure of the Milky Way to the evolution of stars and our Universe.
Acknowledgements
I thank the editorial board of the Journal of Astrophysics and Astronomy for inviting me to write this review article and Marcio Catelan, Marina Rejkuba, Wolfgang Gieren, H. P. Singh, Noriyuki Matsunaga, Richard I. Anderson and Shashi Kanbur for useful comments and suggestions. I also thank the anonymous referee for the quick and constructive report that helped improve the manuscript. AB acknowledges research grant awarded by the National Natural Science Foundation of China through the Research Fund for International Young Scientists, and a China Post-doctoral General Grant, and the Gruber fellowship 2020 grant sponsored by The Gruber Foundation and the International Astronomical Union. This research was supported by the Munich Institute for Astro- and Particle Physics (MIAPP) of the DFG cluster of excellence “Origin and Structure of the Universe”.
References
- Alcock et al. (1998) Alcock C. et al., 1998, AJ, 115, 1921
- Anderson (2016) Anderson R. I., 2016, MNRAS, 463, 1707
- Anderson (2019) Anderson R. I., 2019, A&A, 631, A165
- Anderson et al. (2014) Anderson R. I., Ekström S., Georgy C., Meynet G., Mowlavi N., Eyer L., 2014, A&A, 564, A100
- Anderson & Riess (2018) Anderson R. I., Riess A. G., 2018, ApJ, 861, 36
- Anderson et al. (2016) Anderson R. I., Saio H., Ekström S., Georgy C., Meynet G., 2016, A&A, 591, A8
- Andrievsky et al. (2002) Andrievsky S. M., Kovtyukh V. V., Luck R. E., Lépine J. R. D., Bersier D., Maciel W. J., Barbuy B., Klochkova V. G., Panchuk V. E., Karpischek R. U., 2002, A&A, 381, 32
- Baade (1944) Baade W., 1944, ApJ, 100, 137
- Baade (1956) Baade W., 1956, PASP, 68, 5
- Baade (1958a) Baade W., 1958a, Ricerche Astronomiche, 5, 3
- Baade (1958b) Baade W., 1958b, Ricerche Astronomiche, 5, 165
- Baade (1958c) Baade W., 1958c, Ricerche Astronomiche, 5, 303
- Bailey (1902) Bailey S. I., 1902, Annals of Harvard College Observatory, 38
- Bauer et al. (1999) Bauer F. et al., 1999, A&A, 348, 175
- Beaton et al. (2018) Beaton R. L. et al., 2018, Space Science Reviews, 214, 113
- Beaton et al. (2016) Beaton R. L. et al., 2016, ApJ, 832, 210
- Bellinger et al. (2020) Bellinger E. P., Kanbur S. M., Bhardwaj A., Marconi M., 2020, MNRAS, 491, 4752
- Benedict et al. (2011) Benedict G. F. et al., 2011, AJ, 142, 187
- Benedict et al. (2007) Benedict G. F., McArthur B. E., Feast M. W., Barnes T. G., Harrison T. E., Patterson R. J., Menzies J. W., Bean J. L., Freedman W. L., 2007, AJ, 133, 1810
- Bersier & Wood (2002) Bersier D., Wood P. R., 2002, AJ, 123, 840
- Bhardwaj et al. (2016a) Bhardwaj A., Kanbur S. M., Macri L. M., Singh H. P., Ngeow C.-C., Ishida E. E. O., 2016a, MNRAS, 457, 1644
- Bhardwaj et al. (2016b) Bhardwaj A., Kanbur S. M., Macri L. M., Singh H. P., Ngeow C.-C., Wagner-Kaiser R., Sarajedini A., 2016b, AJ, 151, 88
- Bhardwaj et al. (2017a) Bhardwaj A., Kanbur S. M., Marconi M., Rejkuba M., Singh H. P., Ngeow C.-C., 2017a, MNRAS, 466, 2805
- Bhardwaj et al. (2015) Bhardwaj A., Kanbur S. M., Singh H. P., Macri L. M., Ngeow C.-C., 2015, MNRAS, 447, 3342
- Bhardwaj et al. (2014) Bhardwaj A., Kanbur S. M., Singh H. P., Ngeow C.-C., 2014, MNRAS, 445, 2655
- Bhardwaj et al. (2017b) Bhardwaj A., Macri L. M., Rejkuba M., Kanbur S. M., Ngeow C.-C., Singh H. P., 2017b, AJ, 153, 154
- Bhardwaj et al. (2016c) Bhardwaj A., Ngeow C.-C., Kanbur S. M., Singh H. P., 2016c, MNRAS, 458, 3705
- Bhardwaj et al. (2017c) Bhardwaj A., Rejkuba M., Minniti D., Surot F., Valenti E., Zoccali M., Gonzalez O. A., Romaniello M., Kanbur S. M., Singh H. P., 2017c, A&A, 605, A100
- Blažko (1907) Blažko S., 1907, Astronomische Nachrichten, 175, 325
- Bono et al. (1997) Bono G., Caputo F., Cassisi S., Castellani V., Marconi M., 1997, ApJ, 479, 279
- Bono et al. (2000) Bono G., Caputo F., Cassisi S., Marconi M., Piersanti L., Tornambè A., 2000, ApJ, 543, 955
- Bono et al. (1999) Bono G., Caputo F., Castellani V., Marconi M., 1999, ApJ, 512, 711
- Bono et al. (2003) Bono G., Caputo F., Castellani V., Marconi M., Storm J., Degl’Innocenti S., 2003, MNRAS, 344, 1097
- Bono, Caputo & Di Criscienzo (2007) Bono G., Caputo F., Di Criscienzo M., 2007, A&A, 476, 779
- Bono et al. (2010) Bono G., Caputo F., Marconi M., Musella I., 2010, ApJ, 715, 277
- Bono, Caputo & Santolamazza (1997) Bono G., Caputo F., Santolamazza P., 1997, A&A, 317, 171
- Bono et al. (1995) Bono G., Castellani V., degl’Innocenti S., Pulone L., 1995, A&A, 297, 115
- Bono et al. (2001) Bono G., Gieren W. P., Marconi M., Fouqué P., Caputo F., 2001, ApJ, 563, 319
- Bono et al. (2002) Bono G., Groenewegen M. A. T., Marconi M., Caputo F., 2002, ApJL, 574, L33
- Bono, Incerpi & Marconi (1996) Bono G., Incerpi R., Marconi M., 1996, ApJL, 467, L97
- Bono, Marconi & Stellingwerf (1999) Bono G., Marconi M., Stellingwerf R. F., 1999, ApJS, 122, 167
- Bono, Marconi & Stellingwerf (2000) Bono G., Marconi M., Stellingwerf R. F., 2000, A&A, 360, 245
- Bono et al. (2016) Bono G. et al., 2016, Commmunications of the Konkoly Observatory Hungary, 105, 149
- Bono & Stellingwerf (1994) Bono G., Stellingwerf R. F., 1994, ApJS, 93, 233
- Borissova et al. (2006) Borissova J., Minniti D., Rejkuba M., Alves D., 2006, A&A, 460, 459
- Borissova et al. (2004) Borissova J., Minniti D., Rejkuba M., Alves D., Cook K. H., Freeman K. C., 2004, A&A, 423, 97
- Borissova et al. (2009) Borissova J., Rejkuba M., Minniti D., Catelan M., Ivanov V. D., 2009, A&A, 502, 505
- Braga et al. (2015) Braga V. F. et al., 2015, ApJ, 799, 165
- Braga et al. (2016) Braga V. F. et al., 2016, AJ, 152, 170
- Braga et al. (2019) Braga V. F. et al., 2019, A&A, 625, A1
- Braga et al. (2018) Braga V. F. et al., 2018, AJ, 155, 137
- Buchler & Kolláth (2011) Buchler J. R., Kolláth Z., 2011, ApJ, 731, 24
- Butler (2003) Butler D. J., 2003, A&A, 405, 981
- Caputo (1997) Caputo F., 1997, MNRAS, 284, 994
- Caputo et al. (2005) Caputo F., Bono G., Fiorentino G., Marconi M., Musella I., 2005, ApJ, 629, 1021
- Caputo et al. (2000) Caputo F., Castellani V., Marconi M., Ripepi V., 2000, MNRAS, 316, 819
- Caputo, Marconi & Musella (2000) Caputo F., Marconi M., Musella I., 2000, A&A, 354, 610
- Cardelli, Clayton & Mathis (1989) Cardelli J. A., Clayton G. C., Mathis J. S., 1989, ApJ, 345, 245
- Carini et al. (2017) Carini R., Brocato E., Raimondo G., Marconi M., 2017, MNRAS, 469, 1532
- Catelan (2009) Catelan M., 2009, AP&SS, 320, 261
- Catelan, Pritzl & Smith (2004) Catelan M., Pritzl B. J., Smith H. A., 2004, ApJS, 154, 633
- Catelan & Smith (2015) Catelan M., Smith H. A., 2015, Pulsating Stars. Wiley-VCH
- Ceraski (1905) Ceraski W., 1905, Astronomische Nachrichten, 168, 29
- Chiosi et al. (1992) Chiosi C., Wood P., Bertelli G., Bressan A., 1992, ApJ, 387, 320
- Christy (1966) Christy R. F., 1966, ApJ, 144, 108
- Christy (1968) Christy R. F., 1968, Quarterly Journal of the Royal Astronomical Society, 9, 13
- Ciechanowska et al. (2010) Ciechanowska A., Pietrzyński G., Szewczyk O., Gieren W., Soszyński I., 2010, Acta Astron., 60, 233
- Cioni et al. (2011) Cioni M.-R. L. et al., 2011, A&A, 527, A116
- Clement et al. (2001) Clement C. M., Muzzin A., Dufton Q., Ponnampalam T., Wang J., Burford J., Richardson A., Rosebery T., Rowe J., Hogg H. S., 2001, AJ, 122, 2587
- Clementini et al. (1995) Clementini G., Carretta E., Gratton R., Merighi R., Mould J. R., McCarthy J. K., 1995, AJ, 110, 2319
- Clementini et al. (2017) Clementini G. et al., 2017, in European Physical Journal Web of Conferences, Vol. 152, European Physical Journal Web of Conferences, p. 02003
- Clementini et al. (2003) Clementini G., Gratton R., Bragaglia A., Carretta E., Di Fabrizio L., Maio M., 2003, AJ, 125, 1309
- Coppola et al. (2011) Coppola G., Dall’Ora M., Ripepi V., Marconi M., Musella I., Bono G., Piersimoni A. M., Stetson P. B., Storm J., 2011, MNRAS, 416, 1056
- Cox (1980a) Cox A. N., 1980a, ARA&A, 18, 15
- Cox (1980b) Cox J. P., 1980b, Theory of stellar pulsation. Princeton University Press, NJ
- Da Costa et al. (2010) Da Costa G. S., Rejkuba M., Jerjen H., Grebel E. K., 2010, ApJL, 708, L121
- Dall’Ora et al. (2004) Dall’Ora M. et al., 2004, ApJ, 610, 269
- Dambis, Rastorguev & Zabolotskikh (2014) Dambis A. K., Rastorguev A. S., Zabolotskikh M. V., 2014, MNRAS, 439, 3765
- Das et al. (2018) Das S., Bhardwaj A., Kanbur S. M., Singh H. P., Marconi M., 2018, MNRAS
- de Grijs (2011) de Grijs R., 2011, An Introduction to Distance Measurement in Astronomy, ISBN: 978-1-119-97817-6
- de Jong (2019) de Jong R. e. a., 2019, The Messenger, 175, 3
- Deb & Singh (2009) Deb S., Singh H. P., 2009, A&A, 507, 1729
- Deb & Singh (2014) Deb S., Singh H. P., 2014, MNRAS, 438, 2440
- Dékány et al. (2019) Dékány I., Hajdu G., Grebel E. K., Catelan M., 2019, ApJ, 883, 58
- Dékány et al. (2013) Dékány I., Minniti D., Catelan M., Zoccali M., Saito R. K., Hempel M., Gonzalez O. A., 2013, ApJL, 776, L19
- Dékány et al. (2015) Dékány I., Minniti D., Majaess D., Zoccali M., Hajdu G., Alonso-García J., Catelan M., Gieren W., Borissova J., 2015, ApJL, 812, L29
- Del Principe et al. (2005) Del Principe M., Piersimoni A. M., Bono G., Di Paola A., Dolci M., Marconi M., 2005, AJ, 129, 2714
- Derekas et al. (2017) Derekas A. et al., 2017, MNRAS, 464, 1553
- Di Criscienzo et al. (2007) Di Criscienzo M., Caputo F., Marconi M., Cassisi S., 2007, A&A, 471, 893
- Downes et al. (2004) Downes R. A., Margon B., Homer L., Anderson S. F., 2004, AJ, 128, 2288
- Dziembowski & Mizerski (2004) Dziembowski W. A., Mizerski T., 2004, Acta Astron., 54, 363
- Eddington (1918) Eddington A. S., 1918, MNRAS, 79, 2
- Eddington (1919) Eddington A. S., 1919, MNRAS, 79, 171
- Eddington (1926) Eddington A. S., 1926, The Internal Constitution of the Stars
- Engle (2015) Engle S., 2015, PhD thesis, James Cook University
- Fadeev & Fokin (1985) Fadeev I. A., Fokin A. B., 1985, APSS, 111, 355
- Fazio et al. (2004) Fazio G. G. et al., 2004, ApJS, 154, 10
- Feast (1999) Feast M., 1999, PASP, 111, 775
- Feast (2010) Feast M. W., 2010, in Variable Stars, the Galactic halo and Galaxy Formation, p. 45
- Feast (2013) Feast M. W., 2013, Galactic Distance Scales, Vol. 5, p. 829
- Feast et al. (2008) Feast M. W., Laney C. D., Kinman T. D., van Leeuwen F., Whitelock P. A., 2008, MNRAS, 386, 2115
- Feast et al. (2012) Feast M. W., Whitelock P. A., Menzies J. W., Matsunaga N., 2012, MNRAS, 421, 2998
- Fernley et al. (1998) Fernley J., Barnes T. G., Skillen I., Hawley S. L., Hanley C. J., Evans D. W., Solano E., Garrido R., 1998, A&A, 330, 515
- Fiorentino et al. (2002) Fiorentino G., Caputo F., Marconi M., Musella I., 2002, ApJ, 576, 402
- Fiorentino et al. (2006) Fiorentino G., Limongi M., Caputo F., Marconi M., 2006, A&A, 460, 155
- Fiorentino et al. (2007) Fiorentino G., Marconi M., Musella I., Caputo F., 2007, A&A, 476, 863
- For, Sneden & Preston (2011) For B.-Q., Sneden C., Preston G. W., 2011, ApJS, 197, 29
- Fouqué et al. (2007) Fouqué P. et al., 2007, A&A, 476, 73
- Freedman & Madore (2010) Freedman W. L., Madore B. F., 2010, ARA&A, 48, 673
- Freedman et al. (2001) Freedman W. L. et al., 2001, ApJ, 553, 47
- Freedman et al. (2019) Freedman W. L. et al., 2019, ApJ, 882, 34
- Freedman et al. (2008) Freedman W. L., Madore B. F., Rigby J., Persson S. E., Sturch L., 2008, ApJ, 679, 71
- Freedman et al. (2012) Freedman W. L., Madore B. F., Scowcroft V., Burns C., Monson A., Persson S. E., Seibert M., Rigby J., 2012, ApJ, 758, 24
- Freedman et al. (2011) Freedman W. L., Madore B. F., Scowcroft V., Monson A., Persson S. E., Seibert M., Rigby J. R., Sturch L., Stetson P., 2011, AJ, 142, 192
- Freedman et al. (2009) Freedman W. L., Rigby J., Madore B. F., Persson S. E., Sturch L., Mager V., 2009, ApJ, 695, 996
- García-Varela, Sabogal & Ramírez-Tannus (2013) García-Varela A., Sabogal B. E., Ramírez-Tannus M. C., 2013, MNRAS, 431, 2278
- Genovali et al. (2014) Genovali K. et al., 2014, A&A, 566, A37
- Genovali et al. (2013) Genovali K. et al., 2013, A&A, 554, A132
- Genovali et al. (2015) Genovali K. et al., 2015, A&A, 580, A17
- Gieren et al. (2013) Gieren W. et al., 2013, ApJ, 773, 69
- Gieren et al. (2005) Gieren W., Pietrzyński G., Soszyński I., Bresolin F., Kudritzki R.-P., Minniti D., Storm J., 2005, ApJ, 628, 695
- Gieren et al. (2009) Gieren W., Pietrzyński G., Soszyński I., Szewczyk O., Bresolin F., Kudritzki R.-P., Urbaneja M. A., Storm J., Minniti D., García-Varela A., 2009, ApJ, 700, 1141
- Gieren et al. (2018) Gieren W. et al., 2018, A&A, 620, A99
- Gieren, Fouque & Gomez (1998) Gieren W. P., Fouque P., Gomez M., 1998, ApJ, 496, 17
- Gingold (1976) Gingold R. A., 1976, ApJ, 204, 116
- Goodricke (1783) Goodricke J., 1783, Philosophical Transactions of the Royal Society of London Series I, 73, 474
- Goodricke (1786) Goodricke J., 1786, Philosophical Transactions of the Royal Society of London Series I, 76, 48
- Gratton et al. (2004) Gratton R. G., Bragaglia A., Clementini G., Carretta E., Di Fabrizio L., Maio M., Taribello E., 2004, A&A, 421, 937
- Groenewegen (2013) Groenewegen M. A. T., 2013, A&A, 550, A70
- Groenewegen (2018) Groenewegen M. A. T., 2018, A&A, 619, A8
- Groenewegen & Jurkovic (2017a) Groenewegen M. A. T., Jurkovic M. I., 2017a, A&A, 603, A70
- Groenewegen & Jurkovic (2017b) Groenewegen M. A. T., Jurkovic M. I., 2017b, A&A, 604, A29
- Groenewegen et al. (2004) Groenewegen M. A. T., Romaniello M., Primas F., Mottini M., 2004, A&A, 420, 655
- Groenewegen, Udalski & Bono (2008) Groenewegen M. A. T., Udalski A., Bono G., 2008, A&A, 481, 441
- Hajdu et al. (2018) Hajdu G., Dékány I., Catelan M., Grebel E. K., Jurcsik J., 2018, ApJ, 857, 55
- Harris (1985) Harris H. C., 1985, in Population II Cepheids, Madore B. F., ed., pp. 232–245
- Haschke et al. (2012) Haschke R., Grebel E. K., Frebel A., Duffau S., Hansen C. J., Koch A., 2012, AJ, 144, 88
- Hatt et al. (2017) Hatt D. et al., 2017, ApJ, 845, 146
- Hertzsprung (1926) Hertzsprung E., 1926, BAIN, 3, 115
- Hoffmeister (1929) Hoffmeister C., 1929, Astronomische Nachrichten, 236, 233
- Hubble (1929) Hubble E., 1929, Proceedings of the National Academy of Science, 15, 168
- Hubble (1926) Hubble E. P., 1926, ApJ, 64, 321
- Inno et al. (2013) Inno L. et al., 2013, ApJ, 764, 84
- Inno et al. (2015) Inno L. et al., 2015, A&A, 576, A30
- Ita et al. (2004a) Ita Y. et al., 2004a, MNRAS, 353, 705
- Ita et al. (2004b) Ita Y. et al., 2004b, MNRAS, 347, 720
- Jacyszyn-Dobrzeniecka et al. (2016) Jacyszyn-Dobrzeniecka A. M. et al., 2016, Acta Astron., 66, 149
- Jacyszyn-Dobrzeniecka et al. (2017) Jacyszyn-Dobrzeniecka A. M. et al., 2017, Acta Astron., 67, 1
- Jeffery & Saio (2016) Jeffery C. S., Saio H., 2016, MNRAS, 458, 1352
- Jurcsik & Kovacs (1996) Jurcsik J., Kovacs G., 1996, A&A, 312, 111
- Jurcsik et al. (2009) Jurcsik J. et al., 2009, MNRAS, 400, 1006
- Jurkovic (2018) Jurkovic M. I., 2018, Serbian Astronomical Journal, 197, 13
- Kains et al. (2019) Kains N. et al., 2019, MNRAS, 482, 3058
- Kanbur & Ngeow (2005) Kanbur S., Ngeow C., 2005, in ESA Special Publication, Vol. 576, The Three-Dimensional Universe with Gaia, Turon C., O’Flaherty K. S., Perryman M. A. C., eds., p. 691
- Kanbur et al. (2010) Kanbur S. M., Marconi M., Ngeow C., Musella I., Turner M., James A., Magin S., Halsey J., 2010, MNRAS, 408, 695
- Kanbur et al. (2007) Kanbur S. M., Ngeow C., Nanthakumar A., Stevens R., 2007, PASP, 119, 512
- Karczmarek et al. (2015) Karczmarek P., Pietrzyński G., Gieren W., Suchomska K., Konorski P., Górski M., Pilecki B., Graczyk D., Wielgórski P., 2015, AJ, 150, 90
- Karczmarek et al. (2017) Karczmarek P., Pietrzyński G., Górski M., Gieren W., Bersier D., 2017, AJ, 154, 263
- Kennicutt et al. (1998) Kennicutt, Robert C. J. et al., 1998, ApJ, 498, 181
- Kervella et al. (2004) Kervella P., Nardetto N., Bersier D., Mourard D., Coudé du Foresto V., 2004, A&A, 416, 941
- Kinemuchi et al. (2006) Kinemuchi K., Smith H. A., Woźniak P. R., McKay T. A., ROTSE Collaboration, 2006, AJ, 132, 1202
- Kinman & Brown (2014) Kinman T. D., Brown W. R., 2014, AJ, 148, 121
- Kippenhahn & Weigert (1991) Kippenhahn R., Weigert A., 1991, SSR, 58, 190
- Klein et al. (2011) Klein C. R., Richards J. W., Butler N. R., Bloom J. S., 2011, ApJ, 738, 185
- Klein et al. (2014) Klein C. R., Richards J. W., Butler N. R., Bloom J. S., 2014, MNRAS, 440, L96
- Kodric et al. (2018) Kodric M. et al., 2018, AJ, 156, 130
- Kodric et al. (2015) Kodric M., Riffeser A., Seitz S., Snigula J., Hopp U., Lee C.-H., Goessl C., Koppenhoefer J., Bender R., Gieren W., 2015, ApJ, 799, 144
- Kolenberg et al. (2010) Kolenberg K. et al., 2010, ApJL, 713, L198
- Kovtyukh et al. (2018) Kovtyukh V., Yegorova I., Andrievsky S., Korotin S., Saviane I., Lemasle B., Chekhonadskikh F., Belik S., 2018, MNRAS, 477, 2276
- Kubiak & Udalski (2003) Kubiak M., Udalski A., 2003, Acta Astron., 53, 117
- Kunder & Chaboyer (2009) Kunder A., Chaboyer B., 2009, AJ, 138, 1284
- Kunder et al. (2018) Kunder A. et al., 2018, Space Science Reviews, 214, 90
- Leavitt (1908) Leavitt H. S., 1908, Annals of Harvard College Observatory, 60, 87
- Leavitt & Pickering (1912) Leavitt H. S., Pickering E. C., 1912, Harvard College Observatory Circular, 173, 1
- Lemasle et al. (2013) Lemasle B. et al., 2013, A&A, 558, A31
- Lemasle et al. (2017) Lemasle B. et al., 2017, A&A, 608, A85
- Lemasle et al. (2015) Lemasle B., Kovtyukh V., Bono G., François P., Saviane I., Yegorova I., Genovali K., Inno L., Galazutdinov G., da Silva R., 2015, A&A, 579, A47
- Lindegren et al. (2018) Lindegren L. et al., 2018, A&A, 616, A2
- Lindegren et al. (2016) Lindegren L. et al., 2016, A&A, 595, A4
- Longmore, Fernley & Jameson (1986) Longmore A. J., Fernley J. A., Jameson R. F., 1986, MNRAS, 220, 279
- Maas, Giridhar & Lambert (2007) Maas T., Giridhar S., Lambert D. L., 2007, ApJ, 666, 378
- Macri et al. (2015) Macri L. M., Ngeow C.-C., Kanbur S. M., Mahzooni S., Smitka M. T., 2015, AJ, 149, 117
- Macri et al. (2006) Macri L. M., Stanek K. Z., Bersier D., Greenhill L. J., Reid M. J., 2006, ApJ, 652, 1133
- Madore (1982) Madore B. F., 1982, ApJ, 253, 575
- Madore & Freedman (1991) Madore B. F., Freedman W. L., 1991, PASP, 103, 933
- Madore & Freedman (2009) Madore B. F., Freedman W. L., 2009, ApJ, 696, 1498
- Madore et al. (2009) Madore B. F., Freedman W. L., Rigby J., Persson S. E., Sturch L., Mager V., 2009, ApJ, 695, 988
- Madore et al. (2013) Madore B. F., Hoffman D., Freedman W. L., Kollmeier J. A., Monson A., Persson S. E., Rich, Jeff A. J., Scowcroft V., Seibert M., 2013, ApJ, 776, 135
- Magurno et al. (2019) Magurno D. et al., 2019, ApJ, 881, 104
- Magurno et al. (2018) Magurno D., Sneden C., Braga V. F., Bono G., Mateo M., Persson S. E., DallOra M., Marengo M., Monelli M., Neeley J. R., 2018, ApJ, 864, 57
- Majaess, Turner & Lane (2009) Majaess D., Turner D., Lane D., 2009, Acta Astron., 59, 403
- Majewski et al. (2017) Majewski S. R. et al., 2017, AJ, 154, 94
- Mancino et al. (2020) Mancino S., Romaniello M., Anderson R. I., Kudritzki R.-P., 2020, arXiv e-prints, arXiv:2001.05881
- Manick et al. (2018) Manick R., Van Winckel H., Kamath D., Sekaran S., Kolenberg K., 2018, A&A, 618, A21
- Marconi et al. (2018) Marconi M., Bono G., Pietrinferni A., Braga V. F., Castellani M., Stellingwerf R. F., 2018, ApJL, 864, L13
- Marconi et al. (2015) Marconi M., Coppola G., Bono G., Braga V., Pietrinferni A., Buonanno R., Castellani M., Musella I., Ripepi V., Stellingwerf R. F., 2015, ApJ, 808, 50
- Marconi & Di Criscienzo (2007) Marconi M., Di Criscienzo M., 2007, A&A, 467, 223
- Marconi & Minniti (2018) Marconi M., Minniti D., 2018, ApJL, 853, L20
- Marconi et al. (2013a) Marconi M. et al., 2013a, ApJ, 768, L6
- Marconi et al. (2017) Marconi M., Molinaro R., Ripepi V., Cioni M.-R. L., Clementini G., Moretti M. I., Ragosta F., de Grijs R., Groenewegen M. A. T., Ivanov V. D., 2017, MNRAS, 466, 3206
- Marconi et al. (2013b) Marconi M., Molinaro R., Ripepi V., Musella I., Brocato E., 2013b, MNRAS, 428, 2185
- Marconi, Musella & Fiorentino (2005) Marconi M., Musella I., Fiorentino G., 2005, ApJ, 632, 590
- Marengo et al. (2010) Marengo M., Evans N. R., Barmby P., Bono G., Welch D. L., Romaniello M., 2010, ApJ, 709, 120
- Martin & Plummer (1915) Martin C., Plummer H. C., 1915, MNRAS, 75, 566
- Matsunaga et al. (2018) Matsunaga N., Bono G., Chen X., de Grijs R., Inno L., Nishiyama S., 2018, Space Science Reviews, 214, 74
- Matsunaga et al. (2016) Matsunaga N., Feast M. W., Bono G., Kobayashi N., Inno L., Nagayama T., Nishiyama S., Matsuoka Y., Nagata T., 2016, MNRAS, 462, 414
- Matsunaga, Feast & Menzies (2009) Matsunaga N., Feast M. W., Menzies J. W., 2009, MNRAS, 397, 933
- Matsunaga, Feast & Soszyński (2011) Matsunaga N., Feast M. W., Soszyński I., 2011, MNRAS, 413, 223
- Matsunaga et al. (2006) Matsunaga N. et al., 2006, MNRAS, 370, 1979
- Matsunaga et al. (2011) Matsunaga N., Kawadu T., Nishiyama S., Nagayama T., Kobayashi N., Tamura M., Bono G., Feast M. W., Nagata T., 2011, Nature, 477, 188
- McGonegal et al. (1982) McGonegal R., McAlary C. W., Madore B. F., McLaren R. A., 1982, ApJL, 257, L33
- McNamara (1995) McNamara D. H., 1995, AJ, 109, 2134
- McWilliam (2011) McWilliam A., 2011, RR Lyrae Stars, Metal-Poor Stars, and the Galaxy conference proceedings, 5
- Mérand et al. (2015) Mérand A. et al., 2015, A&A, 584, A80
- Minniti et al. (2010) Minniti D. et al., 2010, New Astronomy, 15, 433
- Molnár (2018) Molnár L., 2018, in The RR Lyrae 2017 Conference. Revival of the Classical Pulsators: from Galactic Structure to Stellar Interior Diagnostics, Smolec R., Kinemuchi K., Anderson R. I., eds., Vol. 6, pp. 106–113
- Monson et al. (2012) Monson A. J., Freedman W. L., Madore B. F., Persson S. E., Scowcroft V., Seibert M., Rigby J. R., 2012, ApJ, 759, 146
- Moretti et al. (2014a) Moretti M. I. et al., 2014a, MNRAS, 437, 2702
- Moretti et al. (2014b) Moretti M. I. et al., 2014b, MNRAS, 437, 2702
- Moskalik et al. (2015) Moskalik P. et al., 2015, MNRAS, 447, 2348
- Muraveva et al. (2018a) Muraveva T., Delgado H. E., Clementini G., Sarro L. M., Garofalo A., 2018a, MNRAS, 481, 1195
- Muraveva et al. (2015) Muraveva T., Palmer M., Clementini G., Luri X., Cioni M.-R. L., Moretti M. I., Marconi M., Ripepi V., Rubele S., 2015, ApJ, 807, 127
- Muraveva et al. (2018b) Muraveva T., Subramanian S., Clementini G., Cioni M. R. L., Palmer M., van Loon J. T., Moretti M. I., de Grijs R., Molinaro R., Ripepi V., 2018b, MNRAS, 473, 3131
- Nataf et al. (2016) Nataf D. M. et al., 2016, MNRAS, 456, 2692
- Navarrete et al. (2015) Navarrete C., Contreras Ramos R., Catelan M., Clement C. M., Gran F., Alonso-García J., Angeloni R., Hempel M., Dékány I., Minniti D., 2015, A&A, 577, A99
- Neeley et al. (2017) Neeley J. R. et al., 2017, ApJ, 841, 84
- Neeley et al. (2019) Neeley J. R. et al., 2019, MNRAS, 490, 4254
- Neilson, Cantiello & Langer (2011) Neilson H. R., Cantiello M., Langer N., 2011, A&A, 529, L9
- Neilson et al. (2016) Neilson H. R., Engle S. G., Guinan E. F., Bisol A. C., Butterworth N., 2016, ApJ, 824, 1
- Nemec et al. (2013) Nemec J. M., Cohen J. G., Ripepi V., Derekas A., Moskalik P., Sesar B., Chadid M., Bruntt H., 2013, ApJ, 773, 181
- Nemec, Nemec & Lutz (1994) Nemec J. M., Nemec A. F. L., Lutz T. E., 1994, AJ, 108, 222
- Netzel, Smolec & Moskalik (2015) Netzel H., Smolec R., Moskalik P., 2015, MNRAS, 447, 1173
- Ngeow & Kanbur (2006a) Ngeow C., Kanbur S. M., 2006a, ApJ, 650, 180
- Ngeow & Kanbur (2006b) Ngeow C., Kanbur S. M., 2006b, ApJL, 642, L29
- Ngeow, Kanbur & Nanthakumar (2008) Ngeow C., Kanbur S. M., Nanthakumar A., 2008, A&A, 477, 621
- Ngeow (2012) Ngeow C.-C., 2012, ApJ, 747, 50
- Ngeow et al. (2017) Ngeow C.-C., Kanbur S. M., Bhardwaj A., Schrecengost Z., Singh H. P., 2017, ApJ, 834, 160
- Ngeow et al. (2015) Ngeow C.-C., Kanbur S. M., Bhardwaj A., Singh H. P., 2015, ApJ, 808, 67
- Ngeow et al. (2009) Ngeow C.-C., Kanbur S. M., Neilson H. R., Nanthakumar A., Buonaccorsi J., 2009, ApJ, 693, 691
- Ngeow et al. (2005) Ngeow C.-C., Kanbur S. M., Nikolaev S., Buonaccorsi J., Cook K. H., Welch D. L., 2005, MNRAS, 363, 831
- Nishiyama et al. (2006) Nishiyama S. et al., 2006, ApJ, 638, 839
- Nishiyama et al. (2009) Nishiyama S., Tamura M., Hatano H., Kato D., Tanabé T., Sugitani K., Nagata T., 2009, ApJ, 696, 1407
- Oosterhoff (1939) Oosterhoff P. T., 1939, The Observatory, 62, 104
- Pancino et al. (2015) Pancino E., Britavskiy N., Romano D., Cacciari C., Mucciarelli A., Clementini G., 2015, MNRAS, 447, 2404
- Persson et al. (2004) Persson S. E., Madore B. F., Krzemiński W., Freedman W. L., Roth M., Murphy D. C., 2004, AJ, 128, 2239
- Petersen & Diethelm (1986) Petersen J. O., Diethelm R., 1986, A&A, 156, 337
- Pickering (1889) Pickering E. C., 1889, Astronomische Nachrichten, 123, 207
- Pickering et al. (1901) Pickering E. C., Colson H. R., Fleming W. P., Wells L. D., 1901, ApJ, 13, 226
- Pietrukowicz et al. (2015) Pietrukowicz P. et al., 2015, ApJ, 811, 113
- Pietrzyński & Gieren (2006) Pietrzyński G., Gieren W., 2006, MmSAI, 77, 239
- Pietrzyński et al. (2007) Pietrzyński G. et al., 2007, AJ, 134, 594
- Pietrzyński et al. (2019) Pietrzyński G., Graczyk D., Gallenne A., Gieren W., Thompson I. B., Pilecki B., Karczmarek P., Górski M., Suchomska K., Taormina M., 2019, Nature, 567, 200
- Pietrzyński et al. (2010) Pietrzyński G., Thompson I. B., Gieren W., Graczyk D., Bono G., Udalski A., Soszyński I., Minniti D., Pilecki B., 2010, Nature, 468, 542
- Pilecki et al. (2018) Pilecki B. et al., 2018, ApJ, 862, 43
- Planck Collaboration et al. (2018) Planck Collaboration et al., 2018, ArXiv, 1807.06209
- Prada Moroni et al. (2012) Prada Moroni P. G., Gennaro M., Bono G., Pietrzyński G., Gieren W., Pilecki B., Graczyk D., Thompson I. B., 2012, ApJ, 749, 108
- Proxauf et al. (2018) Proxauf B. et al., 2018, A&A, 616, A82
- Riess et al. (2014) Riess A. G., Casertano S., Anderson J., MacKenty J., Filippenko A. V., 2014, ApJ, 785, 161
- Riess et al. (2018a) Riess A. G. et al., 2018a, ApJ, 855, 136
- Riess et al. (2018b) Riess A. G. et al., 2018b, ApJ, 861, 126
- Riess et al. (2019) Riess A. G., Casertano S., Yuan W., Macri L. M., Scolnic D., 2019, ApJ, 876, 85
- Riess et al. (2011) Riess A. G., Macri L., Casertano S., Lampeitl H., Ferguson H. C., Filippenko A. V., Jha S. W., Li W., Chornock R., 2011, ApJ, 730, 119
- Riess et al. (2016) Riess A. G. et al., 2016, ApJ, 826, 56
- Ripepi et al. (2017) Ripepi V. et al., 2017, MNRAS, 472, 808
- Ripepi et al. (2018) Ripepi V., Molinaro R., Musella I., Marconi M., Leccia S., Eyer L., 2018, arXiv e-prints, arXiv:1810.10486
- Ripepi et al. (2015) Ripepi V. et al., 2015, MNRAS, 446, 3034
- Ripepi et al. (2012) Ripepi V. et al., 2012, MNRAS, 424, 1807
- Ritter (1879) Ritter A., 1879, Annalen der Physik, 244, 157
- Romaniello et al. (2005) Romaniello M., Primas F., Mottini M., Groenewegen M., Bono G., François P., 2005, A&A, 429, L37
- Romaniello et al. (2008) Romaniello M., Primas F., Mottini M., Pedicelli S., Lemasle B., Bono G., François P., Groenewegen M. A. T., Laney C. D., 2008, A&A, 488, 731
- Rood (1973) Rood R. T., 1973, ApJ, 184, 815
- Sachkov, Bertone & Chavez (2018) Sachkov M. E., Bertone E., Chavez M., 2018, in A.A. Boyarchuk Memorial Conference, Bisikalo D. V., Wiebe D. S., eds., pp. 100–104
- Saha et al. (2019) Saha A. et al., 2019, ApJ, 874, 30
- Salaris & Cassisi (2005) Salaris M., Cassisi S., 2005, Evolution of Stars and Stellar Populations, Vol. pp. 400. ISBN 0-470-09220-3. Wiley-VCH. Evolution of Stars and Stellar Populations, by Maurizio Salaris, Santi Cassisi
- Sandage (1958) Sandage A., 1958, ApJ, 128, 150
- Sandage (1982) Sandage A., 1982, ApJ, 252, 553
- Sandage & Tammann (2006) Sandage A., Tammann G. A., 2006, ARA&A, 44, 93
- Sandage, Tammann & Reindl (2004) Sandage A., Tammann G. A., Reindl B., 2004, A&A, 424, 43
- Schmidt et al. (2009) Schmidt E. G., Hemen B., Rogalla D., Thacker-Lynn L., 2009, AJ, 137, 4598
- Schönfeld (1866) Schönfeld J., 1866, Jahresberichte of the Mannheim Physical Society, 32
- Scowcroft et al. (2016a) Scowcroft V., Freedman W. L., Madore B. F., Monson A., Persson S. E., Rich J., Seibert M., Rigby J. R., 2016a, ApJ, 816, 49
- Scowcroft et al. (2011) Scowcroft V., Freedman W. L., Madore B. F., Monson A. J., Persson S. E., Seibert M., Rigby J. R., Sturch L., 2011, ApJ, 743, 76
- Scowcroft et al. (2016b) Scowcroft V., Seibert M., Freedman W. L., Beaton R. L., Madore B. F., Monson A. J., Rich J. A., Rigby J. R., 2016b, MNRAS, 459, 1170
- Shapley (1914) Shapley H., 1914, ApJ, 40, 448
- Siegel et al. (2015) Siegel M. H., Porterfield B. L., Balzer B. G., Hagen L. M. Z., 2015, AJ, 150, 129
- Simon & Davis (1983) Simon N. R., Davis C. G., 1983, ApJ, 266, 787
- Simon & Lee (1981) Simon N. R., Lee A. S., 1981, ApJ, 248, 291
- Simon & Moffett (1985) Simon N. R., Moffett T. J., 1985, PSAP, 97, 1078
- Simon & Schmidt (1976) Simon N. R., Schmidt E. G., 1976, ApJ, 205, 162
- Simon & Teays (1982) Simon N. R., Teays T. J., 1982, ApJ, 261, 586
- Skarka, Prudil & Jurcsik (2020) Skarka M., Prudil Z., Jurcsik J., 2020, MNRAS, 494, 1237
- Skowron et al. (2019) Skowron D. M. et al., 2019, Science, 365, 478
- Smith (1995) Smith H. A., 1995, RR Lyrae stars, Cambridge Astrophysics Series 27
- Smolec (2016) Smolec R., 2016, MNRAS, 456, 3475
- Smolec & Śniegowska (2016) Smolec R., Śniegowska M., 2016, MNRAS, 458, 3561
- Sollima et al. (2006) Sollima A., Borissova J., Catelan M., Smith H. A., Minniti D., Cacciari C., Ferraro F. R., 2006, ApJL, 640, L43
- Sollima, Cacciari & Valenti (2006) Sollima A., Cacciari C., Valenti E., 2006, MNRAS, 372, 1675
- Soszyński, Gieren & Pietrzyński (2005) Soszyński I., Gieren W., Pietrzyński G., 2005, PASP, 117, 823
- Soszynski et al. (2008) Soszynski I., Poleski R., Udalski A., Szymanski M. K., Kubiak M., Pietrzynski G., Wyrzykowski L., Szewczyk O., Ulaczyk K., 2008, Acta Astron., 58, 163
- Soszyński et al. (2019) Soszyński I., Smolec R., Udalski A., Pietrukowicz P., 2019, ApJ, 873, 43
- Soszyński et al. (2011) Soszyński I., Udalski A., Pietrukowicz P., Szymański M. K., Kubiak M., Pietrzyński G., Wyrzykowski Ł., Ulaczyk K., Poleski R., Kozłowski S., 2011, Acta Astron., 61, 285
- Soszyński et al. (2008) Soszyński I., Udalski A., Szymański M. K., Kubiak M., Pietrzyński G., Wyrzykowski Ł., Szewczyk O., Ulaczyk K., Poleski R., 2008, Acta Astron., 58, 293
- Soszyński et al. (2010) Soszyński I., Udalski A., Szymański M. K., Kubiak M., Pietrzyński G., Wyrzykowski Ł., Ulaczyk K., Poleski R., 2010, Acta Astron., 60, 91
- Soszyński et al. (2015) Soszyński I. et al., 2015, Acta Astron., 65, 297
- Soszyński et al. (2018) Soszyński I. et al., 2018, Acta Astron., 68, 89
- Soszyński et al. (2016) Soszyński I. et al., 2016, Acta Astron., 66, 131
- Soszyński et al. (2017a) Soszyński I. et al., 2017a, Acta Astron., 67, 103
- Soszyński et al. (2017b) Soszyński I. et al., 2017b, Acta Astron., 67, 297
- Stellingwerf (1982) Stellingwerf R. F., 1982, ApJ, 262, 330
- Stellingwerf (1984) Stellingwerf R. F., 1984, ApJ, 277, 327
- Stellingwerf & Donohoe (1986) Stellingwerf R. F., Donohoe M., 1986, ApJ, 306, 183
- Stobie (1969a) Stobie R. S., 1969a, MNRAS, 144, 461
- Stobie (1969b) Stobie R. S., 1969b, MNRAS, 144, 485
- Storm et al. (2004) Storm J., Carney B. W., Gieren W. P., Fouqué P., Latham D. W., Fry A. M., 2004, A&A, 415, 531
- Storm et al. (2011) Storm J., Gieren W., Fouqué P., Barnes T. G., Soszyński I., Pietrzyński G., Nardetto N., Queloz D., 2011, A&A, 534, A95
- Sturch (1966) Sturch C., 1966, ApJ, 143, 774
- Subramanian et al. (2017) Subramanian S., Marengo M., Bhardwaj A., Huang Y., Inno L., Nakagawa A., Storm J., 2017, Space Science Reviews, 212, 1817
- Subramanian & Subramaniam (2012) Subramanian S., Subramaniam A., 2012, ApJ, 744, 128
- Subramanian & Subramaniam (2015) Subramanian S., Subramaniam A., 2015, A&A, 573, A135
- Sweigart & Catelan (1998) Sweigart A. V., Catelan M., 1998, ApJL, 501, L63
- Szabó et al. (2010) Szabó R. et al., 2010, MNRAS, 409, 1244
- Tammann, Sandage & Reindl (2003) Tammann G. A., Sandage A., Reindl B., 2003, A&A, 404, 423
- Turner (2010) Turner D. G., 2010, AP & SS, 326, 219
- Udalski et al. (1993) Udalski A., Szymanski M., Kaluzny J., Kubiak M., Krzeminski W., Mateo M., Preston G. W., Paczynski B., 1993, Acta Astron., 43, 289
- Ulaczyk et al. (2013) Ulaczyk K. et al., 2013, Acta Astronomica, 63, 159
- van den Bergh (1975) van den Bergh S., 1975, The Extragalactic Distance Scale, The Extragalactic Distance Scale, Sandage, Allan and Sandage, Mary and Kristian, Jerome, p. 509
- van Leeuwen (2007) van Leeuwen F., 2007, A&A, 474, 653
- Verde, Treu & Riess (2019) Verde L., Treu T., Riess A. G., 2019, arXiv:1907.10625, arXiv:1907.10625
- Wallerstein (2002) Wallerstein G., 2002, PASP, 114, 689
- Wallerstein & Cox (1984) Wallerstein G., Cox A. N., 1984, PASP, 96, 677
- Welch (2012) Welch D. L., 2012, Journal of the American Association of Variable Star Observers (JAAVSO), 40, 492
- Wheatley, Welsh & Browne (2012) Wheatley J., Welsh B. Y., Browne S. E., 2012, PASP, 124, 552
- Wielgórski et al. (2017) Wielgórski P. et al., 2017, ApJ, 842, 116
- Wood, Arnold & Sebo (1997) Wood P. R., Arnold A. S., Sebo K. M., 1997, ApJL, 485, L25
- Zaritsky et al. (2004) Zaritsky D., Harris J., Thompson I. B., Grebel E. K., 2004, AJ, 128, 1606
- Zgirski et al. (2017) Zgirski B., Gieren W., Pietrzyński G., Karczmarek P., Gorski M., Wielgorski P., Narloch W., Graczyk D., Kudritzki R.-P., Bresolin F., 2017, ApJ, 847, 88
- Zhao et al. (2012) Zhao G., Zhao Y.-H., Chu Y.-Q., Jing Y.-P., Deng L.-C., 2012, RAA, 12, 723