Effect of flow-induced molecular alignment on welding and strength of polymer interfaces
Abstract
Structures formed by fused filament fabrication are often substantially weaker than those made with conventional techniques, and fail at the welds between successive layers. One factor that may influence strength is flow-induced alignment of deposited material. Recent work suggests that alignment reduces the entanglement density and thus should accelerate welding by diffusion. Here, coarse-grained molecular simulations are used to test the effect of molecular alignment on diffusion and weld strength. While standard measures show a decrease of the entanglement density with alignment, there is no change in the rate of diffusion normal to the interface or the rate of formation of entanglements across the interface. The time for chain reorientation also remains equal to the equilibrium disentanglement time . Despite this, simulations of mechanical tests show that welds formed from aligned states are weaker until several . This is not because the weld itself is weaker, but because aligned material near the weld is weaker than unaligned material. The maximum shear strength and tensile fracture energy of welded systems are the same as bulk systems with the same alignment.
Johns Hopkins University] Department of Physics and Astronomy, Johns Hopkins University, Baltimore, Maryland 21218, United States
![[Uncaptioned image]](/html/2006.15742/assets/x1.png)
1 Introduction
Welding of polymer interfaces plays a fundamental role in manufacturing processes that range from extruding pipe to additive manufacturing (AM), also known as 3D printing.1, 2, 3, 4, 5 The most common technique used for AM is Fused Filament Fabrication (FFF), where molten polymer is extruded and deposited in successive layers.4, 5 Welding of layers occurs through diffusion of molecules across the interface and stops when the temperature drops below the glass transition temperature . The welding time should be long enough to create strong interfaces, 6, 7, 8, 9 but short enough that deposited material retains the desired shape.10 Tests show that welds remain the point of failure for many printing protocols,6, 11, 5, 4 leading to great interest in what causes weak interfaces and how they can be strengthened.
One parameter that is affected by deposition protocols is the degree of molecular alignment. Faster deposition and smaller nozzle sizes produce higher shear rates during extrusion. Bending of the filament as it is deposited produces extensional flow at the bottom of filaments and compressional flow at the top. When deformation is faster than molecular relaxation times, molecules become aligned along the interface, with greater alignment at the bottom of filaments.7, 8 Models suggest that alignment reduces the entanglement density 12, 13, 14, 15 and thus enhances the dynamics of molecules, offering the possibility that faster deposition could lead to faster welding. 7, 8 However, the effect of alignment on welding has not been studied directly.
Recent work shows that coarse-grained molecular dynamics (MD) is a powerful tool for studying weld formation and relating bulk mechanical properties to molecular entanglements, which are not directly observable in experiments.16, 17, 18, 19. Studies of unaligned systems found that both the tensile fracture energy of the interface and its shear strength scaled with the areal density of entanglements between chains that started on opposite sides of the interface. As in experiments, bulk strength was achieved long before the disentanglement or reptation time required for molecules to diffuse by their end-end length. Simulations showed that molecules at the interface only needed to diffuse far enough to form about two entanglements with chains from the other side.16, 17, 18, 19.
This paper uses coarse-grained MD to study welding in aligned polymer systems. Polymer melts are sheared to produce very different degrees of alignment and then brought into contact with equilibrium or aligned substrates. Although there is an apparent loss of entanglements with increasing alignment, the rates of relaxation of molecular alignment, of diffusion across the interface, and of formation of interfacial entanglements are relatively insensitive to alignment. In all cases, the characteristic time scales remain close to equilibrium values given by tube models of polymer dynamics.20
Despite this, alignment has a pronounced effect on the mechanical properties of the welded interface. The fracture energy and shear strength rise more slowly than for equilibrium systems, and do not saturate until several . Examination of molecular displacements shows that failure does not occur at the weld, but in aligned material nearby. The strength reduction in welded samples is the same as that for bulk systems with the same alignment. These results have important implications for the minimum weld time needed to achieve optimum mechanical properties.
The following section provides details of the methods used to align, weld and test welded samples. Then results are presented for the relaxation time of molecular conformations and dynamics at the weld interface. Next the measured mechanical response to shear and tension is used to determine the shear strength and fracture toughness. The final section summarizes the results and discusses the implications for printing protocols.
2 Simulation Model and Methodology
All of our simulations employed the simulation package LAMMPS21 and used the Kremer-Grest model for linear homopolymers22, 23. Van der Waals interactions between monomers of mass are modeled by a Lennard-Jones (LJ) potential with interaction energy and monomer diameter . To accelerate simulations the potential is truncated and shifted to zero at a cutoff radius . Mappings to real polymers 23 typically give nm and the unit of stress MPa.
Linear chains of length were made by connecting beads to their nearest-neighbors with a bond potential. All melt simulations including equilibration, shearing and welding were performed with the usual finitely extensible nonlinear elastic (FENE) potential 22. This prevents chains from crossing or breaking, but chain scission plays an important role in mechanical failure of glassy polymers.24, 16, 17, 19, 18 As in past studies of welding,16, 17, 19, 18 we used a breakable quartic potential in simulations of solid deformation. The potential is chosen to have nearly the same bond length as the FENE potential and to break at a force corresponding to about 100 times the force necessary to break LJ bonds, as this ratio has been found to be representative of real polymers.24, 19 The entanglement length for this model is and polymers with are long enough to have the mechanical response of highly entangled polymers.19
Melt slabs with chains were equilibrated at temperature and density with following the standard double-bridging algorithm.25 The samples were periodic in the and directions with periods and , while the length in the confined direction, , was fixed by using two repulsive featureless walls.17 Small deviations from equilibrium behavior are present close to the walls, which is consistent with reports in the literature.26, 27 We also equilibrated melts with chains using the same boundary conditions but double the length in the direction. These systems had the same geometry and were exposed to the same shear history as welded samples. Since they had no initial interface, we will refer to them as bulk samples and use mechanical tests on them as a reference for the intrinsic response of bulk aligned systems.
As noted in the introduction, FFF deforms filaments in complicated ways. There is shear flow in the nozzle and the nozzle may scrape over the deposited filament, causing further shear. There is also elongational (compressional) flow at the bottom (top) surface as the filament bends and joins the growing part, and some relaxation of chains will occur during this process. Rather than attempting to model this process in detail, we consider systems where the system has been sheared at rates that produce dramatic changes in the degree of alignment and examine the trends with alignment.
Slabs were sheared along the direction with a velocity gradient along the direction. Slabs are finite in the direction and shear was imposed by applying constraints on atoms within a distance of the confining repulsive walls. Applying a force in the direction or constraining the average velocity of atoms in the direction produced statistically equivalent chain conformations and weld strength and we show results for the velocity constraint below. The constraints produced a linear velocity profile in the center of the film with shear rate . As discussed in the next section, the alignment, entanglement density, and relaxation dynamics in this region were consistent with bulk simulations of shear at the same with periodic boundary conditions in all three directions.
During shear, the temperature was kept at with a Langevin thermostat. To prevent any bias of the flow profile, only the deviation from a linear velocity profile was thermostatted. The damping time was , where is the characteristic Lennard-Jones time. Decreasing the damping by an order of magnitude did not produce statistically significant changes in velocities, stresses or chain conformations. The entanglement time for this potential, , has been determined in past studies.28 Then scaling arguments29 predict a disentanglement time that is consistent with the measured relaxation time for alignment, as discussed below. The time for chains to relax their length in the tube is the Rouse time , with . Steady-states were reached after shearing for a time between and , depending on the rate. This is about or longer and corresponded to strains of at least 100. The system was determined to be in steady state by looking at both the shear stress and chain statistics. In the following we will use the shorthand .
The degree of chain stretching during shear is determined by the competition between shear deformation and chain relaxation in the tube.30, 20 This is characterized by the dimensionless Rouse-Weissenberg number: . Results are presented for , and , corresponding to , 74 and 370. The lowest is comparable to the highest Weissenberg numbers estimated in recent models of FFF deposition, and produces chain stretches of the same order.7, 8. However, this produces relatively little stretching and loss of entanglements in our simulations and past work.13, 15 Higher shear rates were studied to explore the range of possible alignments and entanglement loss.
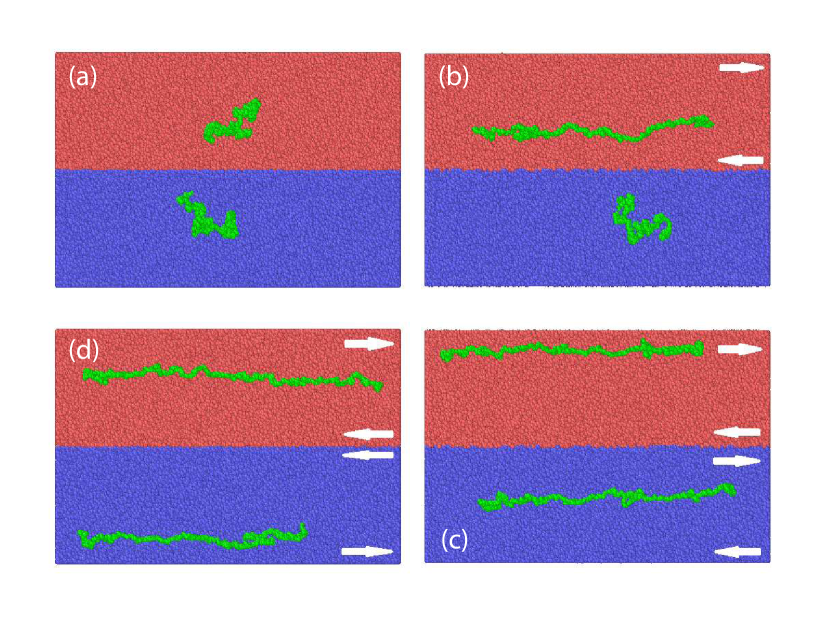
After equilibration or shearing to steady state, two slabs were moved into contact and allowed to weld. The repulsive walls between slabs were removed and they were moved as close as possible without having any repulsive interactions between monomers from different slabs. This produces an interface that is parallel to the plane and welding occurs by interdiffusion along the direction. As depicted in Fig. 1, four types of system were prepared for welding. The reference configuration has both slabs in equilibrium. The second configuration has only one surface sheared, since the top of a filament has more time to relax and is under slower deformation than the bottom.7, 8 The final two configurations have slabs sheared in the same or opposite directions to mimic different possible printing patterns.
Welding was allowed to occur for the desired weld time before quenching into the glassy phase. Bulk systems were allowed to relax for the same time intervals from the same to determine how interfaces changed the mechanical response. The temperature during welding will not be constant, but an effective at a reference temperature can be obtained from the thermal history and time-temperature superposition.30, 7, 8, 6, 9
.
After welding or bulk relaxation, systems were quenched from the melt temperature of to , which is below the glass transition temperature for this system. The cooling protocol followed past work.16, 18 First the Lennard-Jones cutoff was increased to . Then the system was quenched at constant volume at a rate of to about where has dropped to nearly zero. The rest of the quench was done at at a rate of . and were controlled with a Nose-Hoover barostat with damping time and was maintained with a Langevin thermostat with time constant . After the quench, the bonding potential along the chain was changed from FENE to the breakable quartic potential used in previous weld simulations.16, 17, 19, 18.
To deform the resulting glasses, we imposed rigid displacements on beads within of the walls at the top and bottom of the system that are farthest from the welded interface. Stress was determined by monitoring the total force imposed on these groups of atoms. The temperature during deformation was kept at by a Langevin thermostat with a damping time of and acting only in directions orthogonal to deformation in order to avoid biasing displacements.
For simulations of tensile fracture of the welded interface, we followed past studies of the fracture energy of glassy polymers. 24, 18. The top and bottom were moved apart at a constant velocity in a direction perpendicular to the interface. Simulations of shear fracture mimiced shear tests of lap joints.1 A shear displacement was applied in the weld plane and normal to the printing direction along which molecules are aligned. This orientation was chosen to most closely reflect the shear in tear tests on printed samples.6 Top and bottom were displaced in opposite directions along the y axis, with a velocity consistent with a strain rate of . This is the same strain rate used in past simulations 16, 17, 31, where it was determined to be small enough to allow the stress to equilibrate across the system.
Entanglements are known to have a strong effect on the mechanical properties of bulk glassy polymers32, 33 and welds.1 We use both Primitive Path Analysis (PPA)34, 35, 36 and the Z1 code 37, 38 to identify entanglements between chains. Results are obtained from the entire volume of a slab, but excluding the region near the surfaces had little effect.
An executable for the Z1 code was provided by Martin Kröger. Several versions of the PPA have been proposed. We used one where the attractive FENE potential has a constant attractive force below some separation to produce a constant tension along the chain.36 The influence of excluded volume is reduced by shrinking the radius of monomers by a factor of 8 and adding 7 extra beads between each initial monomer to prevent chain crossing. In both approaches, topological constraints (TCs) are identified as contacts (repulsive interactions) between chains after they have been shortened as far as possible with ends fixed and no chain crossing. The Z1 code determines from the number of points along a chain where it changes direction by more than a threshold angle due to contact with another chain or chains. For PPA we count the number of connected regions where a chain contacts other chains. Gaps in contact of less than are excluded to avoid double counting contacts with multiple chains at the same point. Values of produced in this way are similar for the two methods. However, they are larger than the number of entanglements determined from rheological measurements because there are multiple TCs within the Kuhn length of the primitive path.38, 37, 36, 34 For and there should be entanglements per chain, but we find about twice this many TCs in equilibrium from the Z1 code and from PPA.
3 Results
3.1 Structure and Entanglements During Steady Shear
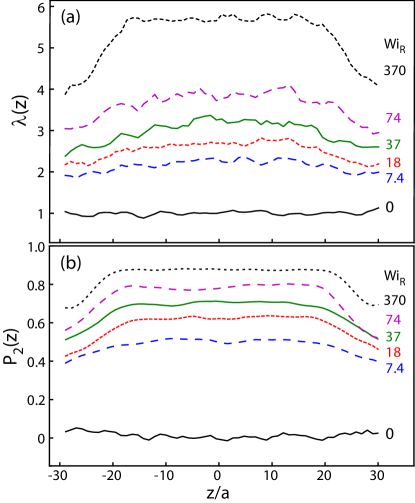
To quantify the degree of alignment produced by steady-state shear of melts, the stretching and orientation of chains were calculated as a function of height along the velocity gradient direction. Figure 2 shows the degree of stretch , defined as the ratio of the root-mean-squared (rms) end-end length of chains to the equilibrium value of . Results were binned by the location of each end to obtain local information about chains starting near the surfaces. The equilibrium results show remains near unity across the slab. For , , with small decreases in stretching near the surface. Surface effects become more apparent as increases, and extend up to about . Nonetheless, the stretch at each increases substantially with increasing rate, and these sheared systems provide initial states with a broad range of stretches at the interface where welding will take place.
Theories of polymer rheology often quantify stretch by taking the trace of the conformation tensor , where are components of the end-end vector, and the equilibrium value of is twice the square of the equilibrium radius of gyration . Deviations from equilibrium are quantified by . In the following we focus on , and , corresponding to surface values of , 3 and 4 and , and , respectively. McIlroy and Olmsted found values of were produced for one set of printing parameters, which is comparable to our lowest rate. Our results for the largest correspond to rates about 50 times higher.
Entanglements play a critical role in the mechanical properties of glassy polymers.32, 33, 1 To examine the degree of chain alignment on the entanglement scale, we divided chains into segments of length with arbitrary starting points relative to the chain ends. The degree of orientation along the flow direction was then quantified by calculating the nematic order parameter:
| (1) |
where is the angle between the axis and the vector between segment ends. The value of is zero for random orientation and reaches one for perfect alignment. Once again, results for and are relatively constant across the slab. While there are drops in near the wall for larger , the degree of order at the surface rises significantly from about 0.4 to 0.7. Similar plots for the orientation of the entire chain show rising from 0.6 to 0.8 for the same .
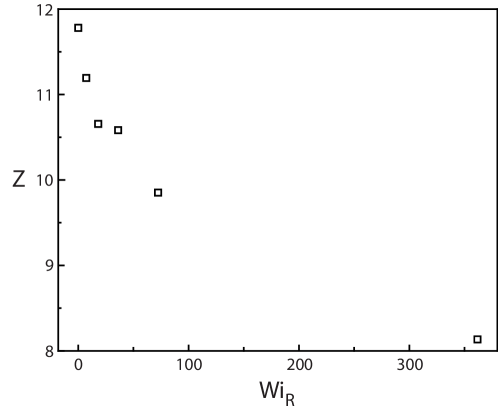
A variety of evidence suggests that alignment reduces the number of entanglements.12, 13, 15, 39 Indeed models of FFF predicted more than 60% of entanglements were lost at alignments corresponding to our lowest rates.7, 8 Figure 3 shows the rate dependence of in steady-state flow from the Z1 code. There is a drop by about 20% at and 30% at . Slightly larger drops have been seen in simulations of polyethylene at these . 13, 15 There, and in our ongoing studies of semiflexible chains, the drop in at a given rises with increasing . Elongational flow, which may be present as the filament bends during extrusion, can lead to larger reductions in from the Z1 code.39
In contrast to Fig. 3, drops by less than 5% when measured with PPA for the most aligned states. This stark difference in behavior persists for all the treatments of multiple contacts that we tried. One possibility is that because chains are much straighter, the angle-change criterion used in the Z1 code excludes more contacts as increases. The origin of this difference will be the subject of future studies, but is not central to the development of weld strength considered here. The results below and in recent work 39 show that whether reductions in are apparent or real, the time scales that control relaxation retain their equilibrium values in highly aligned states and alignment does not change the rate of interdiffusion at welds.
.
3.2 Relaxation and Diffusion During Welding
After shearing is stopped, the stretch and orientation of chains begin to relax from the steady-state values described in the previous section. In our simulations, shear stops at the same time that slabs are placed in contact and begin to weld through interdiffusion. Thus the time for relaxation equals the weld time and all results are presented in terms of . In FFF there might be several stages of deformation and relaxation before a filament contacted the substrate. The main effect of such stages is just to alter the alignment at the time of contact and the onset of welding. This section shows that the rates of relaxation and interdiffusion are quite insensitive to alignment.
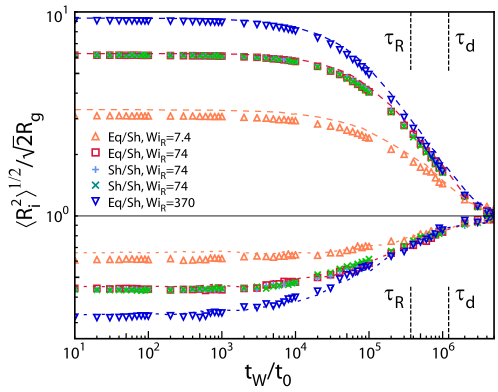
Figure 4 shows the relaxation of the rms components of the end-end vector along the flow direction (x) and normal to the interface (z). Results for the direction are similar to those along . Results are averaged only over chains that started in sheared slabs and are normalized by so that they reach unity in equilibrium. Results for the bulk systems without an interface are shown by lines for comparison. The magnitude of changes in Fig. 4 increases with , but the time scale for change is always of order .
Immediately after shear is stopped, almost all of the end-end length is associated with the projection along the axis. Thus this component is stretched by about . Little change along is seen until times of order , and by all curves have dropped significantly. The other components start to increase at smaller times as increases, but have also undergone most of their relaxation by . These results are qualitatively consistent with models for the linear response of polymers.30, 20 They predict that stretch relaxes with a distribution of relaxation times that correspond to different segment lengths along the chain. The longest relaxation time, , is associated with the end-end scale.
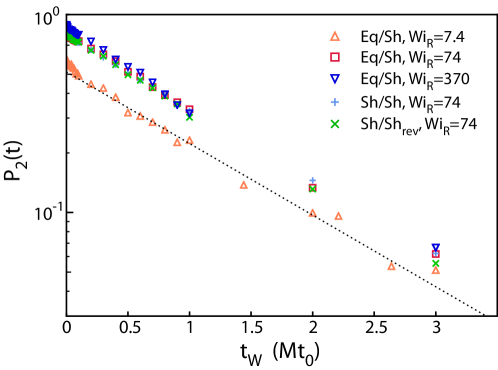
The same models for linear response predict a simple exponential relaxation of the nematic order parameter on the end-end scale: . Figure 5 shows that our data follow this behavior even though chains are very far from equilibrium. Results for different start with different degrees of order, but plots of against time have a common slope that is consistent with the equilibrium .
.
*
 .
.
One way of quantifying interdiffusion is through the evolution of the concentration profile. Molecules starting on the top of the system are labelled type 1 and molecules on the bottom are type 2. They have number density and , respectively. The concentration profile
| (2) |
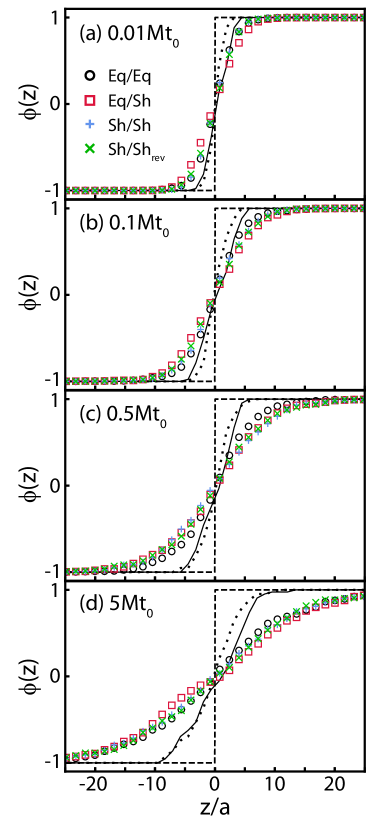
starts as a step function from -1 to +1 at and broadens as molecules diffuse. Figure 6 shows for at times ranging from to , when memory of alignment has been lost. In each case, the top particles were in a sheared slab. These times are chosen because they represent important stages in the evolution of the mechanical strength of welds (see below).
All concentration profiles in Fig. 6 are approximately antisymmetric, . This symmetry would be broken in the Eq/Sh system if diffusion were faster in aligned systems. Faster diffusion would also lead to a more rapid broadening of the concentration profiles in sheared systems, but differences between the four types of starting state remain small over the entire range of times. The largest differences are observed at intermediate times where the Eq/Eq profile is narrower, suggesting slower interdiffusion. While this would be consistent with entanglement loss accelerating interdiffusion for aligned systems, closer examination shows that the difference comes from changes in interface roughness. As highly stretched chains relax their length along , they expand along . Local fluctuations deform the interface and the resulting roughness broadens the concentration profile without mixing molecules that started on different sides of the interface.
To determine variations in the local interface height, concentration profiles were calculated within square bins of width in the plane. The height where was determined by fitting to . If the local concentration profile remained a step function, but varied, the concentration profile would broaden to where is the probability of finding a local interface height . Black dotted and solid lines in Fig. 6 show for the Eq/Eq and Eq/Sh () systems, respectively. At early times, is only slightly narrower than , indicating that surface roughness plays an important role. The larger width of for Eq/Sh than Eq/Eq systems, shows the corresponding broadening of comes from roughness rather than faster diffusion. By , is much narrower than for all systems, implying that diffusion dominates over roughness
.
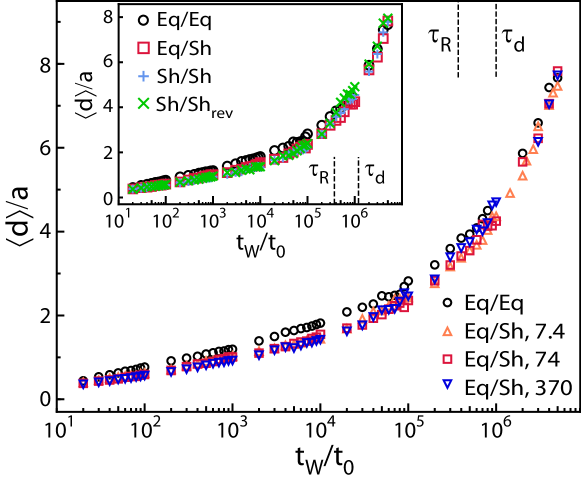
Past experimental and theoretical work on unaligned systems showed a correlation between interfacial strength and the distance monomers from one side have moved into the other melt.1, 16, 17, 18. The interdiffusion distance is defined as for type 1 monomers. The definition is analogous for type 2 monomers, with the integration limits changed to . The roughness identified above will contribute to , but does not reflect mixing of species that leads to mechanical strength. To eliminate roughness, we calculated using as the limit of integration instead of zero. To facilitate comparison with past work,16, 17, 18 was calculated for bins of width , which is comparable to the equilibrium . Decreasing the bin size down to does not change the trends noted below. There is just a slow but steady decrease in of only that is nearly independent of configuration and time at .
Figure 7 shows as a function of welding time for the different systems analyzed. All of the sheared systems show similar behavior, with little dependence on shear rate or configuration (inset). The equilibrium systems show slightly greater penetration at times up to , but the difference is less than . Note that this would imply faster diffusion of equilibrium systems while entanglement loss has been expected to produce faster diffusion of sheared systems. If is calculated without correcting for roughness, equilibrium systems appear to interdiffuse by about the same amount as systems, and by up to less than other systems. For all ways of measuring , variations with configuration and remain less than a molecular diameter ( nm) and much less than the interface roughness.
.
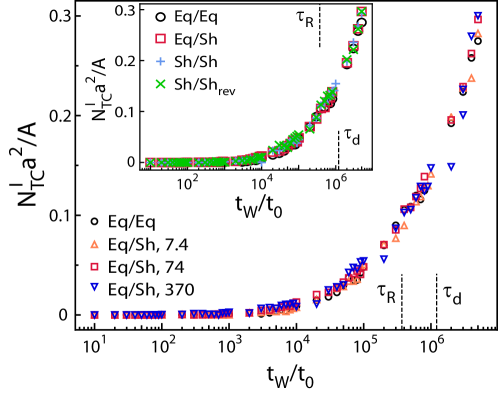
While is a measure of interdiffusion, past work shows that mechanical strength is most directly correlated with the formation of entanglements between chains that start on opposite sides of the interface.1, 16, 17, 18. Ge et al. 16, 17, 18 applied PPA to welded states and determined the number of interfacial TCs, , by counting contacts between the primitive paths of chains that started on different sides of the interface. The shear strength and fracture energy of welds both rose linearly with the areal density of these interfacial entanglements until they saturated at the bulk strength. This metric is independent of and thus not affected by interfacial roughness.
Figure 8 shows the areal density of interfacial entanglements from PPA as a function of time for different initial conditions. The results for all starting states and shear rates are the same within statistical fluctuations. This supports the conclusion that alignment does not affect the dynamics of mixing between molecules from different sides of the interface. The broadening of the concentration profile for sheared systems at intermediate times is just a roughening of the interface that may have a minor effect on shear strength,40 but does not weld surfaces together. Note that the most rapid change in Fig. 4 is contraction of chain ends along the direction, which does not drive diffusion. The smaller expansion along is accommodated by fluctuations in the interface. It does not tend to push chain ends across the interface to form new entanglements.
Plotting the density of interfacial entanglements against produces results very similar to Fig. 5 of Ge et al.16 There is little increase in until exceeds . This indicates that a minimum interpenetration is needed to form entanglements. For larger , the areal density of entanglements rises linearly with . The slope is consistent with that in Fig. 5 of Ge et al.16 for all rates and configurations.
3.3 Shear Strength
The previous section showed that chain alignment had little effect on the rate of interdiffusion or entanglement formation. We now show that initial states with different alignment still exhibit markedly different mechanical properties.
The shear strength of welds is normally characterized by the maximum shear stress the interface can withstand before failure, , which is measured experimentally with a lap joint shear test.1 The variation of shear stress with shear strain for simulations with different and initial configurations is shown in Figure 9. As noted above, shear was applied along the interface and perpendicular to the printing direction to mimic tear tests of walls printed with FFF.6
Results for unaligned Eq/Eq systems (Fig. 9(a)) are consistent with past work.16, 17, 18 Curves for all weld times show the same initial yield stress () and strain hardening. As increases, strain hardening extends to larger strains and higher stresses. In this regime, the interface fails by chain pullout: The ends of chains that have diffused across the interface are pulled back to their starting side. For sufficiently long weld times, , the entire curve becomes independent of time and consistent with bulk behavior. In this regime, chains have diffused across the interface and entangled with other chains. They break rather than being pulled back across the interface. As in past work, bulk strength is achieved at times where and .
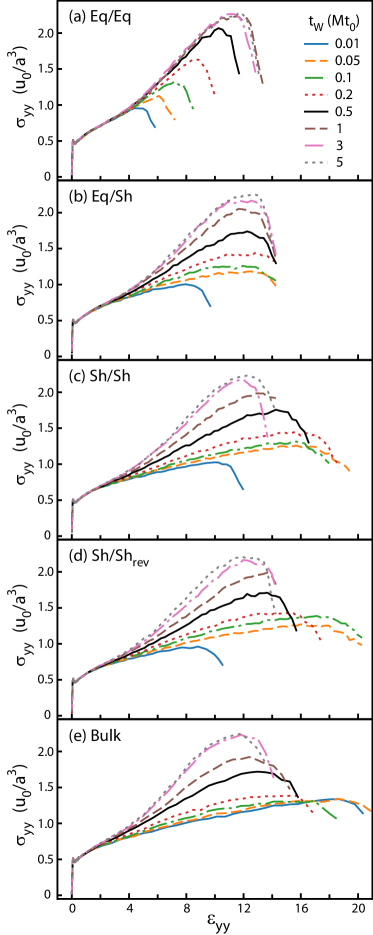
Aligned systems show somewhat different behavior. The most striking change is an increase in the strain to failure at small . This reflects a more gradual strain hardening rather than an increase in maximum stress. During hardening, chains that are originally aligned along the direction are reoriented along . Because the chains are already stretched, this reorientation requires a relatively large strain. The Eq/Sh system accommodates less strain than the other sheared systems because the unaligned half of the system does not deform as easily. The ability of sheared systems to reorient is insensitive to the relative alignment of the two slabs (Sh/Sh or Sh/Shrev).
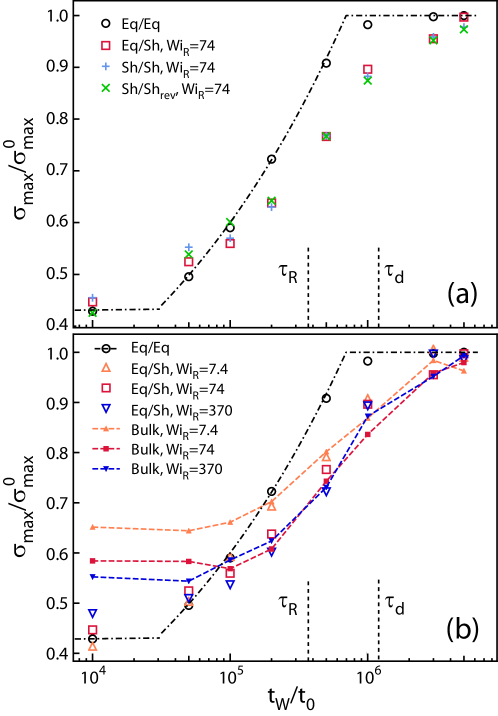
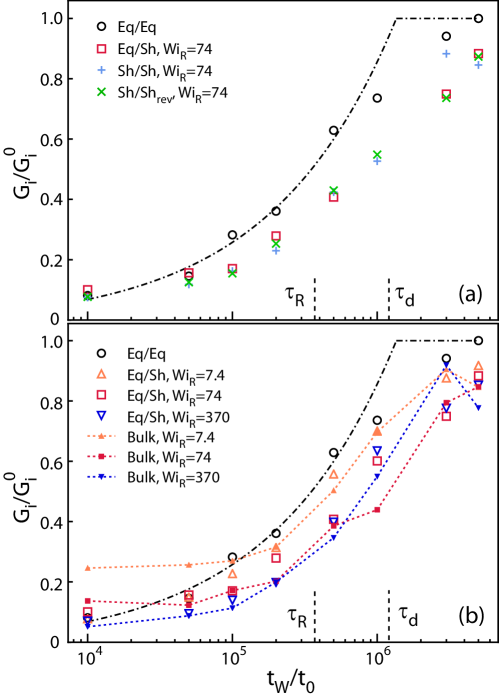
Alignment also changes the peak shear stress and the time to reach it. Note that has saturated by for the Eq/Eq systems in Fig. 9 but not until for sheared systems. Changes in the rate of strengthening are more clearly seen in Fig. 10, which shows the time dependence of normalized by its bulk unaligned value . As in past simulations17 and experiments,1 Eq/Eq results can be fit to a power law rise at intermediate times, followed by saturation at bulk strength. This power law is motivated by models of reptation that predict between and and assumes that the strength scales with . In both experiment and simulations,17, 1 there is a plateau in at early times (). As noted above there is a minimum required to form entanglements16 and the power law behavior only applies once this threshold is passed.
Fig. 10(a) shows that the strengths of all sheared configurations grow at a similar rate. They appear slightly stronger than Eq/Eq systems at very early times, perhaps because of the extra surface roughness.40 For the strength of sheared systems grows more slowly and is just reaching at the longest weld times. Fig. 10(b) shows samples aligned at all three exhibit similar behavior. The depression of increases with but the time to achieve bulk equilibrium strain is always about .
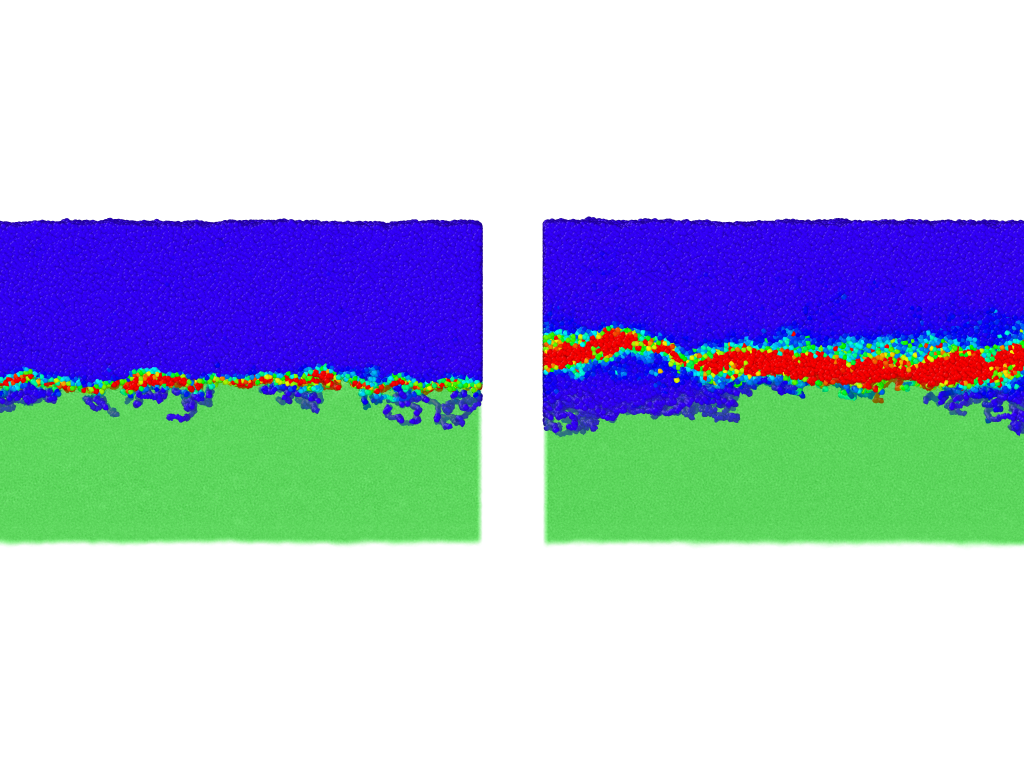
The slow rise in for sheared systems is surprising given that they show the same rate of growth in . The explanation is that the strength of sheared systems is not limited by the interfacial strength of welds, but by the alignment of adjacent bulk regions. To demonstrate this we show results for bulk systems without an interface. The stress strain curves in Fig. 9(e) are very similar to those for the sheared systems in panels (c) and (d). The only statistically significant difference is that the bulk system has a larger yield strain and stress at the earliest times. Dashed lines in Fig. 10(b) show that the time dependent growth in for bulk aligned systems is similar to that for welded systems aligned at the same . The only statistically significant difference is at where the bulk system is stronger. As illustrated in Fig. 11, direct examination of welded systems confirms that plastic deformation is localized in sheared regions and not at the welded interface.
3.4 Fracture Energy
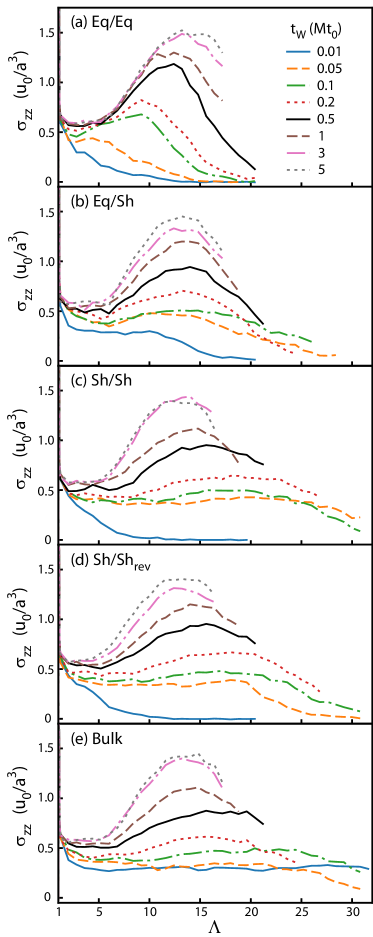
Figure 12 shows the variation of tensile stress with the expansion of the system defined as the ratio of the spacing between rigid walls to the initial undeformed value. Once again, the Eq/Eq results are consistent with past work.18 All systems show an initial peak of around where cavities begin to form. This peak occurs at very near unity and lies essentially on the vertical axis of the figure.
For the shortest , drops monotonically from this peak value. In such cases, the fracture energy per unit area can be obtained by integrating the stress times the displacement of walls. For longer times a plateau becomes visible for up to about 7. This plateau is the signature of craze formation, where the initial dense polymer is converted into a network of oriented fibrils and voids.33, 32 For the interface fails through chain pullout after only part of the volume has been converted into a craze. At larger the entire volume is converted to a craze by about . The stress needed to deform the craze grows with until it fails. Chain pullout is observed for small times but for chains break and the strength approaches the bulk value.
Figures 12 (b-e) shows how alignment affects craze formation. Once again, alignment increases the deformation required to produce failure, and the increase is larger when both slabs are aligned and contribute to the deformation. In addition, results for Sh/Sh and Sh/Shrev systems are not significantly different. Figure 12(e) shows that these changes predominantly reflect the response of oriented bulk regions rather than the interface. The main difference between bulk and welded systems is at the very earliest time where the welded systems do not show a plateau while the bulk system has the longest plateau. At all longer times the location of failure in welded systems moves from the interface to oriented bulk regions.
Following past work,24, 18 Brown’s model41 can be used to determine the fracture energy of systems that craze. Brown approximates the fracture as crack propagation through an elastic crazed region between rigid uncrazed regions. One obtains:
| (3) |
where reflects anisotropy in the elastic properties of the craze, is the plateau stress seen in Fig. 12, is the peak tensile stress, is the distance between craze fibrils and is the stretch of regions as they are deformed into a craze. As in Ge et al.,18 we use typical values of , and to calculate . The observed value of increases slightly with alignment, but this has little effect on the toughness (%). Estimates of changes in and with the alignment of the initial state are also small.
Figure 13(a) shows the tensile fracture energy for systems at equilibrium or sheared at . For all systems, rises by an order of magnitude before saturating at the bulk value. In experiments, the initial rise is often fit to a power law . A similar fit to Eq/Eq results is shown by a dashed line. All sheared systems show nearly the same behavior and rise more slowly than equilibrium systems. Even at the longest times, they have not reached bulk strength. Figure 13(b) shows that strength reduction rises as increases.
As for , the reduction in with increasing alignment is due to a decrease in bulk strength rather than weaker interfacial welds. Small symbols connected by lined in Fig. 13(b) show the fracture energy of bulk systems without any interface. For each these curves lie slightly above welded systems at short times () but are statistically equivalent to results for welded systems at long times. Direct evaluation of molecular conformations confirms that the craze is confined to the sheared portion of deforming welded systems.
4 Discussion and Conclusions
The results presented above have important implications for optimizing FFF protocols. First, they imply that the rate of diffusion to form welds and the time for molecules to relax from stretched aligned states are described by equilibrium relaxation times from tube theory. The same result is found in our ongoing bulk simulations of chains with different lengths and entanglement lengths, and similar results have been found for elongational flow.39 Past experimental studies have extracted an effective welding time from the thermal history of weld lines and time-temperature superposition.6, 7, 8, 9 Figures 4 and 5 imply that this analysis need not include any dependence of relaxation times on alignment. They also provide further evidence that improved models are needed for describing entanglements and their evolution in highly aligned states. 12, 13, 14, 15, 7, 8, 39
The fact that the rate of interfacial entanglement formation is independent of alignment (Fig. 8), implies that the rate at which welds strengthen should also be described by equilibrium dynamics. Welds should then be as strong as isotropic bulk material after molecules have diffused along their tube by only a couple of entanglement lengths.16, 17, 18 However, fabricated parts are only as strong as the weakest link and alignment reduces the resistance of bulk material to shear and fracture. The strength of initially aligned material near the weld grows until several times , the time needed to diffuse out of the entire length of the tube. As predicted by tube theory, molecular orientation relaxes exponentially with a time and strength only saturates when almost all orientation is lost. This criterion can be incorporated in future theories for the evolution of order and strength in FFF. The immediate implication is that to achieve bulk strength printing parameters should be adjusted to prevent significant alignment or the welding time must exceed several so that any initial alignment is lost.
The effect of alignment on mechanical strength has been studied in bulk glassy polymers with both experiment and simulation.42, 33, 43, 44, 45 The resistance to extension along the chain backbone is increased, while the transverse directions become weaker. Unfortunately, these weaker directions are involved in tensile fracture at FFF welds and shear transverse to the print direction. Parts may be stronger along the print direction, but this is not as important to performance. Deposition produces the greatest alignment at the weld interface, and parts are generally thinnest at the weld lines. These factors combine to localize failure near welds even if the few nanometers where molecules have welded by interdiffusion is not weaker than the bulk.
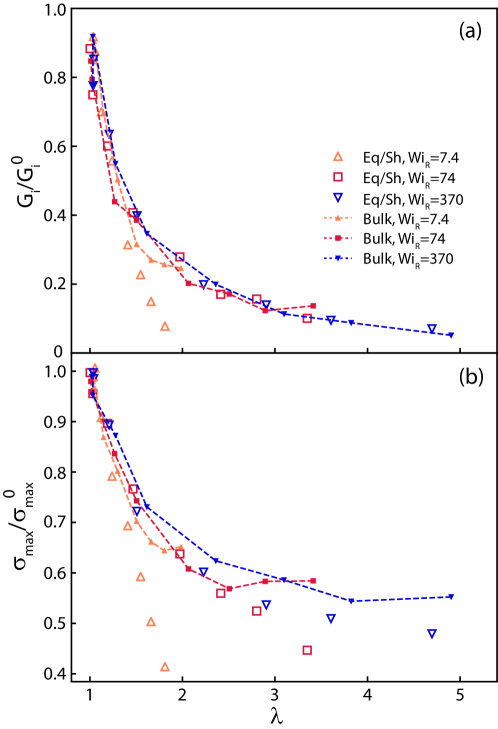
At macroscopic scales, orientation is often measured with birefringence, an anisotropy in the index of refraction that correlates with the orientation and stretch of individual molecules. Plots of the tensile fracture energy of glassy polymers such as PMMA, PS and PC against birefringence show the fracture energy for crack propagation along the alignment axis drops with increasing orientation and then saturates.44, 45 Figure 14 shows and plotted against the end-end stretch . Bulk systems (dashed lines) follow a common curve that is qualitatively similar to experiments. Strength drops rapidly with increasing orientation and then saturates. Welded systems can not be stronger than the corresponding bulk and thus lie below the dashed lines. At very early times the weld is weak and failure occurs there. At longer times the weld is irrelevant and and follow the bulk curves.
The coarse-grained model used here has successfully described general features of the mechanical response of glassy polymers and their connection to entanglements. It is expected to capture the behavior of commonly used materials such as polycarbonate (PC) and poly-lactic acid (PLA) that remain amorphous under most printing conditions. Chemically detailed models are needed to make quantitative predictions of strength, but are difficult to use on the time scales needed for highly entangled polymers to interdiffuse.46 Different mechanisms may be important for semicrystalline polymers or polymers with multiple monomers, such as acrylonitrile butadiene styrene (ABS). Rather than being constrained by entanglements, the relative motion of chains may be constrained by crystal order or segregation of monomer species. Both effects will be interesting topics for future study.
This material is based upon work supported by the National Science Foundation under Grant No. NSF DMREF-90069795 and by Fellowship 235249/2014-9 from the National Council for Scientific and Tecnological Development (CNPq) of Brazil. We thank Martin Kroger for supplying the Z1 code, and C. McIlroy, K. Migler, T. D. Nguyen, T. C. O’Connor, P. Olmsted, and J. Seppala for useful discussions. Simulations were performed at the Maryland Advanced Research Computing Center.
References
- Wool 1994 Wool, R. P. Polymer Interfaces: Structure and Strength; Hanser: Munich, 1994
- Jones and Richards 1999 Jones, R. A. L.; Richards, R. W. Polymers at Surfaces and Interfaces; Cambridge University Press: Cambridge, 1999; DOI: 10.1017/CBO9780511623196
- Overeijnder 1983 Overeijnder, H. Why is a Compression Ratio Needed in a PVC Die-head? Plastics and Rubber Processing and Applications 1983, 3, 33–35
- Chua et al. 2010 Chua, C. K.; Leong, K. F.; Lim, C. S. Rapid Prototyping: Principles and Applications, 3rd ed.; World Scientific, 2010; DOI: 10.1142/6665
- N. Turner et al. 2014 N. Turner, B.; Strong, R.; A. Gold, S. A review of melt extrusion additive manufacturing processes: I. Process design and modeling. Rapid Prototyping Journal 2014, 20, 192–204
- Seppala et al. 2017 Seppala, J. E.; Han, S. H.; Hillgartner, K. E.; Davis, C. S.; Migler, K. B. Weld formation during material extrusion additive manufacturing. Soft Matter 2017, 13, 6761–6769, DOI: 10.1039/C7SM00950J
- McIlroy and Olmsted 2017 McIlroy, C.; Olmsted, P. D. Deformation of an amorphous polymer during the fused-filament-fabrication method for additive manufacturing. Journal of Rheology 2017, 61, 379–397, DOI: 10.1122/1.4976839
- McIlroy and Olmsted 2017 McIlroy, C.; Olmsted, P. Disentanglement effects on welding behaviour of polymer melts during the fused-filament-fabrication method for additive manufacturing. Polymer 2017, 123, 376–391, DOI: 10.1016/j.polymer.2017.06.051
- Coogan and Kazmer 2020 Coogan, T. J.; Kazmer, D. O. Prediction of interlayer strength in material extrusion additive manufacturing. Additive Manufacturing 2020, 35, 101368, DOI: 10.1016/j.addma.2020.101368
- Mackay 2018 Mackay, M. E. The importance of rheological behavior in the additive manufacturing technique material extrusion. Journal of Rheology 2018, 62, 1549–1561, DOI: 10.1122/1.5037687
- Coogan and Kazmer 2017 Coogan, T. J.; Kazmer, D. O. Bond and part strength in fused deposition modeling. Rapid Prototyping Journal 2017, 23, 414–422, DOI: 10.1108/RPJ-03-2016-0050
- Ianniruberto and Marrucci 2014 Ianniruberto, G.; Marrucci, G. Convective constraint release (CCR) revisited. Journal of Rheology 2014, 58, 89, DOI: 10.1122/1.4843957
- Baig et al. 2010 Baig, C.; Mavrantzas, V. G.; Kröger, M. Flow Effects on Melt Structure and Entanglement Network of Linear Polymers: Results from a Nonequilibrium Molecular Dynamics Simulation Study of a Polyethylene Melt in Steady Shear. Macromolecules 2010, 43, 6886–6902, DOI: 10.1021/ma100826u
- Milner et al. 2001 Milner, S. T.; McLeish, T. C. B.; Likhtman, A. E. Microscopic theory of convective constraint release. Journal of Rheology 2001, 45, 539–563, DOI: 10.1122/1.1349122
- Nafar Sefiddashti et al. 2019 Nafar Sefiddashti, M.; Edwards, B.; Khomami, B. Individual Molecular Dynamics of an Entangled Polyethylene Melt Undergoing Steady Shear Flow: Steady-State and Transient Dynamics. Polymers 2019, 11, 476, DOI: 10.3390/polym11030476
- Ge et al. 2013 Ge, T.; Grest, G. S.; Robbins, M. O. Structure and Strength at Immiscible Polymer Interfaces. ACS Macro Letters 2013, 2, 882–886, DOI: 10.1021/mz400407m
- Ge et al. 2013 Ge, T.; Pierce, F.; Perahia, D.; Grest, G. S.; Robbins, M. O. Molecular Dynamics Simulations of Polymer Welding: Strength from Interfacial Entanglements. Physical Review Letters 2013, 110, DOI: 10.1103/PhysRevLett.110.098301
- Ge et al. 2014 Ge, T.; Grest, G. S.; Robbins, M. O. Tensile Fracture of Welded Polymer Interfaces: Miscibility, Entanglements, and Crazing. Macromolecules 2014, 47, 6982–6989, DOI: 10.1021/ma501473q
- Ge et al. 2014 Ge, T.; Robbins, M. O.; Perahia, D.; Grest, G. S. Healing of polymer interfaces: Interfacial dynamics, entanglements, and strength. Physical Review E 2014, 90, DOI: 10.1103/PhysRevE.90.012602
- Doi et al. 1988 Doi, M.; Edwards, S. F.; Edwards, S. F. The Theory of Polymer Dynamics; Clarendon Press, 1988
- Plimpton 1995 Plimpton, S. Fast Parallel Algorithms for Short-Range Molecular Dynamics. Journal of Computational Physics 1995, 117, 1–19
- Kremer and Grest 1990 Kremer, K.; Grest, G. S. Dynamics of entangled linear polymer melts: A molecular‐dynamics simulation. The Journal of Chemical Physics 1990, 92, 5057–5086, DOI: 10.1063/1.458541
- Everaers et al. 2020 Everaers, R.; Karimi-Varzaneh, H. A.; Fleck, F.; Hojdis, N.; Svaneborg, C. Kremer-Grest Models for Commodity Polymer Melts: Linking Theory, Experiment, and Simulation at the Kuhn Scale. Macromolecules 2020, 53, 1901–1916, DOI: 10.1021/acs.macromol.9b02428
- Rottler et al. 2002 Rottler, J.; Barsky, S.; Robbins, M. O. Cracks and Crazes: On Calculating the Macroscopic Fracture Energy of Glassy Polymers from Molecular Simulations. Physical Review Letters 2002, 89, 148304, DOI: 10.1103/PhysRevLett.89.148304
- Auhl et al. 2003 Auhl, R.; Everaers, R.; Grest, G. S.; Kremer, K.; Plimpton, S. J. Equilibration of long chain polymer melts in computer simulations. The Journal of Chemical Physics 2003, 119, 12718–12728, DOI: 10.1063/1.1628670
- Kirk and Ilg 2017 Kirk, J.; Ilg, P. Chain Dynamics in Polymer Melts at Flat Surfaces. Macromolecules 2017, 50, 3703–3718, DOI: 10.1021/acs.macromol.6b01943
- Kirk et al. 2019 Kirk, J.; Wang, Z.; Ilg, P. Entanglement dynamics at flat surfaces: Investigations using multi-chain molecular dynamics and a single-chain slip-spring model. The Journal of Chemical Physics 2019, 150, 094906, DOI: 10.1063/1.5045301
- Svaneborg and Everaers 2020 Svaneborg, C.; Everaers, R. Characteristic Time and Length Scales in Melts of Kremer–Grest Bead–Spring Polymers with Wormlike Bending Stiffness. Macromolecules 2020, 53, 1917–1941, DOI: 10.1021/acs.macromol.9b02437
- Likhtman and McLeish 2002 Likhtman, A. E.; McLeish, T. C. B. Quantitative theory for linear dynamics of linear entangled polymers. Macromolecules 2002, 35, 6332–6343, DOI: 10.1021/ma0200219
- Larson 1998 Larson, R. G. The Structure and Rheology of Complex Fluids, 1st ed.; Oxford University Press, 1998
- Rottler and Robbins 2003 Rottler, J.; Robbins, M. O. Shear yielding of amorphous glassy solids: Effect of temperature and strain rate. Physical Review E 2003, 68, DOI: 10.1103/PhysRevE.68.011507
- Ward and Sweeny 2012 Ward, I. M.; Sweeny, J. Mechanical Properties of Solid Polymers, 3rd Edition; Wiley: New York, 2012
- Haward and Young 1997 Haward, R. N.; Young, R. J. The Physics of Glassy Polymers; Chapman & Hall: London, 1997
- Everaers et al. 2004 Everaers, R.; Sukumaran, S. K.; Grest, G. S.; Svaneborg, C.; Sivasubramanian, A.; Kremer, K. Rheology and Microscopic Topology of Entangled Polymeric Liquids. Science 2004, 303, 823–826, DOI: 10.1126/science.1091215
- Sukumaran et al. 2005 Sukumaran, S. K.; Grest, G. S.; Kremer, K.; Everaers, R. Identifying the primitive path mesh in entangled polymer liquids. Journal of Polymer Science Part B: Polymer Physics 2005, 43, 917–933, DOI: 10.1002/polb.20384
- Zhou and Larson 2005 Zhou, Q.; Larson, R. G. Primitive Path Identification and Statistics in Molecular Dynamics Simulations of Entangled Polymer Melts. Macromolecules 2005, 38, 5761–5765, DOI: 10.1021/ma050347s
- Kröger 2005 Kröger, M. Shortest multiple disconnected path for the analysis of entanglements in two- and three-dimensional polymeric systems. Computer Physics Communications 2005, 168, 209–232, DOI: 10.1016/j.cpc.2005.01.020
- Hoy et al. 2009 Hoy, R. S.; Foteinopoulou, K.; Kröger, M. Topological analysis of polymeric melts: Chain-length effects and fast-converging estimators for entanglement length. Physical Review E 2009, 80, 031803, DOI: 10.1103/PhysRevE.80.031803
- 39 O’Connor, T. C.; Hopkins, A.; Robbins, M. O. Stress Relaxation in Highly Oriented Melts of Entangled Polymers. Macromolecules 52, 8540–8550, DOI: 10.1021/acs.macromol.9b01161
- 40 Rottler, J.; Robbins, M. O. Molecular simulations of deformation and failure in bonds formed by glassy polymer adhesives. Journal of Adhesion Science and Technology 17, 369–381, DOI: 10.1163/156856103762864679
- Brown 1991 Brown, H. R. A molecular interpretation of the toughness of glassy polymers. Macromolecules 1991, 24, 2752–2756
- 42 Ge, T.; Robbins, M. O. Anisotropic plasticity and chain orientation in polymer glasses. Journal of Polymer Science Part B: Polymer Physics 48, 1473–1482, DOI: 10.1002/polb.22015
- 43 Senden, D. J. A.; Dommelen, J. A. W. v.; Govaert, L. E. Strain hardening and its relation to Bauschinger effects in oriented polymers. Journal of Polymer Science Part B: Polymer Physics 48, 1483–1494, DOI: 10.1002/polb.22056
- Curtis 1971 Curtis, J. W. The effect of pre-orientation on the fracture properties of glassy polymers. Journal of Physics D: Applied Physics 1971, 4, 356–356, DOI: 10.1088/0022-3727/4/2/527
- Miller et al. 1971 Miller, L. E.; Puttick, K. E.; Rider, J. G. Cleavage fracture of oriented poly(vinyl chloride). Journal of Polymer Science Part C: Polymer Symposia 1971, 33, 13–22, DOI: 10.1002/polc.5070330103
- Luchinsky et al. 2020 Luchinsky, D. G.; Hafiychuk, H.; Hafiychuk, V.; Chaki, K.; Nitta, H.; Ozawa, T.; Wheeler, K. R.; Prater, T. J.; McClintock, P. V. E. Welding dynamics in an atomistic model of an amorphous polymer blend with polymer-polymer interface. Journal of Polymer Science 2020, n/a, DOI: 10.1002/pol.20190253