Time-domain variability properties of XTE J1650-500 during its 2001 outburst: Evidence of disc-jet connection
Abstract
Evolution of variability properties of Galactic transient sources is a diagnostic tool to understand various regimes of the accretion flow and its dynamics close to the central black hole. In this paper, we concentrate on the variability properties of the X-ray transient XTE J1650-500 and investigate the evolution of viscous delay, time lag, QPO frequency, and their energy dependence throughout the rising phase as observed by RXTE during its outburst in 2001. Our analysis reveals (1) a delay of days between one day averaged hard (5-12 keV) and soft (1.5-3 keV) photon light-curves as observed by RXTE/ASM; (2) QPOs with high rms values are observed in lower energy (4-8 keV) range; (3) the QPO frequencies and associated time lags were anti-correlated during the initial days of the rising phase, and later on, they were found to be correlated; (4) the time lags of iron line photons with respect to hard and soft photons remained almost constant during the initial days of hard state and the lag magnitude increased during the state transition. We perform comparative studies with outbursts of GX 339-4 and XTE J1550-564. We find the evolution of time lags associated with the QPO characteristics during the outburst – stronger QPOs at low energy, and constant lags of broad Fe-line photons present a unique nature of outburst profile in XTE J1650-500. The possible cause of such variabilities is explained by considering disc-jet geometry closer to the central black hole.
keywords:
black hole physics–accretion, accretion discs –radiation: dynamics – X-rays: binaries – X-rays: individual: XTE J1650-5001 Introduction
Variability properties of Galactic X-ray transients (XRT) in time-scales of milliseconds to days are extensively reported in the literature (Miyamoto et al., 1988; van der Klis et al., 1987; Smith et al., 2002). Earlier, it was assumed that the instabilities in the standard accretion disc might generate the observed variability (Shakura & Sunyaev, 1973; Lightman & Eardley, 1974). However, proper cause of variabilities remained uncertain due to possible non-linear mechanisms of the physical processes which may occur during accretion onto compact objects. This variability study includes the study of Power Density Spectrum (hereafter PDS), the time/phase lag spectrum, and their dependence on the energy of the emergent photons from a region closer to the central engine. From the PDS, one can study the Quasi-Periodic-Oscillations (hereafter QPOs) whose frequencies range from a few mHz to a few hundred Hz (Belloni & Hasinger, 1990; van der Klis, 2004; McClintock & Remillard, 2006) and their dependence on the energy (Belloni et al., 1997; Cui et al., 1999; Rutledge et al., 1999; Kalamkar et al., 2015) of the emergent radiation.
The nature of the evolution of the C-type LFQPOs during the Low Hard State (hereafter LHS) to Intermediate State (IS) at the onset and decay phase of an outburst for several Galactic black hole transients, such as GRO J1655-40, XTE J1550-564, GX 339-4, H1743-322, and persistent source like GRS 1915+105 is very generic irrespective of the mass and inclination and follow a well-established pattern (see, Motta et al. (2015) and references therein). The origin of such LFQPOs remained enigmatic, and several models are proposed to address this issue. Among them, the epicyclic motion of dense matter around the black hole or Neutron stars (Stella & Vietri, 1999; Ingram et al., 2009) stands out as a relativistic effect. The formation of LFQPOs due to the coupling of radiation with the motion of astrophysical fluids around compact objects are also in the literature. In that context, Two Component Advective Flow (TCAF) model proposed by Chakrabarti & Titarchuk (1995) can be employed to understand the LFQPOs and their evolution where the Compton cloud is formed at the CENtrifugal pressure supported BOundary Layer or CENBOL, (see Chakrabarti (1999); Chakrabarti & Manickam (2000)) and at least C-type QPOs are produced by the resonance oscillation due to a rough agreement between the compressional heating and radiative cooling of this Compton cloud as shown by numerical simulations (Molteni et al., 1994; Garain et al., 2014). In TCAF paradigm, the evolution of the QPO frequency was explained by steady radial drifting of the shock front caused by changes in post-shock cooling as the mass accretion rates evolve. From Chakrabarti & Manickam (2000); Vadawale et al. (2001); Rao et al. (2000); Chakrabarti et al. (2005), it was established that the Comptonized photons produce QPOs, and thus they are intrinsically related to Compton cloud size. Heil et al. (2015); Motta et al. (2015) reported the dependence of spectra and the amplitude of the QPOs over the inclination of the source and Schnittman et al. (2006); Ingram & van der Klis (2015) strongly suggested a geometric origin of QPOs. Tagger & Pellat (1999); Cabanac et al. (2010) suggested a connection between the LFQPOs and the variation of luminosity due to the change in the mass accretion rate. Under these circumstances, obtaining a clear picture of the lags associated with the LFQPOs becomes even more critical as it could constrain the geometry of the accretion disc-Compton cloud-jet system.
Time/Phase lags are calculated using cross Fourier spectrum of X-ray light curves of different energy bands, and it is the difference in time of arrival between soft and hard photons (Miyamoto et al., 1988). Hard lag or positive lag implies hard photons arrive later than their softer counterparts, and the opposite is true for soft or negative lag. For Galactic XRTs, the Keplerian disc flux dominates in the keV energy band and harder photons produced via the inverse Compton process (Sunyaev & Titarchuk, 1980) dominate in the energy band above five keV. The time lags were first explained to be due to the Comptonization of soft seed photons by hot electrons, known as ‘Compton reverberation’ (Payne, 1980; Miyamoto et al., 1988) which naturally produces hard time lags. Several models are proposed (Cui, Chen & Zhang, 1999; Nowak et al., 1999; Poutanen & Fabian, 1999) to explain the hard and soft lags associated with QPOs observed in Galactic binary systems. Propagating perturbation model suggested by Böttcher & Liang (1999); Lin et al. (2000) refers to a change in the phase lag sign with the QPO frequency triggered by a propagation direction reversal when the QPO frequency is close to the crossover frequency.
Contrary to QPO evolution which is monotonic in rising or declining phases, time lag evolution starts with maximum value and decreases often switching the sign of the lag. They are observed in black hole transients such as XTE J550-564, GX 339-4, H1743-322 and persistent sources like GRS 1915+105 (Dutta & Chakrabarti, 2016; Dutta, Pal & Chakrabarti, 2018). A generic feature was observed during the rising state of the outburst where time lag started from a maximum value when first QPO was detected, i.e., at the minimum QPO frequency and smoothly decreased to a minimum as the QPO frequency increases to the maximum. Through Monte-Carlo simulations, considering the Comptonization, gravitational bending, and reflection, Chatterjee et al. (2017b) found the anti-correlations between time lag and QPO frequency as a result of the reducing size of the Compton cloud. The opposite feature was observed during the declining state, where time lag starts from a minimum and rises to a maximum as the QPO frequency shows the opposite behaviour.
1.1 XTE J1650-500
In the present paper, we study the time/phase lag behaviour during the only outburst of XTE J1650-500, which took place in 2001. The Galactic X-ray transient, XTE J1650-500 was discovered by the All-Sky Monitor (ASM) on the RXTE (Rossi X-ray Timing Explorer) satellite on 2001 September 5 (Remillard, 2001), and it went through all the usual black hole X-ray spectral states (McClintock & Remillard, 2006) before returning to the quiescent state in June 2002 (Rossi et al., 2004). During this outburst, RXTE observed the source continuously, BeppoSAX observed it three times, and XMM-Newton observed it once. Sanchez-Fernandez et al. (2002) reported that the mass is greater than and inclination is less than . Later, Orosz et al. (2004) reported the orbital inclination to be , and the upper limit of mass of the central black hole is estimated to be . However, Orosz et al. (2004) expressed their concern and suggested the possibility of the source to have much less mass if the optical emission during the quiescent state is dominated by the accretion disc rather than the companion itself. Using XMM-Newton data Miller et al. (2002) observed a broad iron emission line and concluded that the compact star could be an extreme Kerr black hole with a spin parameter . Similar conclusions were drawn from BeppoSAX data by Miniutti et al. (2004), where the effects of light bending are discussed as well. Homan et al. (2003) reported high-frequency quasi-periodic oscillations (HFQPOs) along with sub-harmonics and higher-harmonics. Tomsick et al. (2004) identified a short time-scale (s) X-ray flares and long time-scale oscillations during the declining phase. Kalemci et al. (2003) found the low-frequency QPOs in the range of Hz during the Low Hard State (LHS) of outburst decay phase and suggested a possible strong disc-jet connection in this object.
Variability in the radio frequency domain found during the 2001 outburst was reported in Corbel et al. (2004), where jet emission is also seen in thermal disc dominated state. Rossi et al. (2005) investigated the iron line flux to diagnose the effect of the light-bending scenario in the evolution of XTE J1650-500. Using the BeppoSAX data, Montanari et al. (2009) found that while the source had undergone a transition from the hard state to softer states, the power spectra as a whole drifted towards the higher frequency regime and this behaviour was interpreted as the reduction in the radius of the Compton cloud. More quantitative values on the reduction of Compton cloud ( 23 times of the initial size) was presented in Yan & Wang (2012).
Done & Gierliǹski (2006) observed the iron line having an equivalent width of eV using BeppoSAX data. In their work, the best fit was observed at an inclination less than 30° where relativistic smearing was considered. However, considering outflowing warm absorber, the fit becomes insensitive with the inclination and fits well in the 27°-70° domain. The degeneracy in the inclination angle, originated mostly from spectral fitting, suggests an exploration of all possible origins of broad iron lines; (a) enhanced reflection caused by gravitational bending (Fabian & Vaughan, 2003), (b) jet Comptonization mechanism (Laurent & Titarchuk, 2007). It was also observed that the disc-jet coupling affects the timing properties (Gandhi et al., 2008; Altamirano & Méndez, 2015; Veledina et al., 2017; Reig et al., 2018; Patra et al., 2019) as well as the spectral properties (Merloni et al., 2003; Corbel et al., 2003). In the case of XTE J1650-500, Curran et al. (2012) reported that the jet reprocessed the X-rays emitted from the Compton cloud and the contribution of jet reprocessing can be seen in the optical-NIR flux during the rising phase. It is thus clear that a consensus regarding the emission properties of this source is still missing. Therefore, we examined the rising phase of 2001 outburst, when the maximum contribution from the jet can be seen in the X-ray flux, through the timing properties keeping a combined disc-jet-Compton cloud paradigm in mind.
In this article, we analysed the variability properties such as the time delay, QPOs and phase/time lag during its low/hard state to intermediate states of 2001 outburst. In §2, we outline the time domains, e.g., long-time and for short-time-scales. In §2.1, we present the results of ASM data analysis and compare other outbursts with our current studies. Results obtained from short-time scale variabilities are presented in §2.2. Later, in §3, we discuss the possibility of viscous time-scale causing the delay observed from one day averaged light-curve. We examine the combined effects of the Comptonizing region and outflows in the evolution of QPOs and as well as the associated time lags. Finally, we draw our conclusions in §4.
2 Time-domain Analysis
We divided the timing analysis into two parts. First, we analysed the ASM data and performed the cross-correlation analysis. Later, we examined each observation, PDS, rms, and time lags in various energy bands.
2.1 Long-time-scale
We performed discrete cross-correlation (DCF, Edelson & Krolik (1988)) between the energy bands of All-Sky Monitor (ASM)111http://xte.mit.edu/ASM_lc.html data, and compare the outburst profile of XTE J1650-500 with other outbursts of black hole candidates such as GX 339-4 and XTE J1550-564. We used the interpolated cross-correlation (ICF, Gaskell & Peterson (1987)) and -discrete cross-correlation function (ZDCF222ZDCF: http://www.weizmann.ac.il/particle/tal/research-activities/software, Alexzander (1997)) for comparison. To remove the ambiguity of peak calculations in delay contributed by the skewness of the correlation patterns, we evaluated peak error (see, Gaskell & Peterson (1987) and references therein)
| (1) |
where ‘’ refers to the peak value of the correlation, ‘’ is HWHM and ‘’ is the number of data points. We compared with the bin width ( 1 day) of the ASM data. The larger of these two is considered as the delay error (). Please see Table 1 for details.
| Sources | h | n | ||||
| days | days | days | days | |||
| XTE J1650-500 | 12.25 | 0.82 | 350 | 0.56 | 1.0 | |
| XTE J1650-500 | 10.25 | 0.93 | 350 | 0.42 | 1.0 | |
| GX 339-4 | 24.25 | 0.91 | 180 | 1.38 | 1.4 | |
| GX 339-4 | 20.65 | 1.00 | 180 | 1.08 | 1.1 | |
| XTE J1550-564 | 1.35 | 0.97 | 75 | 0.109 | 1.0 | |
| XTE J1550-564 | 1.35 | 1.00 | 75 | 0.106 | 1.0 |
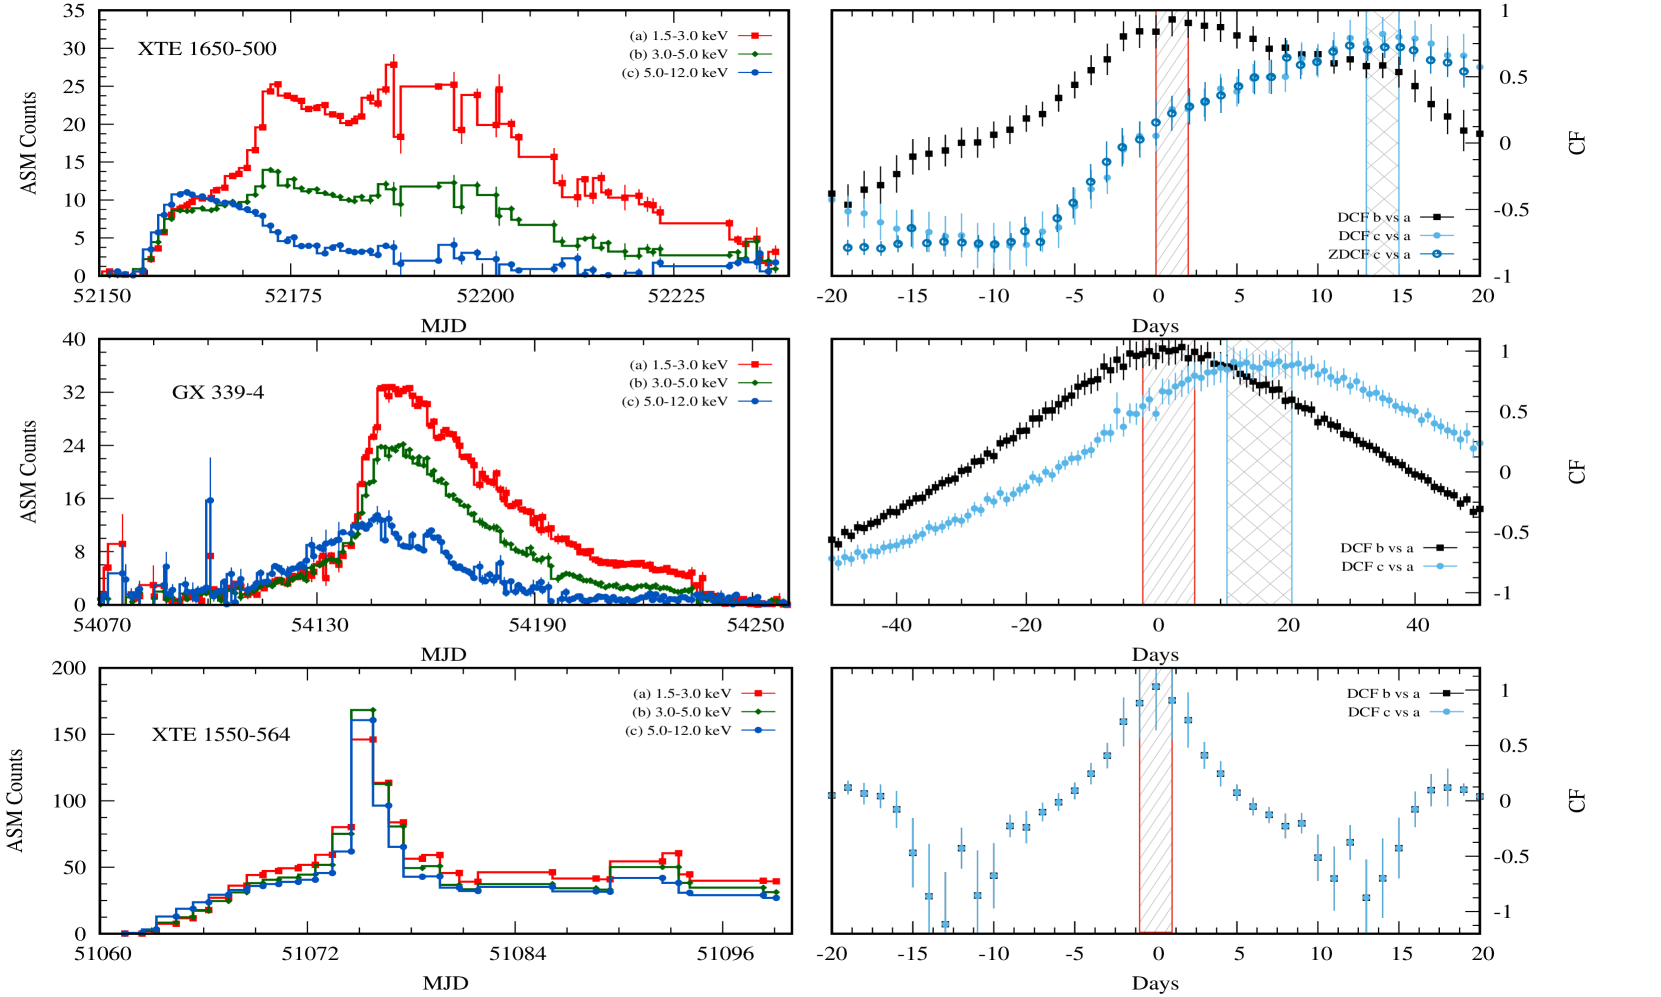
In the top left panel of Fig. 1, a clear distinction in progress between the harder (circle-blue) band and their softer counterpart (square-red) can be observed after MJD 52160. DCF between a and b bands ((a,b), square-black) presented in the top right curve shows no discernible time delay () between them as the zero-delay resides within the error bar. However, DCF between a and c bands (a,c) indicates a delay of days. It is to be noted that (a,c) is also minimum around days. To understand the delay sign, we performed both ICF and ZDCF. ZDCF showed a plateau (blue-circle in the top-right panel) region beyond days. Nevertheless, the positive days delay coincides with what was observed from DCF. Thus, a conclusive long-time-scale delay sign of this source can be predicted from the ASM studies, and there indeed exists a long-time-scale lag between the hard and the soft photons.
Unlike XTE J1650-500, GX 339-4 exhibited several outbursts during the operational period of RXTE. We performed DCF on the ASM light curves for each outburst. No significant long time-scale delay was found in 1997-1998, 2002-2003 or 2004-2005. However, 2006-2007 outburst (middle panels) shows a delay pattern between 5.0-12.0 keV and 1.5-3.0 energy bands.
The two DCF display a remarkable similarity in the case of XTE J1550-564 (lower right panel) during its 1998 outburst. It is also to be noted that the outburst duration of XTE J1550-564 is the lowest as compared to the other two outbursts.
2.2 Short-time-scale
We analysed X-ray transient XTE J1650-500 using the public archival observations from RXTE during the 2001 outburst using HEASARC333http://heasarc.gsfc.nasa.gov/ and restricted our study to observations when QPOs were detected at low frequency ( Hz).
2.2.1 QPO and Fractional power
Using the GHATS444http://astrosat.iucaa.in/~astrosat/GHATS_Package/Home.html software, we analysed Good Xenon, Event, and Single Bit data modes which contain high time-resolution data for timing analysis. In channel band 0-35 (2-15 keV), we generated PDSs of every 16s for each observation. For each observation, we combined them to get an average PDS and subtracted the Poissonian noise contribution Zhang et al. (1995). The PDSs are standardized and converted into squared fractional rms which we used as ‘Power’. The power spectra were then fitted with Lorentzian (2) combinations (Nowak, 2000), using XSPEC version 12.0.
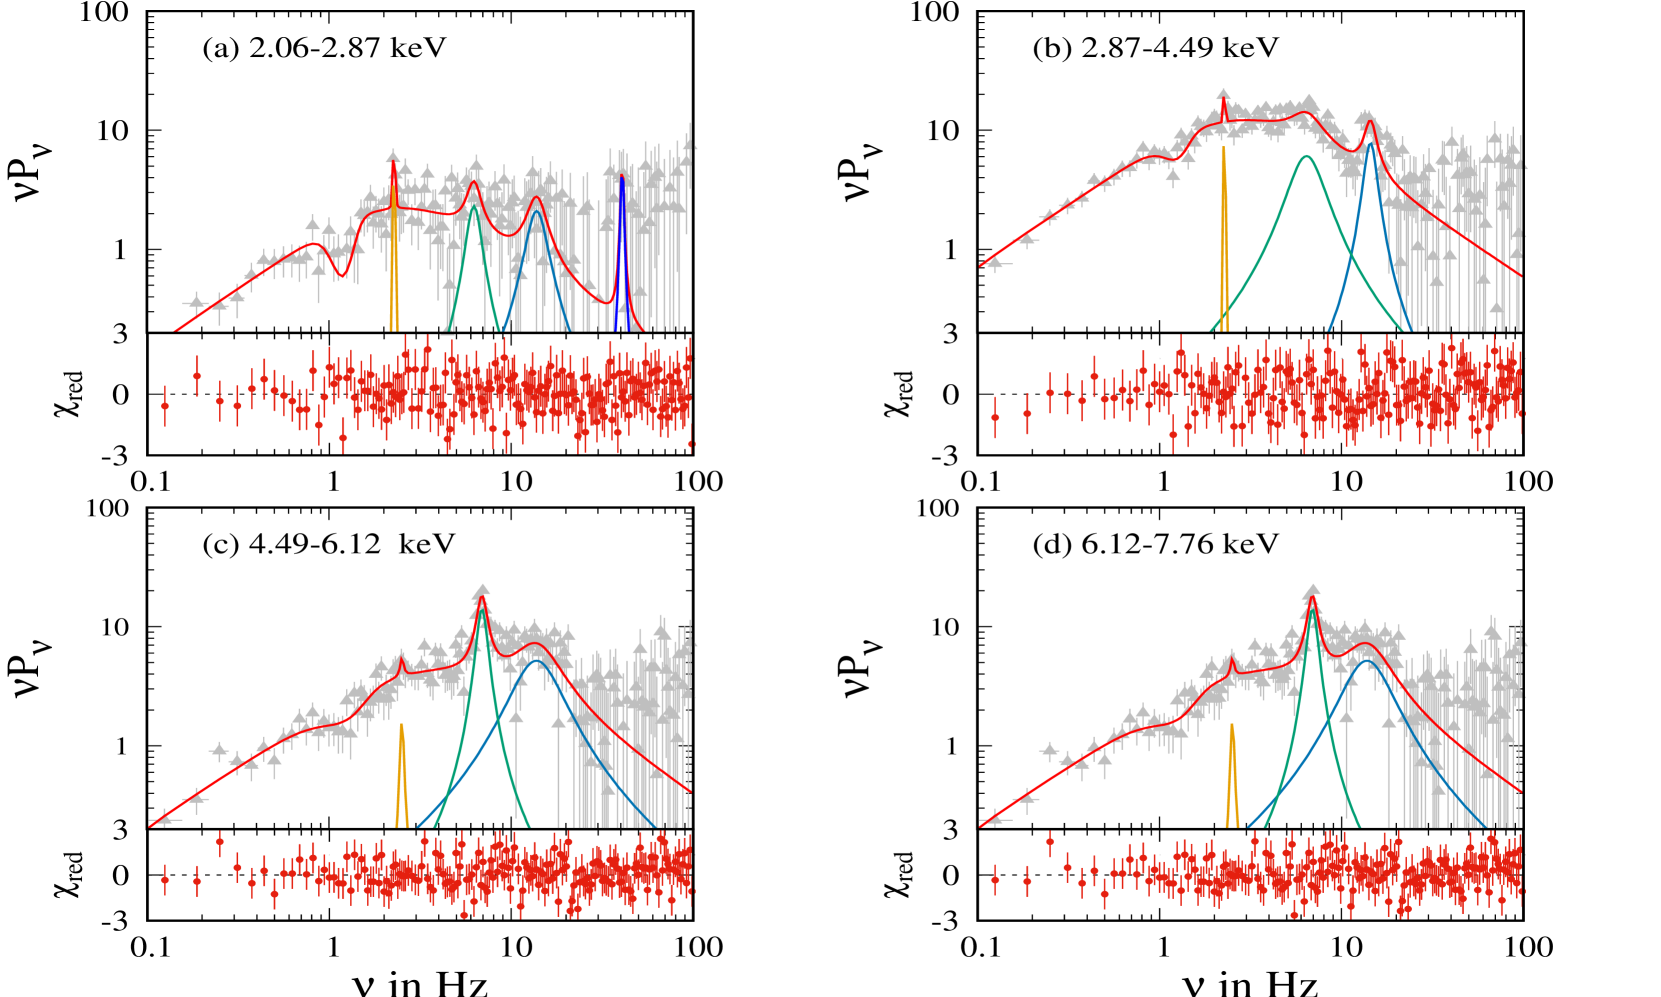
Complex behaviour of power density spectra in XTE J1650-500 (see, 2) has already been reported in Homan et al. (2003). The power density spectra consist of a primary frequency associated with a higher harmonic. Typically, the primary becomes stronger with increasing energy range. In the case of XTE J1650-500, the PDS remains enigmatic as compared to any other outbursting Galactic black hole candidates. Several sub-harmonics and higher harmonics present along with the primary, are reported in Homan et al. (2003). In Fig. 2, we observed the need for an absorption model such as gabs near 1 Hz during fitting where the signature of gabs is more prominent in the lower energy range.
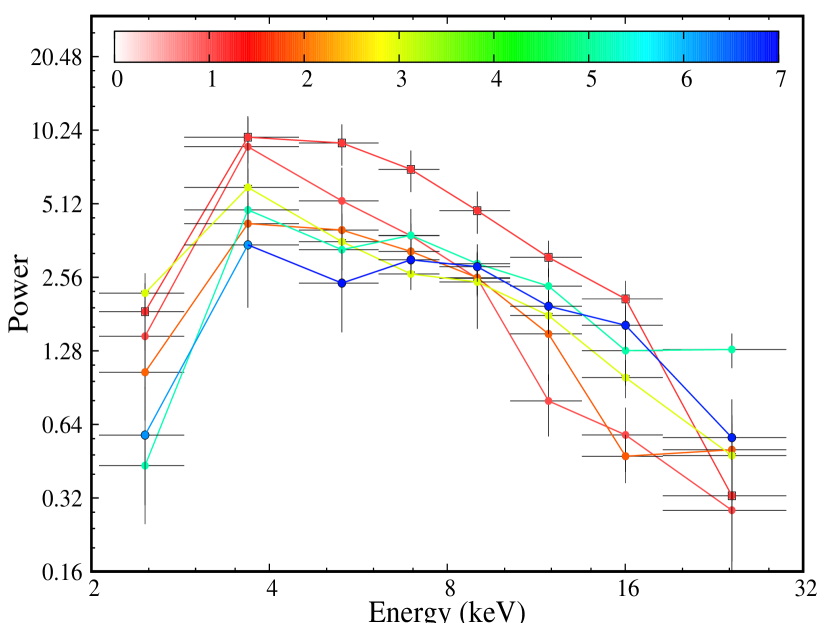
The power variations over various energy bins are presented in Fig. 3. We used EVENT mode data sets where the channel groups used in current studies are the following: 0-6 (2.0-2.87 keV), 7-10 (2.87-4.49 keV), 11-14 (4.49-6.12 keV), 15-18 (6.12-7.76 keV), 19-24 (7.76-10.22 keV), 25-32 (10.22-13.52 keV), 33-44 (13.52-18.52 keV), 45-70 (18.52-29.97 keV).
The power associated with QPOs is maximum at around keV for lower QPO frequency < 3 Hz. The peak of the power is almost flat up to keV for > 3 Hz and starts to decrease after that. Contrary to this, GS 1124-68, GX 339-4 (Belloni et al., 1997), XTE J1550-564 (Cui et al., 1999), GRS 1915+105 (Chakrabarti & Manickam, 2000) exhibited more power in the higher energy (> 9 keV) range. From the colorbar of Fig. 3, we find that the QPO centroid frequency () remains almost constant with respect to the energy bin in each observation. Apart from the peak position of power, the weakening of the QPO power with respect to the is similar to what is noticed in other outbursts.
2.2.2 Time lags associated with QPOs
We calculated the cross-spectrum which is defined as, , where and are the complex Fourier coefficients for the two energy bands at a frequency and is the complex conjugate of (van der Klis et al. 1987). The phase lag between the signals of two different energy bands at Fourier frequency is, = (i.e., is the position angle of in the complex plane). The corresponding time lag is = . An average cross vector is determined by averaging the complex values for every stretch of time. In our analysis, we produced a time lag spectrum for each observation and divided the data into two energy bands, namely, soft (2-5 keV) and hard (5-13 keV). We extracted cross-spectra from 16s intervals, which are then averaged yielding one time-lag spectrum for each observation. Positive time-lag indicates that the harder photons lag the softer photons. Following Reig et al. (2000), we calculated the time lags at the QPOs to obtain a better understanding of the photons emitted from the Compton cloud (please see Chakrabarti & Manickam (2000)).
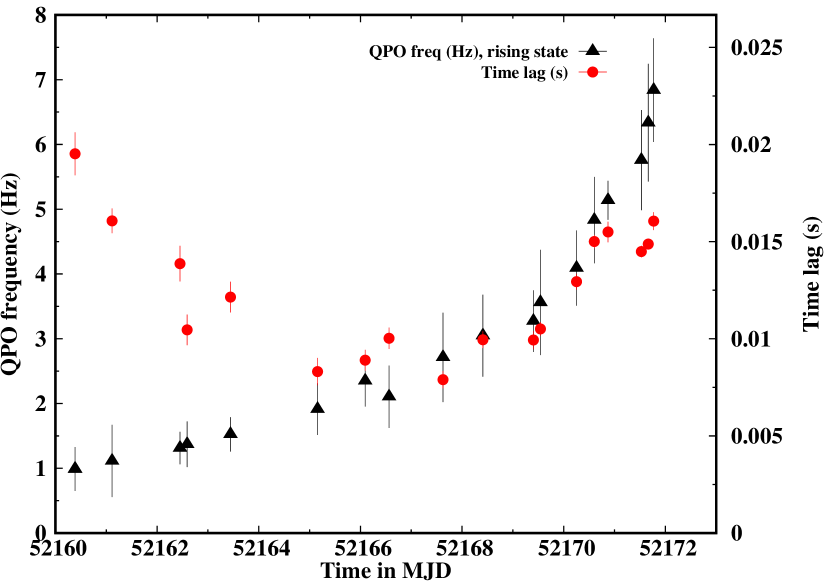
QPO frequency evolution (black-triangle in Fig. 4) during the hard and hard intermediate state is smooth and monotonically increasing as seen in other outbursts. A similar type of QPO evolution can be seen in case of almost every outbursting Galactic black holes and are observed for GX 339-4 and XTE J1550-564, and the feature is generic irrespective of their inclination angle. We fitted the RXTE/pca spectrum using wabs*(diskbb + powerlaw + gaussian) where the photon index () varied from 1.6-2.0 during the rising phase. We find and correlates (using 18 observations during the rising phase) with each other having Pearson correlation coefficient = 0.897, Spearman’s rank () = 0.896, and p-value < .001.
| Sources | No. of Points | PCC | p-value | |
|---|---|---|---|---|
| XTE J1650-500 | 20 | 0.743 | 0.727 | .000175 |
| GX 339-4 | 20 | 0.681 | 0.777 | .000948 |
| XTE J1550-564 | 20 | 0.197 | 0.156 | .407 |
The time lags associated with QPOs (red-circle in Fig. 4) evolve during the rising phase. Up to MJD 52168, the time lag decreases as the QPO frequency increases and showed an anti-correlation between them. But, after MJD 52168, both QPOs and lags exhibit a steady increase in the magnitude until it reaches a saturation value ( sec).
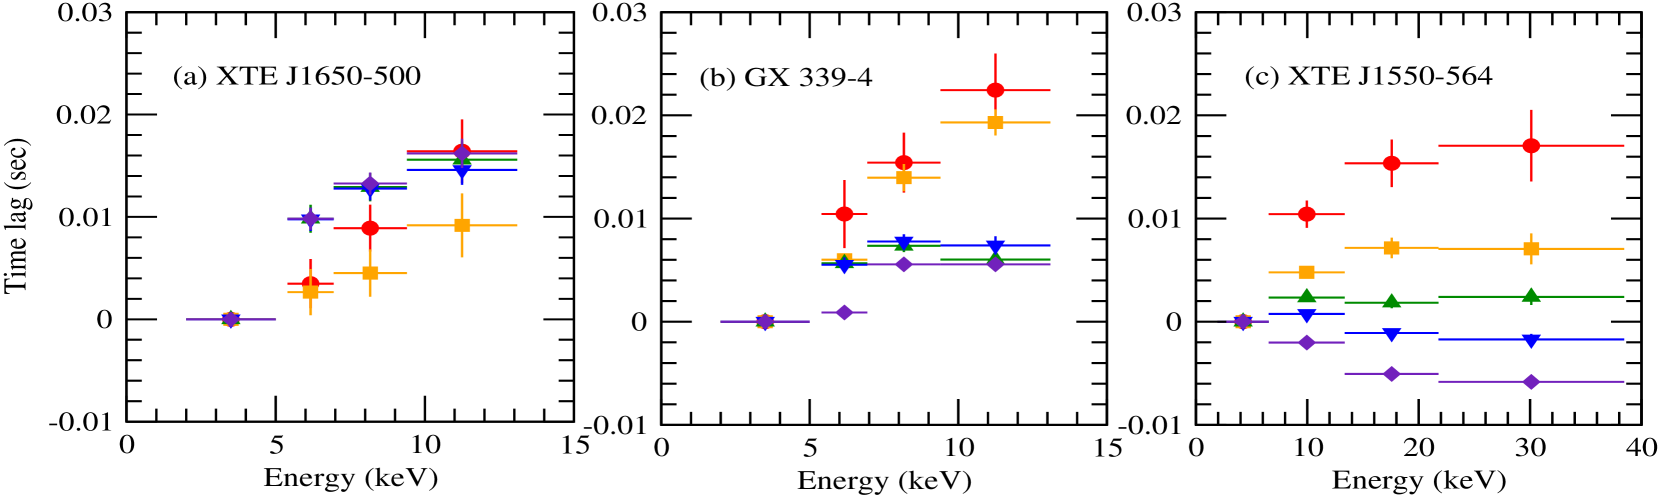
The time lag variation XTE J1650-500 with energy is presented in panel (a) of Fig. 5. Lag spectra are plotted for various QPO centroid frequencies. The hard lag increases with the increase of the energy irrespective of and have the Pearson correlation coefficient (PCC) = 0.743, Spearman’s rank , and p-value < .001. Similar correlation is observed for GX 339-4 (PCC = 0.681, = 0.777, p-value < .001), but, has not been observed for XTE J1550-564 where PCC = 0.197, = 0.156, p-value = .407 (see panel (b) and (c) of Fig. 5). Note that the lags characteristics in higher ( > 3 Hz) QPO frequencies Fig. 5a do not change much.
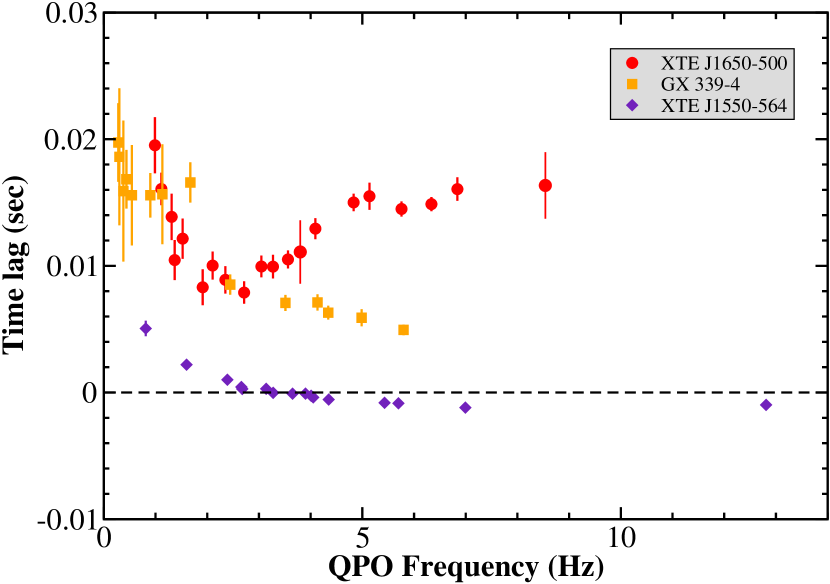
In Fig. 7, we plot this time lag evolution along with those for GX 339-4 (blue) during its 2006-2007 outburst and XTE J1550-564 (red) during its 1998 outburst. GX 339-4 and XTE J1550-564 have reported inclinations of around and respectively. According to Rossi et al. (2005), XTE J1650-500 has an approximate inclination of . It is clear that the lag evolution of this source followed a separate trail than the other two.
2.2.3 Time lags associated with iron line
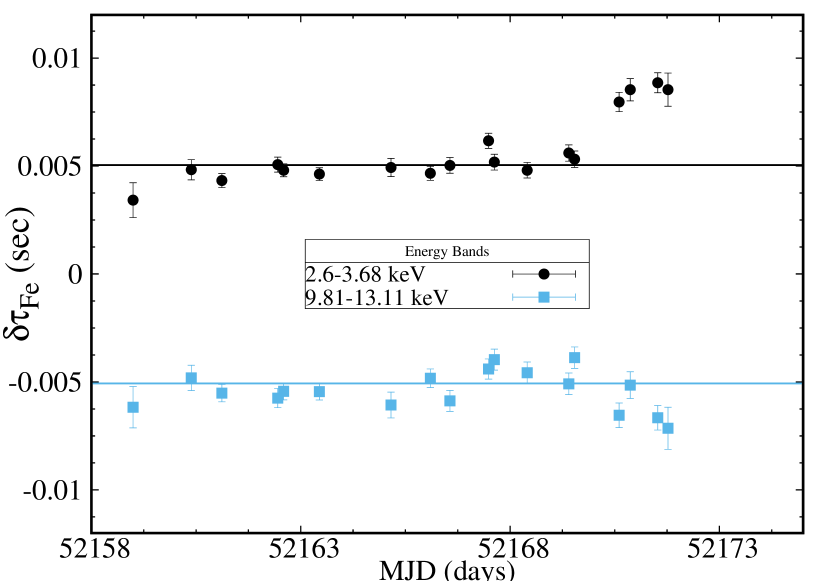
Rossi et al. (2005), found an anti-correlation between the Fe-line flux and the hard X-ray flux during the hard state. They reported a near-constant Fe-line flux which is almost of the power-law flux in the hard state. The reversal of the correlation line between Fe-line flux and power-law flux found in their work strongly suggests the presence of a region where the ionization state of the disc might have changed. Considering the contribution of iron line flux with respect to the power-law flux, we studied the evolution of the iron line lags (in Fig. 6). During the hard state, we examined the lags of iron line with respect to the soft (2.6-3.68 keV, say ) and hard photons (i.e., Comptonized photons, 9.81-13.11 keV, say ). We considered RXTE pca channel 0-8 for the soft and 23-31 channels for Compton up-scattered photons. For the sake of uniformity, we considered channels 13-16, i.e., 5.7-6.94 keV for the Fe-line photons. The line-flux and equivalent width (200-500 eV) remains almost constant throughout the rising phase and declines in the intermediate state (Rossi et al., 2005). To obtain the lag, we integrated the lag spectrum considering the centroid located at 5 Hz with FWHM of 5 Hz, which covers the Hz LFQPO domain. This range also represents the region of high coherence in the time lag spectrum.
From Fig. 6, we find a roughly constant lag with respect to the soft and Comptonized photons up to MJD 52168. During this period, the source evolved substantially, and the QPO frequency went up from 0.98 Hz to Hz. After MJD 52168, the absolute magnitude of lags due to the iron line with respect to the soft and Compton up-scattered photons increases. Thus, the Fe-line photon lags with respect to the soft photon (black-circle) and leads with respect to the Comptonized photon (cyan-square) during the hard to intermediate states. In essence, where s represent the absolute time of arrival of Comptonized, Fe-line and soft photons respectively. The consistency of the Fe-line lag with respect to the soft and Comptonized photon indicates that the region generating the iron line emission remained similar up to MJD 52168 and changes afterwards. Reis et al. (2013) found the reflection fraction () less than unity during MJD 52158 to MJD 52168. Later, increased sharply until the soft intermediate state. After that, the variation of became erratic. It was suggested that the spectra were not light bending dominated during the rising phase.
3 Discussions
In this work, we observed the evolution of time lags associated with the QPOs, the long time ( days) scale delay of hard photons with respect to the soft component, the power associated with QPOs is maximum around lower energy range ( keV) and constant lags of broad Fe-line photons with respect to soft and comptonized photons. We have also shown comparative studies with some other outbursts such as GX 339-4 and XTE J1550-564. Below, we present possible explanations of the timing variabilities which makes this outburst unique.
3.1 days delay
We found a significant delay of softer photons (1.5-3.0 keV) by days (Fig. 1) with respect to harder component (5.0-12.0 keV), though no significant delay was found between 1.5-3.0 keV and 3.0-5.0 keV bands (top right panel Fig. 1) using three techniques of cross-correlation to confirm the delay. Analogous results are observed for GX 339-4 (middle panel of Fig. 1), where even larger ( days) delay was observed between the similar energy bands during its 2006-2007 outburst. However, we did not find any delay patterns in the previous outbursts of GX 339-4. The zero-delay patterns are also seen in XTE J1550-564 during its 1998 outbursts where both of the DCF patterns coincide with each other.
In Two Component Advective Flow (TCAF) paradigm, this days delay could be interpreted to be due to the viscous delay of the Keplerian component, i.e. disc component (Chakrabarti & Titarchuk, 1995; Ghosh & Chakrabarti, 2019) with respect to the hot advective halo component (i.e., lower angular momentum component) which reaches the inner region with almost the free-fall velocity. The Keplerian matter moves inward at viscous time-scale and enhances the cooling rate resulting in the shrinking of the post-shock region of the advective halo behaving here as the Compton cloud. This causes the delay of softer photons. In the case of XTE J1550-564, the overlap suggests that the disc size could be small and the two components of accretion flow moved in simultaneously during its 1998 outburst, much like Cyg X-1 as reported in Smith et al. (2002).
3.2 QPO evolution
From Fig. 4, we see a steady increase in QPO frequency (black-triangle) during the rising phase of the outburst. The fitted curve (Fig. 4) shows that evolves as . According to Two Component Advective Flow model, the size of the Compton cloud is directly related to the QPO frequency (see Chakrabarti & Manickam (2000)) through a relation, , where is the velocity of light, is the Schwarzschild radius, is the location of the centrifugal pressure supported shock of compression ratio . Thus, the Compton cloud size varies roughly as , indicating a sharp reduction of Compton cloud compared to XTE J1550-564 (see, Chakrabarti et al. (2009) for further details). Montanari et al. (2009) associated the drifting of power spectra towards the higher frequency regime in terms of the reduction in the radius of the Compton cloud. Similar results were obtained by Yan & Wang (2012), where the reduction of size was found to be a factor of 23 times during the spectral evolution. They concluded that the separation of mass accretion rate and Compton cloud are the critical drivers for spectral evolution which was predicted earlier by Chakrabarti & Titarchuk (1995) where two accretion rates in two components are assumed to be the cause of the evolution of the QPOs and spectra. The halo rate controls the size and thermodynamical properties of Compton cloud, and disc rate causes the cooling of the Compton cloud resulting in the reduction of its size. Thus, the evolution of QPO frequency can be linked to the reducing size of the Compton cloud and is generic among the majority of the outbursting sources irrespective of their inclination angle.
3.3 Disc-Jet Connection in XTE J1650-500
Evidence of disc-jet connections from the timing properties is observed in various sources (Gandhi et al., 2008; Altamirano & Méndez, 2015; Veledina et al., 2017; Reig et al., 2018). Through simulations, Reig & Kylafis (2019) showed a correlation between time lag- using the jet model. Recently, a suggestion was made that the soft lags (Chatterjee et al., 2019) of XTE J1550-564 during its outburst in 1998 could be jet induced. Following that, Patra et al. (2019) inspected four high inclination GBHs where the presence of soft lags are seen during higher activity in radio fluxes. During the rising phase of XTE J1650-500, Corbel et al. (2004) reported radio activity and Curran et al. (2012) analysed optical-NIR wavelengths where pieces of evidence of X-ray photons reprocessed within the jet medium were observed. Here, we explain a few observational results based on disc-jet connections.
3.3.1 Stronger QPOs at lower energy:
QPO frequency can be directly linked to the size of the Compton cloud while the energy-dependent QPOs and time lags associated with the QPOs capture the information on thermodynamic fluctuations present within the Compton cloud (see Chatterjee et al. (2017b)). We performed energy-dependent QPO power analysis (see Fig 3), where we find the power maxima of low-frequency QPOs reside within 4.0-8.0 keV energy range. The steeper peak was observed for lower frequencies (< 3 Hz) while the higher frequency QPOs (> 3 Hz) exhibited flatter peaks.
Belloni et al. (1997) observed that the higher energy photons (9.3-37.2 keV) are participating more in the QPO formation of GS 1124-68 and GX 339-4 during their hard state. Cui et al. (1999) observed similar behaviour in the energy-dependent QPOs of XTE J1550-564. Chakrabarti & Manickam (2000) found that the power maxima of GRS 1915+105 in the range of keV, which led them to conjecture that the Compton cloud alone takes part in oscillations. Later, this was also established by works of Vadawale et al. (2001); Rao et al. (2000); Chakrabarti et al. (2005). The energy-dependent power spectrum of XTE J1650-500, however, shows a peak at keV range, just above the disc temperature.
Considering the possibility of a low inclination source (see Sanchez-Fernandez et al. (2002), Rossi et al. (2005)), there exists a likelihood where a fraction of emergent Comptonized photons would interact with the electrons in the outflow. During the first few days, when the source is in the hard state, size of the Compton cloud, which serves as the base of the jet, is profuse (see Chakrabarti (1999)). The jets are compact and could down-scatter the emergent photons leading to a shift of the peak of the power towards the lower energy as shown in Fig. 3 for QPOs having < 3 Hz. As the source reaches to intermediate states, the jet becomes stronger and denser (see Jana et al. (2017)) where the possibility of up-scattering along with down-scattering rises. We conclude that this could be a reason for flatter peak in the fractional power with frequencies higher than 3 Hz.
3.3.2 Time lag evolution:
The PCC and between time lag and energy is 0.743 and 0.727 respectively (see §2.2.2 and Table 2 for details) which suggest that the time lags are significantly dependent on the energy. According to Payne (1980), Compton delay would yield larger time lags for harder photons and the lag is directly related to the size of the Compton cloud. Therefore, the current observation implicates that Comptonization is the dominating mechanism for the generation of lag during the rising phase as was also observed in the case of GX 339-4. The correlation dramatically drops (< 0.2) for the high inclination source XTE J1550-564 indicating the importance of other physical mechanisms, such as, reflection, gravitational bending, feedback from the outflows in the resultant lag evolution.
From Fig. 4, we see a systematic decrease in the time lags as QPO centroid frequency increases. However, the pattern reverses for XTE J1550-564 after MJD 52168 and the time lag starts to increase. In TCAF paradigm, the post-shock region (Compton cloud or CENBOL) Comptonizes the soft photons to produce hard photons, and LFQPOs are produced due to the oscillations of the Compton cloud. The QPO frequency, in such cases, is inversely related to the size of the Compton cloud. Thus, the increment in QPO frequency is always expected when the Compton cloud’s size is reduced as the object evolves to a softer state. The shrinking in Compton cloud reduces the delay due to Compton scattering (see Miyamoto et al. (1988)). This is what we observe in the case of GX 339-4 and XTE J1550-564 (see Fig. 7). Monte-Carlo simulations (Chatterjee et al., 2017b) in the presence of Comptonization (Pozdnyakov, Sobol & Sunyaev, 1983), disc reflection and gravitational bending of photons (Chatterjee, Chakrabarti & Ghosh, 2017a; Chatterjee et al., 2018) showed a direct anti-correlation with the size of the Compton cloud as seen in case of GX 339-4.
In the present object, however, the behaviour was similar when QPO frequency was less than 3 Hz, i.e., when the Compton cloud size is large, and the shock was strong with the hot post-shock region. Jets and outflows produced from Compton cloud surface would be driven away from the system which would not contribute to any further up-scattering. As the source evolves towards the intermediate state, the amount of outflow increases (as stated above in §3.3.1), and becomes dense and compact. Thus, the photons originated from Compton cloud could have up-scattered in the sub-sonic region of the jet before reaching to the observer. Therefore, the time lag increases gradually instead of getting reduced with increasing frequency, when the source undergoes the transition from hard to the intermediate state. The time lag saturates with respect to QPO frequency after reaching to the intermediate state. Reig & Kylafis (2019) simulated time lag-photon index () correlation using the jet model where the electron velocity is chosen in the outward direction. Increase of indicates spectral softening, and in general correlates with the (for XTE J1650-500, PCC > 0.85) during rising and declining phase. Thus, the correlation between time lag- after MJD 52168 can be explained by considering the jet medium. However, Reig & Kylafis (2019) calculated the lags in the frequency domain 0.05-5.0 Hz, not around the QPO centroid frequency. Thus, the anti-correlation between time lag-, which is observed for numerous black hole candidates, is absent in their work.
3.3.3 Iron line lag:
As evident from the §2.2.3, iron line photons (5.7-6.94 keV) lag with respect to soft photons (2.6-3.68 keV) and lead with respect to comptonized photons (9.81-13.11 keV) during the rising state. A consistent lag magnitude with respect to both soft and Comptonized photons can be observed up to MJD 52168.
Reis et al. (2013) showed the variation of reflection fraction () and photon index with days (Fig. 3 and 8 respectively) where the less than one was observed during the initial rising phase and started to rise after MJD 52168 where we observed the magnitude of lag corresponding to iron line started to increase with respect to disc (i.e., soft) and Comptonized photons. Considering the arrival delay of the Keplerian disc, as seen in Fig. 1 and a relatively lower value of the reflected fraction, the light bending dominated reflection mechanism (see Miniutti & Fabian (2004)) could be less presiding.
On the other hand, if we consider activities in radio wave (see Corbel et al. (2004)), it remains a possibility that the Compton scattering in the jet medium (see Chakrabarti & Titarchuk (1995) and Laurent & Titarchuk (2007) for details) might have produced the iron line during the hard and hard-intermediate states. In the absence of a Keplerian disc, the accretion was dominated by optically thin halo during the rising phase. In that case, the receding jet could have also contributed to broadening of the iron line.
The variations of QPO power, time lags associated with the QPOs, and lags of iron line with respect to soft and hard photons during the rising phase favours the low inclination scenario (<35°) of XTE J1650-500 (as suggested by Sanchez-Fernandez et al. (2002)) in which case the interception of Comptonized photons in the jet region could maximize before reaching the observer.
4 Conclusions
-
1.
A positive delay of days between 1.5-3.0 keV to 5.0-12.0 keV energy range is found from the ASM data. Various correlation algorithms corroborate this. Although, no definite delay can be ascertained between the energy bands 1.5-3.0 keV to 3.0-5.0 keV band. From a theoretical point of view, this delay of soft photons with respect to their harder counterpart could be a result of viscous delay due to the presence of a large Keplerian disc.
-
2.
The power variation of QPOs with energy are atypical compared to other Galactic black holes. For lower frequency QPOs (i.e., Hz), the power maxima are found just above the so-called disc or thermal part of the spectrum (around keV). But, for QPOs with Hz, the power-energy curve became flatter.
-
3.
The time lags between iron to disc (i.e., soft) and iron to Comptonized photons remain almost constant up to MJD 52168. The absolute value of both the lag increases afterwards as the outburst progresses towards the intermediate state.
-
4.
The time lag evolution pattern follows a unique path where initially the lag magnitude decreases with increasing QPO frequency, i.e., anti-correlates up to Hz. Later on, after MJD 52168, the lag magnitude is correlated with the QPO frequency.
Since Comptonization governed the lag-energy spectra in the entire rising phase of XTE J1650-500, higher lag at higher frequency implies a secondary source of Comptonization becoming dominant since the original Compton cloud was shrinking. We claim that this secondary source is the outflow originated from the Compton cloud. This is possible only if the inclination angle is low. Thus, the variability analysis and comparative studies of time lags lead us to conclude that the outflow or jet could play a major role in controlling the temporal properties of XTE J1650-500 during its outburst in 2001.
Acknowledgements
We acknowledge the anonymous Reviewer for helpful suggestions which improved the clarity of the manuscript. We thank T. Belloni for providing the timing analysis software GHATS. AC acknowledges postdoctoral fellowship of S. N. Bose National Centre for Basic Sciences under the Department of Science and Technology (DST), Govt. of India. BGD acknowledges IUCAA for the Visiting Associateship Programme. PN acknowledges CSIR fellowship for this work. This research has made use of data and/or software provided by the High Energy Astrophysics Science Archive Research Center (HEASARC), which is a service of the Astrophysics Science Division at NASA/GSFC and the High Energy Astrophysics Division of the Smithsonian Astrophysical Observatory.
Data Availability
The data underlying this article are available in the HEASARC archive at https://heasarc.gsfc.nasa.gov.
References
- Alexzander (1997) Alexander T. 1997, ASSL, 218, 163
- Altamirano & Méndez (2015) Altamirano D. & Méndez M., 2015, MNRAS, 449, 4027
- Belloni & Hasinger (1990) Belloni T., & Hasinger G., 1990b, A&A, 230, 103
- Belloni et al. (1997) Belloni T., van der Klis M., Lewin W. H. G., van Paradijs J., Dotani T.,Mitsuda K. & Miyamoto S., 1997, A&A, 322, 857
- Böttcher & Liang (1999) Böttcher M. & Liang E. P., 1999, ApJ, 511, L37
- Cabanac et al. (2010) Cabanac C., Henri G., Petrucci P.-O., Malzac J., Ferreira J. & Belloni T. M., 2010, MNRAS, 404, 738
- Corbel et al. (2003) Corbel S., Nowak M. A., Fender R. P., Tzioumis A. K., Markoff S., 2003, A&A, 400, 1007
- Chakrabarti & Titarchuk (1995) Chakrabarti S. K., Titarchuk L. G., 1995, ApJ, 455, 623
- Chakrabarti (1999) Chakrabarti S. K., 1999, A&A, 351, 185
- Chakrabarti & Manickam (2000) Chakrabarti S. K. & Manickam S., 2000, ApJ, 531, 41
- Chakrabarti et al. (2005) Chakrabarti S. K., Nandi A., Chatterjee A. K., Choudhury A. K. & Chatterjee U., 2005, A&A, 431, 825
- Chakrabarti et al. (2009) Chakrabarti S. K., Dutta B. G., & Pal P. S. 2009, MNRAS, 394, 1463C
- Chatterjee, Chakrabarti & Ghosh (2017a) Chatterjee A., Chakrabarti S. K. & Ghosh H., 2017, MNRAS, 465, 3902
- Chatterjee et al. (2017b) Chatterjee A., Chakrabarti S. K. & Ghosh H., 2017, MNRAS, 472, 1842
- Chatterjee et al. (2018) Chatterjee A., Chakrabarti S. K., Ghosh H. & Garain S., 2018, MNRAS, 478, 3356
- Chatterjee et al. (2019) Chatterjee A., Dutta B. G., Patra P., Chakrabarti S. K. & Nandi P., 2019, Proceedings, 17, 8, doi:10.3390/proceedings2019017008
- Corbel et al. (2004) Corbel S., Fender R. P., Tomsick J. A., Tzioumis A. K., & Tingay S. 2004, ApJ, 617, 1272
- Cui, Chen & Zhang (1999) Cui W., Chen W., & Zhang S. N., 1999, ApJ, 484, 383
- Cui et al. (1999) Cui W., Zhang S. N., Chen W., & Morgan E. H., 1999, ApJ, 512, L43
- Curran et al. (2012) Curran P. A., Chaty S. & Zurita Heras J. A., 2012, A&A, 547, A41
- Done & Gierliǹski (2006) Done C. & Gierliǹski M., 2006, MNRAS, 367, 659
- Dutta & Chakrabarti (2016) Dutta B. G. & Chakrabarti S. K., 2016, ApJ, 828, 101
- Dutta, Pal & Chakrabarti (2018) Dutta B. G., Pal P. S. & Chakrabarti S. K., 2018, MNRAS, 479, 2183
- Edelson & Krolik (1988) Edelson R. A. & Krolik J. H., 1988, ApJ, 333, 646
- Fabian & Vaughan (2003) Fabian A. C. & Vaughan S., 2003, MNRAS, 340, L28
- Gandhi et al. (2008) Gandhi P. et al., 2008, MNRAS, 390, L29-L33
- Garain et al. (2014) Garain S. K., Ghosh H. & Chakrabarti S. K., 2014, 437, 1329
- Gaskell & Peterson (1987) Gaskell C. M. & Peterson B. M., 1987, ApJS, 65, 1
- Ghosh & Chakrabarti (2019) Ghosh & Chakrabarti, 2019, MNRAS, 484, 5802
- Heil et al. (2015) Heil L. M., Uttley P. & Klein-Wolt M., 2015, MNRAS, 448, 3348
- Homan et al. (2003) Homan J., Klein-Wolt M., Rossi S., et al. 2003, ApJ, 586, 1262
- Jana et al. (2017) Jana A., Chakrabarti S. K., Debnath D., 2017, ApJ, 850, 91
- Laurent & Titarchuk (2007) Laurent P. & Titarchuk, L., 2007, ApJ, 656, 1056
- Lightman & Eardley (1974) Lightman A. P. & Eardley D. M., 1974, ApJ, 187, 1
- Lin et al. (2000) Lin D., Smith I. A., Liang E. P. & Böttcher M., 2000, ApJ, 543, L141
- Ingram et al. (2009) Ingram A., Done C., Fragile P. C., 2009, MNRAS, 397, L101
- Ingram & van der Klis (2015) Ingram A. & van der Klis M., 2015, MNRAS, 446, 3516
- Kalamkar et al. (2015) Kalamkar M., van der Klis M., Heil L. & Homan J., 2015, ApJ, 808, 144
- Kalemci et al. (2003) Kalemci E., Tomsick J. A., Rothschild R. E., et al. 2003, ApJ, 586, 419
- McClintock & Remillard (2006) McClintock J. E., & Remillard R. A. 2006, in Compact Stellar X-ray Sources, eds. W. Lewin, & M. van der Klis (Cambridge: Cambridge Univ. Press), 157
- Merloni et al. (2003) Merloni A., Heinz S., di Matteo T., 2003, MNRAS, 345, 1057
- Miyamoto et al. (1988) Miyamoto S., Kitamoto S., Mitsuda K., & Dotani T. 1988, Natur, 336, 450
- Miller et al. (2002) Miller J. M., Fabian A. C., Wijnands R., et al. 2002, ApJ, 570, L69
- Miniutti & Fabian (2004) Miniutti G., & Fabian A. C. 2004, MNRAS, 349, 1435
- Miniutti et al. (2004) Miniutti G., Fabian A. C., & Miller J. M. 2004, MNRAS, 351,466
- Molteni et al. (1994) Molteni D., Lanzafame G. & Chakrabarti S. K., 1994, ApJ, 425, 161
- Montanari et al. (2009) Montanari E., Titarchuk L., & Frontera F. 2009, ApJ, 692, 1597
- Motta et al. (2015) Motta S. E., Casella P., Henze M., Muñoz-Darias T., Sanna A., Fender R. & Belloni T., 2015, MNRAS, 447, 2059
- Nowak et al. (1999) Nowak M. A., Wilms J., Dove J. B., 1999, ApJ, 517, 355
- Nowak (2000) Nowak M. A., 2000, MNRAS, 318, 361
- Orosz et al. (2004) Orosz J. A., McClintock J. E., Remillard R. A., & Corbel, S. 2004, ApJ, 616, 376
- Patra et al. (2019) Patra D., Chatterjee A., Dutta B. G., Chakrabarti S. K. & Nandi P., 2019, ApJ, 886, 137
- Payne (1980) Payne D. G., 1980, ApJ, 237, 951
- Poutanen & Fabian (1999) Poutanen J., Fabian A. C. 1999, MNRAS, 306, L31
- Pozdnyakov, Sobol & Sunyaev (1983) Pozdnyakov A., Sobol I. M., Sunyaev R. A., 1983, Astrophys. Space Sci. Rev., 2, 189
- Rao et al. (2000) Rao A. R., Naik S., Vadawale S. V. & Chakrabarti S. K., 2000, A&A, 360, L25
- Reig et al. (2000) Reig P., Belloni T., van der Klis M., Méndez M., Kylafis N. D. & Ford, E. C, 2000, ApJ, 541, 883
- Reig et al. (2018) Reig P., Kylafis N. D., Papadakis I. E., & Costado M. T. 2018, MNRAS, 473, 4644
- Reig & Kylafis (2019) Reig P. & Kylafis N. D., 2019, A&A, 625, 90
- Reis et al. (2013) Reis R. C., Miller J. M., Reynolds M. T. , Fabian A. C., Walton D. J. et al., 2013, ApJ, 763, 38
- Remillard (2001) Remillard R. 2001, IAU Circ., 7707, 1
- Rossi et al. (2004) Rossi S., Miller J. M., Homan J., & Belloni T. 2004, Memorie della Societa Astronomica Italiana Supplementi, 5, 184
- Rossi et al. (2005) Rossi S., Homan J., Miller J. M., & Belloni T. 2005, MNRAS, 360, 763
- Rutledge et al. (1999) Rutledge R. E. et al., 1999, ApJS, 124, 265
- Sanchez-Fernandez et al. (2002) Sanchez-Fernandez C., Zurita C., Casares J., Castro-Tirado A. J., Bond, I., Brandt, S., & Lund, N. 2002, IAU Circ., 7989, 1
- Schnittman et al. (2006) Schnittman J. D., Homan J. & Miller J. M., 2006, ApJ, 642, 420
- Shakura & Sunyaev (1973) Shakura N. I., & Sunyaev R. A. 1973, A&A, 24, 337
- Smith et al. (2002) Smith D. M., Heindl W. A., Markwardt C. B. & Swank J. H., 2001, ApJ, 554, L41
- Stella & Vietri (1999) Stella L.,& Vietri M., 1999, Phys.Rev.Lett.,82,17
- Sunyaev & Titarchuk (1980) Sunyaev R. A. & Titarchuk L. G., 1980, A&A, 86, 121
- Tagger & Pellat (1999) Tagger M. & Pellat R., 1999, A&A, 349, 1003
- Tetarenko et al., (2019) Tetarenko A. J., Sivakoff G. R., Miller-Jones J. C. A., Bremer M. & Mooley K. P. et al., 2019, MNRAS, 482, 2950
- Tomsick et al. (2004) Tomsick J. A., Kalemci E., & Kaaret P. 2004, ApJ, 601, 439
- Vadawale et al. (2001) Vadawale S. V., Rao A. R. & Chakrabarti S. K., 2001, A&A, 372, 793
- van den Eijnden et al. (2017) van den Eijnden J., Ingram A., Uttley P., Motta S. E., Belloni T. M., Gardenier D. W., 2017, MNRAS, 464, 2643
- van der Klis et al. (1987) van der Klis M., Hasinger G., Stella L., et al. 1987, ApJ, 319, L13
- van der Klis (2004) van der Klis M., arXiv:astro-ph/0410551
- Veledina et al. (2017) Veledina A. et al., 2017, MNRAS, 470, 48
- Yan & Wang (2012) Yan L. H., & Wang J. C. 2012, RAA, 12, 269
- Zhang et al. (1995) Zhang W., Jahoda K., Swank J. H., Morgan E. H. & Giles A. B., 1995, ApJ, 449, 930