Study of production of (anti)deuteron observed in Au+Au collisions at =14.5, 62.4 and 200 GeV
Abstract
Transverse momentum distributions of deuterons and anti-deuterons in Au+Au collisions at =14.5, 62.4 and 200 GeV with different centralities are studied in the framework of the multi-source thermal model. Transverse momentum spectra are conformably and approximately described by the Tsallis distribution. The dependence of parameters (average transverse momenta, effective temperature and entropy index) on event centrality are obtained. It is found that the parameters increase and decrease with increase of the average number of particles involved in collisions, which reveals the transverse excitation degree increases with collision centrality.
pacs:
12.40.Ee, 13.85.-t, 24.10.Pa, 25.75.-qI Introduction
The study of strongly interacting matter at extreme temperatures and densities can be performed by colliding heavy-ion collisions at ultra-relativistic energies Alt1 ; Sun2 ; Wang3 ; Li4 ; Liu5 . The production mechanism of hadrons and nuclei in ultra-relativistic heavy ion collisions deserves more investigation since it may give important message on the quantum chromodynamics (QCD) phase transition from quark-gluon plasma (QGP) to hadron gas (HG) Arsen6 ; Li7 . The RHIC is scheduled to run at the energies which are around the critical energy of phase transition from hadronic matter to QGP Lao8 . The theoretical study of nuclei and anti-nuclei has been undertaken for many years, for example the thermal model and coalescence model Mrowc9 ; Mrowc10 ; Bazak11 ; Liu12 ; Liu13 . In particular, the study of transport phenomena is important for the understanding of many fundamental properties Li14 . The spectra of transverse momentum of particles produced in high energy collisions are of high interest as they provide us an important information of the kinetic freeze-out state of the interacting system Chen15 . At the stage of kinetic freeze-out, the effective temperature is not a real temperature, and it describes the sum of excitation degree of the interacting system and the effect of transverse flow Waqas16 .
In this paper, using the Tsallis distribution Tsallis17 ; Biro18 ; Cleymans19 in the multisource thermal model to simulate the transverse momentum distributions of (anti-)deuterons in Au+Au collisions at RHIC, we compare them with experiment data taken from the STAR Collaboration Adam20 . The main purpose of this work is to extract the information on effective temperature, because it allows us to extract the kinetic freeze-out temperature.
II The model and method
The model used in the present work is the multisource thermal model Liu21 ; Liu22 ; Liu23 . In this model, many emission sources are formed in high-energy nucleus-nucleus collisions. The different distributions can describe the emission sources and particle spectra, such as the Tsallis distribution, the standard (Boltzmann, Fermi-Dirac and Bose-Einstein) distributions, the Tsallis+standard distributions Buyukkilic24 ; Chen25 ; Conroy26 ; Pennini27 ; Teweldeberhan28 ; JConroy29 , the Erlang distribution Liu21 , etc. The Tsallis distribution can be described by two or three standard distribution.
The experimental data of the transverse momentum spectrum of the particles are fitted by using the Tsallis distribution which can describe the temperature fluctuation in a few sources to give an average value. The Tsallis distribution has many function forms Tsallis17 ; Biro18 ; Cleymans19 ; Buyukkilic24 ; Chen25 ; Conroy26 ; Pennini27 ; Teweldeberhan28 ; JConroy29 ; Zheng30 ; Zheng31 . In the rest frame of a considered source, we choose a simplified form of the joint probability density function of transverse momentum () and rapidity () Lao8 ,
| (1) |
Here, is the particle number, is the degeneracy factor, is the volume of emission sources, is the rest mass of the studied particle, is the temperature which describes averagely a few sources (local equilibrium states), is the entropy index which describes the degree of non-equilibrium among different states, is the chemical potential which is related to Andronic32 . In the RHIC energy region, the values of are shown in the Table IAdamczyk33 . We can extract the values of , and by reproducing the particle spectra, where , are fitted independently for the studied particle, and is related to other parameters.
| (GeV) | cross section | (MeV) |
|---|---|---|
| 14.5 | 0-10% | |
| 10-20% | ||
| 20-40% | ||
| 40-60% | ||
| 60-80% | ||
| 62.4 | 0-10% | |
| 10-20% | ||
| 20-40% | ||
| 40-60% | ||
| 60-80% | ||
| 200 | 0-10% | |
| 10-20% | ||
| 20-40% | ||
| 40-60% | ||
| 60-80% |
The Monte Carlo distribution generating method is used to obtain . Let denote the random numbers distributed uniformly in . A series of values of can be obtained by
| (2) |
Here, is the transverse momentum probability density function which is an alternative representation of the Tsallis distribution as follows:
| (3) |
where and are the maximum and minimum rapidity, respectively.
Under the assumption of isotropic emission in the source rest frame, we use the Monte Carlo method to acquire the polar angle:
| (4) |
Here, denote the random numbers distributed uniformly in . Thus, we can obtain a series of values of momentum and energy due to the momentum and the energy . Therefore, the corresponding values of rapidity can be obtained according to the definition of rapidity.
III Results and discussion
III.1 Transverse momentum spectra
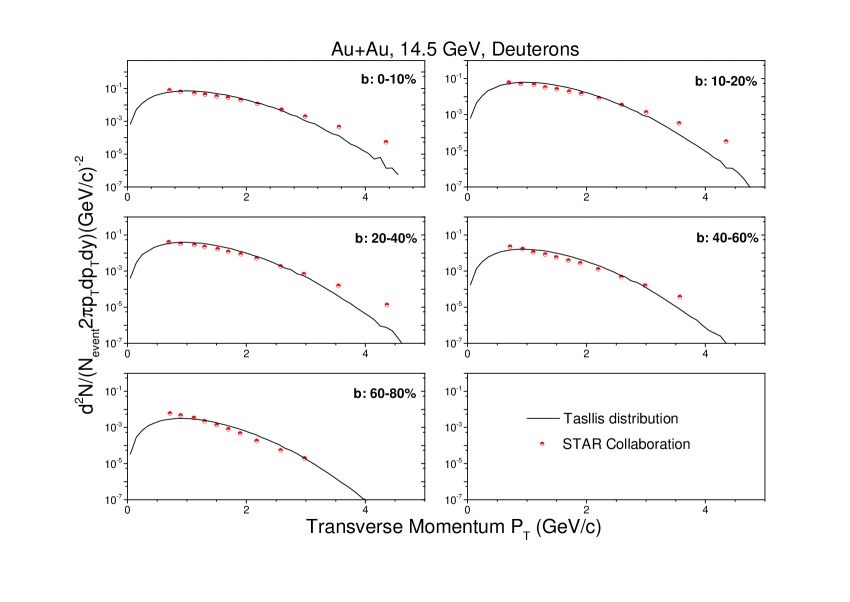
Fig. 1 demonstrates mid-rapidity (0.3) transverse momentum spectra for deuterons in Au+Au collisions at =14.5 GeV for , , , and centralities. The symbols represent the experimental data of STAR Collaboration Adam20 . The solid lines are our calculated results fitted by using the Tsallis distribution based on eq. (1) in the region of mid-rapidity. The values of the related parameters and are given in Table II along with the ( and number of degree of freedom). It is found that the calculations of the Tsallis distribution qualitatively describe the experimental data.
In Fig. 2 and Fig. 3, the curves and symbols are similar to Fig. 1. Figure 2 demonstrates mid-rapidity (0.3) transverse momentum spectra for deuterons in Au+Au collisions at =200 GeV for , , , and centralities. The values of the related parameters and are given in Tables III and IV along with the . It is found that the calculations of the Tsallis distribution qualitatively describe the experimental data.
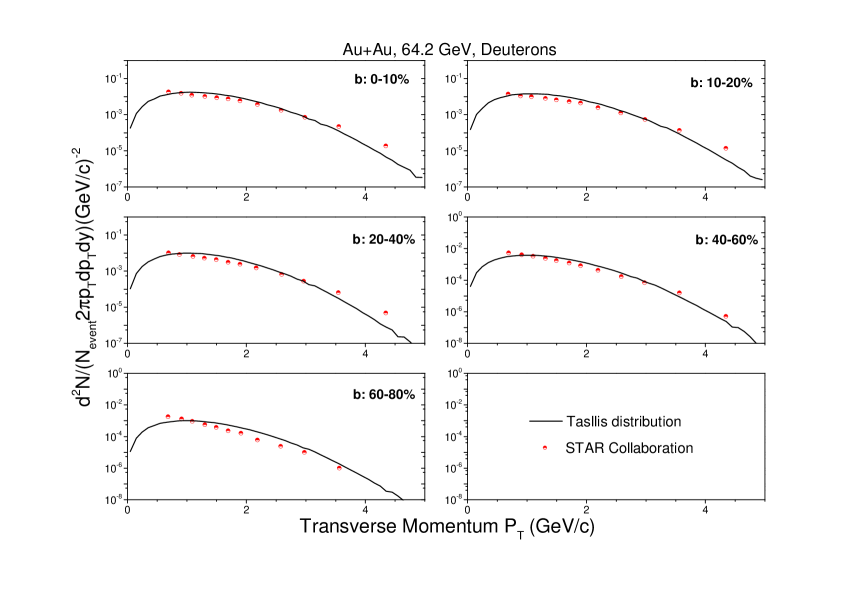
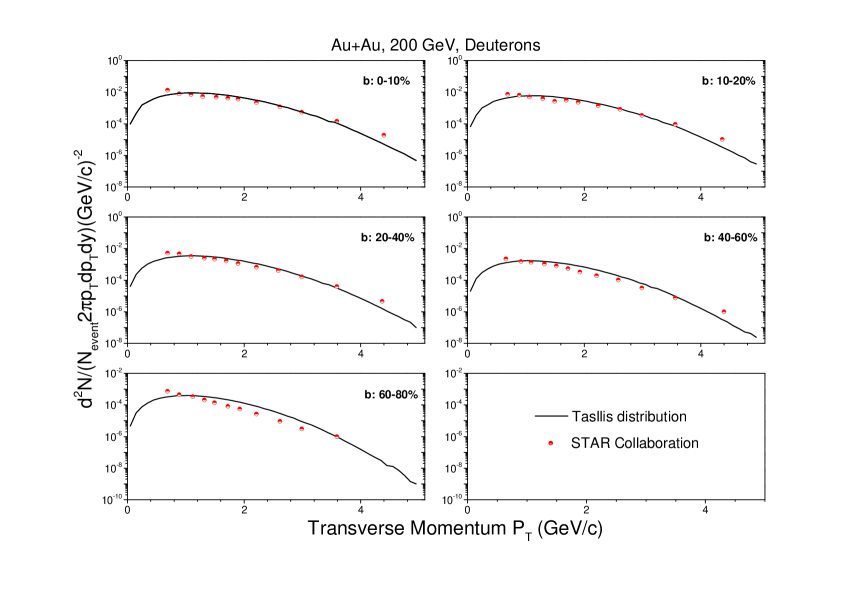
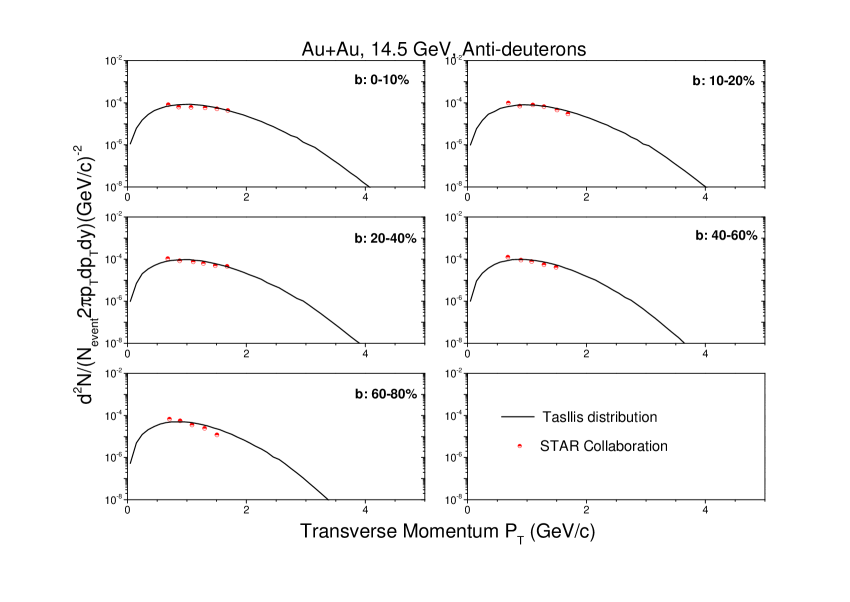
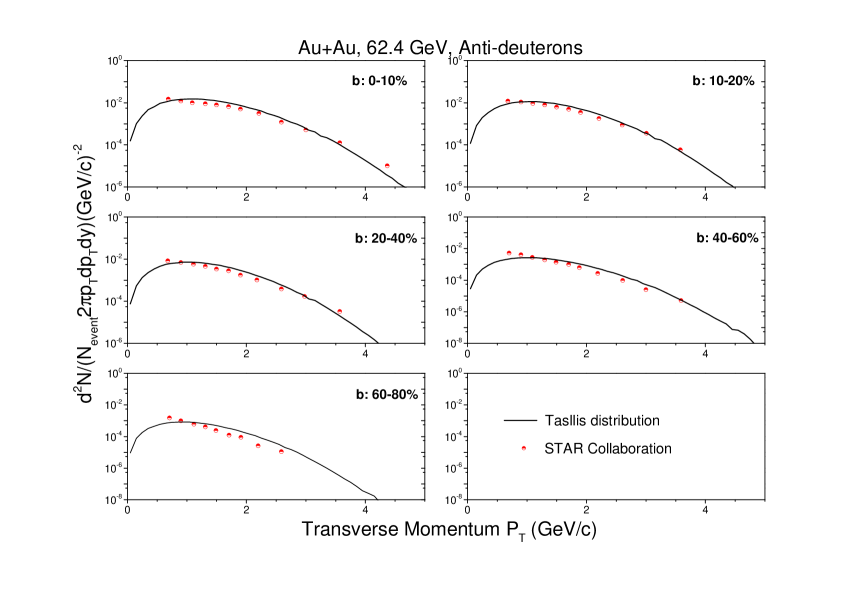
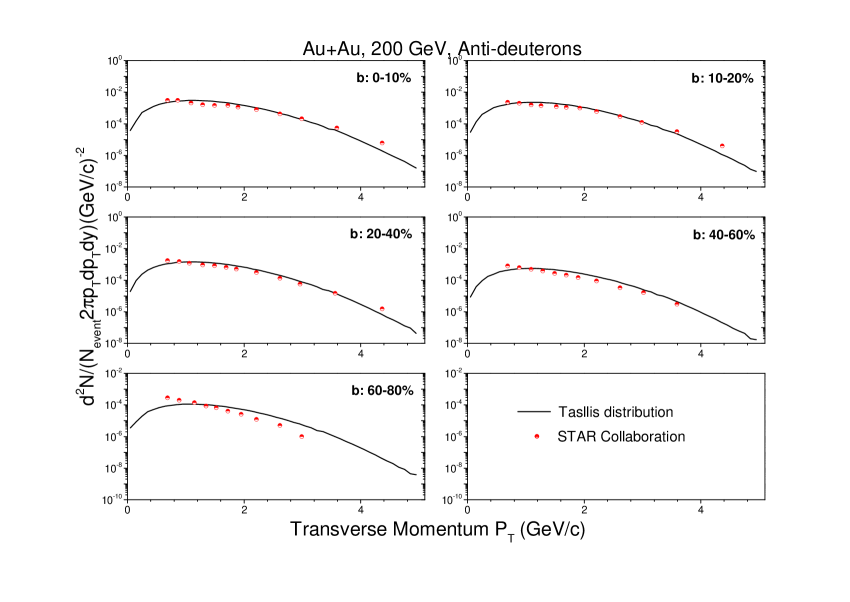
Figure 4, Figure 5 and Figure 6 demonstrate the mid-rapidity (0.3) transverse momentum spectra for anti-deuterons in Au+Au collisions at =14.5, 62.4 and 200 GeV for , , , and centralities. The curves and symbols are similar to Fig. 1. One can see that the calculations also can describe approximately the experimental data of anti-deuterons with different centrality intervals of event. The values of the related parameters and are given in Tables II, III, and IV.
| Figure | Type 1 | Type 2 | T (GeV) | q | Ratios | |
|---|---|---|---|---|---|---|
| Fig. 1 | d | 0-10% | 0.055 | 0.805 | ||
| 10-20% | 0.053 | 0.742 | ||||
| 20-40% | 0.119 | 0.788 | ||||
| 40-60% | 0.150 | 0.848 | ||||
| 60-80% | 0.639 | 1.191 | ||||
| Fig. 4 | 0-10% | 0.564 | 0.884 | |||
| 10-20% | 0.239 | 1.005 | ||||
| 20-40% | 0.331 | 0.939 | ||||
| 40-60% | 0.619 | 0.914 | ||||
| 60-80% | 1.508 | 0.960 |
| Figure | Type 1 | Type 2 | T (GeV) | q | Ratios | |
|---|---|---|---|---|---|---|
| Fig. 2 | d | 0-10% | 0.037 | 0.785 | ||
| 10-20% | 0.061 | 0.711 | ||||
| 20-40% | 0.124 | 0.731 | ||||
| 40-60% | 0.107 | 0.887 | ||||
| 60-80% | 0.274 | 0.910 | ||||
| Fig. 5 | 0-10% | 2.527 | 0.712 | |||
| 10-20% | 1.464 | 0.834 | ||||
| 20-40% | 2.231 | 0.833 | ||||
| 40-60% | 2.099 | 1.095 | ||||
| 60-80% | 3.303 | 0.966 |
| Figure | Type 1 | Type 2 | T (GeV) | q | Ratios | |
|---|---|---|---|---|---|---|
| Fig. 3 | d | 0-10% | 0.069 | 0.889 | ||
| 10-20% | 0.040 | 0.847 | ||||
| 20-40% | 0.004 | 0.989 | ||||
| 40-60% | 0.048 | 0.782 | ||||
| 60-80% | 0.063 | 0.906 | ||||
| Fig. 6 | 0-10% | 0.086 | 0.795 | |||
| 10-20% | 0.047 | 0.770 | ||||
| 20-40% | 0.048 | 0.802 | ||||
| 40-60% | 0.055 | 0.853 | ||||
| 60-80% | 0.206 | 1.183 |
III.2 Average transverse momenta
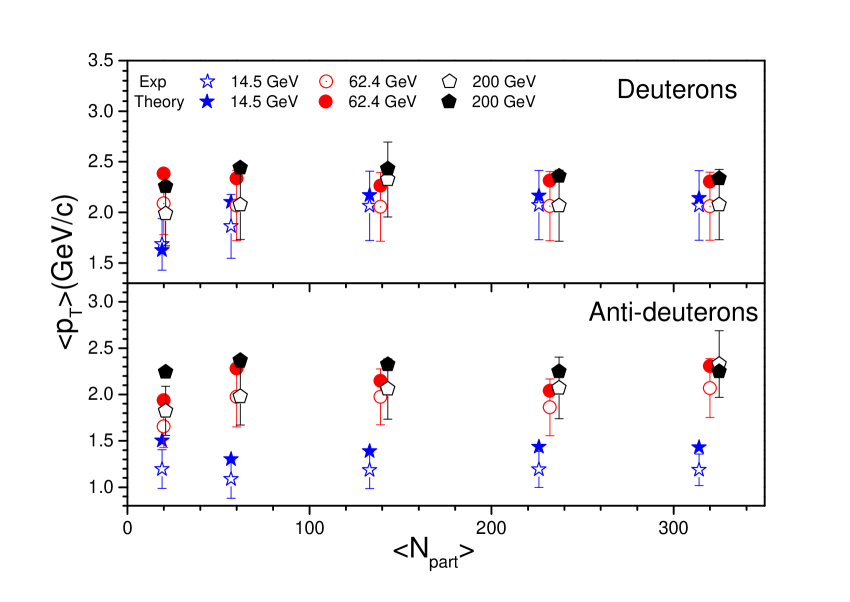
Figure 7 presents the centrality dependence average transverse momenta () of deuterons and anti-deuterons at the mid-rapidity (0.3) for =14.5, 62.4 and 200 GeV. The hollow symbols are the experimental data, and the solid symbols are the calculations of the Tsallis distribution. The calculations can be obtained by
| (5) |
Here, is the value of transverse momentum corresponding to the experimental data, and is the value of that corresponds to the .
In this figure, One observes that the calculations can describe the experimental data well in the range of the errors permitted. For deuterons, the values of average transverse momenta at different incident energy get closer with decrease of centrality percentage. It has indicated that the transverse excitation degree increases with collision centrality.
III.3 Dependence of parameters on number of participating nucleons
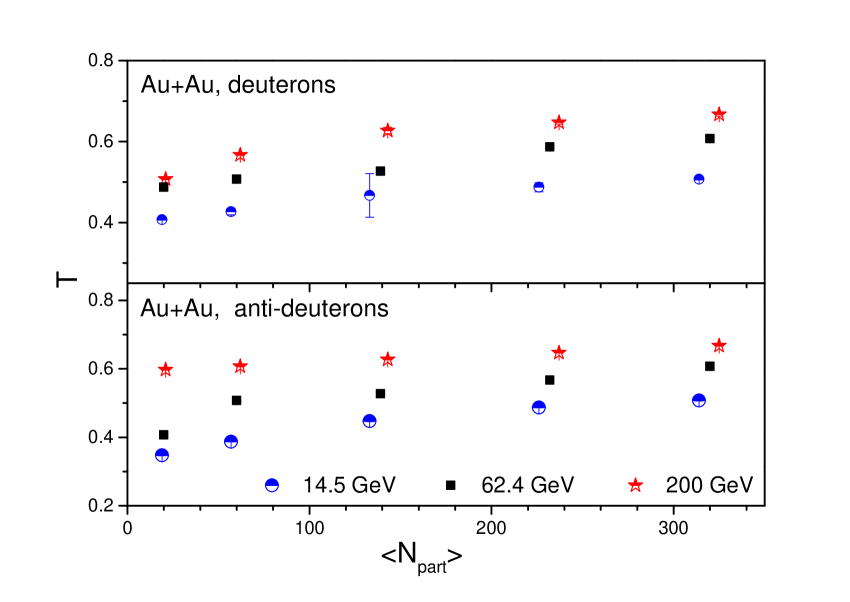
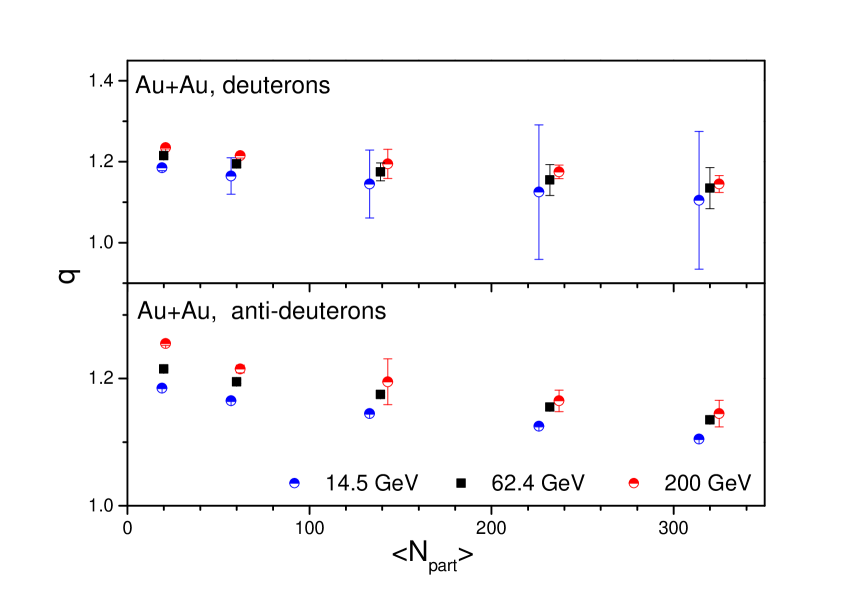
Fig. 8 and Fig. 9 give the trends of parameters ( and ) with the average number of participants for deuterons and anti-deuterons produced in Au+Au collision at the mid-rapidity (0.3) for =14.5, 62.4 and 200 GeV. The symbols represent the parameter values extracted from Figs. 1- 3 and Figs. 4- 6 and listed in Tables II-IV.
From Fig. 8 and Fig. 9, we can see that the values of parameters increase with decrease of centrality percentage, and the values of parameters increase with increase of centrality percentage. Entropy is a physical quantity that represents the degree of chaos in the system. When a central collision occurs, the motion law of the final state particles is complex, and the whole system is in a higher state of order, so the entropy value is small. In the central region where the collision occurs, with the increase of the intensity of the collision, the corresponding effective temperature increases. The dependence of effective temperature on collision energy increases with the increase of collision energy. Under the same collision parameters, the entropy increases with the increase of collision energy, indicating that the higher the collision energy is, the more different microscopic states the particle may have, and the more disordered the system becomes. The kinetic freeze-out temperature can be extracted from the effective temperature, the correlation between Kinetic freeze-out temperature and centrality will be focused in the future work.
IV Summary and Outlook
In summary, we have presented the transverse momentum distributions of (anti-)deuterons in Au+Au collisions at =14.5, 62.4 and 200 GeV for , , , and centralities. The Tsallis distribution in the multisource thermal model has been used in all calculations. Based on this model, we have investigated transverse momentum distributions of (anti-)deuterons, and the law about effective temperature and entropy with the centrality of collision. In conclusion, it can give the agreement between calculation results and the experimental data. The effective temperature extracted from and increases with decrease of centrality percentage at the same incident energy, and and the entropy index decreases with decrease of centrality percentage at the same incident energy. And at the same collision centrality, they increase with increase of incident energy. The effective temperature is not the actual temperature of the emission source. On the other hand the kinetic freeze-out temperature represents the temperature of the system when elastic collisions cease and hence is more realistic. We can extract the kinetic freezing temperature by the effective temperature. Then the kinetic freeze-out temperature and the evolution of time during the collision have yet to be studied in depth.
Data Availability
The data used to support the findings of this study are included within the article and are cited at relevant places within the text as references.
Conflict of Interests
The author declare that there is no conflict of interests regarding the publication of this paper.
Acknowledgements
This work was supported by the Introduction of Doctoral Starting Funds of Scientific Research of Guangxi University of Chinese Medicine under Grant No.2018BS024, the Natural Science Foundation of Guangxi Zhuangzu Autonomous Regions of China under Grant no. 2012GXNSFBA053011, Research support project of Guangxi institutions of higher learning No.200103YB071, and the Open Project of Guangxi Key Laboratory of Nuclear Physics and Nuclear Technology, No.NLK2020-03.
References
- (1) C. Alt et al. [NA49 Collaboration], “Energy dependence of and production in central Pb+Pb collisions at 20A, 30A, 40A, 80A,and 158A GeV measured at the CERN Super Proton Synchrotron,” Physical Review C, vol. 78, no. 3, Article ID 034918, 2008.
- (2) J. X. Sun, F. H. Liu and E. Q. Wang, “Pseudorapidity Distributions of Charged Particles and Contributions of Leading Nucleons in Cu-Cu Collisions at High Energies,” Chinese Physics Letters, vol. 27, no. 3, Article ID 032503, 2010.
- (3) E. Q. Wang, F. H. Liu, M. A. Rahim, S. Fakhraddin, J. X. Sun, “Singly and Doubly Charged Projectile Fragments in Nucleus-Emulsion Collisions at Dubna Energy in the Framework of the Multi-Source Model,” Chinese Physics Letters, vol. 28, no. 8, Article ID 082501, 2011.
- (4) B. C. Li, and M. Huang, “Strongly coupled matter near phase transition,” Journal of Physics G-Nuclear and Particle Physics, vol. 36, no. 6, Article ID 064062, 2009.
- (5) F. H. Liu, “Anisotropic emission of charged mesons and structure characteristic of emission source in heavy ion collisions at 1–2A GeV,” Chinese Physics B, vol. 17, no. 8, pp. 883-895, 2008.
- (6) R. Arsenescu et al. [NA52 Collaboration], “An investigation of the antinuclei and nuclei production mechanism in Pb + Pb collisions at 158 A GeV,” New Journal of Physics, vol. 5, Article ID 150, 2003.
- (7) Q. F. Li, Y. J. Wang, X. B. Wang and C. W. Shen, “Helium-3 production from Pb+Pb collisions at SPS energies with the UrQMD model and the traditional coalescence afterburner,” Science China: Physics, Mechanics and Astronomy, vol. 59, no. 3, Article ID 632002, 2016.
- (8) H. L. Lao, H. R. Wei, F. H. Liu and Roy A. Lacey, “An evidence of mass-dependent differential kinetic freeze-out scenario observed in Pb-Pb collisions at 2.76 TeV,” The European Physical Journal A, vol. 52, Article ID 203, 2016.
- (9) Stanislaw Mrowczynski, Patrycja Slon, “Hadron-Deuteron Correlations and Production of Light Nuclei in Relativistic Heavy-Ion Collisions,” http://arxiv.org/abs/nucl-th/1904.08320v2.
- (10) St. Mrowczynski, “Production of Light Nuclei in the Thermal and Coalescence Models,” Acta Physica Polonica B, vol. 48, no.4, pp. 707-716, 2017.
- (11) St. Mrowczynski, “4He versus 4Li and production of light nuclei in relativistic heavy-ion collisions,” Modern Physics Letters A, vol. 33, no. 25, Article ID 1850142, 2018.
- (12) P. Liu, J. H. Chen, Y. G. Ma and S. Zhang, “Production of light nuclei and hypernuclei at High Intensity Accelerator Facility energy region,” Nuclear Science and Techniques, vol. 28, no. 4, Article ID 55, 2017.
- (13) F. X. Liu, G. Chen, Z. L. Zhe, D. M. Zhou and Y. L. Xie, “Light (anti)nuclei production in Cu+Cu collisions at =200 GeV,” The European Physical Journal A, vol. 55, Article ID 160, 2019.
- (14) B. C. Li, Y. Y. Fu, L. L. Wang, F. H. Liu, “Dependence of elliptic flows on transverse momentum and number of participants in Au+Au collisions at =200 GeV,” Journal of Physics G-Nuclear and Particle Physics, vol. 40, no. 2, Article ID 025104, 2013.
- (15) Y. H. Chen, F. H. Liu and Edward K. Sarkisyan-Grinbaum, “Event patterns from negative pion spectra in proton-proton and nucleus-nucleus collisions at SPS,” Chinese Physics C, vol. 42, no. 10, Article ID 104102, 2018.
- (16) M. Waqas, F. H. Liu, L. L. Li and Haidar Mas ud Alfanda, “Analysis of effective temperature and kinetic freeze-out volume in high energy nucleus-nucleus and proton-proton collisions,” http://arxiv.org/abs/hep-ph/2001.06796v1.
- (17) C. Tsallis, “Possible generalization of Boltzmann-Gibbs statistics,” Journal of Statistical Physics, vol. 52, no. 1-2, pp. 479-487, 1988.
- (18) T. S. Biró, G. Purcsel and K. Ürmössy, “Non-extensive approach to quark matter,” The European Physical Journal A, vol. 40, no. 3, Article ID 325, 2009.
- (19) J. Cleymans, D. Worku, “Relativistic thermodynamics: Transverse momentum distributions in high-energy physics,” The European Physical Journal A, vol. 48, no. 11, Article ID 160, 2012.
- (20) J. Adam et al. [STAR Collaboration], “Beam energy dependengce of (anti-)deuteron production in Au+Au collisions at RHIC,” Physical Review C, vol. 99, no. 6, Article ID 064905, 2019.
- (21) F. H. Liu, Y. Q. Gao and H. R. Wei, “On Descriptions of Particle Transverse Momentum Spectra in High Energy Collisions,” Advances in High Energy Physics, vol. 2014, Article ID 293387, 2014.
- (22) F. H. Liu, Y. Q. Gao, T. Tian, and B. C. Li, “Unified description of transverse momentum spectrums contributed by soft and hard processes in high-energy nuclear collisions,” European Physical Journal A, vol. 50, no. 6, Article ID 94, 2014.
- (23) F. H. Liu, J. S. Li, “Isotopic production cross section of fragments in +p and ()+Pb reactions over an energy range from 300 A to 1500 A MeV,” Physical Review C, vol. 78, no. 4, Article ID 044602, 2008.
- (24) F. Büyükkilic, D. Demirhan, “A fractal approach to entropy and distribution functions,” Physics Letters A, vol. 181, no. 1, pp. 24-28, 1993.
- (25) J. C. Chen, Z. P. Zhang, G. Z. Su, L. X. Chen and Y. G. Shu, “q-generalized Bose CEinstein condensation based on Tsallis entropy,” Physics Letters A, vol. 300, no. 1, pp. 65-70, 2002.
- (26) J. M. Conroy, H. G. Miller, “Color superconductivity and Tsallis statistics,” Physical Review D, vol. 78, no. 5, Article ID 054010, 2008.
- (27) F. Pennini, A. Plastino, and A. R. Plastino, “Tsallis entropy and quantal distribution functions,” Physics Letters A, vol. 208, no. 4-6, pp. 309-314, 1995.
- (28) A. M. Teweldeberhan, A. R. Plastino, and H. G. Miller, “On the cut-off prescriptions associated with power-law generalized thermostatistics,” Physics Letters A, vol. 343, no. 1-3, pp. 71-78, 2005.
- (29) J. M. Conroy, H. G. Miller, and A. R. Plastino, “Thermodynamic consistency of the q-deformed Fermi CDirac distribution in nonextensive thermostatics,” Physics Letters A, vol. 374, no. 45, pp. 4581-4584, 2010.
- (30) H. Zheng, L. L. Zhu, “Comparing the Tsallis Distribution with and without Thermodynamical Description in Collisions,” Advances in High Energy Physics, vol. 2016, Article ID 9632126, 2016.
- (31) H. Zheng, L. L. Zhu, “Can Tsallis Distribution Fit All the Particle Spectra Produced at RHIC and LHC?,” Advances in High Energy Physics, vol. 2015, Article ID 180491, 2015.
- (32) A. Andronic, P. B. Munzinger, and J. Stachel, “The horn, the hadron mass spectrum and the QCD phase diagram C the statistical model of hadron production in central nucleus-nucleus collisions,” Nuclear Physics A, vol. 834, no. 1-4, pp. 237c-240c, 2010.
- (33) L. Adamczyk et al. [STAR Collaboration], “Bulk Properties of the Medium Produced in Relativistic Heavy-Ion Collisions from the Beam Energy Scan Program,” Physical Review C, vol. 96, no. 4, Article ID 044904, 2017.