Automatic Recommendation of Strategies for Minimizing Discomfort in Virtual Environments
Abstract
Virtual reality (VR) is an imminent trend in games, education, entertainment, military, and health applications, as the use of head-mounted displays is becoming accessible to the mass market. Virtual reality provides immersive experiences but still does not offer an entirely perfect situation, mainly due to Cybersickness (CS) issues. In this work we first present a detailed review about possible causes of CS. Following, we propose a novel CS prediction solution. Our system is able to suggest if the user may be entering in the next moments of the application into a illness situation. We use Random Forest classifiers, based on a dataset we have produced. The CSPQ (Cybersickness Profile Questionnaire) is also proposed, which is used to identify the player’s susceptibility to CS and the dataset construction. In addition, we designed two immersive environments for empirical studies where participants are asked to complete the questionnaire and describe (orally) the degree of discomfort during their gaming experience. Our data was achieved through 84 individuals on different days, using VR devices. Our proposal also allows to identify which are the most frequent attributes (causes) in the observed discomfort situations.
Keywords head mounted displays, causes, prediction, neural networks, machine learning, user experience, cybersickness
1 Introduction
We are currently experiencing the birth and development of a new entertainment platform. Virtual Reality (VR) delivers immersive 3D graphics in entertainment applications, serious games, and training applications in health, technological, military, or scientific domains.
Meanwhile, most users that experience head-mounted displays activities feel one or more symptoms of sickness, primarily if the user is subjected for a long period of time [1]. According to Ramsey et al. [2], on average, eighty percent of participants who experienced VR with Head Mounted Displays (HMDs) felt discomfort after the first 10 minutes of exposure. Therefore, more extensive VR activities tend to cause stronger discomfort levels. However, the level of discomfort still varies from individual to individual.
According to Hua [3], minimizing sickness in virtual and augmented reality applications is an unresolved challenge. Discomfort resulting from VR can arise from three different leading causes: motion sickness, Visually Induced Motion Sickness (VIMS), CyberSickness (CS) or simulator sickness.
Motion sickness is manifested by the divergence of information emitted by the human sensory system. This happens when conflicts between the sensory organs that define orientation and position in space occur. Motion Sickness (MS) is defined as the manifestation of discomfort during a forced visual movement (without the movement of the body), for example, during airplane flights, boat trips, or even with land vehicles [4], [5], [6], [7]. This uncomfortable experience also occurs in virtual environments and it is called Visually Induced Motion Disease.
VIMS symptoms are similar to MS. However, the difference lays on the fact that there is no physical movement in VIMS or they are extremely limited [8]. Several studies categorized VIMS as MS symptoms when situations of visual stimulation manifest irrespective of physical movements. Due to that, different studies in different VIMS contexts were renamed to match the set of symptoms according to the environment they manifested.
Merhi et al. [9] define the occurrence of VIMS during experiments with video games as game sickness, Brooks et al. [10] define the occurrence of VIMS in simulators as simulator sickness and McCauley and Thomas [11] define VIMS as occurring specifically in virtual reality systems as CS. The CS, in turn, is comparable to the symptoms of MS occurring in the real world, such as nausea, vertigo, dizziness, stomach problems, and others [12]. Symptoms of CS mainly occur with head-mounted displays (Oculus Rift, HTC Vive, among others) [13].
This work investigates the causes and solutions to CS while describing each current methodology. We also propose a novel classification solution for predicting the level of discomfort while using head mounted displays. The literature still lacks a comprehensive description of cybersickness and related topics, with most works consisting of empirical observations and reports [14], [15], [16].
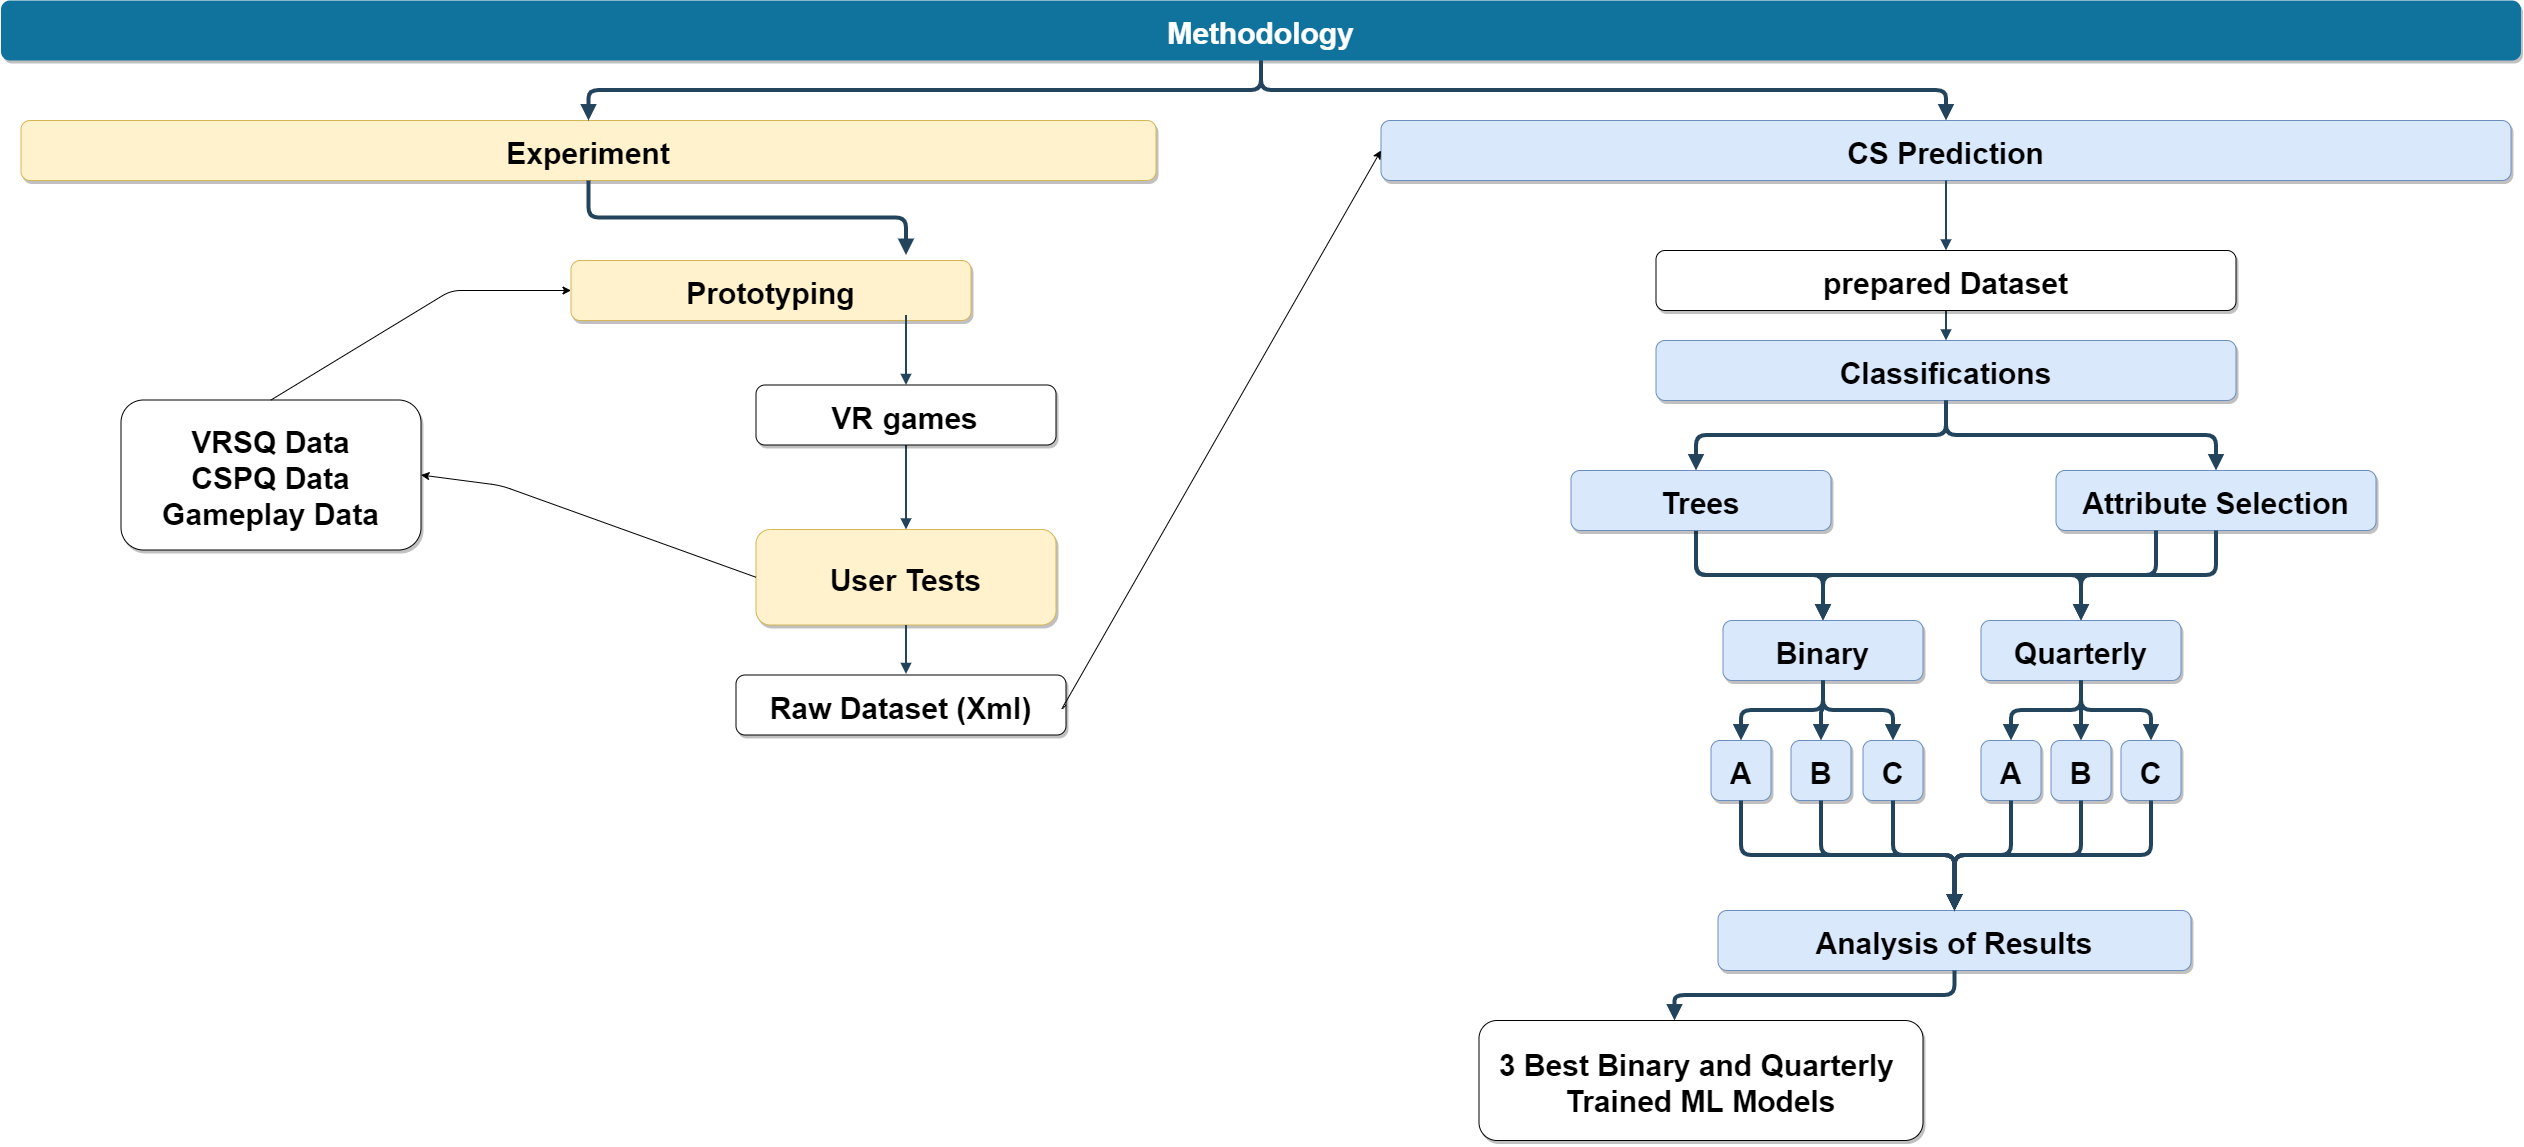
As shown in Figure 1, we collected data from a personal questionnaire, from the game play experience while the user was emerged in VR. Classifiers were used to predict the discomfort level of the user over the gameplay. The experiments were separated in binary and quaterly classifications, where in the binary case the labels slight, moderate and severe were merged into one: discomfort. The performance of classifiers is analysed and we also provide an attribute ranking analysis before presenting the conclusions.
2 Related Work
In this section, we review related works, which are addressed in 3 categories related to CS: causes, strategies, and prediction.
2.1 Causes
Several factors can cause pain and discomfort when using head-mounted displays [17], [18]. Manifestations of CS can lead to more intense symptoms, such as nausea, eye fatigue, neuralgia, and dizziness [19]. According to the literature [20], [21], [22], [23], it is possible to highlight the main factors that contribute to the manifestation of CS symptoms and the main strategies to minimize it.
-
1.
Locomotion - According to Rebenitsch, 2016 [13], locomotion interaction speed, in this case, the movement, is correlated to cybersickness (CS). Experiences where the participant has greater control of his movements and is close to natural movements of the human body tend to manifest less cybersickness.
- 2.
- 3.
-
4.
Depth of Field - Inadequate simulation of focus on stereoscopic HMDs with flow tracking devices creates incredible images and, consequently, causes discomfort. In the human eye, focus forces blur effects naturally and according to the depth of field (DoF) and distance range of objects in the observed area [26]. Due to ocular convergence, objects outside this range, located behind or in front of the eyes, are blurred [27].
-
5.
Degree of Control - According to Stanney and Keneddy [25] some facts suggest that CS can be mitigated by using experiences with a high level of control in terms of user movements in the virtual world, the authors use the real example of a car driver being much less susceptible to symptoms of discomfort than other passengers who are in the same vehicle.
-
6.
Exposure - In a previous research [28], researchers showed that discomfort levels rise proportionally over time.
- 7.
-
8.
Static Rest Frame - The lack of a static frame of reference (static rest frame) can cause sensory conflicts and, ultimately, cybersickness.
-
9.
Camera Rotation - Rotations in virtual environments with HMDs increase the chances of sensory conflicts occurring. According to the study of Bonato et al. [31], the feeling of vection is greater in rotations when 2 axes are considered in comparison to just 1 axis. The work of Bubka et al. [32] reaffirms the study of Bonato et al. However, Bubka et al. report that many individuals spontaneously reported symptoms of discomfort after many hours after the end of the experience with the VR environment.
-
10.
Postural Instability - Postural instability (Ataxia) is a postural imbalance or lack of coordination [24] [33] caused when the body tries to maintain an incorrect posture due to the sensory conflict caused by the virtual environment. In other words, postural instability is the reactive response to information received by the vestibular and visual organs.
2.2 Strategies
Several factors can induce the manifestation of CS symptoms during exposure in virtual reality environments. This manifestation can lead to profound malaise effects, such as nausea, eye fatigue, and dizziness. According to the literature, these problems can be mitigated in several ways:
-
•
Locomotion Strategies - Teleportation techniques assist with the mobility problem in virtual reality environments. In this strategy, the user can travel great distances by specifying the destination point of the trip, using a wand or marker at the destination point [34]. Another technique is known as the trigger walk, and this uses the concept of a natural walk to reach a particular destination. With each trigger pull, the user moves one step towards the indicated direction [35].
-
•
Acceleration Strategies - According to Berthoz et al. [36] it is possible to induce the sensation of movement using haptic feedback. However, according to Pavard et al. [37], the human visual system can adapt to the illusory movement, but cannot addapt to acceleration. According to Plouzeau et al. [38], it is possible to measure acceleration as a function of CS in RVs using an EDA (electro-dermal activity). According to surveys [39], [40], the more predictable the movement and acceleration of the camera, the less effects of CS. The technique of slow-motion effects provides less sudden movements and a lower rate of acceleration. This effect works best combined with the blur strategy.
-
•
Field of View Strategies - Vignette is a technique to gradually reduce the field of view in order to reduce uncomfortable sensations in virtual reality environments [41]. In the work of Norouzi et al. [42], a variation of this technique where the vignette size and dynamic field of view (FOV) are related to the camera acceleration was applied. The Tunneling [43] strategy is also used, which reduces the size of the user field of view at the exact moment of the motion.
-
•
Depth of Field Strategies - Some works include a depth of field simulation (DoF) broker with software blur to minimize the problem of vergence and accommodation [17], [28]. The solution presented by Carnegie and Rhee [17] pointed to the reduction of the discomfort in HMD applications. More clearly, they suggested a GPU-based solution for DoF simulation in these applications.
-
•
Rotation Movement Strategies - Several works applied techniques such as the amplification of movements made by the head [44], [38]. Another example, rotation blurring, which is a technique implemented by Budhiraja et al. [45], applies a smooth gaussian blur to the image based on the magnitude value of the accelerating rotation.
- •
-
•
Rest Frames Strategies - People tolerate longer exposures without feeling discomfort when projections systems are considered (example: CAVES). One of the biggest differences between VR and projection systems is the rest frames. In projection-based systems, the edges of the screen and elements of the real world are visible beyond the screens and act as resting frames [47]. According to Duh et al. [48], VR developers should create suggestions for rest frames whenever possible.
| Author(s) | Strategies | |
| Langbern (2018) | Teleporting | |
| Farmani (2018) | Tunneling | |
| Sapuri (2017) | Motion Walk | |
| Berthoz (1975) | Haptic Feedback | |
| Plouzeau (2018) | Changes on acceleration | |
| Kemeny (2017) | Headlock | |
| Skopp (2013) | Holosphere | |
| Cirio (2013) | Trajectory Visualization | |
| Budhiraja (2017) | Rotational blur | |
| Carnegie (2015) | DoF Simulation | |
| Waveren (2016), | Async. Time Warping for Latency | |
| Kim (2012) | "Cabin" Static Frame | |
| Kim (2017)~ | Slowmotion | |
| Bolas (2017) | Dynamic FoV | |
| Norouzi (2018) | Dynamic Vignetting | |
|
Amplified Movements | |
| Hillaire (2008) | Blur Effects | |
| Dennison (2016) | Physiological Signals Observation |
2.3 Prediction
Garcia-Agundez et al. [49] aimed to classify the level of CS. The model follows a combination of bio-signal and game settings. They collected user signals like respiratory and skin conductivity from a total of 66 participants. As a result, they mentioned a classification accuracy of 82% for binary classification and 56% for ternary.
Jin et al. [50] separates factors that cause cybersickness in 3 groups: hardware characteristics (VR device settings and features), software characteristics (the content of the VR scenes), and the individual user. The authors used classifiers to predict the level of discomfort. A total of 3 machine learning algorithms (CNN, LSTM-RNN, and SVR) were used. According to the results, the LSTM-RNN was the most viable model for the case.
In this work, we classify the level of cybersickness using parameters from an interactive game scene; this brings the works of Garcia-Agundez et al. and Jin et al. closer to our goal. Both aim to classify CS before and/or after the experience. In this work, we consider the entire VR experience, which means: before, during, and after the participation.
3 Methodology
| Strategies X Causes | 1 | 2 | 3 | 4 | 5 | 6 | 7 | 8 | 9 | 10 | ||
| Teleporting | x | |||||||||||
| Tunneling | x | |||||||||||
|
x | |||||||||||
|
x | |||||||||||
|
x | |||||||||||
| Headlock | x | |||||||||||
| Holosphere | x | |||||||||||
|
x | |||||||||||
|
x | x | ||||||||||
|
x | |||||||||||
|
x | |||||||||||
|
x | |||||||||||
| Slowmotion | x | x | ||||||||||
|
x | |||||||||||
|
x | x | ||||||||||
|
x | |||||||||||
| Blur | x | x | x | x | x | |||||||
| Interval | x | |||||||||||
|
x |
Our feature set is composed of 34 attributes, divided into four groups:
-
•
User Profile Data: The profile data was selected based on the literature and also on the experience acquired during pilot tests of this work, we gathered this data through our Cybersickness Profile Questionnaire (CSPQ). The CSPQ contains questions such as gender, age, level of experience with VR, existence of any pre-symptoms and flicker sensibility. We also include information about whether the individual wears glasses, has any vision impairments, information regarding the posture during the experiment (standing or sitting), and which eye is the dominant eye.
-
•
Questionnaire Data: Information filled in by the user about discomfort symptoms before and after the experiment. The symptoms listed are from the VRSQ (Virtual Reality Sickness Questionnaire) [51], which is a modified version of Kennedy’s traditional SSQ (Simulator Sickness Questionnaire) to address environments virtual reality with HMDs specifically.
-
•
Game data: Information such as (1) time stamp, (2) speed, (3) acceleration, (4) player rotation axis, (5) player position, (6) region of interest, (7) size of the FOV, (8) frame rate and (9) discomfort level, which is the class and is reported by the user at any time during the gameplay experience.
-
•
Game configuration data: Boolean information towards the (1) existence of static resting frames, (2) existence of haptic response, (3) level of user control over the camera, (4) existence of depth of field simulation (DoF) and (5) whether the game primary camera moves automatically (without user intervention). These data were selected based on the list of strategies shown in Table 1.
Two games were created for this work: a race and a flight game. The games (made with Unity 3D) are part of the complete software solution for this work. We collected data from a total 37 participants (9 female and 28 male) with ages ranging between 18 and 60. The participants were able to quit the experiment whenever they wanted. Each individual was asked to:
-
•
Task 1 - Fill in the profile questionnaire - CSPQ
-
•
Task 2 - Fill in the virtual reality sickness questionnaire VRSQ (Q1)
-
•
Task 3 - Participate in one of the VR games for up to 5 minutes (if possible).
-
•
Task 4 - Fill in the virtual reality sickness questionnaire VRSQ (Q2).
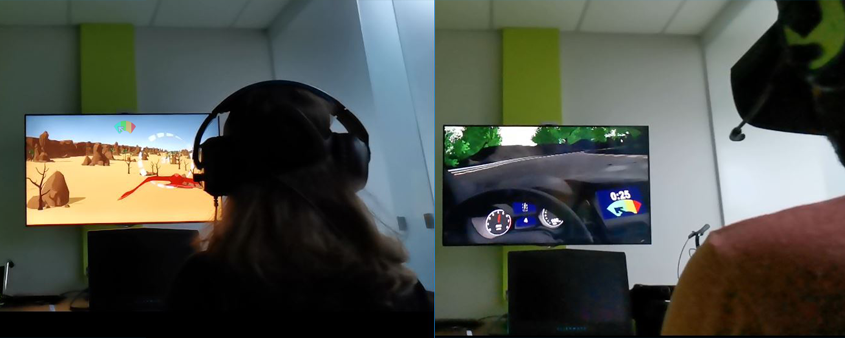
Both games (racing and flight) try to force the participant to perform habitual VR game movements, such as rotation, translation, and perform acceleration changes. These movements can cause one or more symptoms of discomfort. Figure 2 shows two players using HDM playing both games (flight at left and race at right).
Once the data is collected, machine learning algorithms were trained to classify the CS. Each of the inputs stored by the experiment contains a rating given by users related to discomfort (from 0 to 3, where 0 is none and 3 is severe) during gameplay.
To further analyse the collected data, we seperate the experiments in three main scenarios: A, B and C. In what follows, these scenarios are described:
-
•
Scenario A - Classification consisting of data from the racing game (3993 samples).
-
•
Scenario B - Classification consisting of data from the flight game (5397 samples).
-
•
Scenario C - Classification using data from both scenarios together -A and B- (9390 samples).
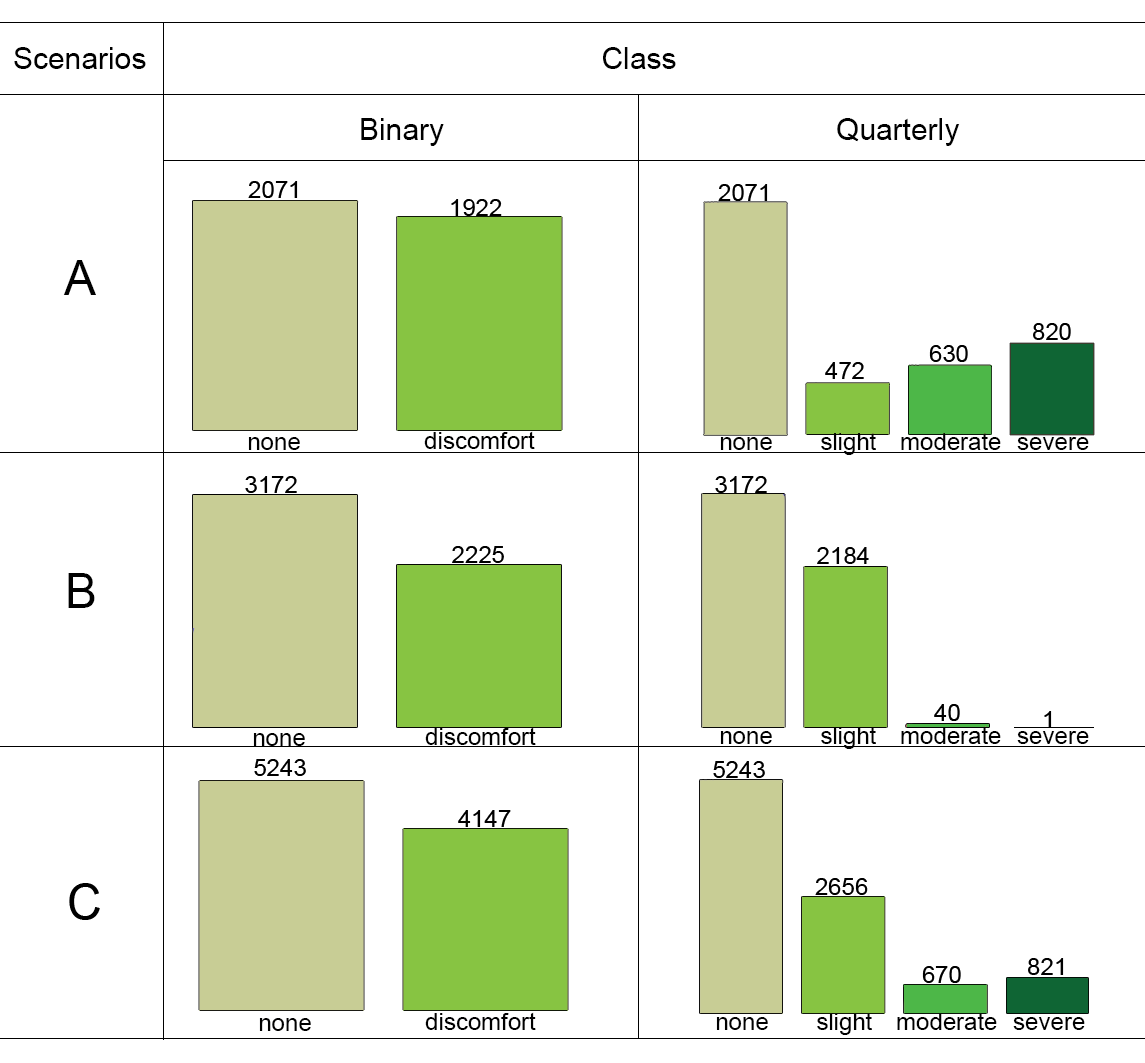
The following classifiers were evaluated: BF Tree, CDT, Decision Strump, ForestPA, FT, Hoeffding, J48, J48 Graft, JCHAID Star, LAD Tree, LMT, Nb Tree, Random Forest, Random Tree, Rep Tree, and Simple Cart. Experiments were run using a 10-fold cross-validation in all scenarios. We also separated scenarios A, B and C into two new groups. The first group is a binary classification (0-none or 1-discomfort, which includes from slight to severe classes). The second group is a quaterly classification containing all four classes (none, slight, moderate and severe). The distribution of classes can be seen in Figure 3.
4 Results
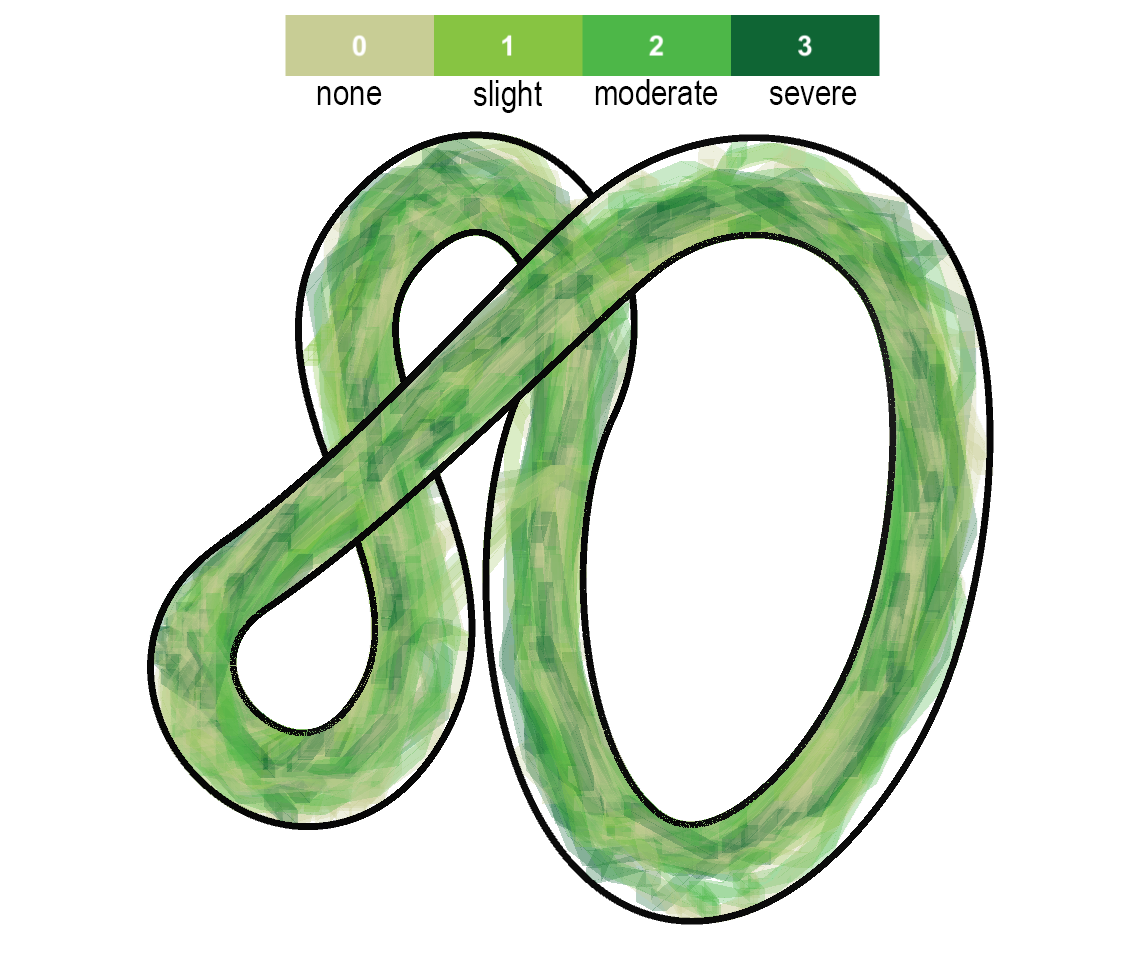
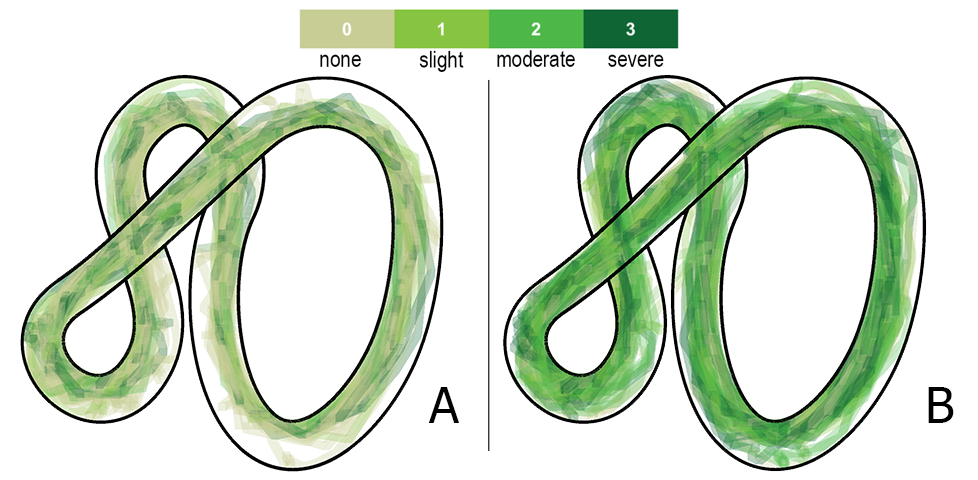
It was using the valid race game data with a total of 3993 samples. We observed that the occurrence of the discomfort reported by individuals occurs throughout the track (in Figure 4). However, the discomfort levels in specifics regions of track have a more significant accumulation.
In a comparative sample of reports of discomfort between individuals of the female gender (7 females with 1772 samples) and male (8 males with 2221 samples), We observed that in an accumulated result, the male participants reported discomfort values greater than zero more often than individuals of the female gender (illustrated in Figure 5).
Biocca [52] and Kolasinski [23], who report those female individuals are more susceptible to symptoms of MS. Despite being similar diseases, they have different environments and manifestations. Because of this, for this case, there is no way to say if there is a difference between genders for the manifestation of CS-based only on the works cited in this thesis. However, the results of this stage showed, in this specific testing stage, that the female audience reported less discomfort compared to the male audience.
Table 3,4 shows the Accuracy and Kappa index for binary and quarterly classifications over scenarios A, B and C.
4.1 Binary Classification
As previously mentioned, we also merged the discomfort level into a single class in order to perform binary classifications, which are usually stronger than non-binary ones. Discomfort values that were previously represented as slight, moderate, and severe are represented as discomfort.
In Scenario A, B, and C, the Random Forest classifier proved to be the best with an accuracy of 94.0%, 99.0%, and 96.6% for the binary case.
| Binary Classification | ||||||
|---|---|---|---|---|---|---|
| Scenarios | A | B | C | |||
| Classificator | ACC | KPP | ACC | KPP | ACC | KPP |
| BFTree | 91.8% | 0.8364 | 96.8% | 0.9353 | 93.0% | 0.8584 |
| CDT | 89.7% | 0.794 | 96.8% | 0.9346 | 92.3% | 0.8457 |
| DecisionStrump | 62.0% | 0.2574 | 71.9% | 0.4299 | 61.6% | 0.2713 |
| ForestPA | 91.5% | 0.8297 | 97.8% | 0.9563 | 95.5% | 0.909 |
| FT | 87.0% | 0.7395 | 94.2% | 0.881 | 90.9% | 0.8154 |
| Hoeffding | 69.9% | 0.393 | 78.1% | 0.5363 | 71.9% | 0.4251 |
| J48 | 92.4% | 0.8495 | 97.9% | 0.9576 | 95.2% | 0.9036 |
| J48Graft | 92.6% | 0.853 | 97.9% | 0.9575 | 95.2% | 0.9036 |
| JCHAIDStar | 89.8% | 0.7968 | 92.8% | 0.894 | 91.6% | 0.8582 |
| LADTree | 78.9% | 0.5812 | 88.9% | 0.7722 | 74.1% | 0.4829 |
| LMT | 93.0% | 0.86 | 98.1% | 0.961 | 95.5% | 0.9088 |
| NbTree | 88.1% | 0.7624 | 98.6% | 0.9728 | 95.0% | 0.8993 |
| RandomForest | 94.0% | 0.8805 | 99.0% | 0.9801 | 96.6% | 0.9323 |
| RandomTree | 89.2% | 0.7838 | 96.6% | 0.93 | 92.2% | 0.8421 |
| RepTree | 90.7% | 0.8147 | 96.9% | 0.9368 | 93.0% | 0.8595 |
| SimpleCart | 92.2% | 0.8455 | 97.2% | 0.9441 | 93.4% | 0.8672 |
4.2 Quarterly Classification
For the quarterly classification, the dataset was kept unchanged. This set of experiments contain 4 classes: none, slight, moderate and severe. In Scenario A, the classifier LMT (Logistic Model Trees) achieved the best result, which reached the accuracy of 92.4%. In the Scenario B, the best result was obtained with Random Forest (98.9%). For Scenario C, Random Forest also obtained the best classification accuracy (95.4%).
| Quarterly Classification | ||||||
|---|---|---|---|---|---|---|
| Scenarios | A | B | C | |||
| Classificator | ACC | KPP | ACC | KPP | ACC | KPP |
| BFTree | 88.8% | 0.827 | 97.1% | 0.9417 | 93.0% | 0.8821 |
| CDT | 86.3% | 0.7854 | 96.5% | 0.93 | 92.3% | 0.8698 |
| DecisionStrump | 51.0% | 0 | 71.6% | 0.4294 | 55.8% | 0 |
| ForestPA | 87.6% | 0.8017 | 97.4% | 0.947 | 94.2% | 0.9015 |
| FT | 83.1% | 0.7375 | 93.7% | 0.8731 | 89.4% | 0.8227 |
| Hoeffding | 52.5% | 0.0401 | 73.8% | 0.4882 | 55.8% | 0 |
| J48 | 90.7% | 0.8566 | 97.8% | 0.9569 | 94.8% | 0.9139 |
| J48Graft | 90.9% | 0.8598 | 97.7% | 0.9547 | 95.0% | 0.9162 |
| JCHAIDStar | 77.7% | 0.6513 | 92.3% | 0.8793 | 86.0% | 0.7824 |
| LADTree | 68.5% | 0.4996 | 87.0% | 0.7333 | 72.1% | 0.4694 |
| LMT | 92.4% | 0.8832 | 97.8% | 0.9566 | 95.5% | 0.9249 |
| NbTree | 88.7% | 0.8246 | 98.7% | 0.9747 | 94.4% | 0.9052 |
| RandomForest | 92.2% | 0.8782 | 98.9% | 0.9792 | 95.4% | 0.9221 |
| RandomTree | 85.1% | 0.7709 | 96.8% | 0.9355 | 89.5% | 0.8243 |
| RepTree | 87.0% | 0.7962 | 96.7% | 0.9328 | 92.6% | 0.8755 |
| SimpleCart | 88.9% | 0.8288 | 97.3% | 0.9464 | 93.0% | 0.8821 |
4.2.1 Attribute Selection
We used the Classifier Attribute Evaluator (using full set training with "leave one attribute out" method) in the Weka machine learning framework to generate a ranking of all attributes using the best classifier of the previous experiments (Tables 3 and 4). This algorithm removes attributes from the dataset and evaluates how its removal impacts on the performance of the classification. After all attributes are evaluated, they are ranked in terms of impact. The best ones stay at the top of the ranking.
For binary classifications and scenario A (racing game), the 5 most relevant attributes were: Time Stamp, Age, Gender, Rotation on the z axis (CameraRotationZ) and Player Speed. For Scenario B (flight game), the attribute ranking was given as follows: Age, Position on the z axis (PlayerPositionZ), Experience, Vision Impairment and Rotation on the z axis (CameraRotationZ).
These attributes ranked at the first 5 positions for the different scenarios corroborates with the literature. For 2 out of 3 test scenarios, the time stamp was considered the most important for the classification of discomfort. Player Speed, Rotation (CameraRotationZ) as well as Gender and Age were also essential attributes.
In quarterly classifications, we obtained similar results. For Scenario A: Time Stamp, Age, Genre, Experience and Player Speed were the top 5. Scenario B, the most relevant attributes were: Age, Position on the z axis (PlayerPositionZ), Experience and Vision Impairments. In Scenario C: Time Stamp, Age, Gender, Rotation on the z axis (CameraRotationZ), Experience.
5 Conclusion
This is the first work to use classifiers in order to predict discomfort over the track during the gameplay experience considering a broad feature set, which includes user personal data. We also publicly provide the user data .
We built a data visualization application and performed a first analysis of the collected data. It is possible to observe that in 3993 samples of the racing game, most occurrences of discomfort reported by the participants occurred near or during curves of the virtual track, which reinforces the association of CS to rotations. We also made an analysis between genders which showed that female individuals reported lower incidents of discomfort compared to male participants in our data.
Subsequently, the analysis in terms of machine learning consisted of three scenarios: Scenario A (data from the racing game), Scenario B (data from the flying game) and Scenario C (data from both games). We performed supervised binary and quarterly classifications using 16 decision tree classifiers. Classifiers that resulted in the highest accuracy were: Random Forests (Random Forest) and LMT (Logist Model Trees). The best accuracy was 99.0% and was obtained with the Random Forest classifier for scenario B (flight game) in the binary classification.
An attribute selection was also performed in order to identify the most relevant attributes. For all scenarios it was observed that the most relevant attributes were the same, being: (time, position, and z-axis rotation) and profile attributes of the individual. These results corroborates the importance of attributes related to the individuals in the prediction of CS. This assessment reinforces the theories and hypothesis present in the literature known so far. Time is notably essential for the prediction of discomfort in virtual reality environments.
6 Next Steps
To construct a complete methodology, that contemplates the CS prediction and the automatic suggestion of strategies to minimize the CS. It will be necessary to overcome the following challenges:
-
•
Application and analysis of association rules in the data set of this thesis.
-
•
Flight game analysis and inclusion of graphical visualization of discomfort.
-
•
Realization of a new stage of experiment with individuals standing.
-
•
Training with recurrent neural network model (LSTM).
-
•
Investigation of alternatives with deep learning networks.
-
•
Research on how to carry out automatic strategy suggestions with the value resulting from discomfort in real-time.
-
•
Inclusion of new attributes (in a synthetic way), with the captured data, for example, distances between the player and the movement limits of the scenarios, total distance covered.
-
•
Implementation of the final game application in virtual reality with the prediction of the level of discomfort and strategy suggestion in real-time.
-
•
Weight modeling for the profile questionnaire (CSPQ).
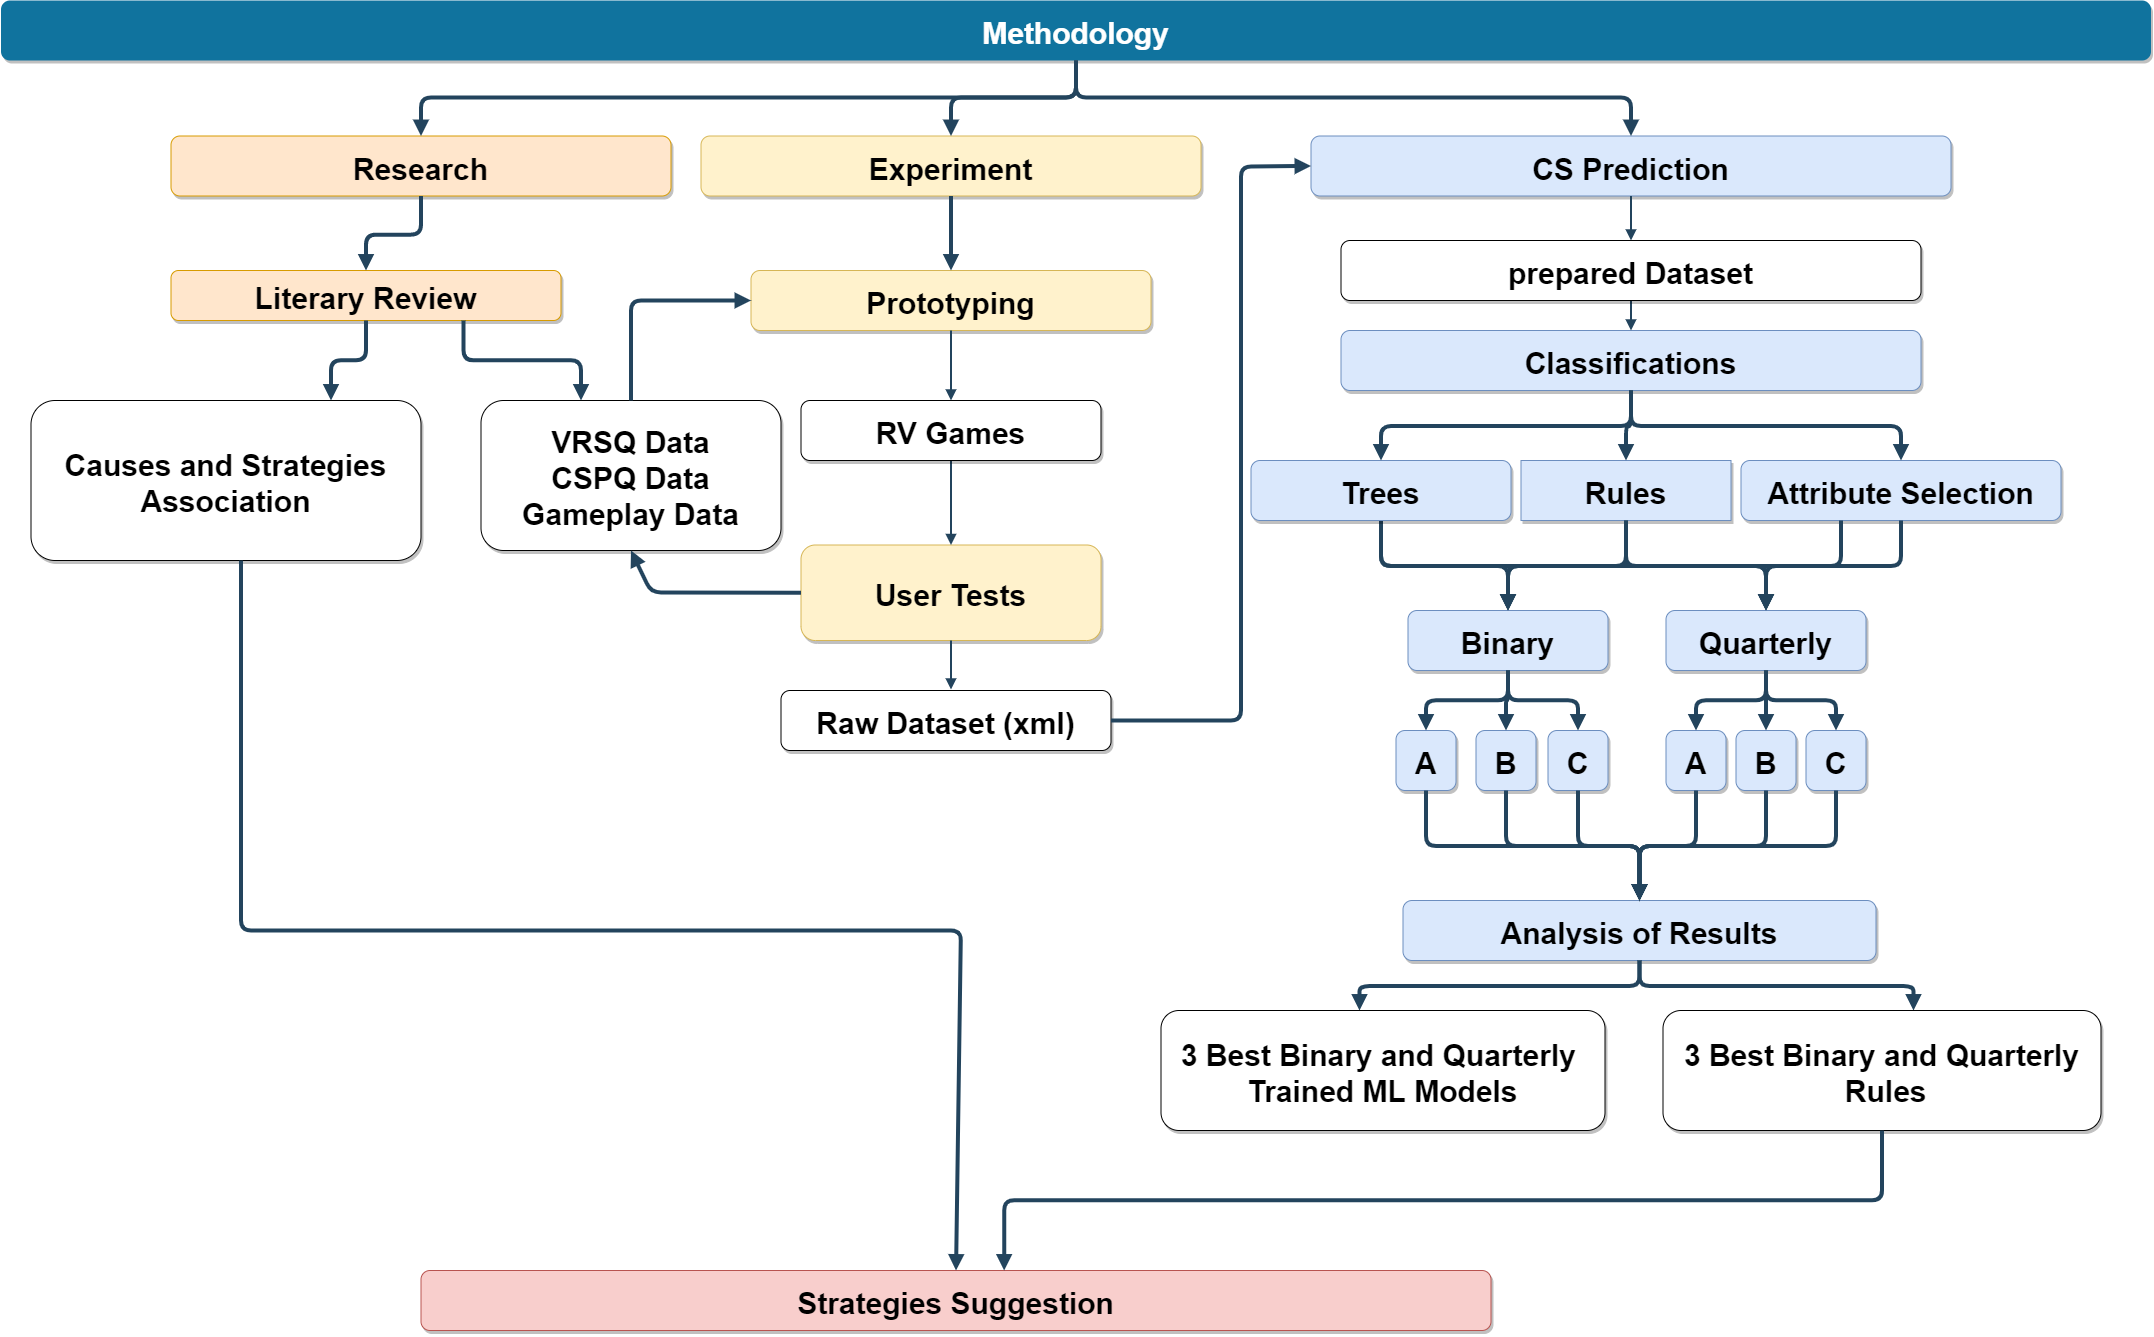
As far as is known, most CS causes can have one or more minimization strategies. Based on this knowledge, the present methodology divides the problem of automatically suggesting in the following steps (Figure 6):
-
•
Research: Identification and association of causes and strategies
-
•
Experiments: Application development, tests with participants, data collection and pre-elimination analysis
-
•
CS Prediction (CS Prediction): classifiers, Training, binary classification, quaternary classification, attribute ranking, association rules.
-
•
Suggestion of CS minimization strategy (Strategies Suggestion).
References
- [1] Pierre-Yves Laffont and Ali Hasnain. Adaptive dynamic refocusing: toward solving discomfort in virtual reality. In ACM SIGGRAPH 2017 Emerging Technologies, page 1. ACM, 2017.
- [2] Amanda Ramsey, Sarah Nichols, and Sue Cobb. Virtual reality induced symptoms and effects (vrise) in four different virtual reality display conditions. In Proceedings of HCI International (the 8th International Conference on Human-Computer Interaction) on Human-Computer Interaction: Ergonomics and User Interfaces-Volume I-Volume I, pages 142–146. L. Erlbaum Associates Inc., 1999.
- [3] Hong Hua and Bahram Javidi. A 3d integral imaging optical see-through head-mounted display. Optics express, 22(11):13484–13491, 2014.
- [4] JA Irwin. The pathology of sea-sickness. The Lancet, 118(3039):907–909, 1881.
- [5] A Lawther and MJ Griffin. A survey of the occurrence of motion sickness amongst passengers at sea. Aviation, space, and environmental medicine, 59(5):399–406, 1988.
- [6] Willem Bles, Jelte E Bos, Bernd De Graaf, Eric Groen, and Alexander H Wertheim. Motion sickness: only one provocative conflict? Brain research bulletin, 47(5):481–487, 1998.
- [7] Alexander D Walker, Eric R Muth, Fred S Switzer, and Adam Hoover. Head movements and simulator sickness generated by a virtual environment. Aviation, space, and environmental medicine, 81(10):929–934, 2010.
- [8] Behrang Keshavarz, Bernhard E Riecke, Lawrence J Hettinger, and Jennifer L Campos. Vection and visually induced motion sickness: how are they related? Frontiers in psychology, 6:472, 2015.
- [9] Omar Merhi, Elise Faugloire, Moira Flanagan, and Thomas A Stoffregen. Motion sickness, console video games, and head-mounted displays. Human factors, 49(5):920–934, 2007.
- [10] Johnell O Brooks, Richard R Goodenough, Matthew C Crisler, Nathan D Klein, Rebecca L Alley, Beatrice L Koon, William C Logan Jr, Jennifer H Ogle, Richard A Tyrrell, and Rebekkah F Wills. Simulator sickness during driving simulation studies. Accident Analysis & Prevention, 42(3):788–796, 2010.
- [11] Michael E McCauley and Thomas J Sharkey. Cybersickness: Perception of self-motion in virtual environments. Presence: Teleoperators & Virtual Environments, 1(3):311–318, 1992.
- [12] PA Howarth and PJ Costello. The occurrence of virtual simulation sickness symptoms when an hmd was used as a personal viewing system. Displays, 18(2):107–116, 1997.
- [13] Lisa Renee Rebenitsch. Cybersickness prioritization and modeling. Michigan State University, 2015.
- [14] Yuyang Wang, Jean-Rémy Chardonnet, and Frédéric Merienne. Vr sickness prediction for navigation in immersive virtual environments using a deep long short term memory model. In 2019 IEEE Conference on Virtual Reality and 3D User Interfaces (VR), pages 1874–1881. IEEE, 2019.
- [15] Tae Min Lee, Jong-Chul Yoon, and In-Kwon Lee. Motion sickness prediction in stereoscopic videos using 3d convolutional neural networks. IEEE transactions on visualization and computer graphics, 25(5):1919–1927, 2019.
- [16] Daekyo Jeong, Sangbong Yoo, and Yun Jang. Motion sickness measurement and analysis in virtual reality using deep neural networks algorithm. Journal of The Korea Computer Graphics Society, 25(1):23–32, 2019.
- [17] Kieran Carnegie and Taehyun Rhee. Reducing visual discomfort with hmds using dynamic depth of field. IEEE computer graphics and applications, 35(5):34–41, 2015.
- [18] Richard Yao, Tom Heath, Aaron Davies, Tom Forsyth, Nate Mitchell, and Perry Hoberman. Oculus vr best practices guide.
- [19] Robert S Kennedy, Norman E Lane, Kevin S Berbaum, and Michael G Lilienthal. Simulator sickness questionnaire: An enhanced method for quantifying simulator sickness. The international journal of aviation psychology, 3(3):203–220, 1993.
- [20] Richard HY So, WT Lo, and Andy TK Ho. Effects of navigation speed on motion sickness caused by an immersive virtual environment. Human Factors: The Journal of the Human Factors and Ergonomics Society, 43(3):452–461, 2001.
- [21] James JW Lin, Habib Abi-Rached, and Michal Lahav. Virtual guiding avatar: An effective procedure to reduce simulator sickness in virtual environments. In Proceedings of the SIGCHI Conference on Human Factors in Computing Systems, pages 719–726. ACM, 2004.
- [22] Mark H Draper, Erik S Viirre, Thomas A Furness, and Valerie J Gawron. Effects of image scale and system time delay on simulator sickness within head-coupled virtual environments. Human Factors: The Journal of the Human Factors and Ergonomics Society, 43(1):129–146, 2001.
- [23] Eugenia M Kolasinski. Simulator sickness in virtual environments. Technical report, DTIC Document, 1995.
- [24] Joseph J LaViola Jr. A discussion of cybersickness in virtual environments. ACM SIGCHI Bulletin, 32(1):47–56, 2000.
- [25] Kay M Stanney, Robert S Kennedy, and Julie M Drexler. Cybersickness is not simulator sickness. In Proceedings of the Human Factors and Ergonomics Society annual meeting, volume 41, pages 1138–1142. SAGE Publications Sage CA: Los Angeles, CA, 1997.
- [26] Tingting Zhang, Harold T Nefs, and Ingrid Heynderickx. Human discrimination of depth of field in stereoscopic and nonstereoscopic photographs. Perception, 43(5):368–380, 2014.
- [27] Thiago M Porcino, Esteban Clua, Daniela Trevisan, Cristina N Vasconcelos, and Luis Valente. Minimizing cyber sickness in head mounted display systems: design guidelines and applications. In Serious Games and Applications for Health (SeGAH), 2017 IEEE 5th International Conference on, pages 1–6. IEEE, 2017.
- [28] T Porcino, E Clua, C Vasconcelos, and D Trevisan. Dynamic focus selection for first-person navigation with head mounted displays. SBGames, 2016.
- [29] Marc Olano, Jon Cohen, Mark Mine, and Gary Bishop. Combatting rendering latency. In Proceedings of the 1995 symposium on Interactive 3D graphics, pages 19–ff. ACM, 1995.
- [30] Jonh Carmack’s Delivers Some Home Truths On Latency. http://oculusrift-blog.com/john-carmacks-message-of-latency/682/. Accessed: 2016-06-01.
- [31] Frederick Bonato, Andrea Bubka, and Stephen Palmisano. Combined pitch and roll and cybersickness in a virtual environment. Aviation, space, and environmental medicine, 80(11):941–945, 2009.
- [32] Andrea Bubka, Frederick Bonato, Scottie Urmey, and Dawn Mycewicz. Rotation velocity change and motion sickness in an optokinetic drum. Aviation, Space, and Environmental Medicine, 77(8):811–815, 2006.
- [33] Simon Davis, Keith Nesbitt, and Eugene Nalivaiko. A systematic review of cybersickness. In Proceedings of the 2014 Conference on Interactive Entertainment, pages 1–9. ACM, 2014.
- [34] Eike Langbehn, Paul Lubos, and Frank Steinicke. Evaluation of locomotion techniques for room-scale vr: Joystick, teleportation, and redirected walking. In Proceedings of the Virtual Reality International Conference-Laval Virtual, page 4. ACM, 2018.
- [35] Bhuvaneswari Sarupuri, Miriam Luque Chipana, and Robert W Lindeman. Trigger walking: A low-fatigue travel technique for immersive virtual reality. In 2017 IEEE Symposium on 3D User Interfaces (3DUI), pages 227–228. IEEE, 2017.
- [36] A Berthoz, B Pavard, and LR Young. Perception of linear horizontal self-motion induced by peripheral vision (linearvection) basic characteristics and visual-vestibular interactions. Experimental brain research, 23(5):471–489, 1975.
- [37] Bernard Pavard and Alain Berthoz. Linear acceleration modifies the perceived velocity of a moving visual scene. Perception, 6(5):529–540, 1977.
- [38] Jérémy Plouzeau, Jean-Rémy Chardonnet, and Frédéric Merienne. Using cybersickness indicators to adapt navigation in virtual reality: A pre-study. In 2018 IEEE Conference on Virtual Reality and 3D User Interfaces (VR), pages 661–662. IEEE, 2018.
- [39] Huyen TT Tran, Nam Pham Ngoc, Cuong T Pham, Yong Ju Jung, and Truong Cong Thang. A subjective study on qoe of 360 video for vr communication. In 2017 IEEE 19th International Workshop on Multimedia Signal Processing (MMSP), pages 1–6. IEEE, 2017.
- [40] Hak Gu Kim, Wissam J Baddar, Heoun-taek Lim, Hyunwook Jeong, and Yong Man Ro. Measurement of exceptional motion in vr video contents for vr sickness assessment using deep convolutional autoencoder. In Proceedings of the 23rd ACM Symposium on Virtual Reality Software and Technology, page 36. ACM, 2017.
- [41] Ajoy S Fernandes and Steven K Feiner. Combating vr sickness through subtle dynamic field-of-view modification. In 2016 IEEE Symposium on 3D User Interfaces (3DUI), pages 201–210. IEEE, 2016.
- [42] Nahal Norouzi, Gerd Bruder, and Greg Welch. Assessing vignetting as a means to reduce vr sickness during amplified head rotations. In Proceedings of the 15th ACM Symposium on Applied Perception, page 19. ACM, 2018.
- [43] Robert J Teather. Viewpoint snapping to reduce cybersickness in virtual reality.
- [44] Regis Kopper, Cheryl Stinson, and D Bowman. Towards an understanding of the effects of amplified head rotations. In The 3rd IEEE VR Workshop on Perceptual Illusions in Virtual Environments, volume 2, 2011.
- [45] Pulkit Budhiraja, Mark Roman Miller, Abhishek K Modi, and David Forsyth. Rotation blurring: Use of artificial blurring to reduce cybersickness in virtual reality first person shooters. arXiv preprint arXiv:1710.02599, 2017.
- [46] Miguel Melo, José Vasconcelos-Raposo, and Maximino Bessa. Presence and cybersickness in immersive content: effects of content type, exposure time and gender. Computers & Graphics, 71:159–165, 2018.
- [47] Willem Bles. Coriolis effects and motion sickness modelling. Brain research bulletin, 47(5):543–549, 1998.
- [48] Henry Been-Lirn Duh, Donald E Parker, and Thomas A Furness. An “independent visual background” reduced balance disturbance envoked by visual scene motion: implication for alleviating simulator sickness. In Proceedings of the SIGCHI conference on human factors in computing systems, pages 85–89. ACM, 2001.
- [49] Augusto Garcia-Agundez, Christian Reuter, Hagen Becker, Robert Konrad, Polona Caserman, André Miede, and Stefan Göbel. Development of a classifier to determine factors causing cybersickness in virtual reality environments. Games for health journal, 8(6):439–444, 2019.
- [50] Weina Jin, Jianyu Fan, Diane Gromala, and Philippe Pasquier. Automatic prediction of cybersickness for virtual reality games. In 2018 IEEE Games, Entertainment, Media Conference (GEM), pages 1–9. IEEE, 2018.
- [51] Hyun K Kim, Jaehyun Park, Yeongcheol Choi, and Mungyeong Choe. Virtual reality sickness questionnaire (vrsq): Motion sickness measurement index in a virtual reality environment. Applied ergonomics, 69:66–73, 2018.
- [52] Frank Biocca. Will simulation sickness slow down the diffusion of virtual environment technology? Presence: Teleoperators & Virtual Environments, 1(3):334–343, 1992.