THE ORIGIN OF A DISTRIBUTED STELLAR POPULATION IN THE STAR-FORMING REGION W4
Abstract
Stellar kinematics provides the key to understanding the formation process and dynamical evolution of stellar systems. Here, we present a kinematic study of the massive star-forming region W4 in the Cassiopeia OB6 association using the Gaia Data Release 2 and high-resolution optical spectra. This star-forming region is composed of a core cluster (IC 1805) and a stellar population distributed over 20 pc, which is a typical structural feature found in many OB associations. According to a classical model, this structural feature can be understood in the context of the dynamical evolution of a star cluster. The core-extended structure exhibits internally different kinematic properties. Stars in the core have an almost isotropic motion, and they appear to reach virial equilibrium given their velocity dispersion ( km s-1) comparable to that in a virial state (0.8 km s-1). On the other hand, the distributed population shows a clear pattern of radial expansion. From the -body simulation for the dynamical evolution of a model cluster in subvirial state, we reproduce the observed structure and kinematics of stars. This model cluster experiences collapse for the first 2 Myr. Some members begin to radially escape from the cluster after the initial collapse, eventually forming a distributed population. The internal structure and kinematics of the model cluster appear similar to those of W4. Our results support the idea that the stellar population distributed over 20 pc in W4 originate from the dynamical evolution of IC 1805.
1 INTRODUCTION
OB associations are prominent stellar systems in galaxies (Regan & Wilson, 1993; Bresolin et al., 1996; Pietrzyński et al., 2001; Garcia et al., 2009) because of the high-mass star population spread over a few tens of parsecs (Ambartsumian, 1947). Massive stars in such systems are engines that generate giant H II bubbles and play a decisive role in the chemical evolution of host galaxies. In addition, the majority of stars form in associations or clusters within them (Lada & Lada, 2003), and thereby field stars in the Galactic disk are considered to originate from the dissolution of these stellar systems (Miller & Scalo, 1978; Briceño et al., 2007). Despite their significant contribution to stellar populations in host galaxies, our understanding of their formation and evolution is still incomplete.
These large stellar systems are, in general, composed of a single or multiple star clusters in the central region and a distributed stellar population (hereafter DSP) at a large spatial scale (Blaauw, 1964; Koenig et al., 2012). These structural features may contain the clue to the formation process of these stellar systems. A classical model suggests that embedded clusters could undergo expansion after rapid gas expulsion (Lada et al., 1984; Kroupa et al., 2001). This dynamical process results in scattering of cluster members, and eventually leads to the formation of unbound OB associations. In addition, the structure of young star clusters can be highly affected by stellar feedback as it impacts on the timescale of gas expulsion and the dynamics of star clusters just before gas evacuation events (Gavagnin et al., 2017).
Some star clusters in several OB associations exhibit a sign of mass segregation (Hillenbrand & Hartmann, 1998; Chen et al., 2007; Sung et al., 2013). Dynamical mass segregation occurs on a timescale comparable to the relaxation time of given stellar systems, and it takes longer than ten crossing times for clusters with about 1000 members (Bonnell & Davies, 1998). However, clusters in OB associations are mostly younger than their relaxation times (Massey et al., 1995; Hillenbrand & Hartmann, 1998; Park & Sung, 2002; Sung et al., 2000). The stellar velocity dispersions measured in the Orion Nebula Cluster, NGC 2244, and NGC 6530 are weakly correlated with stellar masses (Jones & Walker, 1988; Chen et al., 2007). Hence, it has been claimed that the observed internal structures could have been formed by star formation in situ (Bonnell et al., 1998), rather than dynamical evolution via energy equipartition.
On the other hand, there are some attempts to understand the origin of mass segregation in terms of early dynamical evolution (McMillan et al., 2007; Allison et al., 2009, 2010). These theoretical studies considered the situation where several subgroups of stars in subvirial state form along the substructures in molecular clouds. Merging of these subgroups results in mass-segregated star clusters on a short timescale. Hence, it is still necessary to investigate the dynamics of stellar associations to understand their formation process.
In this study, we report the signature of early dynamical evolution in the massive star-forming region (SFR) W4 within the Cassiopeia OB6 association. W4 hosts a large number of massive OB stars and low-mass young stellar objects (Wolff, Strom, & Rebull, 2010; Sung et al., 2017; Roman-Lopes, 2019). This young stellar population forms a single central cluster (IC 1805) and a large structure that extends over 20 pc (Sung et al., 2017). This simple structural feature, compared to the other associations, provides us a better chance to isolate the history of the dynamical evolution in massive SFR. The observation and data that we used are described in Section 2. The selection of the kinematic members are addressed in Section 3. We probe the motions of stars using the Gaia proper motions (PMs) (Gaia Collaboration et al., 2018) and radial velocities (RVs) in Section 4. The dynamical state of this SFR is also investigated from velocity dispersions. From comparison with the results of an N-body simulation, a plausible explanation for the formation process of W4 is suggested in Section 5. Finally, we summarize our results in Section 6.
2 Data
Member candidates were obtained from the photometric catalogue of Sung et al. (2017). We selected stars with either ‘E’ or ‘e’ flag in this catalogue as early-type (O- or B-type) star candidates. On the other hand, stars satisfying at least one of the following criteria:
-
1.
H emission stars or candidates
-
2.
X-ray emission stars or candidates
-
3.
young stellar objects showing a flat spectrum
-
4.
Class II young stellar objects
-
5.
young stellar objects with transition disks or pre-transition disks
-
6.
Class III young stellar objects in PMS locus (see figure 22 of Sung et al. 2017)
are considered as pre-main sequence (PMS) star candidates. The RVs of these PMS star candidates have not yet been measured. Since PMS stars down to in W4 can be observed with large telescopes, we selected PMS star candidates brighter than 19 mag in visual band (or mag) for spectroscopic observation. The number of targets in our sample is 358 (115 early-type star and 243 PMS star candidates) in total.
2.1 Radial velocities
The optical spectra of low-mass stars contain a large number of metallic absorption lines. In addition, the rotational velocities of these low-mass young stars are smaller than those of high mass stars. Therefore, we can more precisely measure their RVs from high-resolution spectra compared to high mass stars. We observed 198 low-mass PMS star candidates on 2018 November 29 using the high-resolution () multi-object spectrograph Hectochelle (Szentgyorgyi et al., 2011) on the 6.5-m telescope of the MMT observatory. The spectra of these stars were taken with the RV31 filter in binning mode to achieve good signal-to-noise ratios. Dome flat and ThAr lamp spectra were also obtained just before and after the target observations.
All mosaiced frames were merged into single frames after overscan correction using the IRAF/MSCRED packages. We extracted one-dimensional (1D) spectra from the merged frames using the dofiber task in the IRAF/SPECRED package. Dome flat spectra were used to correct for the pixel-to-pixel variation. The solutions for the wavelength calibration obtained from ThAr spectra were applied to the target spectra. We obtained a master sky spectrum with an improved signal-to-noise ratio by median combining the spectra from a few tens of fibers assigned to the blank sky for a given setup. Target spectra were subtracted by an associated master sky spectrum and then combined into a single spectrum for the same target. Finally, target spectra were normalized by using continuum levels.
Our optical spectra contain a number of metallic absorption lines between 5150–5300 Å. To measure the RVs of the PMS stars, we applied a cross-correlation technique to the observed spectra. Several synthetic spectra adopting the Solar abundance were generated in the wide temperature range of 3800–9880 K using the MOOG code and Kurucz ODFNEW model atmosphere (Sneden, 1973; Castelli & Kurucz, 2004). These spectra were used as template spectra. We derived cross-correlation functions (CCF) of the observed spectra using the xcsao task in the RVSAO package (Kurtz & Mink, 1998) and selected the synthetic spectra that have the strongest CCF peak values. RVs were measured from the derived CCF peaks. The errors on RVs were estimated from the relation expressed as , where , , and represent the full widths at half-maximum of CCFs, their amplitudes, and the rms from antisymmetric components, respectively (Tonry & Davis, 1979; Kurtz & Mink, 1998). We measured the RVs of 172 out of 243 PMS star candidates in total. These RVs were converted to velocities in the local standard of rest frame using the IRAF/RVCOR task. The spectra of the other 26 stars have insufficient signals to derive CCFs.
2.2 Gaia data
The parallaxes and PMs of the member candidates were obtained from the Gaia Data Release 2 (DR2) (Gaia Collaboration et al., 2018). Their counterparts were searched for in this catalogue with a searching radius of . All but one have counterparts in the Gaia DR2. Errors on parallax and PMs from the Gaia catalogue (Gaia Collaboration et al., 2018) were adopted. These errors are correlated with the brightness of stars. The errors on parallax are about 0.03 mas on average for stars brighter than mag and better than 0.20 mas for stars brighter than mag. The mean values of PM errors along the R.A. and declination are about 0.04 and 0.05 mas yr-1, respectively, and these errors increase up to 0.20–0.25 mas yr-1 for faint stars.
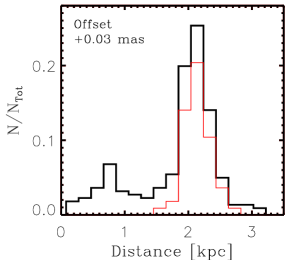
We did not use stars with negative parallaxes or close companion (duplication flag = 1), or without astrometric parameters in analysis. The distances to individual stars were computed by the inversion of the parallaxes (Gaia Collaboration et al., 2018) after correction for a systematic zero point of 0.03 mas from Lindegren et al. (2018).
3 MEMBERSHIP VALIDATION
In Sung et al. (2017), the member candidates were selected using multi-color photometric diagrams and a list of X-ray sources (Rauw & Nazé, 2016). However, their selection criteria are insufficient to isolate genuine members because a number of objects with similar properties to young stars can scatter along the line of sight. The most reliable members can be selected when combined with astrometric parameters.
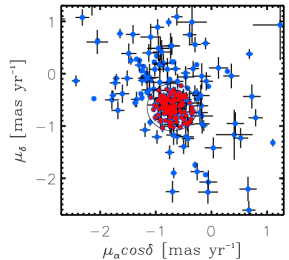
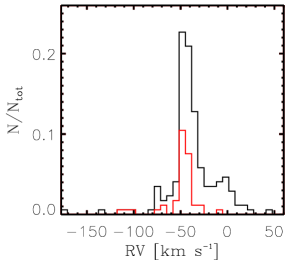
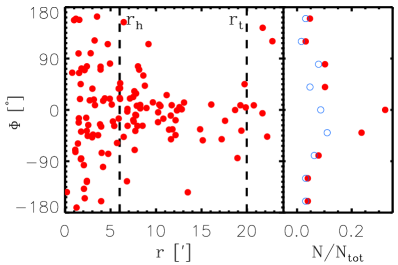
Fig. 1 displays the distributions of PMs, RVs, and distances for the member candidates. The most probable members form a dense group in the PM plane, while some candidates are distributed over a wide range of PMs. Similarly, the RV distribution has a strong peak at km s-1 with an extended wing component. In the distance distribution, there are foreground stars closer than 1.3 kpc. Thus, the candidates in the extended components are nonmembers.
In order to select genuine members, stars that are either closer than 1.3 kpc or farther than 3.0 kpc were first excluded. We set a circular region around a median PM value to encompass probable members (see the left panel in Fig. 1). In this region, stars with PMs within three times the standard deviations from the weighted mean values were selected as members, where the inverse of the squared PM error was used as the weight value. We obtained a new median PM value from the PMs of stars satisfying this criterion, and this procedure was repeated three times. A total of 127 members (55 early-type and 72 PMS stars) were selected. RVs were measured for about 62% of these PMS members (45/72). The RVs of the PMS members show a single Gaussian distribution (see the middle panel of Fig. 1).
Their distance distribution also has a single Gaussian peak at 2.1 kpc with a width of 0.2 kpc (the right panel of Fig. 1). We adopted this value as the distance to W4. Systematic errors of 0.2 kpc may exist due to the reported zero point offsets (Lindegren et al., 2018; Stassun & Torres, 2018; Zinn et al., 2019), however, this distance is reasonably consistent with previous studies within errors (Johnson & Svolopoulos, 1961; Humphreys, 1978; Massey et al., 1995; Sung et al., 2017; Cantat-Gaudin et al., 2018). We present a list of the kinematic members and their data in Table. 1.
Cantat-Gaudin et al. (2018) also selected the member candidates of IC 1805 using the Gaia DR2 (Gaia Collaboration et al., 2018) and published their catalogue. The number of members with membership probabilities greater than 0.5 is 136 in total, of which 83 overlap with our members. However, some member candidates in their catalogue are found below the PMS locus in the (, ) color-magnitude diagram. In addition, there are a few member candidates with far different PMs from the mean PM of IC 1805. We thus suggest to use member candidates with higher membership probabilities.
| Sq. | R.A. (2000) | Dec. (2000) | RV | (RV) | Binarity flag | ||||||||||||
|---|---|---|---|---|---|---|---|---|---|---|---|---|---|---|---|---|---|
| (h:m:s) | () | (mas) | (mas) | (mas yr-1) | (mas yr-1) | (mas yr-1) | (mas yr-1) | ( mag) | ( mag) | ( mag) | ( mag) | ( mag) | ( mag) | (km s-1) | (km s-1) | ||
| 1 | 02:29:45.93 | +61:34:42.1 | 0.3577 | 0.0587 | -0.531 | 0.062 | -0.471 | 0.097 | 16.3977 | 0.0005 | 17.4011 | 0.0056 | 15.3683 | 0.0016 | -43.785 | 0.445 | |
| 2 | 02:30:12.25 | +61:24:45.7 | 0.3473 | 0.0848 | -0.914 | 0.085 | -0.877 | 0.136 | 16.7894 | 0.0014 | 18.0058 | 0.0094 | 15.6706 | 0.0055 | -110.530 | 1.163 | |
| 3 | 02:30:15.39 | +61:23:42.1 | 0.4242 | 0.0206 | -1.040 | 0.022 | -0.685 | 0.033 | 13.2875 | 0.0002 | 13.9044 | 0.0012 | 12.5116 | 0.0008 | |||
| 4 | 02:30:57.84 | +61:14:26.7 | 0.3402 | 0.1175 | -0.902 | 0.128 | -0.648 | 0.203 | 17.7242 | 0.0023 | 18.8353 | 0.0315 | 16.6204 | 0.0095 | -44.269 | 3.120 | |
| 5 | 02:31:11.81 | +61:43:38.4 | 0.3308 | 0.0412 | -1.011 | 0.042 | -0.839 | 0.068 | 13.6276 | 0.0004 | 13.9894 | 0.0011 | 13.0748 | 0.0016 | |||
| 6 | 02:31:13.95 | +61:30:46.0 | 0.4859 | 0.1148 | -0.807 | 0.144 | -0.610 | 0.194 | 17.7973 | 0.0019 | 18.9303 | 0.0152 | 16.6720 | 0.0058 | 0.000 | ||
| 7 | 02:31:37.48 | +61:28:13.9 | 0.4994 | 0.1216 | -0.913 | 0.138 | -0.476 | 0.211 | 17.9111 | 0.0017 | 19.0084 | 0.0182 | 16.7412 | 0.0077 | -28.168 | 4.415 | |
| 8 | 02:31:47.85 | +61:27:32.5 | 0.4902 | 0.0279 | -0.897 | 0.031 | -0.560 | 0.050 | 15.0796 | 0.0003 | 15.6026 | 0.0019 | 14.3635 | 0.0011 | -10.097 | 1.564 | |
| 9 | 02:31:48.48 | +61:34:56.0 | 0.4104 | 0.0176 | -0.869 | 0.020 | -0.427 | 0.031 | 13.6410 | 0.0006 | 14.1459 | 0.0026 | 12.9615 | 0.0024 | |||
| 10 | 02:31:49.79 | +61:32:41.4 | 0.4580 | 0.0167 | -0.865 | 0.020 | -0.523 | 0.032 | 13.2861 | 0.0002 | 13.6591 | 0.0014 | 12.7244 | 0.0008 | |||
| 11 | 02:31:50.22 | +61:35:59.9 | 0.4067 | 0.0369 | -0.816 | 0.039 | -0.595 | 0.066 | 15.6844 | 0.0007 | 16.6313 | 0.0036 | 14.6993 | 0.0025 | -72.868 | 0.714 | |
| 12 | 02:31:50.73 | +61:33:32.3 | 0.4089 | 0.0388 | -0.683 | 0.045 | -0.313 | 0.067 | 15.9216 | 0.0006 | 16.8135 | 0.0051 | 14.9518 | 0.0032 | -38.942 | 7.406 | |
| 13 | 02:31:55.15 | +61:31:22.9 | 0.3927 | 0.0756 | -0.915 | 0.095 | -0.458 | 0.130 | 17.0618 | 0.0014 | 18.1185 | 0.0100 | 15.9640 | 0.0044 | -46.485 | 6.412 | |
| 14 | 02:32:02.43 | +61:37:13.2 | 0.4941 | 0.0297 | -0.827 | 0.034 | -0.491 | 0.052 | 15.2706 | 0.0003 | 15.9645 | 0.0016 | 14.4432 | 0.0011 | 0.000 | ||
| 15 | 02:32:06.48 | +61:29:54.3 | 0.4419 | 0.0178 | -0.846 | 0.020 | -0.683 | 0.031 | 13.5996 | 0.0002 | 14.1713 | 0.0014 | 12.8521 | 0.0007 | |||
| 16 | 02:32:07.03 | +61:45:33.8 | 0.4831 | 0.0467 | -0.941 | 0.052 | -0.322 | 0.085 | 15.8931 | 0.0010 | 16.9697 | 0.0067 | 14.8460 | 0.0029 | 0.000 | ||
| 17 | 02:32:07.91 | +61:24:51.4 | 0.4220 | 0.0352 | -0.736 | 0.042 | -0.962 | 0.062 | 15.4726 | 0.0040 | 16.3413 | 0.0149 | 14.4963 | 0.0075 | -57.268 | 1.667 | |
| 18 | 02:32:09.63 | +61:38:23.5 | 0.4338 | 0.0277 | -0.914 | 0.033 | -0.415 | 0.047 | 11.3079 | 0.0042 | 11.5875 | 0.0086 | 10.8703 | 0.0129 |
Note. — Column (1) : Sequential number. Columns (2) and (3) : The equatorial coordinates of members. Columns (4) and (5) : Absolute parallax and its standard error. Columns (6) and (7) : PM in the direction of right ascension and its standard error. Columns (8) and (9): PM in the direction of declination and its standard error. Columns (10) and (11) : magnitude and its standard error. Columns (12) and (13) : magnitude and its standard error. Columns (14) and (15) : magnitude and its standard error. Columns (16) and (17) : RV and its error. Columns (18) : Binarity flag. SB2 represents a double-lined spectroscopic binary candidate. The parallax and PM were taken from the Gaia Data Release 2 (Gaia Collaboration et al., 2018). The full table is available electronically.
4 DYNAMICAL STATE OF W4
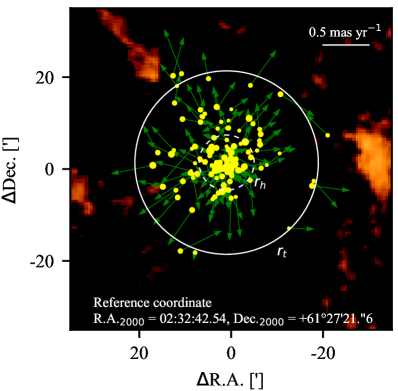
Fig. 2 displays the spatial distribution of the selected members. While a number of stars are found in the central region, some stars form a large structure that extends out to about 40 (equivalent to 24 pc). This extended structure is not featured by inclusion of nonmembers. A half-number radius () of this SFR obtained from our sample is about of 6 (3.7 pc), which is consistent with that () determined by Cantat-Gaudin et al. (2018). We define the structure within as the core and that outside this radius as the DSP.
We computed the tidal radius () of this SFR using the equation 3 of King (1962). The total masses of the cluster and the Galaxy were taken from previous studies (2700 from Sung et al. 2017 and from McMillan 2017, respectively). The tidal radius is estimated to be about 12 pc. The majority of the members exist within the tidal radius, which implies that the origin of the DSP is not the tidal disruption by the Galaxy.
The median PMs of the members are mas yr-1 and mas yr-1 along the R.A. and declination, respectively. These values are in good agreement with the mean PMs ( mas yr-1, mas yr-1) obtained by Cantat-Gaudin et al. (2018). The PM vectors of the members relative to the median PMs show outward motions (Fig. 2). This is the typical pattern of expansion as seen in other OB associations (Kuhn et al., 2019; Lim et al., 2019). To investigate these motions in detail, we computed the angle () between the radial vector of a given star from the cluster center (median coordinates) and its relative PM vector as introduced in our previous paper (Lim et al., 2019). Note that a value of 0∘ indicates radial expansion. Members in the core exhibit a uniform distribution (see the lower panels of Fig. 2), which indicates that the directions of their motions are almost isotropic. On the other hand, the members belonging to the DSP clearly show a radial expansion. Thus, the DSP seems to be a group of stars radially escaping from the core. These results are very similar to the kinematic properties of escaping stars from the Orion Nebula Cluster (Platais et al., 2020).
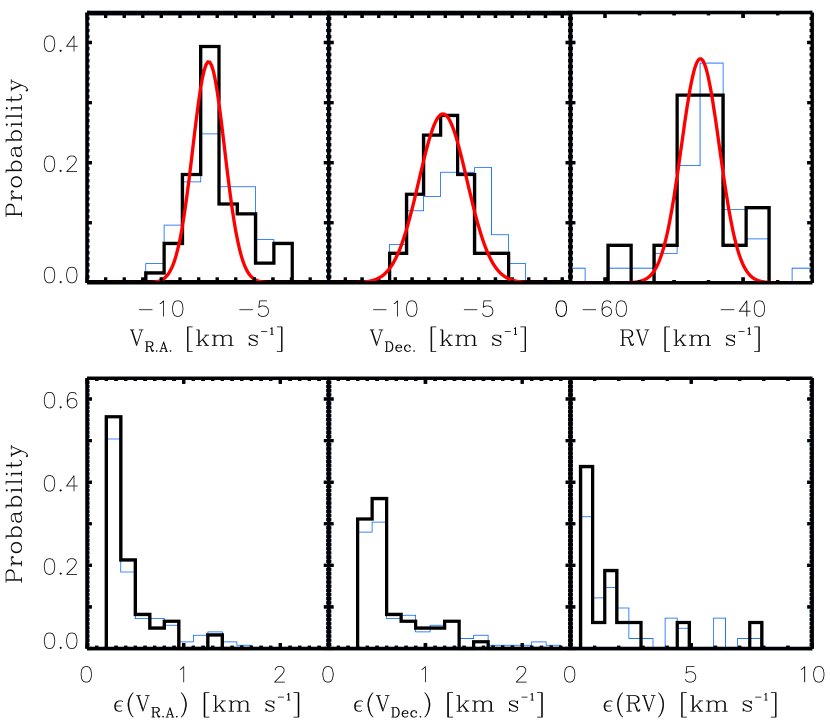
We investigate the dynamical state of this SFR using the velocity dispersions among the members. The 1D velocities along R.A. and declination were calculated multiplying PMs by the distance of 2.1 kpc. The errors due to the differences of distances among individual members are expected to be less than 1% because the extent of internal structure along the line of sight is very small compared to the distance to W4 assuming spherical symmetry. For the spectroscopic sample, stars in the RV range of km s -1 to km s-1 were used to minimize the contributions of close binary candidates with large amplitudes.
Fig. 3 displays the distributions of 1D velocities along R.A., declination, and the line of sight (, and RV). All the distributions appear close to the Gaussian distribution. Velocity dispersions were measured from the best-fit Gaussian widths. However, since the DSP is considered to be a group of stars escaping from the central cluster, including these stars can overestimate the kinematic velocity dispersion of this SFR. A similar aspect was found in the central region of the Orion Nebula Cluster (Kim et al., 2019). We therefore used only the members in the core. Indeed, the velocity dispersions for all the members appear larger than those for stars in the core (see Fig. 3 and Table 2).
| Sample | |||||||||
|---|---|---|---|---|---|---|---|---|---|
| (km s-1) | (km s-1) | (km s-1) | (km s-1) | (km s-1) | (km s-1) | (km s-1) | (km s-1) | (km s-1) | |
| All | 1.88 | 0.50 | 1.81 | 2.21 | 0.74 | 2.08 | 2.78 | 2.64 | 0.87 |
| 0.86 | 0.43 | 0.74 | 1.44 | 0.74 | 1.24 | 2.76 | 2.64 | 0.79 |
The representative observational errors were estimated from the weighted-mean of errors; where the weights were adopted from the probability functions presented in the lower panels of Fig. 3. The intrinsic velocity dispersions of , , and were then calculated to be about 0.74, 1.24, and 0.79 km s-1, respectively, after quadratic subtraction of the typical errors from the measured velocity dispersions. Systematic errors of 0.1 km s-1 due to the zero point offsets in parallax can be considered for and . We adopted the mean value of these intrinsic velocity dispersions [ (s.d.) km s-1] as the 1D velocity dispersion of W4.
The 1D velocity dispersion in virial state is given by the following equation (Parker & Wright, 2016);
| (1) |
where , , , and represent the gravitational constant, enclosed mass, radius, and the structure parameter, respectively. This SFR contains little gas inside the H II bubble according to the zeroth moment map of 12CO taken from Heyer et al. (1998) (see Fig. 2). Therefore, the total enclosed mass was assumed to be the total stellar mass of 2700 derived by Sung et al. (2017). The of 3.7 pc was adopted in equation 1. For , star clusters have a value between 1 to 11 depending on their surface densities (Portegies Zwart, McMillan & Gieles, 2010). W4 has a surface density profile with a core radius () of 0.7 pc (Sung et al., 2017). Since the concentration parameter ( 1.2) is smaller than 1.8, the value of 9.75 was adopted (Portegies Zwart, McMillan & Gieles, 2010). The virial velocity dispersion of this SFR was then estimated to be about 0.8 km s-1. The error on total stellar mass (300 ) from Sung et al. (2017) does not significantly affect the resultant velocity dispersion (less than 0.1 km s-1). The virial velocity dispersion is comparable to the measured one within the observational error. Therefore, our result indicates that the motions of stars in the core are close to virial equilibrium.
The adopted distance (2.1 kpc) is slightly smaller than that (2.4 kpc) derived by Sung et al. (2017). To test the effect of different distances on the total stellar mass, we simulated a simple stellar population with an age of 3.5 Myr using a Monte-Carlo technique. A total of 4500 stars were generated, based on the initial mass function of Kroupa (2001). Its total stellar mass is about 2771. The bolometric magnitudes and effective temperatures of these stars were obtained by interpolating their masses to evolutionary models for main sequence (Ekström et al., 2012) and PMS stars (Siess et al., 2000). We then dimmed their bolometric magnitudes by 0.3 mag. The masses of the artificial stars were rederived by interpolating the bolometric magnitudes and effective temperatures to the evolutionary tracks (Siess et al., 2000; Ekström et al., 2012). A total stellar mass was derived from the sum of these masses. As a result, the difference of 0.3 mag in distance modulus resulted in only about 5% error in total stellar mass.
5 THE ORIGIN OF THE DISTRIBUTED STELLAR POPULATION
Using the NBODY6++GPU code (Wang et al., 2015), we conducted the -body simulation of a model cluster to understand the observed structural and kinematic features in the context of dynamical evolution. The initial number of stars was set to 5,000, and their masses were drawn from the Kroupa initial mass function in the range from 0.1 to 100 (Kroupa, 2001). We adopted the density profile of King (1966) with the dimensionless concentration parameter . The initial half-mass radius and cutoff radius were set to be 2.3 pc and 8.6 pc, respectively. We considered the situation that the model cluster is initially in the extremely subvirial state; the initial virial ratio was set to 0.02 which is 25 times smaller than that of the virialized stellar system. However, the effects of the stellar evolution and gas expulsion affecting the potential of the cluster were ignored because there is no clear evidence for supernova explosions in this SFR.
We monitored the dynamical evolution of the model cluster by taking snapshots at given times. The model cluster undergoes collapse for the first 2 Myr and then begins to radially expand. The and tangential velocities () of the simulated stars were computed for comparison with those of stars in W4, where was calculated from the quadratic sum of and after subtracting the system velocity. Random errors on PM were introduced to the of these stars, based on the observational error distributions. In addition, the number ratio of low-mass stars in mass bins between 1 and 3 from the Kroupa initial mass function (Kroupa, 2001) was adjusted to that of the observed stars (Sung et al., 2017) to reproduce the incompleteness of our observations.
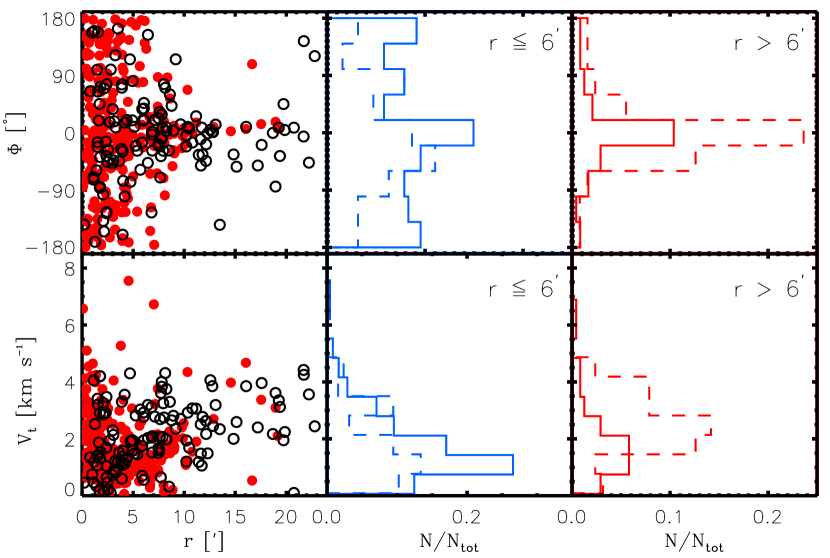
Fig. 4 compares the observed radial distributions of and with the simulated results at 3.9 Myr after the initial collapse. Note that this timescale does not necessarily mean the stellar age (3.5 Myr – Sung et al. 2017). Our simulation well reproduces the global trend in the radial variation of : the isotropic motion in the inner regions () and the outward motion in the outer regions (upper panels of Fig. 4). This result is also compatible with the simulation of early dynamical evolution of young star clusters that are dynamically cold and isolated from the external tidal field, and the discrepancy around between the simulation and observation is presumably due to the effect of Galactic tide (see figure 4 of Vesperini et al. 2014).
The of stars in the outer region (lower panels of Fig. 4) appear to increase with their radial distances in both simulation and observation. This radial variation is the consequence of close three-body encounters with massive stars during the collapse (Banerjee et al., 2012; Perets & Šubr, 2012; Oh & Kroupa, 2016; Gavagnin et al., 2017). Several young runaway stars that presumably originated from this dynamical process have been identified around the Orion Nebula (McBride & Kounkel, 2019). The distribution of simulated stars in the outer region does not exactly match the observed one. The number of the escaping stars and their velocities can be increased or decreased depending on the strength of stellar feedback (Gavagnin et al., 2017) and the levels of substructures (Schoettler et al., 2019). In addition, the latter condition can lead to violent dynamical evolution on a very short timescale (McMillan et al., 2007; Allison et al., 2009, 2010).
In conclusion, a single star cluster (IC 1805) with or without substructures formed in the W4 molecular cloud, and then this cluster might have experienced a cold collapse in the early epoch. Subsequently, a group of stars escaping from the cluster during the expanding phase might form the current DSP. Hence, the formation of the structure that extends over 20 pc in W4 can be understood in the context of dynamical evolution.
On the other hand, several groups of young stars are found at the border of the H II bubble surrounding W4 (Panwar et al., 2019). The current positions of these stars cannot be explained because the crossing time is larger than their age. These groups are mostly composed of low-mass PMS stars ( 4), and they are Myr younger than the IC 1805 members (Panwar et al., 2019). Therefore, the origin of these young stars may be related to feedback-driven star formation, rather than dynamical evolution of IC 1805. Indeed, circumstantial evidence for feedback-driven star formation has been steadily reported in other star-forming regions (Fukuda, et al., 2002; Sicilia-Aguilar et al., 2004; Koenig et al., 2008; Lim et al., 2014, etc). In the case of the SFR W8, the fraction of the second generation of stars accounts for at least 18% of the total stellar population (Lim et al., 2018), which implies that their contribution is far from being negligible. Hence, combining two different origins (dynamical evolution and feedback driven star formation) can help us better understand star formation taking place in OB associations.
6 SUMMARY
OB associations are the birth places of young stellar population in the Galactic disk, and they are ideal sites to understand star formation taking place at large spatial scales. W4 in the Cas OB6 association is one of active massive SFRs in the Galaxy. This SFR is composed of the young open cluster IC 1805 and a DSP surrounding the cluster. This structural feature is probably the relic of the formation process of W4. In this work, we investigated the origin of this structure using stellar kinematics.
The PMs from the recent Gaia DR2 (Gaia Collaboration et al., 2018) and RVs measured from high-resolution spectra were used to select bona-fide members and to probe their velocity fields. A total of 127 out of 358 candidates were confirmed to be kinematic members of W4. Members in the core have an almost isotropic motion, and their dynamical state is close to equilibrium. On the other hand, members belonging to the DSP show a clear pattern of radial expansion.
We considered the early dynamical evolution of a star cluster in subvirial state and performed an -body simulation. The properties of a model cluster were compared with the observed ones. Although we did not take into account the effects of stellar evolution and gas expulsion on the dynamics of the cluster, this simulation well reproduced the radial variation of projected stellar motions. Hence, our results suggest that the origin of the DSP distributed over 20 pc is the result of the dynamical evolution of IC 1805.
References
- Allison et al. (2010) Allison, R. J., Goodwin, S. P., Parker, R. J., Portegies Zwart, S. F., & de Grijs, R. 2010, MNRAS, 407, 1098
- Allison et al. (2009) Allison, R. J., Goodwin, S. P., Parker, R. J., et al. 2009, ApJ, 700, L99
- Ambartsumian (1947) Ambartsumian, V. A. 1947, In Stellar Evolution and Astrophysics, Armenian Acad. of sci. (German translation, 1951, Abhandl, Sowjetischen Astron., 1, 33.).
- Banerjee et al. (2012) Banerjee, S., Kroupa, P., & Oh, S. 2012, ApJ, 746, 15B
- Blaauw (1964) Blaauw, A. 1964, ARA&A, 2, 213
- Bonnell et al. (1998) Bonnell, I. A., Bate, M. R., & Zinnecker, H. 1998, MNRAS, 298, 93
- Bonnell & Davies (1998) Bonnell, I. A., & Davies, M. B. 1998, MNRAS, 295, 691
- Bresolin et al. (1996) Bresolin, F., Kennicutt, R. C. Jr., & Stetson, P. B. 1996, AJ, 112, 1009
- Briceño et al. (2007) Briceño, C., Preibisch, T., Sherry, W. H., et al. 2007, Protostars and Planets V, 345
- Brown et al. (1999) Brown A. G. A., Blaauw A., Hoogerwerf R., de Bruijne J. H. J. & de Zeeuw P. T. 1999, in NATO ASIC Proc. 540: The Origin of Stars and Planetary Systems, ed. C. J. L. N. D. Kylafis, 411
- Cantat-Gaudin et al. (2018) Cantat-Gaudin, T. et al. 2019, A&A, 618, 93
- Castelli & Kurucz (2004) Castelli, F., & Kurucz, R. L. 2004, ArXiv Astrophysics e-prints [arXiv:astro-ph/0405087]
- Chen et al. (2007) Chen, L., de Grijs, R., & Zhao, J. L. 2007, AJ, 134, 1368
- Ekström et al. (2012) Ekström, S., Georgy, C., Eggenberger, P., et al., 2012, A&A, 537, 146
- Freedman & Diaconis (1981) Freedman, D., & Diaconis, P. 1981, Zeitschrift für Wahrscheinlichkeitstheorie und Verwandte Gebiete, 57, 453
- Fukuda, et al. (2002) Fukuda, N., Hanawa, T., Sugitani, K. 2002, ApJ, 568, 127
- Gaia Collaboration et al. (2018) Gaia Collaboration et al. 2018, A&A, 616, A1
- Garcia et al. (2009) Garcia, M. et al. 2009, A&A, 502, 1015
- Gavagnin et al. (2017) Gavagnin, E., Bleuler, A., Rosdahl, J., & Teyssier, R. 2017, MNRAS, 472, 4155
- Heyer et al. (1998) Heyer, M. H., Brunt, C., Snell, R. L., et al. 1998, ApJS, 115, 241
- Hillenbrand & Hartmann (1998) Hillenbrand, L. A., & Hartmann, L. W. 1998, ApJ, 492, 540
- Humphreys (1978) Humphreys, R. M. 1978, ApJS, 38, 309
- Johnson & Svolopoulos (1961) Johnson, H. L., & Svolopoulos, S. N. 1961, ApJ, 134, 868
- Jones & Walker (1988) Jones, B. F., & Walker, M. F. 1988, AJ, 95, 1755
- Kim et al. (2019) Kim, D., Lu, J. R., Konopacky, Q., et al. 2019, AJ, 157, 109
- King (1962) King, I. 1962, AJ, 67, 471
- King (1966) King, I. 1966, AJ, 71, 64
- Koenig et al. (2008) Koenig, X. P., Allen, L. E., Gutermuth, R. A., Hora, J. L. 2008, ApJ, 688, 1142
- Koenig et al. (2012) Koenig, X. P., Leisawitz, D. T., Benford, D. J., et al. 2012, ApJ, 744, 130
- Kroupa (2001) Kroupa, P. 2001, MNRAS, 322, 231
- Kroupa et al. (2001) Kroupa, P., Aarseth, S. & Hurley, J. 2001, MNRAS, 321, 699
- Kuhn et al. (2019) Kuhn, M. A., et al. 2019, ApJ, 870, 32
- Kurtz & Mink (1998) Kurtz, M. J. & Mink, D. J. 1998, PASP, 110, 934
- Lada & Lada (2003) Lada, C., & Lada, E. 2003, ARA&A, 41, 57
- Lada et al. (1984) Lada, C., Margulis, M., & Dearborn, D. 1984, ApJ, 285, 141
- Lim et al. (2014) Lim, B., Sung, H., Kim, J. S., Bessell, M. S., Park, B.-G. 2014, MNRAS, 443, 454
- Lim et al. (2018) Lim, B. et al. 2018, MNRAS, 477, 1993
- Lim et al. (2019) Lim, B., Nazé, Y., Gosset, E., & Rauw, G. 2019, MNRAS, 490, 440
- Lindegren et al. (2018) Lindegren, L., et al., 2018, A&A, 616, A2
- Massey et al. (1995) Massey P., Johnson K. E., & DeGioia-Eastwood K., 1995, ApJ, 454, 151
- McBride & Kounkel (2019) McBride, A., & Kounkel, M. 2019, ApJ, 884, 6
- McMillan (2017) McMillan, P. J. 2017, MNRAS, 465, 76
- McMillan et al. (2007) McMillan, S. L. W., Vesperini, E., & Portegies Zwart, S. F. 2007, ApJ, 655, L45
- Miller & Scalo (1978) Miller, G. E. & Scalo, J. M. 1978, PASP, 90, 506
- Oh & Kroupa (2016) Oh, S., & Kroup, P. 2016, A&A, 590, 107
- Panwar et al. (2019) Panwar, N., Samal, M. R., Pandey, A. K., Singh, H. P., Sharma, S. 2019, AJ, 157, 112
- Park & Sung (2002) Park, B.-G., & Sung, H. 2002, AJ, 123, 892
- Parker & Wright (2016) Parker, R. J., & Wright, N. J. 2016, MNRAS, 457, 3430
- Perets & Šubr (2012) Perets, H. B. & Šubr, L. 2012, ApJ, 751, 133
- Pietrzyński et al. (2001) Pietrzyński, G., Gieren, W., Fouqué, P., & Pont, F. 2001, A&A, 371, 497
- Platais et al. (2020) Platais, I., Robberto, M., Bellini, A., et al. AJ, 159, 272
- Portegies Zwart, McMillan & Gieles (2010) Portegies Zwart S. F., McMillan S. L. W., & Gieles M., 2010, ARA&A, 48, 431
- Rauw & Nazé (2016) Rauw, G., & Nazé, Y. 2016, A&A, 594, 82
- Regan & Wilson (1993) Regan, M. W., & Wilson, C. D. 1993, AJ, 105, 499
- Roman-Lopes (2019) Roman-Lopes, A., et al. 2019, ApJ, 873, 66
- Schoettler et al. (2019) Schoettler, C., Parker, R. J., Arnold, B., et al. 2019, MNRAS, 487, 4615
- Sicilia-Aguilar et al. (2004) Sicilia-Aguilar, A., Hartmann, L. W., Briceño, C., Muzerolle, J., Calvet, N. 2004, AJ, 128, 805
- Siess et al. (2000) Siess, L., Dufour, E., Forestini, M. 2000, A&A, 358, 5931
- Sneden (1973) Sneden, C. A. 1973, Ph.D. Thesis, The University of Texas at Austin, USA
- Stassun & Torres (2018) Stassun, K. G., & Torres, G. 2018, ApJ, 862, 61
- Sung et al. (2017) Sung, H., Bessell, M. S., Chun, M.-Y., et al. 2017, ApJS, 230, 3
- Sung et al. (2000) Sung, H., Chun, M.-Y., & Bessell, M. S. 2000, AJ, 120, 333
- Sung et al. (2013) Sung, H., Sana, H., & Bessell, M. S. 2013, AJ, 145, 37
- Szentgyorgyi et al. (2011) Szentgyorgyi, A., Furesz, G., Cheimets, P., et al. 2011, PASP, 123, 1188
- Tonry & Davis (1979) Tonry, J. & Davis, M. 1979, AJ, 84, 1511
- Vesperini et al. (2014) Vesperini, E., Varri, A. L., McMillan, S. L. W., & Zepf, S. E. 2014, 443, 79
- Wang et al. (2015) Wang, L., Spurzem, R., Aarseth, S., et al. 2015, MNRAS, 450, 4070
- Wolff, Strom, & Rebull (2010) Wolff, S. C., Strom, S. E., & Rebull, L. M. 2010, ApJ, 726, 19
- Zinn et al. (2019) Zinn, J. C., Pinsonneault, M. H., Huber, D., & Stello, D. 2018, ApJ, 878, 136Z