Gas kinematics of key prebiotic molecules in GV Tau N revealed with an ALMA, PdBI, and Herschel synergy
Abstract
A large effort has been made to detect warm gas in the planet formation zone of circumstellar discs using space and ground-based near infrared facilities. GV Tau N, the most obscured component of the GV Tau system, is an outstanding source, being one of the first targets detected in HCN and the only one detected in CH4 so far. Although near infrared observations have shed light on its chemical content, the physical structure and kinematics of the circumstellar matter remained unknown. We use interferometric images of the HCN 32 and 13CO 32 lines, and far-IR observations of 13CO, HCN, CN and H2O transitions to discern the morphology, kinematics, and chemistry of the dense gas close to the star. These observations constitute the first detection of H2O towards GV Tau N. Moreover, ALMA high spatial resolution ( 7 au) images of the continuum at 1.1 mm and the HCN 32 line resolve different gas components towards GV Tau N, a gaseous disc with R25 au, an ionized jet, and one (or two) molecular outflows. The asymmetric morphology of the gaseous disc shows that it has been eroded by the jet. All observations can be explained if GV Tau N is binary, and the primary component has a highly inclined individual disc relative to the circumbinary disc. We discuss the origin of the water and the other molecules emission according to this scenario. In particular, we propose that the water emission would come from the disrupted gaseous disc and the molecular outflows.
keywords:
stars: formation – stars: individual (GV Tau N) – stars: variables: T Tauri – protoplanetary discs – ISM: jets and outflows – astrochemistry1 Introduction
A fraction of the gas and dust in protoplanetary discs will end up in planets and may constitute the basis to form prebiotic species. A large effort has been made to detect the warm gas in the planet formation zone using Spitzer and ground-based facilities such as the Very Large Telescope (VLT) and the Keck Observatory telescopes. In a pioneering work, Lahuis et al. (2006) detected strong HCN absorption toward one source, IRS 46, from a sample of more than 100 Class I and II sources located in nearby star-forming regions. Later, Gibb et al. (2007) detected the HCN absorption in GV Tau. Since then, the observation of absorption and emission lines have provided a view of the molecular content of the very inner regions of protoplanetary discs with several detections of molecules such as CO, CO2, H2O, OH, HCN, and C2H2 (Salyk et al., 2007, 2008, 2011; Salyk et al., 2019; Carr & Najita, 2008, 2011, 2014; Pontoppidan et al., 2010; Najita et al., 2010; Najita et al., 2013; Kruger et al., 2011; Doppmann et al., 2008; Doppmann et al., 2011; Fedele et al., 2011; Mandell et al., 2012; Bast et al., 2013; Gibb & Horne, 2013; Sargent et al., 2014; Banzatti et al., 2017). In addition, the organic species CH4 has been detected towards GV Tau N (Gibb & Horne, 2013). In many cases the profiles of the detected lines are broad and centrally peaked (Mandell et al., 2012; Salyk et al., 2019). This kind of centrally peaked profile is observed even for discs with previously determined high inclination angle and has been interpreted as emission from a disc wind. By now, direct imaging of the circumstellar material remains difficult with current telescopes, which challenges the interpretation.
The launch of the Herschel Space Observatory allowed to investigate the chemical content of discs at far-IR wavelengths (Thi et al., 2011; Salinas et al., 2016), providing valuable information on the abundance of H2O in large disc samples (Hogerheijde et al., 2011; Riviere-Marichalar et al., 2012; Meeus et al., 2012; Fedele et al., 2012, 2013; Podio et al., 2013; Salinas et al., 2016; Alonso-Martínez et al., 2017). Warm water coming from the inner R23 au disc region was detected through the 63.3 m line observed with PACS (Riviere-Marichalar et al., 2012; Meeus et al., 2012). The emission of the ground ortho and para water lines are thought to originate in the disc surfaces where UV radiation desorbs the water from the icy mantles (Hogerheijde et al., 2011; Podio et al., 2013; Salinas et al., 2016). In Class I sources, a fraction of the warm water can be emitted in shocks along the outflow cavity as well (Kristensen et al., 2012; Karska et al., 2013; Mottram et al., 2014). Thus, the study of far-IR H2O lines provides essential information to characterize the H2O abundance from the inner to the cold outer regions of discs. Moreover, several guaranteed and open time Herschel Key Programs: "Water In star-forming regions with Herschel" (WISH; van Dishoeck et al., 2011), "CHEmical Survey of Star-forming regions" (CHESS; Ceccarelli et al., 2010), "Dust, Ice and Gas in Time" (DIGIT; Green et al., 2013), and "GAS in protoplanetary systems (GASPS Mathews et al., 2010; Dent et al., 2013), have provided information on water in a large number of low-mass protostars at different evolutionary stages, allowing us to figure out how water is transported from the molecular cloud to planet-forming discs.
The chemical composition of discs in Class I protostars is receiving increasing attention. The presence of discs in all Class 0 protostars (ages0.2 Myr) is still debated (see e.g. Maret et al., 2020). If indeed discs are present, their masses have been suggested to be high (0.050.1 M⊙; Jørgensen et al., 2009) and they might be gravitationally unstable. Conversely, the masses of Class II discs in Taurus and Orion (ages15 Myr) have been well studied and are found to have a median mass of 0.001 M⊙ (e.g. Eisner et al., 2008; Andrews et al., 2013; Tobin et al., 2020). These median masses are low compared with the amount of matter needed to form giant planets, estimated to be 0.010.1 M⊙ (e.g. Weidenschilling, 1977; Desch, 2007). Class I discs would then be in a transitional stage between massive, highly unstable protoplanetary discs to stable discs in which planet formation is progressing. The discs around Class I objects may therefore accurately represent the initial mass budget for forming planets.
GV Tau (Haro 6-10) is a T Tauri binary system embedded in the L1524 molecular cloud (d=18017 pc) (Gaia Collaboration, 2018). It is one of the few young binary systems with the primary source (GV Tau S) optically visible, and the companion (GV Tau N), located 1.2 to the North, obscured. It is associated with a parsec-scale Herbig-Haro flow which extends for 1.6 pc to the North and 1 pc to the South (Devine et al., 1999; Movsessian & Magakian, 1999). Both stars have been classified as Class I objects with masses of M0.8 M⊙ and ages of 3 Myr (Doppmann et al., 2008). Only the GV Tau N disc has been detected in the HCN and C2H2 absorption ro-vibrational lines (Gibb et al., 2007, 2008). Indeed GV Tau N is an outstanding source, being one of the first targets detected in HCN and the only one detected in CH4 (Gibb & Horne, 2013). Moreover, the mass of its protoplanetary disc falls near the Minimum Mass Solar Nebula, and it may have just enough mass to form giant planets (Sheehan & Eisner, 2014). Being a Class I disc with a chemistry rich in organic species, GV Tau N is a priority target to investigate how organics are delivered from the gas rich disc to planets. Fuente et al. (2012) reported interferometric images of the HCN 32 and HCO+ 32 lines at an angular resolution of 50 au. Only the HCN 32 emission was detected towards GV Tau N, and was interpreted as coming from the unresolved planet forming region.
This paper explores the physical structure, kinematics, and chemistry of the gas in the planet forming region of GV Tau N based on high spatial resolution images of the HCN 32 and the 13CO 32 lines, and far-IR observations of the high excitation lines of 13CO, H2O, HCN and CN. In particular, we present the first water detection in this system.
2 Observations
GV Tau was observed with the IRAM111IRAM is supported by INSU/CNRS (France), MPG (Germany), and IGN (Spain) Plateau de Bure Interferometer (PdBI), the Atacama Large Millimeter/sub-millimeter Array (ALMA) and the HIFI instrument (de Graauw et al., 2010) on board the Herschel Space Telescope (Pilbratt et al., 2010). Observations of the 13CO 32 and C18O 32 lines were carried out using the Plateau de Bure Interferometer (PdBI) in its A configuration during October-November, 2014. This configuration provided a beam of 0.35 0.18 PA 25∘ (63 au32 au at the Taurus distance). During the observations two 40 MHz correlator units were placed at the frequencies of the 13CO (330.588 GHz) and C18O 32 (329.330 GHz) lines providing a spectral resolution of 78 kHz. The C18O 32 line was not detected with an rms of 46 mJy/beam. Calibration and imaging were performed using the Grenoble Image and Line Data Analysis Software (GILDAS; Pety, 2005).
Our study uses the HCN 32 line observations obtained from the ALMA archive. These observations were performed during Cycle 4 within project number 2016.1.00813.S. The line was observed with a spectral resolution of 488.25 kHz and the synthesized beam is 0.07′′ 0.04′′ with PA 27∘. This provides an unprecedented spatial resolution of 12 au7 au and the achieved rms is 2.4 mJy/beam. We produced a 1.1 mm continuum image with the channels and spectral windows empty of line emission. The continuum image has a synthesized beam of 0.06 0.03 with PA 27∘, and a rms of 0.13 mJy/beam. The data were manually calibrated using the 4.7.1 version of the Common Astronomy Software Applications (CASA; McMullin et al., 2007) while the imaging process was performed using CASA version 5.4.1 following the National Radio Astronomy Observatory (NRAO) imaging guide.
The Herschel Space Observatory (Pilbratt et al., 2010) observations presented here were obtained with the heterodyne instrument for the far infrared HIFI (de Graauw et al., 2010) (OT1_afuente_2). The basic data reduction was performed using the standard pipeline provided with the version 7.0 of HIPE (Ott, 2010) and then exported to GILDAS/CLASS (Pety, 2005) for a more detailed analysis.
3 (Sub-)millimeter interferometric images
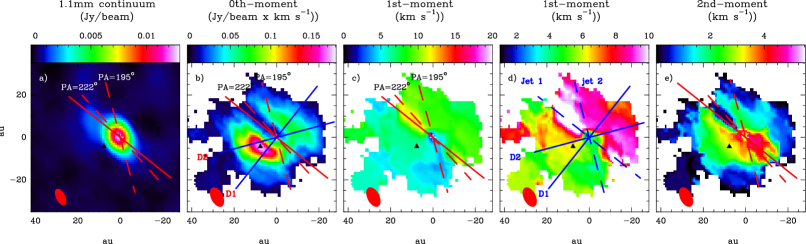
Fig. 1 shows the high angular resolution 1.1 mm continuum image obtained from ALMA data. Based on a 2D Gaussian fit, we derive the flux, position and size of the compact continuum source. The estimated flux is 48 mJy which is in good agreement with the previous measurement by Fuente et al. (2012). The size of the compact source is 941 mas661 mas, which constrains the radius of the dusty circumstellar disc to R8 au. In addition to the compact source, elongated emission is detected in the direction of the outflow at 10 level (see Fig. 1). It should be noted that the coordinates of the compact continuum source are (J2000) .731, (J2000) .11. This position is offset 0.19′′ to the South as compared to the position measured by Fuente et al. (2012), which would imply proper motion of (0,34) mas yr-1. The most recent estimation of the proper motions of GV Tau N are (8.6950.853) mas yr-1 in right ascension, and (25.085 0.672) mas yr-1 in declination (Gaia Collaboration, 2018). Taking into account the lower angular resolution of Fuente et al. (2012), beam0.5′′, we consider that the observed displacement can be due to the proper motions of GV Tau N. The position of the continuum source is adopted as offset (0′′,0′′) through this paper.
Reipurth et al. (2004) measured a 3.6 cm flux of 0.100.01 mJy towards GV Tau N. We estimate a flux of 4.60.5 mJy for the extended component, which would imply a 3.6 cm to 1.1 mm spectral index, 1.1. This spectral index is higher than the one expected for an ionized spherical wind, +0.6, and usually found in T Tauri and Herbig Ae/Be stars (Skinner et al., 1993; Alonso-Albi et al., 2009). This higher spectral index is still consistent with an ionized wind but with unconventional assumptions, i.e a velocity power law v(R)R or a density law, ne(R)R-3 (Panagia, 1988). We should also consider the possibility that radio emission has varied on time scales of tens of years. Variability is a common phenomenum in young T Tauri systems (Ubach et al., 2017; Liu et al., 2017). It would be also possible that we have overestimated the flux coming from the jet because a fraction of the extended emission is coming from dust thermal emission. Simultaneous measurements of the flux at several wavelengths would be desirable to further constrain the cm-mm spectral index.
Mid-infrared interferometry (VLTI/MIDI) observations to probe the circumstellar material around GV Tau N and S were carried out by Roccatagliata et al. (2011). They modeled the emission assuming the existence of two different black-body components, which accounts for the different disc regions. They obtained that the emission within 1.5 au has a temperature of 900 K, while a second colder emission at 150 K originates within 10 au from the central star. The sizes of these two components are consistent with the size of the 1.1mm compact source as observed with ALMA for which we derive a radius R8 au. Based on the measureded visibilities, they estimate an inclination, for the GV Tau N disc. This value is consistent with GV Tau N being a highly obscured star.
Intense emission of the HCN 32 line is detected towards GV Tau N. We have produced the zero-moment map using only the channels with emission 3. Based on this map, we estimate that the size of the HCN emission is R0.18, significantly larger than the small compact continuum clump (see Fig. 1). The total velocity integrated flux within R0.18 is 1.4 Jy/beamkm s-1. In order to check for possible filtering in the HCN 32 line map, we have compared ALMA fluxes with those measured by Fuente et al. (2012) using the PdBI. Fuente et al. (2012) derived a total flux of 3.640.21 Jykm s-1 in a region of 0.32′′ 0.25′′. Therefore, the high spatial resolution ALMA observations recover 40% of the flux detected in PdBI observations. This is consistent with the zero-moment map shown in Fig. 1, which presents evidence of a resolved component that extends towards the East.
An intense and asymmetric molecular ring is observed in the HCN 32 image shown in Fig. 1. The inner and outer radii of this ring are Rin0.04 (6 au) and Rout0.18 (17 au), respectively. In the azimuthal direction, the minimum of emission is located in the outflow direction, suggesting that the jet has eroded the circumstellar material, sweeping out the molecular gas. In Fig 1 we also show the HCN 32 spectra towards the star and the emission peak in the molecular ring. The velocity profile towards the star is wide, with Full Width Half Power (FWHP) of 12 kms-1, and asymmetric, with the emission at highest velocities in the redshifted range. The spectrum towards the emission peak is narrower with FWHP10 km s-1, and presents two peaks located at blue-shifted and red-shifted velocities with respect to the systemic velocity, which is not expected in a pure rotation scenario. This wide line is not surprising and it is most likely due to the strong interaction between the jet and the surrounding molecular gas. Also, self-absorption by the lower density envelope at the systemic velocity would produce the two-peak feature.
The 13CO 32 line is detected towards GV Tau N with a complex profile (see Fig. 1). The emission presents high velocity wings at the same velocities as the HCN 32 spectrum. In addition, a narrow, FWHP2 km s-1, absorption feature is observed at vlsr = 9.0 km s-1, i.e., red-shifted from the systemic velocity of vlsr = 6.3 km s-1 and consistent with the emission coming from infalling gas. It is interesting to note that Doppmann et al. (2008) detected HCN and C2H2 absorbing gas at vlsr = 8.70.3 km s-1 (blue-dashed line in Fig. 1), which is close to the velocity of the absorption detected in 13CO. The signal-to-noise ratio of our 13CO 32 observations does not allow to obtain a good quality image.
4 Far Infrared lines
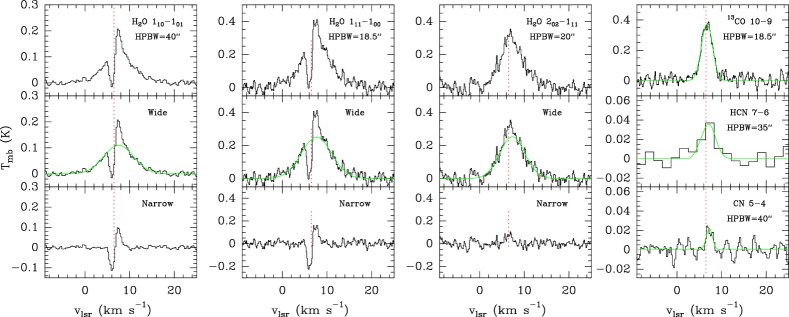
High excitation lines of 13CO, H2O, HCN and CN were observed with high spectral resolution using the instrument HIFI onboard Herschel (see Fig. 2). High signal-to-noise detections were obtained for the 13CO 109, and H2O 111000, 110101 and 202111 lines. The HCN 76 and CN 65 lines were detected at 4 level (see Fig. 2). Unfortunately, the Herschel angular resolution does not allow to resolve the two components of the binary, GV Tau N and GV Tau S, and we need to use the kinematic information to discern the origin of the observed lines.
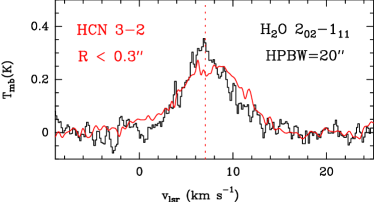
It is remarkable the difference between the profile of the 13CO 109 line and those of the H2O lines. The 13CO 109 line presents a narrow profile, with FWHP2.7 km s-1, and is centered at vlsr=6.740.05 km s-1. The profiles of the ground ortho- and para-water lines are significantly wider, and show a strong absorption at vlsr6.0 km s-1. The absorption is not observed in the higher excitation p-H2O 202111 line (Eu/k100 K). Indeed, the profile of the water lines can be fitted using two components: i) a wide Gaussian with FWHP 8 km s-1, and (ii) a narrower component with FWHP2.7 km s-1, similar to 13CO. Fig. 2 shows the decomposition of the water line profiles in these two components that we hereafter name wide and narrow components. The Gaussian fits to these components are shown in Table 2. It is specially interesting to discern whether the emission of the wide component arises in the compact gaseous disc detected with the ALMA maps or it is coming from a large scale outflow(s). In order to explore the origin of this component, we compare its profile with the mean HCN 32 spectrum in the region R0.3 (see Fig. 3). The wings of the p-H2O 202111 line are similar to those of the interferometric HCN 32 line, suggesting that the origin might be similar. We further discuss the origin of this component in Section 6.
In the bottom panels of Fig. 2 we show the profiles of the water narrow component. This component presents absorption at blue-shifted velocities. We recall that the absorptions observed in the NIR observations lie at red-shifted velocities, 8.7 km s-1. An absorption at similar velocity, 9 km s-1, has been observed in our PdBI spectrum of the 13CO 32 line. Thus, the blue absorption features detected in the FIR water lines are more likely caused by a colder layer in the outer envelope. Fig. 2 also shows the spectra of the HCN 76 and CN 54 lines. These spectra only present the narrow component. We cannot discard, however, the existence of a weaker wide component that it is not detected because of the low S/N of the detections. This should be the case of HCN 76, for which emission presents a slightly wider spectrum. It should be noticed that the peak of the weak and narrow HCN 76 lines is at the velocity of the dip observed in the ALMA HCN 32 profile, suggesting that the narrow line observed with Herschel is probing the lower density envelope.
5 Kinematics of the molecular gas
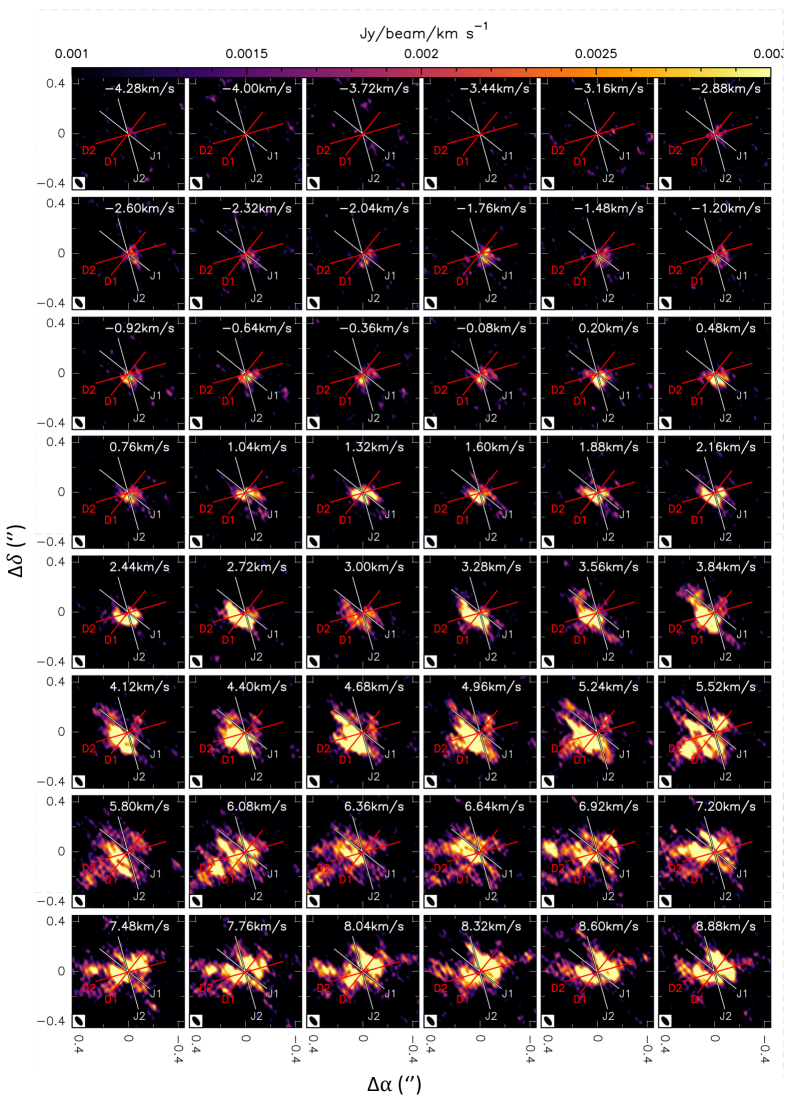
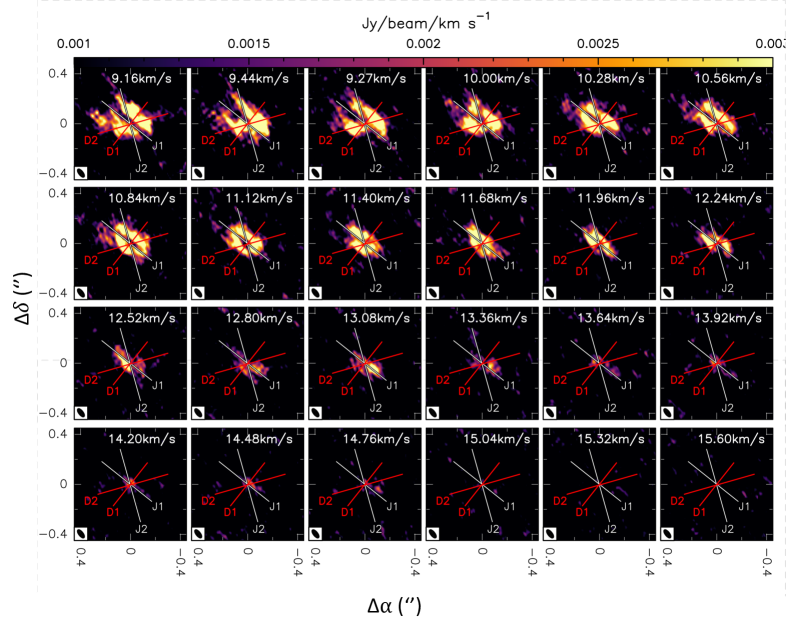
In Fig. 4 we present the first and second moment maps of the HCN 32 emisison as observed with ALMA. The emission at high red- and blue-shifted velocities, 4 km s-1, shows the presence of two misaligned outflow lobes: the red lobe is close to the direction defined by the giant Herbig Haro flow, PA=222∘ (Devine et al., 1999) (hereafter, ), and the blue lobe is placed at PA=195∘, the direction of the Herbig Haro jet detected by Movsessian & Magakian (1999) (hereafter, ). This misalignment can be interpreted as the consequence of a precessing bipolar outflow. Alternatively, these lobes might belong to two different bipolar outflows.
In order to discern between these two scenarios we inspect the channel maps shown in Fig. 7 and Fig. 8. The directions of and are indicated in each panel. The red lobe of is clearly seen in panels =10.28 km s-1 to 13.36 km s-1, located SW from the star. The blue counterpart is missing in the HCN 32 channels maps. The molecular outflow is formed by the circumstellar matter that is being swept up by the ionized jet. The lack of a blue lobe is due to the absence of the molecular gas in this direction, where a wide cavity has already being excavated by the jet, and the molecular gas has been cleaned. The existence of high velocity gas along is not such clear since the kinematic signatures of the blue and red lobes are mixed with the disc rotation. High velocity gas along is detected in panels =1.48 km s-1 to 2.16 km s-1. Fig. 8 shows that high velocity gas is detected in panels =13.08 km s-1 to 14.48.16 km s-1 which is located in the direction and can be interpreted as the red lobe of this outflow. Given the angular resolution of the observations, it might also be associated to the walls of the cavity excavated by .
Fig. 5 shows the position-velocity (p-v) diagrams along and . The p-v diagram presents clumpy emission with small changes in the velocity between one small bright clump and the following. These bright spots are also observed as narrow features in the HCN 32 spectrum shown in Fig 1. This kind of "saw-like" features have been detected in high velocity jets and were interpreted as oblique shocks formed in the interphase between the high velocity jet and the circumstellar matter (Santiago-García et al., 2009). In this scenario, the clumps at red-shifted and blue-shifted velocities correspond to the back and front walls of the cavity excavated by the jet in the gaseous disc. This interpretation is also consistent with the morphology observed in the zero moment map of the HCN 32 emission (see Fig. 1). The outflow crosses the molecular ring through the azimuthal minimum of the HCN 32 emission, probing that the gas has been swept up.
The p-v diagram along is also shown in Fig. 5.The outflow presents bipolar morphology with the highest velocities close to the star. In this case, the blue lobe is more intense than the red lobe, contrary to the case of . However, an intense clump is detected at 10 km s-1 in the direction of (R1 in Fig. 5) that might be disc gas accelerated by the . However, we need to be cautious in our conclusions because the sensitivity and angular resolution of the HCN 3 observations do not allow to fully disentangle from the gas that is accelerated in the walls of the cavity excavated by .
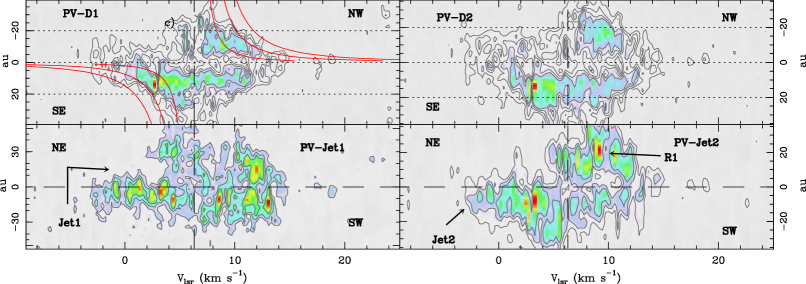
In order to explore the kinematics of the circumbinary disc, we performed the p-v diagrams along the directions perpendicular to and , named and , respectively (Fig. 5). The p-v diagrams along and present emission in the four quadrants, which is not compatible with a pure rotating disc. A combination of rotation and outflow is necessary to explain this pattern. Furthermore, there is a gap around the position of the stars with a size, R8 au, in both diagrams. In spite of the highly disturbed kinematics, we can see a hint for Keplerian rotation in the p-v diagram along . For comparison we compare the observations with the Keplerian curves for a star with M∗=0.8 M⊙ and inclination angles i=20∘, 40∘, and 65∘. We find reasonable agreement between the observations in the inner R20 au region and the Keplerian curves assuming i=40∘ curve. This supports the interpretation that the HCN 32 line comes from a rotating disc which kinematics is highly perturbed by the interaction with the bipolar outflow(s). We recall that there is a degeneracy between the stellar mass and the inclination angle. If GV Tau N is a binary, the stellar mass content would be larger, and a lower inclination angle would be required to fit the observations. This would be consistent with the observed morphology, which is that expected for an almost face-on disc.
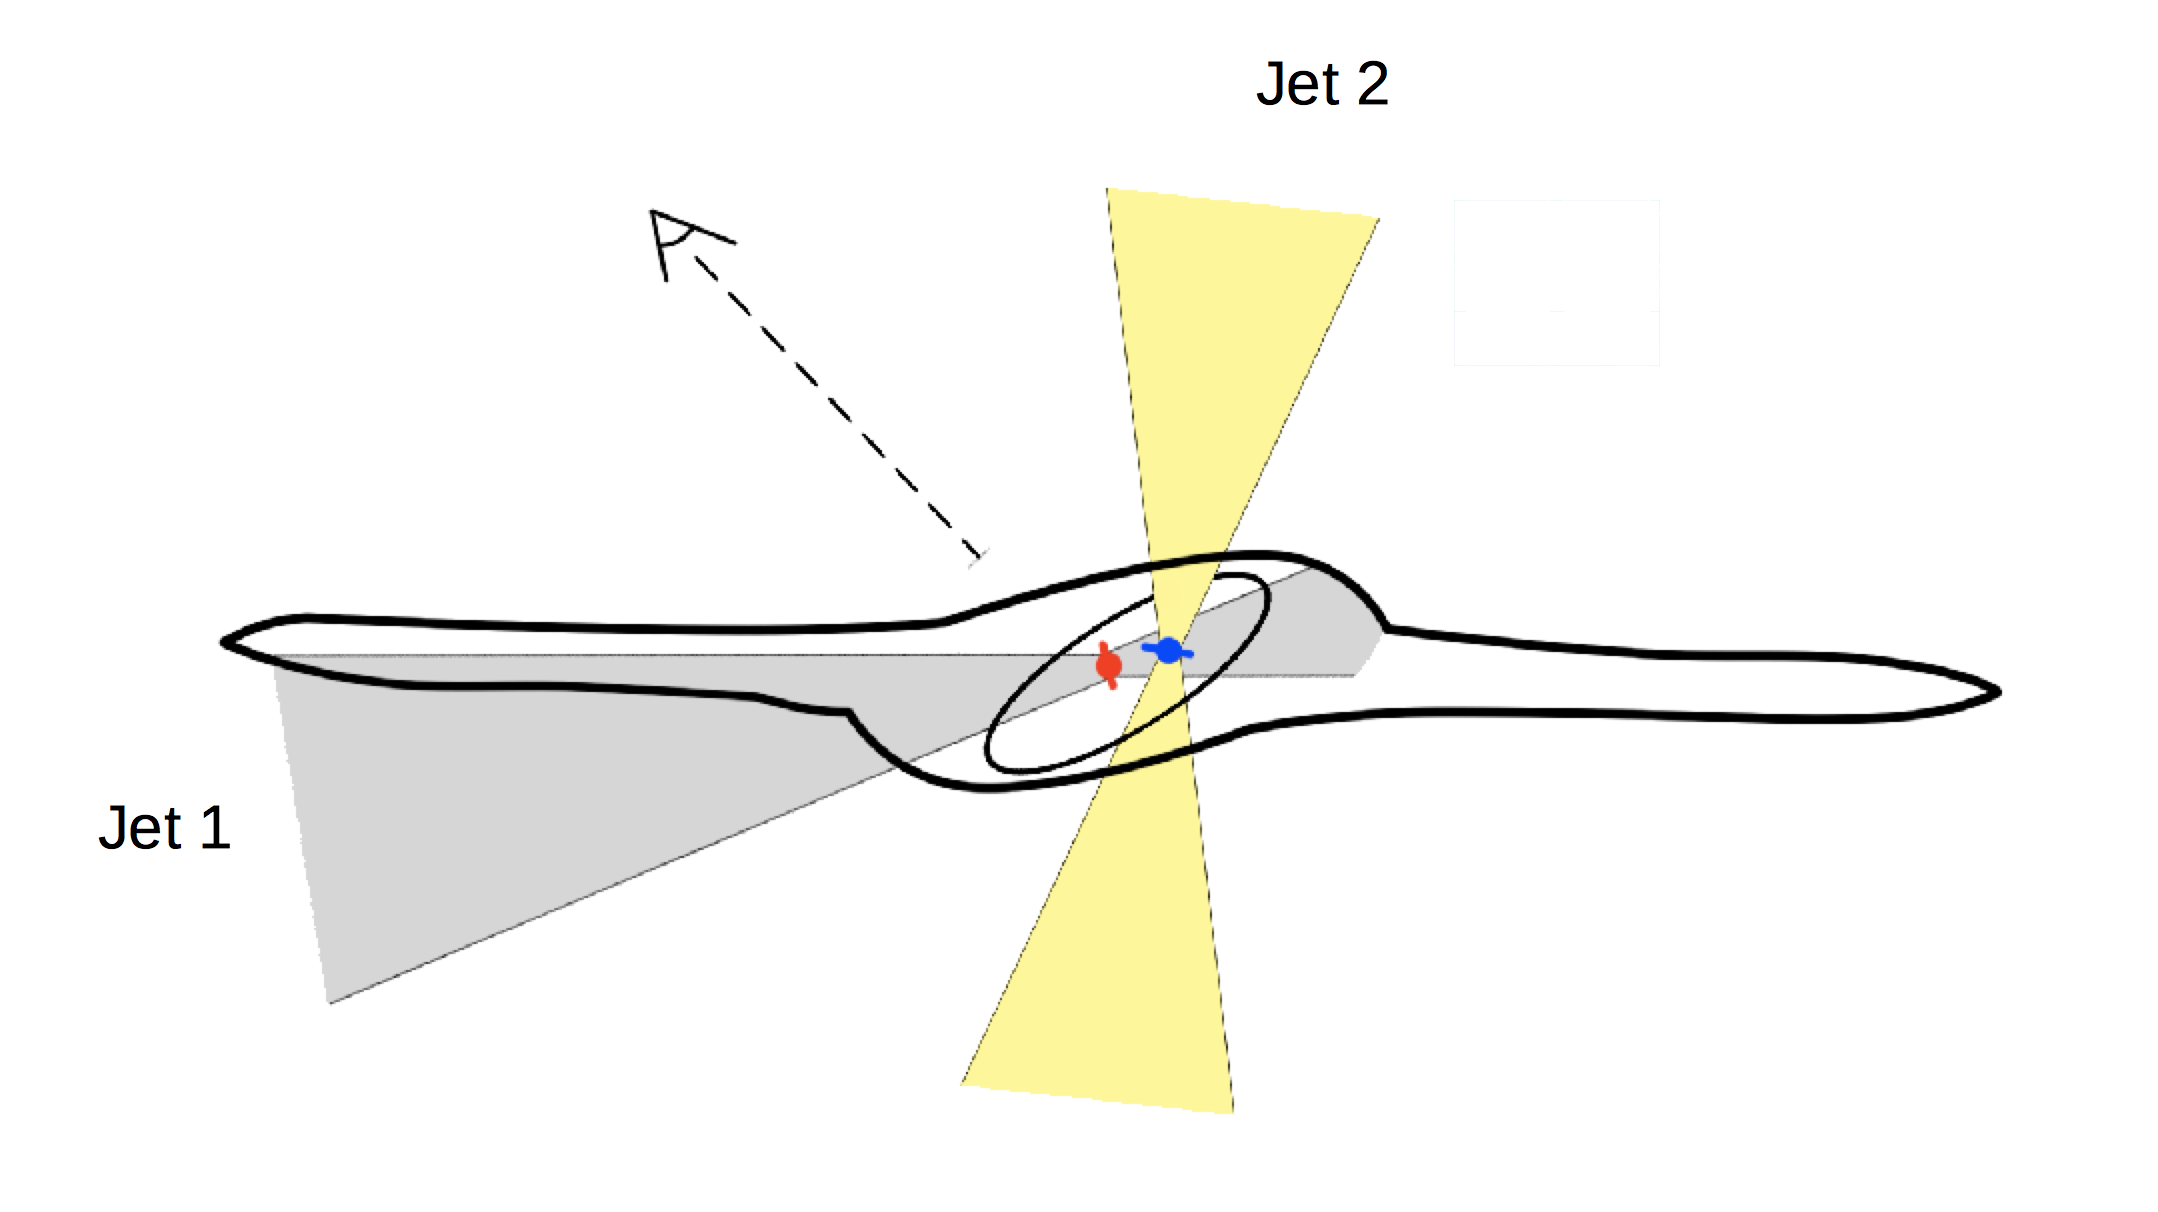
Doppmann et al. (2008) proposed that GV Tau N could be a binary to explain the large difference between the velocity of the lines coming from the stellar photosphere and the molecular gas. The existence of two bipolar outflows would also explain the kinematics observed in the ALMA HCN 32 cube. The most energetic outflow, , should be in (or close to) the equatorial plane of the circumbinary disc in order to explain the cavity cleaned of gas observed in the HCN maps. The second outflow would be perpendicular, or close to the perpendicular direction, to the circumbinary disc, hence flowing away with little interaction with the molecular gas (see a sketch in Fig. 6). This geometry would imply that the two components of the binary are highly misaligned.
Binarity could also explain the different morphology of the gas and dust around GV Tau N, the size of the dust continuum emission being smaller. Stellar binaries exert gravitational torques on inclined circumbinary discs causing radially differential precession and, under some circumstances, warps in the disc. Large dust grains in thick discs pile up at the warp location, forming narrow dust rings within an extended gaseous disc (Aly & Lodato, 2020). This warped narrow dust ring could be the emitting region of the T=150 K component detected in the mid-IR interferometric observations by Roccatagliata et al. (2011).
Misaligned binaries are common in young stellar systems (see e.g. Brinch et al., 2016; Takakuwa et al., 2017). GV Tau S was also proposed to be a spectroscopic binary by Doppmann et al. (2008). If confirmed, GV Tau would be a quadruple star system such as GG Tau (Andrews et al., 2014) and HD98800B (Kennedy et al., 2019).
6 Molecular chemistry
In this Section we compile the column densities and rotation temperatures that have been derived using observations from NIR to mm wavelengths (see Table 1). Even when comparing lines of the same species, ro-vibrational and rotational lines are emitted from different regions of this complex system and the comparison is not straightforward. Our goal is to put together all the pieces of information to figure out the overall scenario.
The physical and chemical conditions in the inner R110 au are better probed by NIR observations. Different rotation temperatures and molecular column densities have been measured with NIR molecular absorption observations towards GV Tau N (see Table 1). In particular, Gibb et al. (2007) derived Trot= 11511 K and N(HCN)= (3.7 0.3) 1016 cm-2 in the first detection of the HCN absorption lines towards this star. Later, Doppmann et al. (2008) and Bast et al. (2013) estimated a higher rotation temperature, Trot500 K for HCN (see Table 1). Doppmann et al. (2008) argued that this difference is due to the different set of lines used in the calculations. Gibb et al. (2007) calculations were based on lines at lower energy and obtained a lower rotation temperature, as expected in the case of a steep gas kinetic temperature gradient along the line of sight. The velocity centroid of the C2H2 and HCN absorption lines is vlsr = 8.7 0.3 km s-1, similar to that of the absorption feature that we have detected in the 13CO 32 line on the top of high velocity wings, thus consistent with the scenario of these molecules coming from infalling gas towards the star. Gibb et al. (2007, 2008) also derived 12CO, 13CO, and C18O rotation temperatures based on molecular absorption (see Table 1). They obtained Trot= 140 K 260 K, suggesting that the observed lines are probing molecular gas located further from the star than HCN and C2H2 although along the line of sight.
We present the first detection of water towards GV Tau (see Fig. 2). In particular, three water lines, p-H2O 111000, o-H2O 110101 and p-H2O 202111 have been detected. The emission of the ground ortho and para water lines are thought to originate in the disc surfaces and in shocks along the outflow cavity in Class I sources (Hogerheijde et al., 2011; Kristensen et al., 2012; Karska et al., 2013; Podio et al., 2013; Mottram et al., 2014; Salinas et al., 2016). The FIR water lines show two well differentiated components: one with a wide profile, very similar to that derived from the interferometric HCN 32 observations; the second one is characterized by a narrow profile and was interpreted as coming from the outer envelope. In the following, we explore the possibility that the emission of the wide component comes from the GV Tau N disrupted gaseous disc detected with ALMA observations of the HCN 32 line. First, we would assume that the bulk of the water emission is coming from GV Tau N. This is a reasonable assumption taking into account that previous NIR and millimeter observations showed that molecular absorption/emission is mainly coming from the North component (Gibb et al., 2007, 2008; Doppmann et al., 2008; Bast et al., 2013; Fuente et al., 2012). Secondly, we use the two observed p-H2O line to investigate the physical conditions of the emitting region. Based on our Gaussian fits to the wide component (Table1), and after correcting for the small difference in the beam size, we derive an integrated intensity ratio, Robs(H2O@987 GHz/1113 GHz)= 1.00.1 for the two p-H2O lines observed. This ratio is not consistent with optically thin emission. In the optically thin limit, and assuming Local Thermodynamic Equilibrium (LTE), we estimate RLTE(H2O@987 GHz/1113 GHz)=0.5 at 200 K, and increases with temperature until 0.63 for Tk500 K. The observed ratio can only be explained if the emission of p-H2O is optically thick. This would imply N(p-H2O) a few 1017 cm-2. This high value of the water column density is within the range of water column densities derived towards T Tauri stars using Spitzer observations (Salyk et al., 2007). Thus, it is not unreasonable that the emission comes from the compact disrupted gaseous disc. To further check the consistency of our interpretation, we perform the following calculation: assuming Trot 500 K as derived from HCN absorption observations, optically thick emission, and a source size of 0.5 (see Fig. 1), we predict Tmb 0.23 K for the p-H2O lines after diluting to the Herschel beam, which is fully consistent with Herschel observations.
It is also interesting to compare the intensities of the ground p-H2O line with the o-H2O 110101 line at 557 GHz. In the optically thick case, we would expect Rthick(H2O@1113 GHz/557 GHz)4.7 because of the different observational beams. Instead, the observed value is Robs(H2O@1113 GHz/557 GHz)2.40.1. This can be explained if the size of the emitting region is larger for ortho-H2O than for the para-H2O. Indeed, this is expected according to the critical densities of these line (2107 cm-3 and 2108 cm-3 at 50 K for the 557 and 1113 GHz lines, respectively), and the higher abundance of o-H2O (the ortho-to-para ratio is 3 at high temperatures). Direct imaging of these lines at high angular resolution is required to confirm this scenario.
We have also derived 13CO, HCN and CN column densities based on FIR observations. In these cases, the lines show narrow profile and therefore, we assume a lower rotation temperature Trot=250 K, similar to those measured from NIR absorption lines of 13CO (Gibb et al., 2007, 2008). Again, the unknown source size introduces a large uncertainty in our calculations. In order to make a fair comparison between molecules, we assumed a source size of 18.5. With these assumptions we derive the following source-averaged column densities: N(13CO)=5.01014 cm-2, N(HCN)= 4.01011 cm-2, and N(HCN)= 6.01011 cm-2.
| NIR molecular absorption | |||
|---|---|---|---|
| Species | Trot(K) | N(cm-2) | Ref |
| 12CO | 20040 | 1.21019 | (1) |
| 13CO | 26020 | 1.11017 | (1) |
| C18O | 14050 | (1.4 0.5) 1016 | (1) |
| C2H2 | 17020 | (7.3 0.2) 1016 | (1) |
| 72060 | (1.4 0.3) 1016 | (3) | |
| CH4 | 75050 | (2.80.2)1017 | (4) |
| CO2 | 25025 | (5.1 0.7) 1016 | (3) |
| HCN | 11511 | (3.7 0.3) 1016 | (1) |
| 44040 | (1.8 0.4) 1016 | (3) | |
| 550 | 1.5 1017 | (2) | |
| FIR molecular emission | |||
| Species | Trot(K) | N(cm-2) | Comments |
| o-H2O | 500 | 1017 | Wide |
| p-H2O | 500 | 1017 | Wide |
| 13CO | 250 | 5.01014 | Narrow 1 |
| HCN | 250 | 4.01011 | Narrow1 |
| CN | 250 | 6.01011 | Narrow1 |
| mm interferometric emission | |||
| Species | Trot(K) | N(cm-2) | Comments |
| 13CO | 250500 | (2.65.0)1017 | Wide |
| HCN | 250500 | (2.03.5)1015 | Wide |
Finally, we explore the chemistry of the compact emission around GV Tau N using the millimeter interferometric images. Fuente et al. (2012) concluded that the HCN/HCO+ abundance ratio should be 300 to be compatible with the non-detection of HCO+ 32 with PdBI observations. Here, we will compare the HCN 32 observations obtained with ALMA with the PdBI observations of the 13CO 2 line. For this comparison we use the averaged HCN 32 spectrum in R0.18, since the beam of 13CO 32 observations is 0.3. We can fit the PdBI 13CO 32 line profile, assuming LTE, Trot=250500 K and N(13CO)=(2.65.0)1017 cm-2. At these high temperatures, the emission of the 13CO 32 is optically thin and it is not very dependent on the assumed gas kinetic temperature. This estimate is in reasonable agreement with the value derived from the NIR absorption lines, suggesting that we are probing the same gas component. The R0.18 averaged profile of the HCN 32 emission can be fitted with Trot=250500 K and N(HCN)=(2.0-3.5)1015 cm-2, i.e., two orders of magnitude lower than the values derived from the NIR molecular absorptions. This suggest that the mm emission is probing a different gas component than the molecular absorption in NIR. Molecular absorptions arise in a very small and hot region where the HCN lines are optically thick, and Tb (HCN 32) 500 K. In order to be compatible with ALMA observations, the size of this region should be R 23 au around the star, confirming its origin in the GV Tau N individual disc.
The observation of 13CO and HCN with different techniques provides valuable information on the chemical changes occurring in this complex system. As shown in Table 1, we obtain that the HCN/13CO abundance ratio is 10-3 based on the FIR observations, 10-2 in the gaseous disc traced with ALMA and PdBI observations, and 1 in the close vicinity of the star where NIR molecular absorptions arise. These different values of the HCN/13CO ratio testify for chemical gradients in this system, with the HCN/13CO ratio decreasing with the distance from the star. This behavior of the HCN abundance, peaking at R2-3 au from the star is consistent with chemical models predictions (see e.g. Walsh et al. (2010); Agúndez et al. (2018)). These models also predict that a high abundance of H2O is expected in this inner region, coeval with HCN. The narrow component appearing in the H2O line profiles is thought to come from a more extended envelope component.
7 Concluding remarks
The high spatial resolution of ALMA observations allows us, for the first time, to discern the different gas components in the vicinity of GV Tau N. The young star GV Tau N is located in the inner gap of a gaseous Keplerian disc of R20 au. An ionized jet is detected in the continuum at 1.1 mm. Furthermore, ALMA observations present evidence of the existence of two molecular outflows, one of them associated with the continuum jet. We propose that all these observations can be easily explained if GV Tau N is a binary, as already suggested by Doppmann et al. (2008). The individual disc of the primary is highly misaligned relative to the circumbinary disc, and its jet is disrupting the molecular ring (see Fig. 6).
The present detection of the o-H2O and p-H2O line in GV Tau N is of paramount importance. Determining the water abundance in proto-planetary discs has been remarkably difficult. Water vapor detections using the ground state H2O lines have been reported for just two discs, the well-known transition disc TW Hya (Hogerheijde et al., 2011; Salinas et al., 2016), and the Class I disc DG Tau (Podio et al., 2013). Stringent upper limits to the water abundance have been reported for a dozen other sources at an order of magnitude lower than expected (Bergin et al., 2010; Du et al., 2017). Recently, Harsono et al. (2020) unsuccessfully searched for water in five Class I discs using ALMA observations of millimeter lines of the rarer isotopologue HO. The detection of cold water towards Class I protostar GV Tau stands as a major result that deserves further study.
We also present observations of high excitation lines of 13CO, HCN and CN as observed with the HIFI/Herschel instrument, which provide information on the column densities of these species at spatial scales of a few 10. As shown in Table 1, the HCN/13CO abundance ratio is 10-3 in the warm envelope, 10-2 in the gaseous disc better traced with ALMA and PdBI observations, and 1 in the close vicinity of the star where NIR molecular absorptions arise. This behavior of the HCN abundance, peaking at R2-3 au from the star is consistent with chemical models predictions (see e.g. Walsh et al. (2010); Agúndez et al. (2018)). These models also predict that a high abundance of H2O is expected in this inner region, coeval with HCN.
Spitzer observations revealed that GV Tau N is specially rich in organic species (Gibb et al., 2007, 2008; Doppmann et al., 2008; Bast et al., 2013). The interaction of the jet with the circumbinary gaseous disc is expected to produce intense shocks that could contribute to enhance the abundance of organic species in this disc. High spatial resolution interferometric observations are required to disentangle the interplay between chemistry and dynamics in this prototypical system.
Data availability
The data underlying this article will be shared on reasonable request to the corresponding author.
Acknowledgements
This paper makes use of the following ALMA data: ADS/JAO. 2016.1.00813.S. ALMA is a partnership of ESO (representing its member states), NSF (USA) and NINS (Japan), together with NRC (Canada), MOST and ASIAA (Taiwan), and KASI (Republic of Korea), in cooperation with the Republic of Chile. The Joint ALMA Observatory is operated by ESO, AUI/NRAO and NAOJ. We thank the Spanish MINECO for funding support from AYA2016-75066-C2-2-P. SPTM has received funding from the European Union’s Horizon 2020 research and innovation program under grant agreement No 639459 (PROMISE).
References
- Agúndez et al. (2018) Agúndez M., Roueff E., Le Petit F., Le Bourlot J., 2018, A&A, 616, A19
- Alonso-Albi et al. (2009) Alonso-Albi T., Fuente A., Bachiller R., Neri R., Planesas P., Testi L., Berné O., Joblin C., 2009, A&A, 497, 117
- Alonso-Martínez et al. (2017) Alonso-Martínez M., Riviere-Marichalar P., Meeus G., Kamp I., Fang M., Podio L., Dent W. R. F., Eiroa C., 2017, A&A, 603, A138
- Aly & Lodato (2020) Aly H., Lodato G., 2020, MNRAS, 492, 3306
- Andrews et al. (2013) Andrews S. M., Rosenfeld K. A., Kraus A. L., Wilner D. J., 2013, ApJ, 771, 129
- Andrews et al. (2014) Andrews S. M., et al., 2014, ApJ, 787, 148
- Banzatti et al. (2017) Banzatti A., Pontoppidan K. M., Salyk C., Herczeg G. J., van Dishoeck E. F., Blake G. A., 2017, ApJ, 834, 152
- Bast et al. (2013) Bast J. E., Lahuis F., van Dishoeck E. F., Tielens A. G. G. M., 2013, A&A, 551, A118
- Bergin et al. (2010) Bergin E. A., et al., 2010, A&A, 521, L33
- Brinch et al. (2016) Brinch C., Jørgensen J. K., Hogerheijde M. R., Nelson R. P., Gressel O., 2016, ApJ, 830, L16
- Carr & Najita (2008) Carr J. S., Najita J. R., 2008, Science, 319, 1504
- Carr & Najita (2011) Carr J. S., Najita J. R., 2011, ApJ, 733, 102
- Carr & Najita (2014) Carr J. S., Najita J. R., 2014, ApJ, 788, 66
- Ceccarelli et al. (2010) Ceccarelli C., et al., 2010, A&A, 521, L22
- Dent et al. (2013) Dent W. R. F., et al., 2013, PASP, 125, 477
- Desch (2007) Desch S. J., 2007, ApJ, 671, 878
- Devine et al. (1999) Devine D., Reipurth B., Bally J., Balonek T. J., 1999, AJ, 117, 2931
- Doppmann et al. (2008) Doppmann G. W., Najita J. R., Carr J. S., 2008, ApJ, 685, 298
- Doppmann et al. (2011) Doppmann G. W., Najita J. R., Carr J. S., Graham J. R., 2011, ApJ, 738, 112
- Du et al. (2017) Du F., et al., 2017, ApJ, 842, 98
- Eisner et al. (2008) Eisner J. A., Plambeck R. L., Carpenter J. M., Corder S. A., Qi C., Wilner D., 2008, ApJ, 683, 304
- Fedele et al. (2011) Fedele D., Pascucci I., Brittain S., Kamp I., Woitke P., Williams J. P., Dent W. R. F., Thi W. F., 2011, ApJ, 732, 106
- Fedele et al. (2012) Fedele D., Bruderer S., van Dishoeck E. F., Herczeg G. J., Evans N. J., Bouwman J., Henning T., Green J., 2012, A&A, 544, L9
- Fedele et al. (2013) Fedele D., et al., 2013, A&A, 559, A77
- Fuente et al. (2012) Fuente A., Cernicharo J., Agúndez M., 2012, ApJ, 754, L6
- Gaia Collaboration (2018) Gaia Collaboration 2018, VizieR Online Data Catalog, p. I/345
- Gibb & Horne (2013) Gibb E. L., Horne D., 2013, ApJ, 776, L28
- Gibb et al. (2007) Gibb E. L., Van Brunt K. A., Brittain S. D., Rettig T. W., 2007, ApJ, 660, 1572
- Gibb et al. (2008) Gibb E. L., Van Brunt K. A., Brittain S. D., Rettig T. W., 2008, ApJ, 686, 748
- Green et al. (2013) Green J. D., et al., 2013, ApJ, 770, 123
- Harsono et al. (2020) Harsono D., et al., 2020, A&A, 636, A26
- Hogerheijde et al. (2011) Hogerheijde M. R., et al., 2011, Science, 334, 338
- Jørgensen et al. (2009) Jørgensen J. K., van Dishoeck E. F., Visser R., Bourke T. L., Wilner D. J., Lommen D., Hogerheijde M. R., Myers P. C., 2009, A&A, 507, 861
- Karska et al. (2013) Karska A., et al., 2013, A&A, 552, A141
- Kennedy et al. (2019) Kennedy G. M., et al., 2019, Nature Astronomy, 3, 230
- Kristensen et al. (2012) Kristensen L. E., et al., 2012, A&A, 542, A8
- Kruger et al. (2011) Kruger A. J., Richter M. J., Carr J. S., Najita J. R., Doppmann G. W., Seifahrt A., 2011, ApJ, 729, 145
- Lahuis et al. (2006) Lahuis F., et al., 2006, ApJ, 636, L145
- Liu et al. (2017) Liu H. B., et al., 2017, A&A, 602, A19
- Mandell et al. (2012) Mandell A. M., Bast J., van Dishoeck E. F., Blake G. A., Salyk C., Mumma M. J., Villanueva G., 2012, ApJ, 747, 92
- Maret et al. (2020) Maret S., et al., 2020, A&A, 635, A15
- Mathews et al. (2010) Mathews G. S., et al., 2010, A&A, 518, L127
- McMullin et al. (2007) McMullin J. P., Waters B., Schiebel D., Young W., Golap K., 2007, CASA Architecture and Applications. p. 127
- Meeus et al. (2012) Meeus G., et al., 2012, A&A, 544, A78
- Mottram et al. (2014) Mottram J. C., et al., 2014, A&A, 572, A21
- Movsessian & Magakian (1999) Movsessian T. A., Magakian T. Y., 1999, A&A, 347, 266
- Najita et al. (2010) Najita J. R., Carr J. S., Strom S. E., Watson D. M., Pascucci I., Hollenbach D., Gorti U., Keller L., 2010, ApJ, 712, 274
- Najita et al. (2013) Najita J. R., Carr J. S., Pontoppidan K. M., Salyk C., van Dishoeck E. F., Blake G. A., 2013, ApJ, 766, 134
- Ott (2010) Ott S., 2010, The Herschel Data Processing System — HIPE and Pipelines — Up and Running Since the Start of the Mission. p. 139
- Panagia (1988) Panagia N., 1988, in Pudritz R. E., Fich M., eds, NATO Advanced Science Institutes (ASI) Series C Vol. 232, NATO Advanced Science Institutes (ASI) Series C. p. 25, doi:10.1007/978-94-009-2973-9_2
- Pety (2005) Pety J., 2005, in Casoli F., Contini T., Hameury J. M., Pagani L., eds, SF2A-2005: Semaine de l’Astrophysique Francaise. p. 721
- Pilbratt et al. (2010) Pilbratt G. L., et al., 2010, A&A, 518, L1
- Podio et al. (2013) Podio L., et al., 2013, ApJ, 766, L5
- Pontoppidan et al. (2010) Pontoppidan K. M., Salyk C., Blake G. A., Meijerink R., Carr J. S., Najita J., 2010, ApJ, 720, 887
- Reipurth et al. (2004) Reipurth B., Rodríguez L. F., Anglada G., Bally J., 2004, AJ, 127, 1736
- Riviere-Marichalar et al. (2012) Riviere-Marichalar P., et al., 2012, A&A, 538, L3
- Roccatagliata et al. (2011) Roccatagliata V., Ratzka T., Henning T., Wolf S., Leinert C., Bouwman J., 2011, A&A, 534, A33
- Salinas et al. (2016) Salinas V. N., et al., 2016, A&A, 591, A122
- Salyk et al. (2007) Salyk C., Blake G. A., Boogert A. C. A., Brown J. M., 2007, ApJ, 655, L105
- Salyk et al. (2008) Salyk C., Pontoppidan K. M., Blake G. A., Lahuis F., van Dishoeck E. F., Evans Neal J. I., 2008, ApJ, 676, L49
- Salyk et al. (2011) Salyk C., Pontoppidan K. M., Blake G. A., Najita J. R., Carr J. S., 2011, ApJ, 731, 130
- Salyk et al. (2019) Salyk C., Lacy J., Richter M., Zhang K., Pontoppidan K., Carr J. S., Najita J. R., Blake G. A., 2019, ApJ, 874, 24
- Santiago-García et al. (2009) Santiago-García J., Tafalla M., Johnstone D., Bachiller R., 2009, A&A, 495, 169
- Sargent et al. (2014) Sargent B. A., et al., 2014, ApJ, 792, 83
- Sheehan & Eisner (2014) Sheehan P. D., Eisner J. A., 2014, ApJ, 791, 19
- Skinner et al. (1993) Skinner S. L., Brown A., Stewart R. T., 1993, ApJS, 87, 217
- Takakuwa et al. (2017) Takakuwa S., Saigo K., Matsumoto T., Saito M., Lim J., Hanawa T., Yen H.-W., Ho P. T. P., 2017, ApJ, 837, 86
- Thi et al. (2011) Thi W. F., et al., 2011, A&A, 530, L2
- Tobin et al. (2020) Tobin J. J., et al., 2020, ApJ, 890, 130
- Ubach et al. (2017) Ubach C., Maddison S. T., Wright C. M., Wilner D. J., Lommen D. J. P., Koribalski B., 2017, MNRAS, 466, 4083
- Walsh et al. (2010) Walsh C., Millar T. J., Nomura H., 2010, ApJ, 722, 1607
- Weidenschilling (1977) Weidenschilling S. J., 1977, Ap&SS, 51, 153
- de Graauw et al. (2010) de Graauw T., et al., 2010, A&A, 518, L6
- van Dishoeck et al. (2011) van Dishoeck E. F., et al., 2011, PASP, 123, 138
Appendix A Supporting material
| line | Freq | beam | Area | Vlsr | FWHP | Tmb |
|---|---|---|---|---|---|---|
| (GHz) | (") | (K km s-1) | (km s-1) | (km s-1) | (K) | |
| o-H2O 110101 | 556.94 | 40 | 0.93 ( 0.02) | 7.52 ( 0.09) | 7.92 ( 0.23) | 0.11 |
| p-H2O 111000 | 1113.34 | 18.5 | 2.14 ( 0.05) | 7.58 ( 0.08) | 7.42 (0.20) | 0.27 |
| p-H2O 202111 | 987.93 | 20 | 1.79 ( 0.06) | 7.32 ( 0.09) | 6.64 (0.29) | 0.25 |
| 13CO 109 | 1101.35 | 18.5 | 1.18 ( 0.03) | 6.72 ( 0.03) | 2.97 ( 0.08) | 0.37 |
| CN 54 | 566.95 | 40 | 0.04 ( 0.01) | 7.25 ( 0.13) | 1.65 ( 0.25) | 0.02 |
| HCN 76 | 620.30 | 35 | 0.14 ( 0.03) | 7.02 ( 0.37) | 3.71 ( 1.14) | 0.04 |