Thermal luminosities of cooling neutron stars
Abstract
Ages and thermal luminosities of neutron stars, inferred from observations, can be interpreted with the aid of the neutron star cooling theory to gain information on the properties of superdense matter in neutron-star interiors. We present a survey of estimated ages, surface temperatures and thermal luminosities of middle-aged neutron stars with relatively weak or moderately strong magnetic fields, which can be useful for these purposes. The catalogue includes results selected from the literature, supplemented with new results of spectral analysis of a few cooling neutron stars. The data are compared with the theory. We show that overall agreement of theoretical cooling curves with observations improves substantially for models where neutron superfluidity in stellar core is weak.
keywords:
stars: neutron – X-rays: stars – catalogues – radiation mechanisms: thermal1 Introduction
Comparison of the theory of neutron star cooling with observations can provide a wealth of important information. Since the cooling depends on neutron star properties, for example mass, equation of state (EoS), composition of the stellar core and outer envelopes, magnetic field strength and configuration, such a comparison can help to determine some parameters of neutron stars and choose among theoretical models of superdense matter.
Using the growing number of high-quality observations of thermal radiation of neutron stars requires a catalogue of their basic observable parameters relevant to cooling – first of all, ages and thermal luminosities. Some compilations have been done in the past, embedded in reviews of the neutron star cooling theory (e.g., Yakovlev & Pethick 2004; Page 2009; Tsuruta 2009; Potekhin et al. 2015 and references therein) or in research papers (e.g., Page et al., 2004; Zhu et al., 2011; Viganò et al., 2013; Beznogov & Yakovlev, 2015). Here we revisit the collection of observational data on cooling neutron stars from the literature, including new results and reanalysing some of the archival data. We compose an updated catalogue of observational estimates of the basic properties of thermally emitting, cooling isolated neutron stars (INSs). We also present examples of such a comparison, taking some recent progress of the neutron star theory into account.
In Sect. 2 we sketch the basic concepts of the neutron star cooling theory. In Sect. 3 we present the brief summary of modern observations of thermally emitting, middle-aged INSs and list their estimated parameters that can be useful for theoretical interpretation of the data. In Sect. 4 we discuss some examples of the comparison of theory and observations. We summarize in Sect. 5.
2 Theoretical background
The cooling theory requires constructing the models of neutron star structure and thermal evolution. This task is unique in the complexity of underlying physics (partially uncertain), ranges of temperatures and densities, and physical processes involved. Detailed reviews were given, e.g., by Yakovlev & Pethick (2004); Page (2009); Tsuruta (2009); Potekhin, Pons & Page (2015). In this section we outline the basic concepts of this theory.
2.1 Hydrostatic and thermal structure and evolution
Neutron stars are relativistic objects. The importance of General Relativity effects is characterized by the compactness ratio , where is the stellar radius, is the Schwarzschild radius, is the gravitational stellar mass, is the Newtonian gravitational constant, and is the speed of light. Typically, 0.2 – 0.5 for neutron stars, while for all other stars.
The mass density ranges from small values in the atmospheres to g cm-3 at the center of a sufficiently massive neutron star (e.g., Haensel, Potekhin & Yakovlev, 2007). A thin atmosphere covers the ocean, filled with a Coulomb liquid of atomic nuclei and degenerate electrons, which lies on the crust, where the nuclei are arranged in a crystalline lattice. In addition to the nuclei and electrons, there are quasi-free “dripped” neutrons in the inner crust, at g cm-3. At around g cm-3, the clusters of nucleons may take exotic non-spherical shapes, forming a liquid-crystal mantle of the star. At still higher densities, there is a neutron-rich liquid core. The central part of sufficiently massive neutron stars (at g cm-3) has rather unknown composition and EoS, which remains a fundamental physical problem. Nucleons (and other baryons if available) in neutron star interiors can be superfluid. Neutron stars can be fast rotators (with spin periods down to ms) and possess strong magnetic fields (up to G, with typical values G).
Neutron stars cool down mainly via neutrino emission from their cores and photon emission from their atmospheres. While cooling they lose their thermal energy. They may also be reheated by various mechanisms (e.g., Gonzalez & Reisenegger, 2010).
Accurate modelling of neutron star cooling with account of all possible effects is complicated. The cooling can be affected by presence of free hyperons (e.g., Grigorian et al. 2018; Raduta et al. 2019 and references therein) or deconfined quarks (Wei et al. 2020 and references therein), by emission of axions (e.g., Sedrakian 2019 and references therein), pion or kaon condensation (see Yakovlev et al. 2001 for review and references) and other effects. For simplicity we assume that the neutron-star matter contains neutrons, protons, electrons and muons, without hyperons or exotic matter. Also, we restrict ourselves to cooling INSs with not too strong magnetic fields G and not too fast rotation ( ms), neglecting reheating. Then to a good approximation the internal stellar structure is spherically symmetric. It is also reasonable to expect that the temperature distribution is spherically symmetric at sufficiently high densities. In the region of the star where these assumptions are acceptable, the mechanical structure and temperature distribution are determined by a set of differential equations (Richardson et al., 1982), which involve only one spatial coordinate, circumferential radius . To solve this set of equations, one needs an EoS, which relates pressure to mass density and temperature , and a boundary condition, which relates thermal flux to temperature at an outer spherical surface. As a rule, the outer boundary is chosen at such density that outer layers at can be treated as quasi-stationary and the matter at is strongly degenerate. Then the EoS at is nearly barotropic ( depends only on but not on ), and the solution of the cooling problem can be greatly simplified: one first solves the hydrostatic equilibrium equations, once and forever, and then uses the stationary hydrostatic structure in the heat transport and thermal balance equations. Many successful neutron star cooling codes work in this way (e.g., Gnedin et al. 2001; Page 2016). There are also more complicated codes for simulations of neutron-star thermal evolution beyond the approximation of barotropic EoS (e.g., Richardson et al. 1982; Potekhin & Chabrier 2018; Beznogov, Page & Ramirez-Ruiz 2020); they are needed to study hot neutron stars or neutron stars with rapid variations of thermal emission. More complex codes that take into account departures from spherical symmetry are required for studies of rapidly rotating or ultra-magnetized neutron stars (e.g., Chatterjee et al. 2015; Pons & Viganò 2019 and references therein).
2.2 Heat-blanketing envelopes
The above-mentioned quasi-stationary layer is called heat-blanketing envelope. Usually, following Gudmundsson, Pethick & Epstein (1983), one sets its bottom at the mass density g cm-3 (a few hundred meters under the surface). Potekhin & Chabrier (2018) have explicitly demonstrated that this choice provides a good accuracy to the cooling simulations of INSs at ages yr. However, the envelope can be chosen thinner or thicker depending on the problem under consideration.
The composition of the heat blankets is generally unknown. In proto-neutron stars, thermonuclear burning produces the iron group composition near the surface. However, light elements may be supplied by the fallback of matter onto the stellar surface, by accretion from interstellar medium or a companion star and by other processes.
Different chemical elements are separated by rapid sedimentation caused by the strong gravity of neutron stars (Hameury, Heyvaerts & Bonazzola, 1983), although thermonuclear processes in the envelopes of accreting neutron stars can instantaneously create complex mixtures (see, e.g., Meisel et al. 2018 for review and references). Potekhin, Chabrier & Yakovlev (1997) studied the blanketing envelopes composed, from surface to bottom, of hydrogen, helium, carbon, and iron shells, assuming perfect stratification. More scrupulous envelope treatments include smearing the interfaces between the shells by diffusive mixing of different ions (De Blasio, 2000; Chang & Bildsten, 2003; Chang, Bildsten & Arras, 2010; Beznogov, Potekhin & Yakovlev, 2016).
In strong magnetic fields, the heat conduction in the envelopes is anisotropic, so that the temperature varies over the surface (Greenstein & Hartke, 1983). However, the total thermal photon luminosity is only weakly affected by this anisotropy (Potekhin & Yakovlev, 2001; Potekhin et al., 2003), except for superstrong fields G, which appreciably increase the overall heat-transparency of the envelope (Potekhin, Urpin & Chabrier, 2005; Potekhin & Chabrier, 2018).
2.3 Observables
Since the distribution of the surface temperature over the neutron-star surface can be non-uniform, it is convenient to introduce the overall effective temperature of the star, , defined by
| (1) |
where is the local flux density at the radiative surface and is the surface element. The quantities , , and refer to a local reference frame at the neutron-star surface. The quantities detected by a distant observer are redshifted (e.g., Thorne, 1977),
| (2) | |||
| (3) |
2.4 Basic regulators of neutron star cooling
After a newly born neutron star has passed the initial stage of internal thermal relaxation, which lasts yr (see Gnedin et al. 2001), it is almost isothermal inside, excluding heat blankets. The isothermality means that the redshifted temperature is independent of (here, is a dimensionless metric function; e.g., Misner, Thorne & Wheeler 1973). Subsequent thermal evolution of an INS passes through the neutrino cooling stage and the photon cooling stage, possibly followed by reheating. The time-dependence of is governed by the heat balance equation
| (4) |
Here, and are, respectively, the total heat capacity and neutrino luminosity of the star, properly integrated over the stellar volume (see, e.g., Yakovlev, Levenfish & Haensel 2003).
INSs of age Myr cool mainly via neutrino emission (), so that is regulated by the ratio . Older INSs cool via thermal emission of photons from the surface. The neutrino term becomes negligible in equation (4). At this stage the cooling is driven by the ratio . At each stage, the dependence , which is provided by a heat blanket model, is needed to obtain the observable photon luminosity. Therefore, using the cooling theory, one can test the heat capacity and neutrino luminosity of the stellar core, and , and heat transparency of the blanketing envelope (determined by composition of plasma as well as by magnetic field strength and geometry).
Microphysics of the crust does not strongly affect the cooling of INSs. It can affect cooling of younger stars (where the crust is non-isothermal) or stars with very strong fields G (see Potekhin & Chabrier 2018).
The functions and are mostly determined by properties of superdense matter in the core. One can distinguish the effects of two types.
The effects of first type come from nuclear physics. If the proton fraction (which is strongly model-dependent) can reach sufficiently high values in the core, then very fast neutrino cooling via direct Urca processes can proceed (see, e.g., Haensel 1995, and references therein). Otherwise the neutrino cooling would be much slower, being mediated mainly by modified Urca processes and neutrino bremsstrahlung in nucleon collisions.
The effects of second type are regulated by superfluidity of neutrons and protons (see Page et al. 2014 for review). In the core, neutron pairing may occur in triplet state while proton pairing is in singlet state. In the inner crust, dripped neutrons undergo singlet-state pairing. The key theoretical ingredients are critical temperatures and for neutron and proton pairing as functions of , which are related to the so called superfluid gap functions , where is the baryon Fermi wave-number. Their calculation is very complicated, being affected by numerous delicate effects of in-medium interaction of nucleons (see, e.g., Sedrakian & Clark 2019 for review). Modern calculations of the profiles converge to similar results for the pairing of neutrons (Margueron et al., 2008; Gandolfi et al., 2009; Ding et al., 2016), which is at work in the crust, but for the singlet pairing of protons and for triplet pairing of neutrons in the core vary by orders of magnitude depending on employed theoretical model.
Strong pairing of nucleons suppresses their heat capacity and neutrino cooling reactions involving these nucleons (see Yakovlev et al. 2001 for review and practical analytic expressions). When the core temperature becomes much lower than a critical temperature, the suppression can be exponential (almost complete). The suppression of neutrino reactions slows the cooling down, while the suppression of the heat capacity accelerates it. The former effect dominates at the neutrino cooling stage, and the latter becomes most important when the star cools mainly via photon emission. Besides, superfluidity can accelerate the cooling via an additional moderately strong neutrino emission due to Cooper pairing of neutrons. This emission is substantial in the triplet pairing channel when temperature is slightly below (Leinson 2010 and references therein). Therefore, even the direction of superfluidity effects can be different, but all this physics is compressed in the two functions, and . Inferring these functions from the data can give useful information on internal structure of neutron stars.
3 Observations of cooling neutron stars
3.1 General remarks
Only a small fraction of the observed neutron stars is suitable for comparison with the theory of cooling. A vast majority of neutron stars demonstrate intense emission of non-thermal origin. Neutron stars in binary systems are usually surrounded by an accretion disk, whose emission is orders of magnitude more powerful than the thermal emission from the neutron star surface. Non-thermal emission of INSs can be produced by pulsar activity or by other processes in the magnetosphere of the star. A careful analysis is required to extract the thermal component of the observed spectrum.
On the other hand, very old neutron stars, including almost all millisecond pulsars, have already lost their initial heat. Their thermal luminosity is very low, and even if detected, it can be produced by reheating (e.g. Gonzalez & Reisenegger, 2010; González-Jiménez, Petrovich & Reisenegger, 2015; Yanagi, Nagata & Hamaguchi, 2020) or by hot polar caps heated by return currents (e.g., Timokhin & Arons, 2013; Salmi et al., 2020).
Another problem is that the age of neutron stars is rarely known with good accuracy. Thus, the “passive cooling” theory, which neglects reheating, can only be tested against observations of not too old INSs with estimated ages.
In order to compare neutron-star observations with the cooling theory, one may use either surface temperatures or photon luminosities . Both can be evaluated by spectral analysis, but it is usually difficult to determine them accurately. In empty flat space, the observed flux is inversely proportional to squared distance, while the shape of the spectrum is distance-independent. At the first glance, temperature measurements should be preferred, since the distance is often poorly known. In reality, however, absorption by interstellar medium appreciably affects both the luminosity and the spectral shape. At typical surface temperatures of cooling neutron stars K, thermal flux is emitted mostly in soft X-rays, but a substantial part of the thermal spectrum lies in the extreme ultraviolet (EUV) range, which is inaccessible to observations because of the strong interstellar absorption. For these reasons, a complete recovery of the spectral shape is a problem even for a neutron star with purely thermal emission. For nearby stars detected in the optical-UV, additional constraints can be obtained from the Rayleigh-Jeans tail of the thermal spectrum (e.g., Shibanov et al., 2005; Kargaltsev & Pavlov, 2007; Kaplan et al., 2011).
The analysis of the spectrum can be performed under different hypotheses on the thermal and non-thermal components. Both temperature and luminosity estimates depend on the choice of the emission model. The simplest model is the blackbody (BB) spectrum. More physically motivated models rely on computations of radiative transfer in neutron-star atmospheres or formation of thermal spectrum at a condensed surface (see, e.g., Potekhin 2014 for review). Often more than one model can fit equally well the data, without any clear, physically motivated preference. Estimates of the surface temperature, being extracted from observational data by using different models, may vary by a factor of a few. As a rule, they anticorrelate with radius of an equivalent emitting sphere for a distant observer, . Often the model that yields a higher estimate of temperature gives a lower luminosity (mainly because of a smaller bolometric correction). Since the neutron star mass and physical radius are rarely known with good accuracy, estimates of redshifted temperature and estimates of redshifted photon luminosity are usually more robust than non-redshifted ones.
If data contain few photons and/or strong absorption features, the temperature may be poorly constrained by the fit, adding a large statistical error to the systematic one. In such cases can be determined more accurately than , especially if the distance to the source is well known. On the other hand, for bright sources with poorly known distances, the observed temperature can be constrained better than the luminosity within a fixed spectral model, although different models still give different temperature estimates.
Even an accurate estimate of surface temperature may be insufficient for comparison with the cooling theory without a reliable estimate of the luminosity. Indeed, it is that enters equation (4). In the ideal case where is the same at any point on the surface, it equals in Eq. (2), where, for consistency, one should use the same radius that is employed in the cooling simulation being compared with the observations. Then the knowledge of is equivalent to the knowledge of . However, most neutron stars (including all neutron stars with strong magnetic fields) have anisotropic distribution of temperature over the surface (Sect. 2.2). Then a single temperature extracted from observations may be biased upwards, because hotter regions contribute more to the detected flux. Accordingly, the effective emitting area is often smaller than , so that . Since the energy balance includes the total photon flux, it would be inconsistent to compare theoretical surface temperature, calculated for the entire emitting surface, with the observational estimate that implies that only a part of the surface emits thermal photons. To restore consistency, in equation (4) ought to be corrected by using an appropriate integration area in equation (1).
More sophisticated models allow for a non-uniform temperature distribution. For example, observed spectra are often fitted with models, which include two, or sometimes more, thermal components with different and . Usually the hottest component has a small effective radius (), which may correspond, for example, to a hot spot on the surface, such as a polar cap of a pulsar heated up by return currents. The hot spots provided by such models usually give minor contribution to the total luminosity. In some cases, however, different fit components have comparable effective radii and give comparable contributions to . Such a step-like temperature distribution may be an artifact, caused by inadequacy of the assumed spectral model, but it also may mimic a real variation of temperature over the surface.
As will be seen from the comments on observational data in Section 3.3, in some cases the temperature and in other cases the luminosity is better constrained by the data. Sometimes, estimates of both the luminosity and the temperature together help to constrain the parameters of a given neutron star. Thus it is advisable to take into account the totality of observational data for an analysis of every individual source under study.
3.2 Description of tables
Table LABEL:tab:CoolList gives basic information on middle-aged INSs with registered or reliably constrained thermal radiation that are suitable for comparison with the cooling theory. The key properties of these neutron stars for such a comparison are given in Table LABEL:tab:AgeL.
In Table LABEL:tab:CoolList, we list the principal identifier of a neutron star, its name or the name of related supernova remnant (SNR), nebula, or stellar association, its spin period , characteristic dipole field , and distance . Question marks indicate uncertain associations, which are not used in Table LABEL:tab:AgeL. The characteristic field is defined by the standard formula (e.g., Manchester & Taylor, 1977) G, where is in seconds. It gives the field at the magnetic equator of the rotating orthogonal non-relativistic magnetic dipole in vacuo with canonical neutron star parameters: mass , radius km and moment of inertia g cm2.
Table LABEL:tab:AgeL gives the characteristic age (e.g., Manchester & Taylor, 1977) , the age estimated independently of timing, the redshifted bolometric luminosity and redshifted surface temperature in energy units . An estimate can be based on proper motion of the star, on physical properties of the associated SNR or surrounding nebula, or, in a few cases, on historical supernova dates (in these cases gives the time of reported spectral measurements). The characteristic ages are usually treated as upper limits. These limits are rather loose: the true ages can sometimes be a factor of 2 – 3 longer than (for example, for pulsars Vela and J11196127; see Sect. 3.3). Nevertheless, in most cases (cf. Table LABEL:tab:AgeL), sometimes even by orders of magnitude (as for young neutron stars RX J0822.04300, 1E 1207.45209 and CXOU J185238.6+004020).
If a spectral fit includes both thermal and non-thermal components, only the thermal component of the total luminosity is given. If two or more thermal components are included in the spectral fit, we list the temperature for the cooler one and, over the slash, the hotter one, provided the latter contributes substantially (by more than 15%) to the total flux, and we do the same for the effective radius in the comments. For example, ‘ eV, km’ means that one spectral component has been fitted with eV and and the other component with eV and km, so that each component provides more than 15% of the total luminosity. In such cases, the two components may mimic a real inhomogeneity of temperature distribution over the surface. If the energy contribution of the hotter component is small, it is not listed, because in this case it has a small and probably represents a hot polar cap heated by reverse currents from the magnetosphere.
The last column of each table indicates references. The reference numbers are marked by letters: ‘d’ for distance, ‘a’ for the estimated age , and ‘s’ for spectral analysis. The quantities defined by timing (, and ) mostly rely on the ATNF Pulsar Catalogue (Manchester et al., 2005),111https://www.atnf.csiro.au/research/pulsar/psrcat/ to which the reader is addressed for primary references; otherwise we give a reference marked by letter ‘t’ in Table LABEL:tab:CoolList. For pulsars with measured parallaxes, we mostly quote distances corrected for the Lutz-Kelker bias from Verbiest et al. (2012), where the reader can find references to original measurements. Some explanations about the listed estimates for each neutron star are given in the comments below.
The objects in the tables are grouped in several classes. Within each class, they are sorted by their mean equinox.
The first class includes central compact objects (CCOs) in SNRs and other thermally emitting isolated neutron stars (TINSs) without a clear SNR association, which mostly show soft X-ray thermal-like radiation and are not very strongly magnetized ( is below G or non-determined).
The second and third classes are composed, respectively, of ordinary rotation-powered pulsars with moderately strong magnetic fields G and high-B pulsars with G. Such magnetic fields make the temperature distribution over the surface strongly non-uniform, but they only weakly affect thermal luminosity (see Sect. 2.2). The first pulsars with clearly measured thermal X-ray spectra, PSR B0656+14, B105552, and Geminga, were nicknamed the Three Musketeers by Becker & Trümper (1997).
The fourth class consists of the X-ray emitting neutron stars (XINS). These seven INSs, nicknamed The Magnificent Seven, were discovered in the ROSAT All Sky Survey (see Haberl 2007; Turolla 2009; Kaplan & van Kerkwijk 2009, for reviews). Their soft X-ray radiation can be mostly thermal, but unlike CCOs and TINSs, they have very strong magnetic fields, similar to those of the high-B pulsars.
Next, we present a bunch of not too old pulsars with upper bounds on their thermal luminosity, which may be useful for constraining cooling predictions.
Finally we list a group of pulsars whose effective thermally emitting areas are very small ( km), suggesting that their thermal radiation may originate mostly in the polar caps. These estimates may be useful, because the registered hot-cap luminosity can be regarded as an upper bound on the total thermal luminosity. However, these upper bounds are not absolute, because a soft thermal emission from the entire surface might escape detection. For example, Rigoselli & Mereghetti (2018) derived upper bounds of erg s-1 and erg s-1 on the bolometric luminosities of a possible thermal component with between 50 eV and 2 keV for the pulsars B062828 and B0919+06, respectively. Meanwhile, for a neutron star with typical km, thermal radiation with eV (below the formal applicability range of these bounds) would correspond to erg s-1 (well above these limits). On the other hand, there are a number of thermal-like spectra of pulsars, which could be interpreted as produced by hot spots while fitted with the blackbody spectrum, because of rather low inferred and high , whereas the interpretation by a thermal emission from the entire surface becomes possible when an atmosphere model is applied.
The ages and observational estimates of thermal luminosity or surface temperature from Table LABEL:tab:AgeL are compared with theoretical cooling curves in Sect. 4.
3.3 Comments on individual objects
The objects in the list below are numbered in the same order as in Tables LABEL:tab:CoolList and LABEL:tab:AgeL.
3.3.1 Weakly magnetized thermally emitting neutron stars
1. 1E 0102.27219 belongs to a SNR, which was revealed in X-rays by the Einstein observatory. Its location in the Small Magellanic Cloud fixes its distance to kpc (Graczyk et al. 2014 and references therein). Its age was estimated in a number of papers (see Xi et al. 2019 and references therein). Vogt et al. (2018) discovered the respective CCO in the data of the Chandra X-ray observatory. Hebbar, Heinke & Ho (2020) confirmed this detection and performed a spectral analysis using archival Chandra observations. We adopt their preferred result ( MK, , cm-2, erg s-1), which was obtained with the nsmax spectral model222The named atmosphere models (nsmax by Ho, Potekhin & Chabrier 2008; nsa by Zavlin, Pavlov & Shibanov 1996; nsmaxg by Ho 2014; nsx by Ho & Heinke 2009; carbatm by Suleimanov et al. 2014; tbabs by Wilms, Allen & McCray 2000) are from the XSPEC package (Arnaud, 1996) at https://heasarc.gsfc.nasa.gov/docs/xanadu/xspec/ of an atmosphere composed of partially ionized carbon at magnetic field G on a neutron star with fixed and km with free normalization of the point source and background fluxes. This model provides the only satisfactory one-component spectral fit. Other statistically acceptable fits include multiple spectral components and suggest temperatures and luminosities varying in substantially wider ranges. Besides, the authors warn that the high contribution from the background makes the statistical confidence of different fits somewhat uncertain.
2. RX J0822.04300 (PSR J08214300) is a CCO in the SNR Puppis A (G260.403.4). Its age was estimated from the proper motion measurements (Becker et al., 2012). The two blackbody (2BB) fit to the spectrum at fixed distance kpc gives eV with varying from 2.27/0.53 km to 2.04/0.65 km between the “soft” and “hard” phases of the pulse profile (De Luca et al., 2012). The sum of the cooler and hotter components thus varies from erg s-1 in the “soft” phase to erg s-1 in the “hard” phase of the pulse.
3. CXOU J085201.4461753 is a CCO in the SNR Vela Jr. (G266.21.2). Its age and distance were estimated from an expansion rate and a hydrodynamic analysis (Allen et al., 2015). Using the nsx model of the carbon atmosphere, Danilenko, A. A., et al. (2015) showed that the X-ray spectrum of this CCO agrees with thermal radiation of a neutron star at MK. An alternative BB fit implies a small emitting area, which is difficult to agree with the tight constraint on the pulsed fraction .
4. 2XMM J104608.7594306. This neutron star, possibly in the Homunculus nebula around Carina, has purely thermal X-ray spectrum. Its age estimate is based on a proposed association of a nearby star with its progenitor (Pires et al., 2015). Having performed an analysis based on different spectral models, Pires et al. (2015) concluded that the spectrum can only be well fitted with including at least one absorption line at energy 1.35 keV. If interpreted as a redshifted electron cyclotron line, it implies G. In this case, K and the X-ray luminosity erg s -1. Taking into account the gravitational redshift and the bolometric correction, this translates into eV and erg s -1.
5. 1E 1207.45209 (PSR J12105209) is a CCO in the SNR G296.5+10.0. The estimate and uncertainties of the luminosity are obtained by comparison of three fitting models at fixed kpc in Table 1 of Mereghetti et al. (2002). The corresponding effective radius is km. Roger et al. (1988) give kyr with an uncertainty up to a factor of 3.
6. 1RXS J141256.0+792204 (PSR J1412+7922, RX J1412.9+7922). This enigmatic TINS was initially considered as a possible addition to the ‘Magnificent Seven’ and was dubbed ‘Calvera’ (Rutledge, Fox & Shevchuk, 2008). However, subsequent observations suggest that its properties are closer to the CCOs. Halpern, Bogdanov & Gotthelf (2013) characterized Calvera as an ‘orphaned CCO,’ whose magnetic field is emerging through supernova debris. They tried to estimate the distance and age of Calvera and concluded that both remain uncertain by an order of magnitude. Zane et al. (2011) performed the first detailed analysis of its spectrum. Among numerous fits tried by the authors, only those with the interstellar hydrogen column density fixed to the Galactic value cm-2 gave an acceptable reduced chi-square statistic and a reasonable distance (other fits gave distances down to 175 pc, too large and tiny emitting area). A fit with a two-temperature atmosphere model (2NSA) gave eV / eV, with radius of the cold component fixed at the realistic value km. This fit gave erg s-1 at kpc. Other acceptable fits indicated in the range from kpc to kpc. The values of the unabsorbed flux for various statistically acceptable fits implied ranging from erg s-1 to erg s-1, assuming kpc. Shibanov et al. (2016) fitted the XMM-Newton and Chandra data using nsmax models of magnetized hydrogen atmospheres covering the entire surface, assuming a centered dipole field and the ensuing temperature distribution. They found that an additional absorption feature at energy eV improved the fit. In this case, the best-fit model yields MK. The resulting normalization (the effective emitting radius) can be reconciled with km (assumed in the nsmax model) at kpc. The corresponding luminosity is erg s-1. Other fits, performed for different data sets with or without involving the absorption, are only slightly worse statistically. They yield from MK to MK, corresponding to erg s-1. Bogdanov et al. (2019) have performed an analysis of the spectrum obtained with NICER. They fixed kpc and obtained eV, km ( erg s-1) for a blackbody plus power-law (BB+PL) fit with an absorption at eV. An alternative fit including a Gaussian absorption at eV and two blackbody components (the G2BB fit) gives eV, km, totalling to erg s-1. The ranges of and in Table LABEL:tab:AgeL cover the results obtained by Bogdanov et al. (2019) and by Shibanov et al. (2016) for the different instruments.
7. CXOU J160103.1513353 is a CCO in the SNR G330.2+1.0. Proper motion of the SNR fragments indicates an age of 0.8 – 1 kyr, if one neglects deceleration; because of deceleration the actual age should be smaller (Borkowski et al., 2018; Williams et al., 2018). McClure-Griffiths et al. (2001) derived the minimum distance to this SNR of kpc from the observed velocities in the absorption spectrum; a hypothetical maximum distance is kpc. The X-ray spectrum of the CCO is well described with either single-component carbon or two-component hydrogen atmosphere models (Doroshenko et al., 2018). In the latter case, the observed spectrum is dominated by the emission from a hot component with a temperature MK, corresponding to the emission from a hot spot occupying 1% of the stellar surface, assuming a neutron star with and km at kpc. The carbon atmosphere model yields more plausible results. Using absorbed carbatm model with fixed kpc, and km, Doroshenko et al. (2018) obtained non-redshifted temperature MK.
8. 1WGA J1713.43949 is a compact X-ray source, which was suggested to be a neutron star associated with the SNR G347.30.5 (Slane et al., 1999; Lazendic et al., 2003; Cassam-Chenaï et al., 2004). Alternatively, 1WGA J1713.43949 may be a background extra-galactic source (Slane et al., 1999). Radio pulsar PSR J17133945 at the center of the SNR G347.30.5 is unrelated to 1WGA J1713.43949 (Lazendic et al., 2003) and thus could be considered as an alternative association candidate. However, the large characteristic age Myr of PSR J17133945 and its dispersion-measure distance estimate of 4.3 kpc make it unlikely to be associated with the SNR G347.30.5 (Lazendic et al., 2003). Location of the SNR G347.30.5 probably coincides with the historical supernova SN 393 (Wang et al., 1997), giving the age around yr at the time of the XMM-Newton spectral observations. The SNR distance is kpc, as argued by Cassam-Chenaï et al. (2004) and corroborated, e.g., by Moriguchi et al. (2005) and Fukui et al. (2012). The distance kpc is also compatible with kyr (Maxted et al., 2013). A BB+PL fit to the X-ray spectrum () gives eV, and erg s-1, where (Cassam-Chenaï et al., 2004). This is compatible with the hot spot emission, but the lack of pulsations casts doubt on such interpretation. The 2BB fit is slightly better (); it gives eV, erg s-1 for the cold component and eV, erg s-1 for the hot component, but again with small effective radii km.
Our analysis of archival XMM-Newton EPIC-pn data (OBsID 0740830201), using the tbabs nsx model with fixed and km, gives MK, erg s-1 and kpc (at 95% confidence), inconsistent with the distance to G347.30.5. The same fit with fixed kpc requires normalization of 0.2 (i.e., km), which gives erg s-1.
9. XMMU J172054.5372652 is a compact thermal X-ray source, probably associated with the SNR G350.10.3, as suggested by Gaensler et al. (2008), who also proposed that the SNR G350.10.3 is probably interacting with a molecular cloud at kpc. Lovchinsky et al. (2011) showed that the SNR G350.10.3 is in the free expansion stage and calculated an age of 600 – 1200 years.
We used archival Chandra (OBsID 10102, 14806) data and fitted the spectrum with the tbabs nsx model in the range 0.5 – 6 keV. We fixed neutron star mass , radius km and distance kpc. The non-redshifted temperature is MK ( MK; erg s-1). Letting distance to vary, we obtained kpc and MK (95% confidence). In each case we got (356 and 355 d.o.f., respectively).
10. XMMU J173203.3344518 is a CCO in the SNR HESS J1731347 (G353.600.7). For this X-ray source, two likely distance values used to be considered, kpc or kpc (H. E. S. S. Collaboration, 2011). The spectral analysis by Klochkov et al. (2015) gave an acceptable neutron star radius km only for kpc and only for the carbon atmosphere model. The analysis suggested the mass . Later the distance kpc was confirmed by Maxted et al. (2018), based on an analysis of photoabsorption by neutral hydrogen. Klochkov et al. (2015) adopted the age of this neutron star from Tian et al. (2008), who had suggested association of the SNR with molecular gas connected with the HII region G353.4300.37 and calculated a radiative SNR age of 27 kyr. For that age, the obtained eV would be too high to be explained by the ordinary neutron star cooling theory. Klochkov et al. (2015) discussed possible cooling scenarios including unusual baryon superfluidity to explain this oddity. Later, however, it was shown that, at kpc, the SNR should be much younger, kyr (Acero et al., 2015; Cui et al., 2016; Maxted et al., 2018), which can be consistent with less unusual cooling scenarios.
11. CXOU J181852.0150213 is a CCO in the SNR G15.9+00.2. The quoted luminosity and temperature correspond to the spectral fit with the carbon atmosphere model for fixed and km, with unfixed and (Klochkov et al., 2016). This fit gives kpc, compatible with – 16 kpc derived by Sasaki et al. (2018) from the SNR properties (other fits give much larger and therefore should be rejected). The age is estimated as kyr (Sasaki et al., 2018).
12. CXOU J185238.6+004020 (PSR J1852+0040) is a CCO in the SNR Kes 79 (G033.6+00.1). The age estimate is based the SNR properties (Sun et al., 2004). The luminosity and temperature are quoted from Bogdanov (2014), based on the carbatm model and assuming kpc, and , 12, or 14 km. The effective emitting area was allowed to vary and proved to be of the order of the physical surface area (within a factor of – 1.9). The 2BB and nsmax fits give less plausible results (much smaller emitting areas).
13. CXOU J232327.8+584842, aka Cas A NS, is a CCO in the SNR Cas A (G111.702.1), which was produced by supernova observed by Flamsteed on August 16, 1680 (Ashworth 1980; this attribution is supported by the age of the SNR, derived from observations by Fesen et al. 2006). Historically, it is the first neutron star whose spectrum has been successfully fitted by the carbon atmosphere model (Ho & Heinke, 2009). Its temperature and luminosity obtained using this model are rapidly decreasing over the time of its observations by the Chandra X-ray observatory since 2000 (Heinke & Ho, 2010). The decrease of by % from 2000 to 2018 (see table B1 in Wijngaarden et al. 2019) is at odds with theoretical cooling models. It has been tentatively explained by neutrino emission in the Cooper pairing processes (Sect. 2.4), assuming that the internal temperature has passed the critical value for the onset of neutron superfluidity a few decades ago (Shternin et al. 2011; Page et al. 2011; see also Ho et al. 2015 and references therein). However, a revision of the Cooper pairing-related emission rate by Leinson (2010) makes the theoretical cooling rate anyway incompatible with the observed one (Leinson, 2016; Potekhin & Chabrier, 2018). Posselt et al. (2013) suggested that the observed decline may be not intrinsic to the neutron star, and put forward alternative hypotheses for its explanation. According to Posselt & Pavlov (2018), an assumption that the column density can vary between the observations makes the observed flux variation statistically insignificant. The analysis of observations in Chandra ACIS Graded mode (e.g., Heinke & Ho, 2010; Wijngaarden et al., 2019) gives noticeably higher and systematically quicker fading than those in Chandra ACIS subarray mode (Posselt et al., 2013; Posselt & Pavlov, 2018); this difference has not been explained by the time of this writing. The ranges of and in Table LABEL:tab:AgeL accommodate different estimates from the above-cited works over the observation dates from 2000 to 2018.
3.3.2 Moderately magnetized middle-aged pulsars
14. PSR J0205+6449 is located in the SNR 3C 58 (G130.7+03.1), probably a remnant of the historical supernova, observed starting from August 6, 1181 (Stephenson 1971; the attribution was supported by Kothes 2013). Green & Gull (1982) measured a systemic velocity of 3C 58 about km s-1, which they translated to a distance of 2.6 kpc, in the Perseus spiral arm of the Milky Way. Roberts et al. (1993) measured a systemic velocity of 3C 58 about km s-1, which they translated to kpc, using another rotation curve of the Milky Way. Having adopted this distance, Slane et al. (2004) derived a limit of MK for blackbody emission from the entire surface of the pulsar. They also showed that the data were consistent with emission from nsa model for a canonical neutron star with a similar temperature.
Using an advanced approach to the kinematic distance method developed by Foster & MacWilliams (2006), Kothes (2013) derived the improved distance estimate to 3C 58, kpc. This estimate is confirmed by the trigonometric parallax measurements of the distance to the HII region W3 (Xu et al., 2006; Hachisuka et al., 2006), which is located at kpc a few degrees away from 3C 58 and has the same systemic velocity. A spectral modelling of pulsar wind nebula around 3C 58 by Tanaka & Takahara (2013) is compatible with the distance of 2 kpc for assumed ages of 1 kyr or 2.5 kyr.
We reanalysed Chandra data using tbabs (nsmaxg+PL) model with fixed kpc, and km. We obtained temperature from the entire NS surface MK (for the nsmaxg model 123100). Taking the distance uncertainty into account, we obtain erg s-1.
15. PSR J0357+3205, named Morla. De Luca et al. (2013) put rigid bounds on the distance between 0.2 and 0.9 kpc, but the likely birthplace identified by Kirichenko et al. (2014) implies a narrower uncertainty range kpc. The spectral analysis results in Table LABEL:tab:AgeL are also quoted from Kirichenko et al. (2014), who used a neutron star atmosphere model supplemented with power law (NSA+PL). For the NSA component, the best fit eV has been obtained with the nsmax model at fixed and km. This result for and the derived are accepted in Table LABEL:tab:AgeL. The errorbars embrace the result of fitting with a non-fixed radius, which gives eV and km at the 90% confidence level. The luminosity uncertainties in Table LABEL:tab:AgeL (), derived from figures 2 and 3 of Kirichenko et al. (2014), also accommodate the most likely values of other fits in table 2 of Kirichenko et al. (2014).
16. PSR J0538+2817 in the SNR Sim 147 (G180.001.7). The age is determined by proper motion (Kramer et al., 2003) and an analysis of the SNR (Ng et al., 2007). The quoted luminosity and temperature are mainly based on the nsa or nsa+PL spectral fits by Ng et al. (2007) ( MK, km). The uncertainties in the (but not in ) in Table LABEL:tab:AgeL also embrace the BB or BB+PL results ( MK, km).
17. CXOU J061705.3+222127 resides in the SNR IC 443. Although pulsations have not been detected, it is surrounded by a pulsar wind nebula (PWN). Chevalier (1999) has analysed the SNR and obtained its age. Based on the PWN properties, Swartz et al. (2015) derived constraints on the period, s and the surface magnetic field G. The fit for the canonical neutron star with a hydrogen atmosphere nsa model shows an effective temperature eV and a bolometric luminosity erg s-1 (Swartz et al., 2015) (the BB fit gives km, which is too small for radiation from the entire surface but too large for a hot spot).
18. PSR J0633+0632. We adopt the results of Danilenko et al. (2020). The authors argue that the pulsar is hardly associated with the previously suggested Monoceros Loop or Rosette Nebula and point out the open stellar cluster Collinder 106 as another possible birth site. For the thermal component of the spectrum, the nsmax model of an orthogonal magnetic dipole looks most realistic among several models tried by the authors. Magnetic field strengths G or G at the pole yield similar results: distance kpc, temperature eV, a realistic radius of an equivalent thermally emitting sphere km, and luminosity logarithm . Here, the uncertainties are at the 90% confidence (in Table LABEL:tab:AgeL we have reduced them to the level for the sake of uniformity). An alternative model of two hot spots using the BB+PL fit gives eV, km, , and kpc.
19. PSR J0633+1746, aka Geminga, a Musketeer. The distance is known from measured parallax. The best spectral fit by Mori et al. (2014) with unfixed consists of one BB and two PL components; the resulting thermal luminosity range covers the one obtained by De Luca et al. (2005) with fixed and 2BB+PL fit, after scaling from pc (an older parallax measurement, used by De Luca et al. 2005) to the updated value of pc.
20. PSR B0656+14 (J0659+1414), a Musketeer in the SNR Monogem Ring (G201.1+08.3). The distance is known from measured parallax. The 2BB+PL fit results by Arumugasamy et al. (2018) are similar to those by De Luca et al. (2005). In Table LABEL:tab:AgeL we quote the results of the G2BBPL fit of Arumugasamy et al. (2018), that is the 2BB+PL model with an added Gaussian absorption profile, which gives similar (within 20%) temperatures, but more realistic effective radius of the cold component ( km instead of km).
21. PSR B083345 (J08354510) resides in the SNR Vela (G263.93.3). The distance is known from measured parallax. Early estimates of the true age ranged from 5 kyr to 50 kyr (see, e.g., Stothers 1980 for references), being highly model-dependent. Having analysed extended X-ray features in the SNR Vela, Aschenbach et al. (1995) derived kyr, which agrees with the independent estimate of kyr by Jenkins, Silk & Wallerstein (1976). Further analysis (Aschenbach, 2002) showed that the SNR should be at least kyr old. Therefore, we adopt the likely age interval to be 17 – 27 kyr, which exceeds the canonical spindown age kyr. However, the braking index of this pulsar is smaller than the canonical value . Before a glitch, (Akbal et al., 2017), which gives the corrected spindown age (assuming negligibly small initial period) kyr. When averaged over a large timespan covering several glitches, the braking index becomes (Espinoza et al., 2017), which gives kyr. For the luminosity, the 2BB spectral fit from table 6 of Manzali, De Luca & Caraveo (2007) yields eV and km for the cold/hot components at fixed pc, which gives erg s-1; the hot component can also be fitted by a power law (PL) model. An NSA+PL fit at fixed and km gives MK and pc, which corresponds to erg s-1. Ofengeim & Zyuzin (2018) reanalysed the pulsar spectrum and obtained MK with the NSA+PL model at fixed pc, , and km. The employed nsmax model version assumes the dipole distribution of the magnetic field over the surface and the ensuing distribution of temperature (Ho et al., 2008). In this case, the quoted is the effective temperature derived from the total thermal luminosity, which implies erg s-1. Allowing for mass and radius variations, Ofengeim & Zyuzin (2018) arrived at the robust estimate of the effective temperature MK with and km.
22. PSR B105552 (J10575226), a Musketeer. The quoted luminosity and temperature are based on the cold component of the 2BB+PL fit by De Luca et al. (2005), which gives MK, km, erg s-1 at fixed pc (for the hot component, K, km, erg s-1). Based on an analysis of optical and ultraviolet observations, Mignani, Pavlov & Kargaltsev (2010) argue that the actual distance should be smaller than the value based on the dispersion measure; they give pc and scale luminosity to pc. In Table LABEL:tab:AgeL we show with this scaling, including the distance uncertainty.
23. PSR J13576429 in the SNR HESS J1356645 (G309.802.6). The distance is evaluated by dispersion measure (Zavlin, 2007). The quoted luminosity and temperature correspond to the NSA+PL fit by Chang et al. (2012). An alternative BB+PL fit gives km, which is too small for the emission from the entire surface (Chang et al., 2012).
24. PSR B170644 (J17094429), possibly in the SNR G343.102.3. The distance is known from measured parallax. The spectral analysis results are quoted for the best fit in McGowan et al. (2004) (hydrogen NSA+PL model with fixed km); uncertainties embrace other fits with the same .
25. PSR J1740+1000. The two distance values are given by two different electron density distribution models applied to the dispersion measure. The spectral analysis results are quoted for the 2BB fit (Kargaltsev et al., 2012). We present only results for the 2BB fit to the “rise and fall” phase, which are based on a larger energy interval and yield plausible km. The best-fit value for the luminosity is taken from the 2BB model with fixed eV. The uncertainties include phase variations, 2BB fit with non-fixed , and a contribution from the hot component.
26. PSR J17412054 (Swift J174157.6205411). The spectral analysis results are quoted for the only acceptable BB+PL fit by Karpova et al. (2014), rescaled from kpc to 0.8 kpc, which yields km.
27. PSR B182209 (J18250935). The X-ray spectrum is well described by a 2BB model with eV and km, assuming a fixed distance kpc (Hermsen et al., 2017). The hot component can be ascribed to the pulsed emission and the cool component to the unpulsed emission. By analogy with other pulsars, we suggest that the bolometric flux, which is mostly provided by the cool component, is powered by cooling.
28. PSR B182313 (J18261334) is associated with the SNR G18.000.7. This glitching pulsar has a low time-averaged braking index (Espinoza et al., 2017), which gives the corrected characteristic age in the range 24 – 27 kyr. The spectral analysis results listed in Table LABEL:tab:AgeL are adopted from Zhu et al. (2011); they represent the BB+PL fit of Pavlov, Kargaltsev & Brisken (2008). In this case, km.
29. PSR J1836+5925 (GRO J1837+59) was discovered in 1991 as a bright -ray source (Lin et al., 1992). Later it was identified as a neutron star and dubbed ‘Next Geminga’ (Mirabal & Halpern, 2000). Its X-ray counterpart was found in the ROSAT data (Reimer et al., 2001) and observed with Chandra and XMM-Newton (Arumugasamy, 2015). The distance estimate pc is based on assumptions of -ray flux and beaming factor with -ray pulse profile modelling (Abdo et al., 2010). The BB+PL fit to the pulsar spectrum gives eV and km, whereas the fit for the canonical neutron star model, using the non-magnetic nsa+PL model, gives eV (in Table LABEL:tab:AgeL this result is converted to the redshifted temperature and luminosity) and pc at the 90% confidence (Arumugasamy, 2015).
30. PSR B1951+32 (J1952+3252) is associated with the SNR CTB 80 at kpc (Strom & Stappers, 2000). Proper motion of the pulsar gives kyr (Migliazzo et al., 2002). The BB+PL fit to the pulsar spectrum gives eV and km, whereas the 3 upper limit with fixed km is 0.78 MK (Li et al., 2005). These values suggest erg s-1 and erg s-1, respectively.
31. PSR J1957+5033 has been observed in gamma rays by Fermi-LAT (Abdo et al., 2013) and in X-rays by Chandra (Marelli et al., 2015) and by XMM-Newton (Zyuzin et al., 2019, 2020a). The ‘pseudo-distance’ of this gamma pulsar, inferred from comparison between flux and luminosity of gamma pulsars with known distance, equals 0.8 kpc (Marelli et al., 2015). The BB+PL fit yields eV and km ( confidence). The NSA+PL fit using the model of magnetized, partially ionized hydrogen atmosphere nsmaxg with fixed and km for the thermal component results in temperature close to the lowest value available for these models (Zyuzin et al., 2019). Zyuzin et al. (2020a) have computed new atmosphere models, which include lower temperatures, assuming dipole magnetic fields. The polar magnetic field strengths G are chosen to be consistent with timing for this pulsar. The atmosphere models were built for several sets of neutron star parameters. Depending on these parameters and on the inclination of the magnetic dipole axis to the line of sight, the estimates range from eV to eV at distances pc (Zyuzin et al., 2020a).
32. PSR J2021+3651 powers the Dragonfly Nebula (PWN 75.2+0.1). The X-ray spectra of the pulsar and the nebula were resolved in the Chandra observations by Van Etten, Romani & Ng (2008). Kirichenko et al. (2015) conducted deep optical observations of this complex with the Gran Telescopio Canarias and reanalysed the archival Chandra X-ray data. They constructed the extinction-distance relation for the direction toward the pulsar and constrained the distance kpc at the 90% confidence. The BB+PL fit to the pulsar spectrum gives eV and km, whereas the NSA+PL fit, using the nsmax model, gives eV and km at the 90% confidence. In Table LABEL:tab:AgeL we reduce the errors to the confidence level for uniformity with other data in the tables. These fits correspond to erg s-1, respectively. The main source of uncertainty is the poorly known distance. For fixed km and , the NSA+PL fit gives erg s-1.
33. PSR B2334+61 (J2337+6151) in the SNR G114.3+0.3. The NSA fit by McGowan et al. (2006) for the canonical neutron star model with G gives kpc and non-redshifted temperature MK at 90% confidence, which converts into eV and erg s-1 (). The authors prefer a fit with km, because it yields a distance compatible with kpc derived from the pulsar dispersion measure using the NE2001 model of the Galactic electron distribution (Cordes & Lazio, 2002, 2003). It gives the non-redshifted MK at 90% confidence, which at the converts into eV and erg s-1. However, the NE2001 model incorporates a void in the direction of G114.3+0.3, likely to accommodate for the larger distance to the SNR predicted previously by Reich & Braunsfurth (1981). The modern model of the Galactic distribution of free electrons (Yao et al., 2017) yields the distance to the pulsar of 2.08 kpc. Moreover, Yar-Uyaniker et al. (2004) suggested the distance to the SNR of about 700 pc from HI data analysis, which is compatible with the result of the canonical neutron star NSA fit mentioned above. We should note that the BB fit gives much higher temperature MK and small effective radius km, suggesting a possible alternative interpretation of the thermal radiation as produced by hot spots.
3.3.3 High- pulsars and XINSs
34. PSR J07262612. The reported luminosities and temperatures correspond to the best G2BB fit of Rigoselli et al. (2019a). The dispersion measure implies kpc assuming the Galactic electron distribution, but it may be an overestimate, as discussed by Rigoselli et al. (2019a). Speagle, Kaplan & van Kerkwijk (2011) suggested that PSR J07262612 could be associated with the Gould belt and hence kpc. The spectral fitting has been performed for fixed kpc. Then the inferred effective radius for the cooler component in the G2BB fit is km.
35. PSR J11196127 resides in the SNR G292.20.5. The NSA+PL fit of the phase-averaged spectrum with fixed km yields eV and kpc, while the BB+PL fit at fixed kpc gives eV and km (Ng et al., 2012). Interestingly, for braking index of this pulsar, its hosting SNR age of 4.2 – 7.1 kyr, evaluated at kpc, significantly exceeds the corrected characteristic age kyr, which is usually considered as an upper limit to the pulsar’s age (Kumar, Safi-Harb & Gonzalez, 2012). We note that adopting the best-fit distance kpc from the spectral analysis would reduce the estimated age to 1.2 – 2.1 kyr, in agreement with the characteristic age. However, as follows from the analysis by Caswell et al. (2004), such a short distance should imply an unusually high interstellar absorption in the pulsar direction. It is more likely that the mean braking index may be smaller after averaging over a long time covering many glitches, which is usual for the glitching pulsars like this one (see Espinoza et al. 2017); then a lower implies a larger .
36. PSR B150958 (J15135908) has a measured braking index (Livingstone & Kaspi, 2011), which gives a corrected characteristic age kyr. The temperature is quoted from Table 4 of Hu et al. (2017). It is obtained with BB+PL fitting for fixed kpc and km. The luminosity in our Table LABEL:tab:AgeL corresponds to these data. However, is poorly constrained by the observations, and fig. 10 of Hu et al. (2017) shows a larger luminosity interval, erg s-1.
37. PSR J17183718. The luminosity and temperature estimates are quoted from Zhu et al. (2011). The BB model preferred by the authors leads to eV, km and erg s-1. On the other hand, the NSA model with the canonical neutron star parameters, assuming – 10 kpc, leads to – 97 eV, which gives – 74 eV and erg s-1.
38. PSR J18191458 is the only ‘rapid radio transient’ registered in X-rays (see Gençali & Ertan 2018 and references therein). The 2GBB fit by Miller et al. (2013) (the only one with at kpc) gives eV and km. The inferred value of in our Table LABEL:tab:AgeL is consistent with the unabsorbed bolometric flux for this model. The errors accommodate those alternative spectral fits (BB and GBB) in Table 2 of Miller et al. (2013) that have plausible km.
39. RX J0420.05022. The reported results are based on the best fit by Haberl et al. (2004) (GBB model for the canonical neutron star) and the results listed by Kaplan & van Kerkwijk (2009).
40. RX J0720.43125. The spin period of this object is the longest among all currently known XINSs (Hambaryan et al., 2017; the period was previously thought to be twice shorter because of comparable pulses from two antipodal spots). This XINS shows significant variability of its X-ray spectrum (Hohle et al., 2012a, b). Its distance is known from measured parallax. An analysis of Chandra co-added spectra with the GBB model (Hohle et al., 2012a) yields and quoted in Table LABEL:tab:AgeL with km at kpc. Hambaryan et al. (2017) performed a phase-resolved spectral analysis with more physical models of condensed surface and magnetized atmosphere, taking a non-uniform temperature distribution into account. They found phase-dependent best-fit temperature values at magnetic poles in the range eV,
41. RX J0806.44123. The BB and GBB fits by Haberl et al. (2004) give eV and eV, respectively. The luminosities are derived assuming km as given by Kaplan & van Kerkwijk (2009) for the latter fit. They agree with the luminosities in Viganò et al. (2013).
42. RX J1308.6+2127 (RBS1223). The distance pc has been obtained from the spectral analysis together with the temperature and luminosity by Hambaryan et al. (2011). Of three different age estimates suggested by Motch et al. (2009), only the one quoted in Table LABEL:tab:AgeL is compatible with this distance. For pc, the spectral fit implies a large non-redshifted radius km, which may suggest that the actual distance is closer to the estimate by Motch et al. (2009) for the possible neutron-star birthplace, pc. Alternatively this may imply a higher mass, which would yield a large . The effective temperature for this radius is K in the local reference frame. The corresponding luminosity at infinity is erg s-1. The model temperature distribution over the surface has maximum at eV (the minimum is much lower). An alternative BB fit for the canonical neutron star model gives eV and dilution factor 0.34, which corresponds to erg s-1.
43. RX J1605.3+3249 (RBS1556). The age estimate is based on Table 4 of Tetzlaff et al. (2012). Posselt et al. (2007), using different models of the hydrogen column density, derived distances of 390 pc and 325 pc. On the other hand, Motch et al. (2005) link the source with the Sco OB2 association within the Gould Belt, at a mean distance of 120 – 140 pc. Tetzlaff et al. (2012) argue that the neutron star was probably born in the Octans association from a supernova at pc. They adopt the current distance of 300 – 400 pc from Posselt et al. (2007), which requires rather large (though not impossible) space velocity km s-1. Pires et al. (2019) have performed a timing and spectral analysis of XMM-Newton observations. The best multi-epoch fit G2BB at fixed pc for the cooler component gives eV and km, in which case erg s-1 (which we adopt as an upper bound); the hotter component with eV and km adds about 10% to the total energy flux. Multi-epoch fits by different NSA models, modified by a broad Gaussian absorption line at energy eV, give – 130 pc and – 5.8, corresponding to (providing the lower bounds in Table LABEL:tab:AgeL). Note that Pires et al. (2019) have disproved a previously reported spin periodicity of this X-ray source. Malacaria et al. (2019) performed a joint analysis of the NICER and XMM-Newton data. These authors found that pc is hard to accommodate with their data, while a possible distance – 200 pc is consistent with the data. The G2BB model gives eV and erg s-1. Atmosphere models nsa and nsmaxg, modified by an absorption line at eV, yield similar effective temperatures eV (for fixed and km, which requires pc) and eV (at fixed pc, which gives , km; all errors are at 90% confidence). These results lead to erg s-1 (nsa) or erg s-1 (nsmaxg), within the bounds provided by the analysis of Pires et al. (2019).
44. RX J1856.53754, aka the Walter star, is the first discovered neutron star with purely thermal spectrum (Walter, Wolk & Neuhäuser, 1996). Its likely birthplace is Upper Scorpius OB association, which gives kyr (Mignani et al., 2013). The distance is known from parallax measurements. The spectral analysis performed by Ho et al. (2007) with the model of a thin partially ionized hydrogen atmosphere with magnetic field G, being scaled to the updated distance pc (Walter et al., 2010), leads to eV, km, and erg s-1 (Potekhin, 2014). Alternative 2BB, 2BB+PL, and 3BB fitting models have been presented by Sartore et al. (2012) and Yoneyama et al. (2017). They yield eV and km for two BB components, which give similar luminosities at infinity, erg s-1 each.
45. RX J2143.0+0654 (RBS1774, 1RXS J214303.7+065419). The quoted luminosities and temperatures are based on the spectral analysis by Schwope et al. (2009), who supplemented the joint Chandra and XMM-Newton observations with deep optical observations. The lower luminosity bound erg s-1 corresponds to the colder component ( eV, km) at the lowest possible distance pc. The hot circular spot with radius of 1.6 km and eV adds approximately erg s-1, which should be doubled for two antipodal hot spots. The colder component rescaled to fiducial distance pc corresponds to erg s-1, which is adopted as the upper limit in Table LABEL:tab:AgeL. By order of magnitude, these estimates agree with Zampieri et al. (2001), who found erg s-1 On the other hand, if the optical flux measured by Schwope et al. (2009) has a non-thermal origin, then one can rely on the analysis of this source by Cropper et al. (2007), based on BB or GBB models. At fixed pc it gives eV, km, and erg s-1 (we adopt it as a lower bound). Alternative fits for the canonical neutron star model and magnetized NSA give smaller temperatures eV and luminosities erg s-1, but show a poor statistical significance (Cropper et al., 2007).
3.3.4 Upper limits on cooling-powered thermal emission
46. PSR J0007+7303 is a radio-quiet pulsar associated with the SNR CTA 1 (G119.5+10.2). It was observed in X-rays with Chandra, XMM-Newton and Suzaku (Halpern et al., 2004; Caraveo et al., 2010; Lin et al., 2010, 2012) and in gamma-rays with Fermi-LAT (Abdo et al., 2012). The distance of kpc is estimated from the velocity of an H I shell associated with the SNR CTA 1 (Pineault et al., 1993). The age of 9.2 kyr is derived from modelling the dynamics and spectra of the pulsar wind nebula and the SNR CTA 1 using estimates of the molecular mass in the vicinity of the complex (Martín et al., 2016). The analysis of the pulsar X-ray spectrum has been performed by Caraveo et al. (2010). The BB+PL fit gives eV, km and thermal luminosity erg s-1, where . The nsa+PL fit gives eV, km and erg s-1. A power law without a thermal component also provides a good fit (), therefore the above estimates of thermal luminosity can only provide an upper limit.
47. PSR B0531+21 is located in the Crab Nebula, a remnant of the historical supernova, observed starting from July 4, 1054 (e.g., Stephenson & Green, 2003). Trimble (1973) estimated a range of distances between 1.4 and 2.7 kpc based on a variety of lines of evidence. The and limits in Table LABEL:tab:AgeL are determined from Fig. 5 of Weisskopf et al. (2011) at the confidence level, assuming , km, and kpc.
48. PSR B172747 (J17314744) is located in the SNR RCW 114 (G343.006.0). Shternin et al. (2019) measured the proper motion of the pulsar and determined its likely birthplace, distance and age. The spectral analysis has been performed by Zyuzin et al. (2020b) using the nsmaxg+PL model with fixed kpc and km.
49. PSR J2043+2740 is located near the edge of the Cygnus Loop (SNR G074.0-08.6), whose age is –20 kyr at distance pc (Fesen et al., 2018). However, the association with this SNR is very uncertain. Therefore, the distance based on the dispersion measure is usually adopted: kpc in early works (Becker et al., 2004; Zavlin & Pavlov, 2004; Zavlin, 2009) or kpc in more recent papers (Testa et al., 2018). This pulsar has also been observed in gamma rays (Abdo et al., 2013) and in optical bands (Beronya et al., 2015; Testa et al., 2018); its multi-wavelength optical-to-gamma spectrum has been discussed by Testa et al. (2018). There was only one 12-ks observation of this pulsar in X-rays by XMM-Newton in 2002, which gathered about one hundred counts. Zavlin & Pavlov (2004) and Zavlin (2009) argued that this emission should be mostly thermal, since a PL fit gave implausibly large photon index . For a fixed kpc, these authors obtained effective temperatures ranging from 0.5 to 0.9 MK and emitting radii from down to km, with erg s-1, depending on a fit model. For a hot spot with radius km, inferred from the magnetic dipole model (e.g., Manchester & Taylor, 1977), they obtained erg s-1. However, this last estimate would imply an implausibly small distance kpc. On the other hand, an analysis of the same data by Becker et al. (2004) showed a poor statistics for the BB or 2BB fits, but gave an acceptable PL fit with power index of . Because of all these uncertainties, we treat the maximum temperature and luminosity estimates derived by Zavlin & Pavlov (2004) as upper limits. A longer observation of this object would be desirable to shed light on the origin of its X-ray emission.
50. PSR B2224+65 (J2225+6535) is associated with the Guitar bow-shock H nebula. Its radio parallax is mas (Deller et al., 2019). Only non-thermal X-ray flux has been registered from this pulsar. Hui & Becker (2007) estimated its X-ray luminosity as erg s-1. It was not clear, whether the bulk of these observed X-rays originated from the pulsar magnetosphere or from the pulsar wind nebula (Hui et al., 2012). The analysed data only include photon energies above 0.7 keV, which leaves a bolometric correction very uncertain. Hui & Becker (2007) also estimated the upper bound on the temperature of a hot spot MK by adding a BB component to the best-fit PL model and assuming a polar cap of radius 175 m, derived from the standard dipole model (e.g., Manchester & Taylor 1977). We adopt this constraint as a conservative upper limit to the temperature. A more restrictive estimate MK () was derived by Hui & Becker (2007) assuming that the thermal flux is emitted from the whole surface of a canonical neutron star. It corresponds to bolometric flux erg s-1, which we take as a conservative upper limit to the thermal luminosity.
3.3.5 Hot spots on the surfaces of old rotation-powered pulsars
51. PSR B0114+58 (J0117+5914). The distance kpc has been inferred from the dispersion measure by Rigoselli & Mereghetti (2018). The authors obtained the quoted and by an analysis of archival XMM-Newton observations with the BB model. They estimated the effective radius of a plane hot spot on the stellar surface to be m; in Table LABEL:tab:AgeL we list half of this number for the radius of an equivalent sphere .
52. PSR B0943+10 (J0946+0951). We mainly rely on the spectral analysis by Rigoselli et al. (2019b). Namely, we have selected a fit model of the partially ionized hydrogen atmosphere with G in the so called B-mode, where the X-ray flux has minimum. This fit yields eV and m. The condensed surface models give eV and m. The thermal component of the BB+PL fit yields eV and m. The corresponding luminosity range is shown in Table LABEL:tab:AgeL; it agrees with the range of the unabsorbed X-ray flux given in that reference.
53. PSR B1133+16 (J1136+1551). The distance is known from measured parallax. Over 2/3 of this pulsar’s luminosity in the 0.3 – 2 keV range is non-thermal; the radius of equivalent emitting sphere is m (Szary et al., 2017). The redshifted luminosity and temperature in Table LABEL:tab:AgeL are derived from the non-redshifted values in table 6 of that paper.
54. PSR J11546250. The listed distances correspond to two models of the Galactic electron density distribution; the pulsar’s projection on the Cru OB1 association is most likely a chance coincidence (Igoshev et al., 2018). The quoted bolometric luminosity is obtained from the unabsorbed flux erg cm-2 s-1 at kpc (table 3 of the cited reference). It assumes thermal interpretation. However, it may turn out to be only an upper limit, since the PL model fits the spectrum equally well (Igoshev et al., 2018).
55. PSR B1929+10 (J1932+1059). The distance is known from measured parallax. The quoted thermal luminosity from Misanovic, Pavlov & Garmire (2008) is scaled to the updated distance pc (Verbiest et al., 2012) from pc adopted by the authors; the scaled radius of an equivalent emitting sphere m is obtained for the BB+PL spectral model. It may turn out to be only an upper limit, since the PL model yields an acceptable fit with only slightly larger .
3.4 Excluded objects
Here we do not consider the soft gamma repeaters and anomalous X-ray pulsars (SGR/AXPs), luminous neutron stars which reveal powerful bursts Probably they are magnetars, neutron stars with superstrong magnetic fields G, which power their bursting activity (see, e.g., Mereghetti, Pons & Melatos 2015; Kaspi & Beloborodov 2017, for recent reviews). Their persistent radiation, albeit thermal-like in the soft X-ray band, can hardly be related to passive cooling (see Viganò et al., 2013; Potekhin & Chabrier, 2018). It is thought to arise from a complicated blending of surface thermal emission distorted by the presence of a highly magnetized atmosphere, then Comptonized by currents in the magnetosphere, which can further result in surface heating via return currents (e.g., Kaspi & Beloborodov 2017, and references therein). The surface may be also heated by energy release in the crust, driven, for example, by magneto-thermal (e.g., Viganò et al., 2013) or magneto-thermoplastic evolution (Li, Levin & Beloborodov, 2016).
As mentioned in Sect. 3.1, the millisecond pulsars cannot be used for direct testing the cooling theory. They have been recycled during accretion from a binary companion (e.g., Bisnovatyi-Kogan 2006 and references therein), and their ages (typically of the order of gigayears) greatly exceed the passive cooling timescale. Therefore, thermal radiation registered from the millisecond pulsars originates from late-stage heating, either the heating of hot spots by fast particles from the magnetosphere or the internal heating due to slow non-equilibrium processes (Gonzalez & Reisenegger 2010 and references therein). The heating hypothesis was supported by the detection of the far-UV part of the thermal emission from the bulk of the surface of the closest ( pc) millisecond pulsar J04374715 (Kargaltsev et al., 2004; Durant et al., 2012) with Gyr and possibly also from the surface of the millisecond pulsar J21243358 (Rangelov et al., 2017) with Lutz–Kelker-bias-corrected distance pc (Verbiest et al., 2012) and proper-motion-corrected Gyr (Manchester et al., 2005). Recently, modelling the cool thermal component of the UV – X-ray spectrum of PSR J04374715 has resulted in the estimates km and K, which correspond to erg s-1 (González-Caniulef, Guillot & Reisenegger, 2019). Upper limits to thermal fluxes from some millisecond pulsars can be found in González-Jiménez, Petrovich & Reisenegger (2015). A recent study of the millisecond pulsar J09520607 (Ho et al., 2019) provides an upper bound on its luminosity erg s-1. Thermal emission has also been identified from hot ( eV) polar cap of the very old ( Gyr) millisecond pulsar J19093744 with well known mass and distance, which gives erg s-1 (Webb et al., 2019).
We have discarded PSR B0355+54, PSR B1916+14, and PSR J1734-3333 from the catalogue of Zhu et al. (2011), because their effective temperatures and thermal luminosities (probably of hot spots, as suggested by small effective radii) appear to be poorly constrained. We have also discarded PSR B0950+08 and PSR B0823+26 from the same catalogue. In the case of PSR B0823+26, recent observations and analysis (Hermsen et al., 2018) reveal a small effective emitting area ( m) for a thermal-like component of the spectrum; moreover, this component is only observed in the ‘bright mode’ of the pulsar (in the ‘null mode’ the X-ray flux is below detection threshold), which excludes its interpretation in terms of passive cooling. In the case of PSR B0950+08, its effective surface temperature K and bolometric thermal luminosity erg s-1, obtained recently by Pavlov et al. (2017), should be caused by reheating at its characteristic age Myr (as for the above-mentioned millisecond pulsars), whereas treating as only an upper limit to the true age makes this constraint too loose to be useful.
Recently, Guillot et al. (2019) have obtained an upper bound K for slowly rotating ( s) old (proper-motion-corrected Myr) PSR J21443933, which makes it the coldest known neutron star and indicates that the integrated power of reheating processes in slowly rotating neutron stars may be below erg s-1. We have not included this result in the table, because it does not constrain the theory of passive cooling.
The neutron star candidate 1WGA J1952.2+2925 in PWN DA 495 near the center of SNR G065.7+01.2 has a pure thermal spectrum (Karpova et al., 2015), but its age, distance and temperature are very uncertain. Pulsars J0554+3107 and J1105-6037 show thermal emission in the X-ray spectra (Zyuzin et al., 2018), however, due to small count statistics it is hard to estimate their thermal luminosities. The X-ray source RX J0002.9+6246, which was listed in several cooling neutron star collections starting from Page et al. (2004), has been also discarded, because it turned out to be an ordinary star (Esposito et al., 2008).
4 Theory versus observations
Let us compare the cooling theory of INSs with the observational data described in Sect. 3. We will demonstrate the effects of heat blanketing envelopes, stellar mass and models of nucleon superfluidity on the cooling curves. All these effects have been described in the literature. Our aim is to attract attention to some modern theoretical models and use the updated set of observational data.
To simulate neutron-star cooling, we use the numerical code described in Potekhin & Chabrier (2018). The physics input is mainly as reviewed in Potekhin et al. (2015), supplemented by recent updates of the superfluid pairing gaps (Ding et al., 2016) and the modified Urca reaction rates (Shternin et al., 2018). The EoS and the proton fraction in the core correspond to the BSk24 model (Pearson et al., 2018).
4.1 Effects of heat blanket for a star of fixed mass
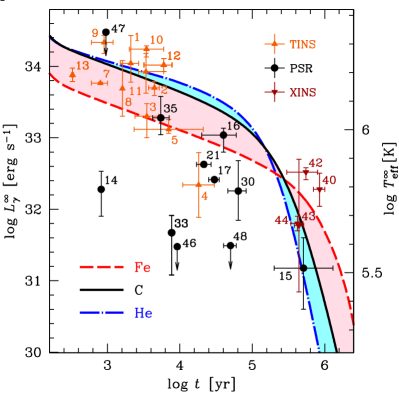
Let us first check the effects of heat blanketing envelopes (Sect. 2.2) against a restricted data set of cooling INSs with estimated ages. Fig. 1 shows cooling curves for a non-superfluid neutron star of mass . The direct Urca processes are forbidden in such a star (for the BSk24 model of matter composition that we use), so that its neutrino cooling is mostly powered by the modified Urca processes. From a practical point of view, it makes sense not to consider fast cooling without superfluidity, because this would produce luminosities substantially below all observations. The dashed curve in the figure shows the cooling of a neutron star with ground-state crust, where the blanketing envelope consists of iron up to g cm-3 and of nickel isotopes at deeper layers. The solid curve shows the case where the ground-state crust is replaced by carbon and then by oxygen up to the densities of and temperatures of carbon and oxygen fusion, respectively (Potekhin & Chabrier, 2012). The dot-dashed curve corresponds to the case where the ground-state matter is replaced by helium at g cm-3. The shaded strips are formed by cooling curves calculated assuming different possible amount of accreted material.
Points and errorbars in Fig. 1 show redshifted luminosities versus ages . Errorbars give uncertainties () of the measured values, and downward arrows mark upper limits on .
According to Fig. 1, variations of chemical composition in the heat blanket of a 1.4 M☉ star allow one to explain much more objects, than in case of one star with fixed heat blanket, but not all selected objects. The coldest stars at the neutrino cooling stage have thermal luminosities far below the theoretical curves (we will see in Sect. 4.2 that this can be explained by enhanced neutrino emission for INSs with large masses).
In contrast, the evolution of INSs at the photon cooling stage is not regulated directly by their neutrino emission. However, INSs observed at the photon cooling stage could not be very powerful neutrino emitters at the previous stage. Otherwise, they would have lost too much heat and would now be too faint to be observed. As seen from Fig. 1, these non-superfluid INSs are reasonably compatible with the standard neutrino cooling provided by the modified Urca processes.
4.2 Effects of fast cooling processes and superfluidity
The proton fraction in the neutron star core grows with . In central regions of the stars with (in the BSk24 model), the proton fraction is above the threshold for opening the powerful neutrino emission via direct Urca processes (see Sect. 2.4). The higher above this threshold, the larger the central part of the core where the direct Urca processes operate.
In Fig. 2 we compare theoretical luminosities and surface temperatures of neutron stars of different masses with all data in Table LABEL:tab:AgeL (not only the objects with known ). When available, we keep using for the age estimate. Otherwise we use characteristic ages and treat them as upper limits (which are, however, not strict, as discussed in Sect. 3.2). If the observed thermal luminosity is thought to be produced by hot spots, the thermal flux from the interior must be smaller, and we supplement errorbars by dotted arrows directed downward.
According to the theory, neutron star cooling can be greatly affected by nucleon superfluidity (see Sect. 2.4). In Fig. 2 we show cooling curves of superfluid neutron stars of different masses. The stars are supposed to have either non-accreted (ground state) heat blanketing envelopes or accreted envelopes composed of helium and carbon. The critical temperatures for singlet neutron, singlet proton and triplet neutron types of pairing as functions of density are evaluated using the MSH, BS and TTav parametrizations of Ho et al. (2015). They are based on theoretical models computed, respectively, by Margueron et al. (2008); Baldo & Schulze (2007); Takatsuka & Tamagaki (2004). For each given type of the blanketing envelope, the cooling curves are close to one another as long as , but they become drastically different at higher .
Comparing the right and left panels of Fig. 2, we see that if, instead of , we employ observed surface temperatures neglecting information on effective emitting sphere radius , then the agreement between the theory and the data becomes generally worse and some upper limits become useless. This illustrates the importance of luminosity estimates for the cooling theory (as was previously stressed, e.g., by Viganò et al. 2013; also see the discussion in Sect. 3.1).
Comparing the data with the computed curves, we see that the models with iron blanketing envelopes are unable to explain the hottest of the younger stars. Accreted envelopes improve the agreement, as we have already seen in Sect. 4.1 for the particular case of star. The enhanced neutrino cooling through the direct Urca process for the more massive stars allows us to explain low thermal luminosities of some sources at the neutrino cooling stage, which remained unexplained in Fig. 1.
The superfluid stars cool down faster at the photon cooling stage, compared with their non-superfluid counterparts discussed in Sect. 4.1. The faster cooling is explained by the heat capacity reduced by superfluidity (see Sect. 2.4). As a consequence, according to Fig. 2, some XINSs are significantly hotter than they should have been at their estimated ages. One explanation may be that some reheating is operating in these objects, but another possibility is an overestimation of the critical temperature of neutrons in our cooling models.
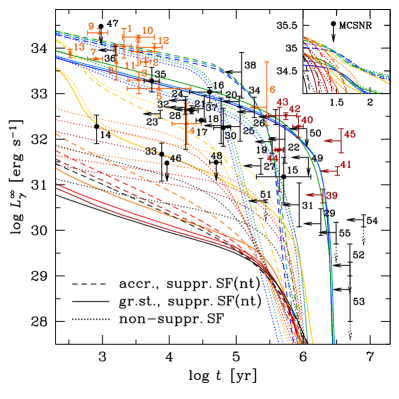
Recent studies have demonstrated that the effects of many-body correlations on baryon superfluidity may strongly reduce the superfluid gap for the triplet type of pairing (e.g., Ding et al., 2016 and references therein; see Sedrakian & Clark 2019 for a discussion). To test an effect of such gap reduction on neutron star cooling, we multiply the TTav gap, used in Fig. 2, by an appropriate suppression factor. We evaluate this factor as the ratio of the neutron triplet pairing gaps calculated with and without inclusion of the many-body correlations (Ding et al., 2016). In this example we rely on the results obtained with the Av18 effective potential that underlies the TTav gap model. Whereas the TTav critical temperature , as parametrized by Ho et al. (2015), has a maximum of K at g cm-3, the reduced barely reaches K at g cm-3 and falls below K at g cm-3. The resulting cooling curves are shown in Fig. 3. The smaller pairing gap cannot strongly reduce the heat capacity of neutrons in the star cores. Moreover, the neutrons remain normal (non-superfluid) in a substantial range of densities in the core. The heat capacity remains relatively large, and the temperature decreases slower. Thus our calculations demonstrate that thermal luminosities of rather warm and old cooling INSs strongly depend on the neutron superfluidity in their cores. The agreement with observations of relatively old cooling neutron stars improves substantially by reduction of the neutron triplet pairing gap. This confirms the analogous conclusions, recently obtained by other authors based on a smaller sample of cooling neutron stars (Taranto et al., 2016; Fortin et al., 2018; Beznogov et al., 2018; Wei et al., 2019; Wei et al., 2020), and also by analysis of thermal luminosities of soft X-ray transients in quiescence (Fortin et al., 2018; Potekhin et al., 2019).
The inset of Fig. 3 shows early cooling ( yr and erg s-1) compared with a tentative upper limit to the luminosity of a possible compact object in the supernova remnant MCSNR J05356916, left after the SN 1987A explosion. This limit, at yr, was obtained by Cigan et al. (2019) by an analysis of high resolution ALMA images of dust and molecules in the SN 1987A ejecta; implications of this possible detection for the neutron star cooling theory were discussed by Page et al. (2020).
Our analysis is illustrative and naturally incomplete. For instance, we have used one model EoS. Other EoSs give different cooling curves; in particular, different models predict different masses for opening fast neutrino cooling. We have also used a limited set of proton and neutron critical temperature profiles and which are extremely model dependent and which can strongly affect the cooling curves.
5 Conclusions
We have revised available observational estimates of ages and thermal luminosities of middle-aged cooling isolated neutron stars and composed a catalogue of their key observational properties for testing theoretical models. A comparison with simulations based on several cooling scenarios shows that the theory can be in good agreement with the data. The estimates of thermal luminosities are usually in better agreement with the cooling theory than temperature estimates for some neutron stars (which may be related to non-uniform temperature distributions over the surfaces of these stars, as discussed in Sect. 3.1).
The data suggest that the enhanced neutrino emission due to direct Urca reactions operate in some (but not in all) neutron stars, which prompts that these neutron stars are more massive than other, so that the proton fraction in their interiors reaches the values, sufficient to enable the direct Urca processes. The data also favour suppression of the neutron triplet superfluidity, in agreement with recent analyses of smaller observational data sets.
acknowledgements
We thank the referee, Dr. Andreas Reisenegger, for many useful remarks and comments, which helped us to improve the paper. The work of A.P., D.Z. and Yu.S. was partially funded by RFBR and DFG according to the research project 19-52-12013. D.Y. was partially supported by the grant 14.W03.31.0021 of the Ministry of Science and Higher Education of the Russian Federation. M.B. is partially supported by the Consejo Nacional de Ciencia y Technología with a CB 2014-1 grant #240512. M.B. also acknowledges support from a postdoctoral fellowship from UNAM DGPAPA.
Data availability
We present the collected data on a dedicated Web page http://www.ioffe.ru/astro/NSG/thermal/cooldat.html; we are planning to update this page on regular basis as new observational data on cooling neutron stars appear.
References
- Abdo et al. (2010) Abdo A. A., Ackermann M., Ajello M., et al. 2010, ApJ, 712, 1209
- Abdo et al. (2012) Abdo A. A., et al., 2012, ApJ, 744, 146
- Abdo et al. (2013) Abdo A. A., Ajello M., Allafort A., et al. 2013, ApJS, 208, 17
- Acero et al. (2015) Acero F., Lemoine-Goumard M., Renaud M., Ballet J., Hewitt J. W., Rousseau R., Tanaka T., 2015, A&A, 580, A74
- Akbal et al. (2017) Akbal O., Alpar M. A., Buchner S., Pines D., 2017, MNRAS, 469, 4183
- Allen et al. (2015) Allen G. E., Chow K., DeLaney T., Filipović M. D., Houck J. C., Pannuti T. G., Stage M. D., 2015, ApJ, 798, 82
- Arnaud (1996) Arnaud K. A., 1996, in Jacoby G. H., Barnes J., eds, Astronomical Society of the Pacific Conference Series Vol. 101, Astronomical Data Analysis Software and Systems V. p. 17
- Arumugasamy (2015) Arumugasamy P., 2015, PhD thesis, The Pennsylvania State University
- Arumugasamy et al. (2018) Arumugasamy P., Kargaltsev O., Posselt B., Pavlov G. G., Hare J., 2018, ApJ, 869, 97
- Aschenbach (2002) Aschenbach B., 2002, in Becker W., Lesch H., Trümper J., eds, Proceedings of the 270. WE-Heraeus Seminar on Neutron Stars, Pulsars, and Supernova Remnants. pp 13–25 (arXiv:astro-ph/0208492)
- Aschenbach et al. (1995) Aschenbach B., Egger R., Trümper J., 1995, Nature, 373, 587
- Ashworth (1980) Ashworth W. B. J., 1980, Journal for the History of Astronomy, 11, 1
- Baldo & Schulze (2007) Baldo M., Schulze H. J., 2007, Phys. Rev. C, 75, 025802
- Becker & Trümper (1997) Becker W., Trümper J., 1997, A&A, 326, 682
- Becker et al. (2004) Becker W., Weisskopf M. C., Tennant A. F., Jessner A., Dyks J., Harding A. K., Zhang S. N., 2004, ApJ, 615, 908
- Becker et al. (2012) Becker W., Prinz T., Winkler P. F., Petre R., 2012, ApJ, 755, 141
- Beronya et al. (2015) Beronya D. M., Shibanov Y. A., Zyuzin D. A., Komarova V. N., 2015, J. Phys.: Conf. Ser., 661, 012001
- Beznogov & Yakovlev (2015) Beznogov M. V., Yakovlev D. G., 2015, MNRAS, 447, 1598
- Beznogov et al. (2016) Beznogov M. V., Potekhin A. Y., Yakovlev D. G., 2016, MNRAS, 459, 1569
- Beznogov et al. (2018) Beznogov M. V., Rrapaj E., Page D., Reddy S., 2018, Phys. Rev. C, 98, 035802
- Beznogov et al. (2020) Beznogov M. V., Page D., Ramirez-Ruiz E., 2020, ApJ, 888, 97
- Bisnovatyi-Kogan (2006) Bisnovatyi-Kogan G. S., 2006, Phys. Usp., 49, 53
- Bogdanov (2014) Bogdanov S., 2014, ApJ, 790, 94
- Bogdanov et al. (2019) Bogdanov S., et al., 2019, ApJ, 877, 69
- Borkowski et al. (2018) Borkowski K. J., Reynolds S. P., Williams B. J., Petre R., 2018, ApJ, 868, L21
- Caraveo et al. (2010) Caraveo P. A., De Luca A., Marelli M., Bignami G. F., Ray P. S., Saz Parkinson P. M., Kanbach G., 2010, ApJ, 725, L6
- Cassam-Chenaï et al. (2004) Cassam-Chenaï G., Decourchelle A., Ballet J., Sauvageot J. L., Dubner G., Giacani E., 2004, A&A, 427, 199
- Caswell et al. (2004) Caswell J. L., McClure-Griffiths N. M., Cheung M. C. M., 2004, MNRAS, 352, 1405
- Chang & Bildsten (2003) Chang P., Bildsten L., 2003, ApJ, 585, 464
- Chang et al. (2010) Chang P., Bildsten L., Arras P., 2010, ApJ, 723, 719
- Chang et al. (2012) Chang C., Pavlov G. G., Kargaltsev O., Shibanov Y. A., 2012, ApJ, 744, 81
- Chatterjee et al. (2015) Chatterjee D., Elghozi T., Novak J., Oertel M., 2015, MNRAS, 447, 3785
- Chevalier (1999) Chevalier R. A., 1999, ApJ, 511, 798
- Cigan et al. (2019) Cigan P., et al., 2019, ApJ, 886, 51
- Cordes & Lazio (2002) Cordes J. M., Lazio T. J. W., 2002, arXiv e-prints, pp astro–ph/0207156
- Cordes & Lazio (2003) Cordes J. M., Lazio T. J. W., 2003, arXiv e-prints, pp astro–ph/0301598
- Cropper et al. (2007) Cropper M., Zane S., Turolla R., Zampieri L., Chieregato M., Drake J., Treves A., 2007, Ap&SS, 308, 161
- Cui et al. (2016) Cui Y., Pühlhofer G., Santangelo A., 2016, A&A, 591, A68
- Danilenko, A. A., et al. (2015) Danilenko, A. A., et al. 2015, One more neutron star with carbon atmosphere, Report at the conference ‘High energy astrophysics today and tomorrow – HEA-15’ (Moscow, Russia, 21–24 Dec. 2015)
- Danilenko et al. (2020) Danilenko A., Karpova A., Ofengeim D., Shibanov Y., Zyuzin D., 2020, MNRAS, 493, 1874
- De Blasio (2000) De Blasio F. V., 2000, A&A, 353, 1129
- De Luca et al. (2005) De Luca A., Caraveo P. A., Mereghetti S., Negroni M., Bignami G. F., 2005, ApJ, 623, 1051
- De Luca et al. (2012) De Luca A., et al., 2012, MNRAS, 421, L72
- De Luca et al. (2013) De Luca A., et al., 2013, ApJ, 765, L19
- Deller et al. (2019) Deller A. T., et al., 2019, ApJ, 875, 100
- Ding et al. (2016) Ding D., Rios A., Dussan H., Dickhoff W. H., Witte S. J., Carbone A., Polls A., 2016, Phys. Rev. C, 94, 025802
- Doroshenko et al. (2018) Doroshenko V., Suleimanov V., Santangelo A., 2018, A&A, 618, A76
- Durant et al. (2012) Durant M., Kargaltsev O., Pavlov G. G., Kowalski P. M., Posselt B., van Kerkwijk M. H., Kaplan D. L., 2012, ApJ, 746, 6
- Espinoza et al. (2017) Espinoza C. M., Lyne A. G., Stappers B. W., 2017, MNRAS, 466, 147
- Esposito et al. (2008) Esposito P., De Luca A., Tiengo A., Paizis A., Mereghetti S., Caraveo P. A., 2008, MNRAS, 384, 225
- Fesen (1984) Fesen R. A., 1984, ApJ, 281, 658
- Fesen et al. (2006) Fesen R. A., et al., 2006, ApJ, 645, 283
- Fesen et al. (2018) Fesen R. A., Weil K. E., Cisneros I. A., Blair W. P., Raymond J. C., 2018, MNRAS, 481, 1786
- Fortin et al. (2018) Fortin M., Taranto G., Burgio G. F., Haensel P., Schulze H. J., Zdunik J. L., 2018, MNRAS, 475, 5010
- Foster & MacWilliams (2006) Foster T., MacWilliams J., 2006, ApJ, 644, 214
- Fukui et al. (2012) Fukui Y., et al., 2012, ApJ, 746, 82
- Gaensler et al. (1999) Gaensler B. M., Brazier K. T. S., Manchester R. N., Johnston S., Green A. J., 1999, MNRAS, 305, 724
- Gaensler et al. (2008) Gaensler B. M., et al., 2008, ApJ, 680, L37
- Gandolfi et al. (2009) Gandolfi S., Illarionov A. Y., Pederiva F., Schmidt K. E., Fantoni S., 2009, Phys. Rev. C, 80, 045802
- Gençali & Ertan (2018) Gençali A. A., Ertan Ü., 2018, MNRAS, 481, 244
- Giacani et al. (2000) Giacani E. B., Dubner G. M., Green A. J., Goss W. M., Gaensler B. M., 2000, AJ, 119, 281
- Giacani et al. (2009) Giacani E., Smith M. J. S., Dubner G., Loiseau N., Castelletti G., Paron S., 2009, A&A, 507, 841
- Gnedin et al. (2001) Gnedin O. Y., Yakovlev D. G., Potekhin A. Y., 2001, MNRAS, 324, 725
- Gonzalez & Reisenegger (2010) Gonzalez D., Reisenegger A., 2010, A&A, 522, A16
- González-Caniulef et al. (2019) González-Caniulef D., Guillot S., Reisenegger A., 2019, MNRAS, 490, 5848
- González-Jiménez et al. (2015) González-Jiménez N., Petrovich C., Reisenegger A., 2015, MNRAS, 447, 2073
- Graczyk et al. (2014) Graczyk D., et al., 2014, ApJ, 780, 59
- Green & Gull (1982) Green D. A., Gull S. F., 1982, Nature, 299, 606
- Greenstein & Hartke (1983) Greenstein G., Hartke G. J., 1983, ApJ, 271, 283
- Grigorian et al. (2018) Grigorian H., Voskresensky D. N., Maslov K. A., 2018, Nuclear Phys. A, 980, 105
- Gudmundsson et al. (1983) Gudmundsson E. H., Pethick C. J., Epstein R. I., 1983, ApJ, 272, 286
- Guillot et al. (2019) Guillot S., Pavlov G. G., Reyes C., Reisenegger A., Rodriguez L. E., Rangelov B., Kargaltsev O., 2019, ApJ, 874, 175
- H. E. S. S. Collaboration (2011) H. E. S. S. Collaboration 2011, A&A, 531, A81
- Haberl (2007) Haberl F., 2007, Ap&SS, 308, 181
- Haberl et al. (2004) Haberl F., et al., 2004, A&A, 424, 635
- Hachisuka et al. (2006) Hachisuka K., et al., 2006, ApJ, 645, 337
- Haensel (1995) Haensel P., 1995, Space Sci. Rev., 74, 427
- Haensel et al. (2007) Haensel P., Potekhin A. Y., Yakovlev D. G., 2007, Neutron Stars. 1. Equation of State and Structure. Astrophys. Space Sci. Library Vol. 326, Springer, New York
- Halpern & Gotthelf (2015) Halpern J. P., Gotthelf E. V., 2015, ApJ, 812, 61
- Halpern et al. (2004) Halpern J. P., Gotthelf E. V., Camilo F., Helfand D. J., Ransom S. M., 2004, ApJ, 612, 398
- Halpern et al. (2013) Halpern J. P., Bogdanov S., Gotthelf E. V., 2013, ApJ, 778, 120
- Hambaryan et al. (2011) Hambaryan V., Suleimanov V., Schwope A. D., Neuhäuser R., Werner K., Potekhin A. Y., 2011, A&A, 534, A74
- Hambaryan et al. (2017) Hambaryan V., Suleimanov V., Haberl F., Schwope A. D., Neuhäuser R., Hohle M., Werner K., 2017, A&A, 601, A108
- Hameury et al. (1983) Hameury J. M., Heyvaerts J., Bonazzola S., 1983, A&A, 121, 259
- Hebbar et al. (2020) Hebbar P. R., Heinke C. O., Ho W. C. G., 2020, MNRAS, 491, 1585
- Heinke & Ho (2010) Heinke C. O., Ho W. C. G., 2010, ApJ, 719, L167
- Hermsen et al. (2017) Hermsen W., et al., 2017, MNRAS, 466, 1688
- Hermsen et al. (2018) Hermsen W., et al., 2018, MNRAS, 480, 3655
- Ho (2014) Ho W. C. G., 2014, in Petit P., Jardine M., Spruit H. C., eds, IAU Symposium Vol. 302, Magnetic Fields throughout Stellar Evolution. pp 435–438 (arXiv:1311.5583)
- Ho & Heinke (2009) Ho W. C. G., Heinke C. O., 2009, Nature, 462, 71
- Ho et al. (2007) Ho W. C. G., Kaplan D. L., Chang P., van Adelsberg M., Potekhin A. Y., 2007, MNRAS, 375, 821
- Ho et al. (2008) Ho W. C. G., Potekhin A. Y., Chabrier G., 2008, ApJS, 178, 102
- Ho et al. (2015) Ho W. C. G., Elshamouty K. G., Heinke C. O., Potekhin A. Y., 2015, Phys. Rev. C, 91, 015806
- Ho et al. (2019) Ho W. C. G., Heinke C. O., Chugunov A. I., 2019, ApJ, 882, 128
- Hohle et al. (2012a) Hohle M. M., Haberl F., Vink J., de Vries C. P., Neuhäuser R., 2012a, MNRAS, 419, 1525
- Hohle et al. (2012b) Hohle M. M., Haberl F., Vink J., de Vries C. P., Turolla R., Zane S., Méndez M., 2012b, MNRAS, 423, 1194
- Hu et al. (2017) Hu C.-P., Ng C. Y., Takata J., Shannon R. M., Johnston S., 2017, ApJ, 838, 156
- Hui & Becker (2007) Hui C. Y., Becker W., 2007, A&A, 467, 1209
- Hui et al. (2012) Hui C. Y., Huang R. H. H., Trepl L., Tetzlaff N., Takata J., Wu E. M. H., Cheng K. S., 2012, ApJ, 747, 74
- Igoshev et al. (2018) Igoshev A. P., Tsygankov S. S., Rigoselli M., Mereghetti S., Popov S. B., Elfritz J. G., Mushtukov A. A., 2018, ApJ, 865, 116
- Jenkins et al. (1976) Jenkins E. B., Silk J., Wallerstein G., 1976, ApJS, 32, 681
- Kaplan & van Kerkwijk (2009) Kaplan D. L., van Kerkwijk M. H., 2009, ApJ, 705, 798
- Kaplan & van Kerkwijk (2011) Kaplan D. L., van Kerkwijk M. H., 2011, ApJ, 740, L30
- Kaplan et al. (2011) Kaplan D. L., Kamble A., van Kerkwijk M. H., Ho W. C. G., 2011, ApJ, 736, 117
- Kargaltsev & Pavlov (2007) Kargaltsev O., Pavlov G., 2007, Ap&SS, 308, 287
- Kargaltsev et al. (2004) Kargaltsev O., Pavlov G. G., Romani R. W., 2004, ApJ, 602, 327
- Kargaltsev et al. (2012) Kargaltsev O., Durant M., Misanovic Z., Pavlov G. G., 2012, Science, 337, 946
- Karpova et al. (2014) Karpova A., Danilenko A., Shibanov Y., Shternin P., Zyuzin D., 2014, ApJ, 789, 97
- Karpova et al. (2015) Karpova A., Zyuzin D., Danilenko A., Shibanov Y., 2015, MNRAS, 453, 2241
- Kaspi & Beloborodov (2017) Kaspi V. M., Beloborodov A. M., 2017, Annual Rev. Astron. Astrophys., 55, 261
- Kirichenko et al. (2014) Kirichenko A., Danilenko A., Shibanov Y., Shternin P., Zharikov S., Zyuzin D., 2014, A&A, 564, A81
- Kirichenko et al. (2015) Kirichenko A., et al., 2015, ApJ, 802, 17
- Klochkov et al. (2015) Klochkov D., Suleimanov V., Pühlhofer G., Yakovlev D. G., Santangelo A., Werner K., 2015, A&A, 573, A53
- Klochkov et al. (2016) Klochkov D., Suleimanov V., Sasaki M., Santangelo A., 2016, A&A, 592, L12
- Kochanek et al. (2019) Kochanek C. S., Auchettl K., Belczynski K., 2019, MNRAS, 485, 5394
- Kothes (2013) Kothes R., 2013, A&A, 560, A18
- Kramer et al. (2003) Kramer M., Lyne A. G., Hobbs G., Löhmer O., Carr P., Jordan C., Wolszczan A., 2003, ApJ, 593, L31
- Kumar et al. (2012) Kumar H. S., Safi-Harb S., Gonzalez M. E., 2012, ApJ, 754, 96
- Lazendic et al. (2003) Lazendic J. S., Slane P. O., Gaensler B. M., Plucinsky P. P., Hughes J. P., Galloway D. K., Crawford F., 2003, ApJ, 593, L27
- Leinson (2010) Leinson L. B., 2010, Phys. Rev. C, 81, 025501
- Leinson (2016) Leinson L. B., 2016, arXiv e-prints
- Li et al. (2005) Li X. H., Lu F. J., Li T. P., 2005, ApJ, 628, 931
- Li et al. (2016) Li X., Levin Y., Beloborodov A. M., 2016, ApJ, 833, 189
- Lin et al. (1992) Lin Y. C., Chiang J., Fierro J., et al. 1992, IAU Circ., 5676, 2
- Lin et al. (2010) Lin L. C. C., Huang R. H. H., Takata J., Hwang C. Y., Kong A. K. H., Hui C. Y., 2010, ApJ, 725, L1
- Lin et al. (2012) Lin L. C. C., et al., 2012, MNRAS, 426, 2283
- Livingstone & Kaspi (2011) Livingstone M. A., Kaspi V. M., 2011, ApJ, 742, 31
- Lovchinsky et al. (2011) Lovchinsky I., Slane P., Gaensler B. M., Hughes J. P., Ng C. Y., Lazendic J. S., Gelfand J. D., Brogan C. L., 2011, ApJ, 731, 70
- Malacaria et al. (2019) Malacaria C., et al., 2019, ApJ, 880, 74
- Manchester & Taylor (1977) Manchester R. N., Taylor J. H. J., 1977, Pulsars. W. H. Freeman & Co., San Francisco
- Manchester et al. (2005) Manchester R. N., Hobbs G. B., Teoh A., Hobbs M., 2005, AJ, 129, 1993
- Manzali et al. (2007) Manzali A., De Luca A., Caraveo P. A., 2007, ApJ, 669, 570
- Marelli et al. (2015) Marelli M., Mignani R. P., De Luca A., Saz Parkinson P. M., Salvetti D., Den Hartog P. R., Wolff M. T., 2015, ApJ, 802, 78
- Margueron et al. (2008) Margueron J., Sagawa H., Hagino K., 2008, Phys. Rev. C, 77, 054309
- Martín et al. (2016) Martín J., Torres D. F., Pedaletti G., 2016, MNRAS, 459, 3868
- Maxted et al. (2013) Maxted N. I., et al., 2013, Publ. Astron. Soc. Australia, 30, e055
- Maxted et al. (2018) Maxted N., et al., 2018, MNRAS, 474, 662
- McClure-Griffiths et al. (2001) McClure-Griffiths N. M., Green A. J., Dickey J. M., Gaensler B. M., Haynes R. F., Wieringa M. H., 2001, ApJ, 551, 394
- McGowan et al. (2004) McGowan K. E., Zane S., Cropper M., Kennea J. A., Córdova F. A., Ho C., Sasseen T., Vestrand W. T., 2004, ApJ, 600, 343
- McGowan et al. (2006) McGowan K. E., Zane S., Cropper M., Vestrand W. T., Ho C., 2006, ApJ, 639, 377
- Meisel et al. (2018) Meisel Z., Deibel A., Keek L., Shternin P., Elfritz J., 2018, J. Phys. G: Nucl. Phys., 45, 093001
- Mereghetti et al. (2002) Mereghetti S., De Luca A., Caraveo P. A., Becker W., Mignani R., Bignami G. F., 2002, ApJ, 581, 1280
- Mereghetti et al. (2015) Mereghetti S., Pons J. A., Melatos A., 2015, Space Sci. Rev., 191, 315
- Migliazzo et al. (2002) Migliazzo J. M., Gaensler B. M., Backer D. C., Stappers B. W., van der Swaluw E., Strom R. G., 2002, ApJ, 567, L141
- Mignani et al. (2010) Mignani R. P., Pavlov G. G., Kargaltsev O., 2010, ApJ, 720, 1635
- Mignani et al. (2013) Mignani R. P., et al., 2013, MNRAS, 429, 3517
- Miller et al. (2013) Miller J. J., McLaughlin M. A., Rea N., Lazaridis K., Keane E. F., Kramer M., Lyne A., 2013, ApJ, 776, 104
- Mirabal & Halpern (2000) Mirabal N., Halpern J. P., 2000, in American Astronomical Society Meeting Abstracts. p. 63.01
- Misanovic et al. (2008) Misanovic Z., Pavlov G. G., Garmire G. P., 2008, ApJ, 685, 1129
- Misner et al. (1973) Misner C. W., Thorne K. S., Wheeler J. A., 1973, Gravitation. W. H. Freeman and Co., San Francisco
- Mori et al. (2014) Mori K., et al., 2014, ApJ, 793, 88
- Moriguchi et al. (2005) Moriguchi Y., Tamura K., Tawara Y., Sasago H., Yamaoka K., Onishi T., Fukui Y., 2005, ApJ, 631, 947
- Motch et al. (2005) Motch C., Sekiguchi K., Haberl F., Zavlin V. E., Schwope A., Pakull M. W., 2005, A&A, 429, 257
- Motch et al. (2009) Motch C., Pires A. M., Haberl F., Schwope A., Zavlin V. E., 2009, A&A, 497, 423
- Ng et al. (2007) Ng C. Y., Romani R. W., Brisken W. F., Chatterjee S., Kramer M., 2007, ApJ, 654, 487
- Ng et al. (2012) Ng C. Y., Kaspi V. M., Ho W. C. G., Weltevrede P., Bogdanov S., Shannon R., Gonzalez M. E., 2012, ApJ, 761, 65
- Ofengeim & Zyuzin (2018) Ofengeim D. D., Zyuzin D. A., 2018, Particles, 1, 194
- Page (2009) Page D., 2009, in Becker W., ed., Astrophys. Space Sci. Library Vol. 357, Neutron Stars and Pulsars. pp 247–288
- Page (2016) Page D., 2016, NSCool: Neutron star cooling code (ascl:1609.009)
- Page et al. (2004) Page D., Lattimer J. M., Prakash M., Steiner A. W., 2004, ApJS, 155, 623
- Page et al. (2011) Page D., Prakash M., Lattimer J. M., Steiner A. W., 2011, Phys. Rev. Lett., 106, 081101
- Page et al. (2014) Page D., Lattimer J. M., Prakash M., Steiner A. W., 2014, in Bennemann K.-H., Ketterson J. B., eds, International Series of Monographs on Physics Vol. 2, Novel Superfluids. pp 505–579
- Page et al. (2020) Page D., Beznogov M. V., Garibay I., Lattimer J. M., Prakash M., Janka H.-T., 2020, arXiv e-prints, p. arXiv:2004.06078
- Pavlov et al. (2008) Pavlov G. G., Kargaltsev O., Brisken W. F., 2008, ApJ, 675, 683
- Pavlov et al. (2017) Pavlov G. G., Rangelov B., Kargaltsev O., Reisenegger A., Guillot S., Reyes C., 2017, ApJ, 850, 79
- Pearson et al. (2018) Pearson J. M., Chamel N., Potekhin A. Y., Fantina A. F., Ducoin C., Dutta A. K., Goriely S., 2018, MNRAS, 481, 2994
- Pineault et al. (1993) Pineault S., Landecker T. L., Madore B., Gaumont-Guay S., 1993, AJ, 105, 1060
- Pires et al. (2015) Pires A. M., Motch C., Turolla R., Popov S. B., Schwope A. D., Treves A., 2015, A&A, 583, A117
- Pires et al. (2019) Pires A. M., Schwope A. D., Haberl F., Zavlin V. E., Motch C., Zane S., 2019, A&A, 623, A73
- Pons & Viganò (2019) Pons J. A., Viganò D., 2019, Living Rev. Comput. Astrophys., 5, 3
- Posselt & Pavlov (2018) Posselt B., Pavlov G. G., 2018, ApJ, 864, 135
- Posselt et al. (2007) Posselt B., Popov S. B., Haberl F., Trümper J., Turolla R., Neuhäuser R., 2007, Ap&SS, 308, 171
- Posselt et al. (2013) Posselt B., Pavlov G. G., Suleimanov V., Kargaltsev O., 2013, ApJ, 779, 186
- Potekhin (2014) Potekhin A. Y., 2014, Phys. Usp., 57, 735
- Potekhin & Chabrier (2012) Potekhin A. Y., Chabrier G., 2012, A&A, 538, A115
- Potekhin & Chabrier (2018) Potekhin A. Y., Chabrier G., 2018, Astronomy and Astrophysics, 609, A74
- Potekhin & Yakovlev (2001) Potekhin A. Y., Yakovlev D. G., 2001, A&A, 374, 213
- Potekhin et al. (1997) Potekhin A. Y., Chabrier G., Yakovlev D. G., 1997, A&A, 323, 415
- Potekhin et al. (2003) Potekhin A. Y., Yakovlev D. G., Chabrier G., Gnedin O. Y., 2003, ApJ, 594, 404
- Potekhin et al. (2005) Potekhin A. Y., Urpin V., Chabrier G., 2005, A&A, 443, 1025
- Potekhin et al. (2015) Potekhin A. Y., Pons J. A., Page D., 2015, Space Sci. Rev., 191, 239
- Potekhin et al. (2019) Potekhin A. Y., Chugunov A. I., Chabrier G., 2019, A&A, 629, A88
- Raduta et al. (2019) Raduta A. R., Li J. J., Sedrakian A., Weber F., 2019, MNRAS, 487, 2639
- Rangelov et al. (2017) Rangelov B., Pavlov G. G., Kargaltsev O., Reisenegger A., Guillot S., van Kerkwijk M. H., Reyes C., 2017, ApJ, 835, 264
- Reed et al. (1995) Reed J. E., Hester J. J., Fabian A. C., Winkler P. F., 1995, ApJ, 440, 706
- Reich & Braunsfurth (1981) Reich W., Braunsfurth E., 1981, A&A, 99, 17
- Reimer et al. (2001) Reimer O., Brazier K. T. S., Carramiñana A., Kanbach G., Nolan P. L., Thompson D. J., 2001, MNRAS, 324, 772
- Reynoso et al. (2003) Reynoso E. M., Green A. J., Johnston S., Dubner G. M., Giacani E. B., Goss W. M., 2003, MNRAS, 345, 671
- Richardson et al. (1982) Richardson M. B., van Horn H. M., Ratcliff K. F., Malone R. C., 1982, ApJ, 255, 624
- Rigoselli & Mereghetti (2018) Rigoselli M., Mereghetti S., 2018, A&A, 615, A73
- Rigoselli et al. (2019a) Rigoselli M., Mereghetti S., Suleimanov V., Potekhin A. Y., Turolla R., Taverna R., Pintore F., 2019a, A&A, 627, A69
- Rigoselli et al. (2019b) Rigoselli M., Mereghetti S., Turolla R., Taverna R., Suleimanov V., Potekhin A. Y., 2019b, ApJ, 872, 15
- Roberts et al. (1993) Roberts D. A., Goss W. M., Kalberla P. M. W., Herbstmeier U., Schwarz U. J., 1993, A&A, 274, 427
- Roger et al. (1988) Roger R. S., Milne D. K., Kesteven M. J., Wellington K. J., Haynes R. F., 1988, ApJ, 332, 940
- Rutledge et al. (2008) Rutledge R. E., Fox D. B., Shevchuk A. H., 2008, ApJ, 672, 1137
- Salmi et al. (2020) Salmi T., Suleimanov V. F., Nättilä J., Poutanen J., 2020, arXiv e-prints, p. arXiv:2002.11427
- Sartore et al. (2012) Sartore N., Tiengo A., Mereghetti S., De Luca A., Turolla R., Haberl F., 2012, A&A, 541, A66
- Sasaki et al. (2018) Sasaki M., Mäkelä M. M., Klochkov D., Santangelo A., Suleimanov V., 2018, MNRAS, 479, 3033
- Schwope et al. (2009) Schwope A. D., et al., 2009, A&A, 499, 267
- Sedrakian (2019) Sedrakian A., 2019, Phys. Rev. D, 99, 043011
- Sedrakian & Clark (2019) Sedrakian A., Clark J. W., 2019, European Physical Journal A, 55, 167
- Shibanov et al. (2005) Shibanov Y. A., Sollerman J., Lundqvist P., Gull T., Lindler D., 2005, A&A, 440, 693
- Shibanov et al. (2016) Shibanov Y., Danilenko A., Zharikov S., Shternin P., Zyuzin D., 2016, ApJ, 831, 112
- Shternin et al. (2011) Shternin P. S., Yakovlev D. G., Heinke C. O., Ho W. C. G., Patnaude D. J., 2011, MNRAS, 412, L108
- Shternin et al. (2018) Shternin P. S., Baldo M., Haensel P., 2018, Phys. Lett. B, 786, 28
- Shternin et al. (2019) Shternin P., Kirichenko A., Zyuzin D., Yu M., Danilenko A., Voronkov M., Shibanov Y., 2019, ApJ, 877, 78
- Slane et al. (1999) Slane P., Gaensler B. M., Dame T. M., Hughes J. P., Plucinsky P. P., Green A., 1999, ApJ, 525, 357
- Slane et al. (2004) Slane P., Helfand D. J., van der Swaluw E., Murray S. S., 2004, ApJ, 616, 403
- Smith (2006) Smith N., 2006, ApJ, 644, 1151
- Speagle et al. (2011) Speagle J. S., Kaplan D. L., van Kerkwijk M. H., 2011, ApJ, 743, 183
- Stephenson (1971) Stephenson F. R., 1971, QJRAS, 12, 10
- Stephenson & Green (2003) Stephenson F. R., Green D. A., 2003, Journal of Astronomical History and Heritage, 6, 46
- Stothers (1980) Stothers R., 1980, PASP, 92, 145
- Strom & Stappers (2000) Strom R. G., Stappers B. W., 2000, in Kramer M., Wex N., Wielebinski R., eds, Astronomical Society of the Pacific Conference Series Vol. 202, IAU Colloq. 177: Pulsar Astronomy - 2000 and Beyond. p. 509
- Suleimanov et al. (2014) Suleimanov V. F., Klochkov D., Pavlov G. G., Werner K., 2014, ApJS, 210, 13
- Sun et al. (2004) Sun M., Seward F. D., Smith R. K., Slane P. O., 2004, ApJ, 605, 742
- Swartz et al. (2015) Swartz D. A., et al., 2015, ApJ, 808, 84
- Szary et al. (2017) Szary A., Gil J., Zhang B., Haberl F., Melikidze G. I., Geppert U., Mitra D., Xu R.-X., 2017, ApJ, 835, 178
- Takatsuka & Tamagaki (2004) Takatsuka T., Tamagaki R., 2004, Progress of Theoretical Physics, 112, 37
- Tanaka & Takahara (2013) Tanaka S. J., Takahara F., 2013, MNRAS, 429, 2945
- Taranto et al. (2016) Taranto G., Burgio G. F., Schulze H. J., 2016, MNRAS, 456, 1451
- Testa et al. (2018) Testa V., Mignani R. P., Rea N., Marelli M., Salvetti D., Breeveld A. A., Cusano F., Carini R., 2018, MNRAS, 473, 2000
- Tetzlaff et al. (2011) Tetzlaff N., Eisenbeiss T., Neuhäuser R., Hohle M. M., 2011, MNRAS, 417, 617
- Tetzlaff et al. (2012) Tetzlaff N., Schmidt J. G., Hohle M. M., Neuhäuser R., 2012, Publ. Astron. Soc. Australia, 29, 98
- Thorne (1977) Thorne K. S., 1977, ApJ, 212, 825
- Tian et al. (2008) Tian W. W., Leahy D. A., Haverkorn M., Jiang B., 2008, ApJ, 679, L85
- Timokhin & Arons (2013) Timokhin A. N., Arons J., 2013, MNRAS, 429, 20
- Trimble (1973) Trimble V., 1973, PASP, 85, 579
- Tsuruta (2009) Tsuruta S., 2009, in Becker W., ed., Astrophys. Space Sci. Library Vol. 357, Neutron Stars and Pulsars. pp 289–318
- Turolla (2009) Turolla R., 2009, in Becker W., ed., Astrophys. Space Sci. Library Vol. 357, Neutron Stars and Pulsars. pp 141–163
- Van Etten et al. (2008) Van Etten A., Romani R. W., Ng C. Y., 2008, ApJ, 680, 1417
- Verbiest et al. (2012) Verbiest J. P. W., Weisberg J. M., Chael A. A., Lee K. J., Lorimer D. R., 2012, ApJ, 755, 39
- Viganò et al. (2013) Viganò D., Rea N., Pons J. A., Perna R., Aguilera D. N., Miralles J. A., 2013, MNRAS, 434, 123
- Vogt et al. (2018) Vogt F. P. A., Bartlett E. S., Seitenzahl I. R., Dopita M. A., Ghavamian P., Ruiter A. J., Terry J. P., 2018, Nature Astronomy, 2, 465
- Walter et al. (1996) Walter F. M., Wolk S. J., Neuhäuser R., 1996, Nature, 379, 233
- Walter et al. (2010) Walter F. M., Eisenbeiß T., Lattimer J. M., Kim B., Hambaryan V., Neuhäuser R., 2010, ApJ, 724, 669
- Wang et al. (1997) Wang Z. R., Qu Q. Y., Chen Y., 1997, A&A, 318, L59
- Webb et al. (2019) Webb N. A., Leahy D., Guillot S., Baillot d’Etivaux N., Barret D., Guillemot L., Margueron J., Miller M. C., 2019, A&A, 627, A141
- Wei et al. (2019) Wei J. B., Burgio G. F., Schulze H. J., 2019, MNRAS, 484, 5162
- Wei et al. (2020) Wei J. B., Burgio G. F., Schulze H. J., Zappalà D., 2020, arXiv e-prints, p. arXiv:2003.08079
- Weisskopf et al. (2011) Weisskopf M. C., Tennant A. F., Yakovlev D. G., Harding A., Zavlin V. E., O’Dell S. L., Elsner R. F., Becker W., 2011, ApJ, 743, 139
- Welsh & Sallmen (2003) Welsh B. Y., Sallmen S., 2003, A&A, 408, 545
- Wijngaarden et al. (2019) Wijngaarden M. J. P., Ho W. C. G., Chang P., Heinke C. O., Page D., Beznogov M., Patnaude D. J., 2019, MNRAS, 484, 974
- Williams et al. (2018) Williams B. J., Hewitt J. W., Petre R., Temim T., 2018, ApJ, 855, 118
- Wilms et al. (2000) Wilms J., Allen A., McCray R., 2000, ApJ, 542, 914
- Xi et al. (2019) Xi L., Gaetz T. J., Plucinsky P. P., Hughes J. P., Patnaude D. J., 2019, ApJ, 874, 14
- Xu et al. (2006) Xu Y., Reid M. J., Zheng X. W., Menten K. M., 2006, Science, 311, 54
- Yakovlev & Pethick (2004) Yakovlev D. G., Pethick C. J., 2004, Annu. Rev. Astron. Astrophys., 42, 169
- Yakovlev et al. (2001) Yakovlev D. G., Kaminker A. D., Gnedin O. Y., Haensel P., 2001, Phys. Rep., 354, 1
- Yakovlev et al. (2003) Yakovlev D. G., Levenfish K. P., Haensel P., 2003, A&A, 407, 265
- Yanagi et al. (2020) Yanagi K., Nagata N., Hamaguchi K., 2020, MNRAS, 492, 5508
- Yao et al. (2017) Yao J. M., Manchester R. N., Wang N., 2017, ApJ, 835, 29
- Yar-Uyaniker et al. (2004) Yar-Uyaniker A., Uyaniker B., Kothes R., 2004, ApJ, 616, 247
- Yoneyama et al. (2017) Yoneyama T., Hayashida K., Nakajima H., Inoue S., Tsunemi H., 2017, PASJ, 69, 50
- Zampieri et al. (2001) Zampieri L., Campana S., Turolla R., Chieregato M., Falomo R., Fugazza D., Moretti A., Treves A., 2001, A&A, 378, L5
- Zane et al. (2011) Zane S., et al., 2011, MNRAS, 410, 2428
- Zavlin (2007) Zavlin V. E., 2007, ApJ, 665, L143
- Zavlin (2009) Zavlin V. E., 2009, in Becker W., ed., Astrophys. Space Sci. Library Vol. 357, Neutron Stars and Pulsars. pp 181–211
- Zavlin & Pavlov (2004) Zavlin V. E., Pavlov G. G., 2004, Mem. Soc. Astron. Ital., 75, 458
- Zavlin et al. (1996) Zavlin V. E., Pavlov G. G., Shibanov Y. A., 1996, A&A, 315, 141
- Zhu et al. (2011) Zhu W. W., Kaspi V. M., McLaughlin M. A., Pavlov G. G., Ng C. Y., Manchester R. N., Gaensler B. M., Woods P. M., 2011, ApJ, 734, 44
- Zyuzin et al. (2018) Zyuzin D. A., Karpova A. V., Shibanov Y. A., 2018, MNRAS, 476, 2177
- Zyuzin et al. (2019) Zyuzin D. A., Karpova A. V., Shibanov Y. A., Potekhin A. Y., 2019, Very cold gamma pulsar PSR J1957+5033, Report at the conference ‘High energy astrophysics today and tomorrow – HEA-19’ (Moscow, Russia, 17–20 Dec. 2019)
- Zyuzin et al. (2020b) Zyuzin D. A., Karpova A. V., Shibanov Y. A., 2020b, In preparation
- Zyuzin et al. (2020a) Zyuzin D. A., Karpova A. V., Shibanov Y. A., Potekhin A. Y., Suleimanov V. F., 2020a, Very cold gamma pulsar PSR J1957+5033, In preparation
- van Kerkwijk & Kaplan (2008) van Kerkwijk M. H., Kaplan D. L., 2008, ApJ, 673, L163
| no. | Identifier | Association | Distance | Refs. | ||
|---|---|---|---|---|---|---|
| or nickname | (s) | ( G) | (kpc) | |||
| I. Weakly magnetized thermal emitters | ||||||
| 1 | 1E 0102.27219 | B010272.3 in SMC | — | — | 1(d) | |
| 2 | RX J0822.04300 | Puppis A | 0.113 | 0.029 | 2(d) | |
| 3 | CXOU J085201.4461753 | Vela Jr. | — | — | 3(d) | |
| 4 | 2XMM J104608.7594306 | Homunculus | — | — | 4(d) | |
| 5 | 1E 1207.45209 | G296.5+10.0 | 0.424 | 0.098 | 5(t), 6(d) | |
| 6 | 1RXS J141256.0+792204 | ‘Calvera’ | 0.0592 | 0.45 | – 4 | 7–9(t,d) |
| 7 | CXOU J160103.1513353 | G330.2+1.0 | — | — | 10(d) | |
| 8 | 1WGA J1713.43949 | G347.30.5 | — | — | 11(d) | |
| 9 | XMMU J172054.5-372652 | G350.10.3 | — | — | 12(d) | |
| 10 | XMMU J173203.3344518 | HESS J1731347 | — | — | 13,14(d) | |
| 11 | CXOU J181852.0150213 | G015.9+00.2 | — | — | 15(d) | |
| 12 | CXOU J185238.6+004020 | Kes 79 | 0.105 | 0.031 | 16(d) | |
| 13 | CXOU J232327.8+584842 | Cas A | — | — | 17(d) | |
| II. Ordinary pulsars | ||||||
| 14 | PSR J0205+6449 | 3C 58 | 0.0657 | 3.6 | 18(d) | |
| 15 | PSR J0357+3205 | ‘Morla’ | 0.444 | 2.4 | 19(d) | |
| 16 | PSR J0538+2817 | Sim 147 | 0.143 | 0.73 | 20(d) | |
| 17 | CXOU J061705.3+222127 | IC 443 | 4 – 40 | 21(t), 22 – 24(d) | ||
| 18 | PSR J0633+0632 | Collinder 106 (?) | 0.297 | 4.9 | 25(t,d) | |
| 19 | PSR J0633+1746 | ‘Geminga’ | 0.237 | 1.6 | 26(d) | |
| 20 | PSR B0656+14 | Monogem Ring | 0.385 | 4.7 | 26(d) | |
| 21 | PSR B083345 | Vela | 0.0893 | 3.4 | 26(d) | |
| 22 | PSR B105552 | — | 0.197 | 1.1 | 27(d) | |
| 23 | PSR J13576429 | HESS J1356645 | 0.166 | 7.8 | 28(d) | |
| 24 | PSR B170644 | G343.102.3 | 0.102 | 3.1 | 26(d) | |
| 25 | PSR J1740+1000 | — | 0.154 | 1.8 | – 1.4 | 29(d) |
| 26 | PSR J17412054 | — | 0.414 | 2.7 | 30(d) | |
| 27 | PSR B182209 | — | 0.769 | 6.4 | 0.9 – 1.9 | 31(d) |
| 28 | PSR B182313 | — | 0.101 | 2.8 | 32(d) | |
| 29 | PSR J1836+5925 | ‘Next Geminga’ | 0.173 | 0.52 | 33,34(d) | |
| 30 | PSR B1951+32 | CTB 80 | 0.0395 | 0.49 | 35(d) | |
| 31 | PSR J1957+5033 | — | 0.375 | 1.6 | 36(t,d), 37(d) | |
| 32 | PSR J2021+3651 | — | 0.104 | 3.2 | 38(d) | |
| 33 | PSR B2334+61 | G114.3+00.3 | 0.495 | 9.9 | 39(d) | |
| III. High-B pulsars | ||||||
| 34 | PSR J07262612 | — | 3.442 | 32 | 40,41(d) | |
| 35 | PSR J11196127 | G292.200.5 | 0.408 | 41 | 42(d) | |
| 36 | PSR B150958 | — | 0.151 | 15 | 43(d) | |
| 37 | PSR J17183718 | — | 3.379 | 75 | 4.5 – 10 | 44(d) |
| 38 | PSR J18191458 | — | 4.263 | 50 | 45(d) | |
| IV. The Magnificent Seven | ||||||
| 39 | RX J0420.05022 | — | 3.453 | 9.9 | 0.325 – 0.345 | 46(t), 47(d) |
| 40 | RX J0720.43125 | — | 16.782 | 24 | 48(t), 47,49(d) | |
| 41 | RX J0806.4-4123 | — | 11.370 | 26 | 0.235 – 0.250 | 47(d) |
| 42 | RX J1308.6+2127 | — | 10.312 | 34 | 50,51(d) | |
| 43 | RX J1605.3+3249 | — | — | — | 0.09 – 0.4 | 52,53(t), 47,52–55(d) |
| 44 | RX J1856.53754 | Upper Scorpius | 7.055 | 15 | 56(t), 57(d) | |
| 45 | RX J2143.0+0654 | — | 9.428 | 200 | 0.390 – 0.430 | 58(t), 47(d) |
| V. Neutron stars with upper limits on thermal emission | ||||||
| 46 | PSR J0007+7303 | CTA 1 | 0.316 | 1.1 | 59(d) | |
| 47 | PSR B0531+21 | Crab | 0.0334 | 3.8 | 60(d) | |
| 48 | PSR B172747 | RCW 114 | 0.830 | 12 | 0.5 – 0.8 | 61,62(d) |
| 49 | PSR J2043+2740 | Cygnus Loop (?) | 0.0961 | 0.35 | 1.5–1.8 | 63,64(d) |
| 50 | PSR B2224+65 | Guitar | 0.683 | 2.6 | 65(d) | |
| VI. Middle-aged pulsars with measured thermal emission of hot spots | ||||||
| 51 | PSR B0114+58 | — | 0.101 | 0.78 | 66(d) | |
| 52 | PSR B0943+10 | — | 1.098 | 2.0 | 0.63 – 0.89 | 67(d) |
| 53 | PSR B1133+16 | — | 1.188 | 2.1 | 26(d) | |
| 54 | PSR J1154-6250 | — | 0.282 | 0.40 | 1.36 – 1.77 | 68(d) |
| 55 | PSR B1929+10 | — | 0.227 | 0.52 | 26(d) | |
| References: 1. Graczyk et al. (2014); 2. Reynoso et al. (2003); 3. Allen et al. (2015); 4. Smith (2006); 5. Halpern & Gotthelf (2015); 6. Giacani et al. (2000); 7. Halpern et al. (2013); 8. Zane et al. (2011); 9. Shibanov et al. (2016); 10. McClure-Griffiths et al. (2001); 11. Cassam-Chenaï et al. (2004); 12. This work (spectral fit); 13. Klochkov et al. (2015); 14. Maxted et al. (2018); 15. Sasaki et al. (2018); 16. Giacani et al. (2009); 17. Reed et al. (1995); 18. Kothes (2013); 19. Kirichenko et al. (2014); 20. Ng et al. (2007); 21. Swartz et al. (2015); 22. Fesen (1984); 23. Welsh & Sallmen (2003); 24. Kochanek et al. (2019); 25. Danilenko et al. (2020); 26. Verbiest et al. (2012); 27. Mignani et al. (2010); 28. Zavlin (2007); 29. Kargaltsev et al. (2012); 30. Karpova et al. (2014); 31. Hermsen et al. (2017); 32. Pavlov et al. (2008); 33. Abdo et al. (2010); 34. Arumugasamy (2015); 35. Strom & Stappers (2000); 36. Marelli et al. (2015); 37. Zyuzin et al. (2020a); 38. Kirichenko et al. (2015); 39. Yar-Uyaniker et al. (2004); 40. Speagle et al. (2011); 41. Rigoselli et al. (2019a); 42. Caswell et al. (2004); 43. Gaensler et al. (1999); 44. Zhu et al. (2011); 45. Miller et al. (2013); 46. Kaplan & van Kerkwijk (2011); 47. Posselt et al. (2007); 48. Hambaryan et al. (2017); 49. Tetzlaff et al. (2011); 50. Motch et al. (2009); 51. Hambaryan et al. (2011); 52. Pires et al. (2019); 53. Malacaria et al. (2019); 54.Motch et al. (2005); 55. Tetzlaff et al. (2012); 56. van Kerkwijk & Kaplan (2008); 57. Walter et al. (2010); 58. Kaplan & van Kerkwijk (2009); 59. Pineault et al. (1993); 60. Trimble (1973); 61. Shternin et al. (2019); 62. Zyuzin et al. (2020b); 63. Becker et al. (2004); 64. Testa et al. (2018); 65. Deller et al. (2019); 66. Rigoselli & Mereghetti (2018); 67. Rigoselli et al. (2019b); 68. Igoshev et al. (2018). | ||||||
| no. | Short | Refs. | ||||
|---|---|---|---|---|---|---|
| name | (kyr) | (kyr) | ( erg s-1) | (eV) | ||
| I. Weakly magnetized thermal emitters | ||||||
| 1 | 1E 0102 | — | 1(a), 2(s) | |||
| 2 | Puppis A NS | 3(a), 4(s) | ||||
| 3 | Vela Jr. NS | — | 2.1 – 5.4 | 5(a), 6(s) | ||
| 4 | J1046 | — | 11 – 30 | 40 – 70 | 7(a,s) | |
| 5 | 1E 1207 | 90 – 250 | 8(a), 9(s) | |||
| 6 | Calvera | — | 2 – 50 | 65 – 210 | 10,11(s) | |
| 7 | J1601 | — | 12(a), 13(s) | |||
| 8 | J1713 | — | 1.608 | 14(a), 15(s) | ||
| 9 | J1720 | — | 0.6 – 1.2 | 150 – 270 | 16(a), 15(s) | |
| 10 | J1732 | — | 2 – 6 | 17(a), 18(s) | ||
| 11 | J1818 | — | 19(a), 20(s) | |||
| 12 | Kes 79 NS | 21(a), 22(s) | ||||
| 13 | Cas A NS | — | 0.320 – 0.338 | 61 – 94 | 123 – 185 | 23(a), 24 – 26(s) |
| II. Ordinary pulsars | ||||||
| 14 | J0205 | 0.819 | 27,28(a), 15(s) | |||
| 15 | Morla | 200 – 1300 | 29(a,s) | |||
| 16 | J0538 | 30(a), 31(a,s) | ||||
| 17 | J0617 | 10 – 100 | 32(a), 33(s) | |||
| 18 | J0633 | — | 34(s) | |||
| 19 | Geminga | — | 35,36(s) | |||
| 20 | B0656 | — | 37(s) | |||
| 21 | Vela pulsar | 17 – 23 | 38(a), 39(s) | |||
| 22 | B1055 | — | 40(s) | |||
| 23 | J1357 | — | 41,42(s) | |||
| 24 | B1706 | — | 43(s) | |||
| 25 | J1740 | — | 44(s) | |||
| 26 | J1741 | — | 45(s) | |||
| 27 | B1822 | — | 46(s) | |||
| 28 | B1823 | — | 47(s) | |||
| 29 | Next Geminga | — | 48(s) | |||
| 30 | B1951 | 49(a), 50(s) | ||||
| 31 | J1957 | — | 0.012 – 0.11 | – 25 | 51(s) | |
| 32 | J2021 | — | 52(s) | |||
| 33 | B2334 | 53(a), 54(s) | ||||
| III. High-B pulsars | ||||||
| 34 | J0726 | — | 55(s) | |||
| 35 | J1119 | 4.2 – 7.1 | – 210 | 56(a), 57(s) | ||
| 36 | B1509 | — | 58(s) | |||
| 37 | J1718 | — | 57 – 200 | 59(s) | ||
| 38 | J1819 | — | 60(s) | |||
| IV. The Magnificent Seven | ||||||
| 39 | J0420 | — | 61,62(s) | |||
| 40 | J0720 | 90 – 100 | 63(a), 64,65(s) | |||
| 41 | J0806 | — | 0.16 – 0.25 | 61,62(s) | ||
| 42 | J1308 | – 90 | 66(a), 67(a,s) | |||
| 43 | J1605 | — | 0.07 – 5 | 35 – 120 | 68(a), 69,70(s) | |
| 44 | J1856 | 0.5 – 0.8 | 36 – 63 | 71(a), 72 –74(s) | ||
| 45 | J2143 | — | 0.5 – 1.7 | 40/100 | 75(s) | |
| V. Upper limits | ||||||
| 46 | J0007 | 76(a), 77(s) | ||||
| 47 | Crab pulsar | 0.954 | 78(a), 79(s) | |||
| 48 | B1727 | 80(a), 81(s) | ||||
| 49 | J2043 | — | 82 – 84(s) | |||
| 50 | Guitar pulsar | — | 85(s) | |||
| VI. Hot spots | ||||||
| 51 | B0114 | — | 86(s) | |||
| 52 | B0943 | — | 0.001 – 0.005 | 87(s) | ||
| 53 | B1133 | — | 88(s) | |||
| 54 | J1154 | — | 89(s) | |||
| 55 | B1929 | — | 90(s) | |||
| References: 1. Xi et al. (2019); 2. Hebbar et al. (2020); 3. Becker et al. (2012); 4. De Luca et al. (2012); 5. Allen et al. (2015); 6. Danilenko, A. A., et al. (2015); 7. Pires et al. (2015); 8. Roger et al. (1988); 9. Mereghetti et al. (2002); 10. Shibanov et al. (2016); 11. Bogdanov et al. (2019); 12. Borkowski et al. (2018); 13. Doroshenko et al. (2018); 14. Cassam-Chenaï et al. (2004); 15. This work; 16. Lovchinsky et al. (2011); 17. Cui et al. (2016); 18. Klochkov et al. (2015); 19. Sasaki et al. (2018); 20. Klochkov et al. (2016); 21. Sun et al. (2004); 22. Bogdanov (2014); 23. Flamsteed (1680), Ashworth (1980); 24. Heinke & Ho (2010); 25. Posselt & Pavlov (2018); 26. Wijngaarden et al. (2019); 27. Stephenson (1971); 28. Kothes (2013); 29. Kirichenko et al. (2014); 30. Kramer et al. (2003); 31. Ng et al. (2007); 32. Chevalier (1999); 33. Swartz et al. (2015); 34. Danilenko et al. (2020); 35. De Luca et al. (2005); 36. Mori et al. (2014); 37. Arumugasamy et al. (2018); 38. Aschenbach (2002); 39. Ofengeim & Zyuzin (2018); 40. Mignani et al. (2010); 41. Zavlin (2007); 42. Chang et al. (2012); 43. McGowan et al. (2004); 44. Kargaltsev et al. (2012); 45. Karpova et al. (2014); 46. Hermsen et al. (2017); 47. Pavlov et al. (2008); 48. Arumugasamy (2015); 49. Migliazzo et al. (2002); 50. Li et al. (2005); 51. Zyuzin et al. (2020a); 52. Kirichenko et al. (2015); 53. Yar-Uyaniker et al. (2004); 54. McGowan et al. (2006); 55. Rigoselli et al. (2019a); 56. Kumar et al. (2012); 57. Ng et al. (2012); 58. Hu et al. (2017); 59. Zhu et al. (2011); 60. Miller et al. (2013); 61. Haberl et al. (2004); 62. Kaplan & van Kerkwijk (2009); 63. Tetzlaff et al. (2011); 64. Hohle et al. (2012a); 65. Hambaryan et al. (2017); 66. Motch et al. (2009); 67. Hambaryan et al. (2011); 68. Tetzlaff et al. (2012); 69. Pires et al. (2019); 70. Malacaria et al. (2019); 71. Mignani et al. (2013); 72. Ho et al. (2007); 73. Sartore et al. (2012); 74. Yoneyama et al. (2017); 75. Schwope et al. (2009); 76. Martín et al. (2016); 77. Caraveo et al. (2010); 78. Stephenson & Green (2003); 79. Weisskopf et al. (2011); 80. Shternin et al. (2019); 81. Zyuzin et al. (2020b); 82. Becker et al. (2004); 83. Zavlin & Pavlov (2004); 84. Zavlin (2009); 85. Hui & Becker (2007); 86. Rigoselli & Mereghetti (2018); 87. Rigoselli et al. (2019b); 88. Szary et al. (2017); 89. Igoshev et al. (2018); 90. Misanovic et al. (2008). | ||||||